
Gupta, Alok C.; Mangalam, Arun; Wiita, Paul J.; Kushwaha ... · 4Department of Physics, The College...
12
This is an electronic reprint of the original article. This reprint may differ from the original in pagination and typographic detail. Powered by TCPDF (www.tcpdf.org) This material is protected by copyright and other intellectual property rights, and duplication or sale of all or part of any of the repository collections is not permitted, except that material may be duplicated by you for your research use or educational purposes in electronic or print form. You must obtain permission for any other use. Electronic or print copies may not be offered, whether for sale or otherwise to anyone who is not an authorised user. Gupta, Alok C.; Mangalam, Arun; Wiita, Paul J.; Kushwaha, P.; Gaur, H.; Zhang, H.; Gu, M. F.; Liao, M.; Dewangan, G. C.; Ho, L. C.; Mohan, P.; Umeura, M.; Sasada, M.; Volvach, A. E.; Agarwal, A.; Aller, M. F.; Aller, H. D.; Bachev, R.; Lähteenmäki, A.; Semkov, E.; Strigachev, A.; Tornikoski, M.; Volvach, L. N. A peculiar multiwavelength flare in the blazar 3C 454.3 Published in: Monthly Notices of the Royal Astronomical Society DOI: 10.1093/mnras/stx2072 Published: 01/11/2017 Document Version Publisher's PDF, also known as Version of record Please cite the original version: Gupta, A. C., Mangalam, A., Wiita, P. J., Kushwaha, P., Gaur, H., Zhang, H., ... Volvach, L. N. (2017). A peculiar multiwavelength flare in the blazar 3C 454.3. Monthly Notices of the Royal Astronomical Society, 472(1), 788- 798. https://doi.org/10.1093/mnras/stx2072
Transcript of Gupta, Alok C.; Mangalam, Arun; Wiita, Paul J.; Kushwaha ... · 4Department of Physics, The College...

This is an electronic reprint of the original article.This reprint may differ from the original in pagination and typographic detail.
Powered by TCPDF (www.tcpdf.org)
This material is protected by copyright and other intellectual property rights, and duplication or sale of all or part of any of the repository collections is not permitted, except that material may be duplicated by you for your research use or educational purposes in electronic or print form. You must obtain permission for any other use. Electronic or print copies may not be offered, whether for sale or otherwise to anyone who is not an authorised user.
Gupta, Alok C.; Mangalam, Arun; Wiita, Paul J.; Kushwaha, P.; Gaur, H.; Zhang, H.; Gu, M.F.; Liao, M.; Dewangan, G. C.; Ho, L. C.; Mohan, P.; Umeura, M.; Sasada, M.; Volvach, A. E.;Agarwal, A.; Aller, M. F.; Aller, H. D.; Bachev, R.; Lähteenmäki, A.; Semkov, E.; Strigachev,A.; Tornikoski, M.; Volvach, L. N.A peculiar multiwavelength flare in the blazar 3C 454.3
Published in:Monthly Notices of the Royal Astronomical Society
DOI:10.1093/mnras/stx2072
Published: 01/11/2017
Document VersionPublisher's PDF, also known as Version of record
Please cite the original version:Gupta, A. C., Mangalam, A., Wiita, P. J., Kushwaha, P., Gaur, H., Zhang, H., ... Volvach, L. N. (2017). A peculiarmultiwavelength flare in the blazar 3C 454.3. Monthly Notices of the Royal Astronomical Society, 472(1), 788-798. https://doi.org/10.1093/mnras/stx2072

MNRAS 472, 788–798 (2017) doi:10.1093/mnras/stx2072Advance Access publication 2017 August 14
A peculiar multiwavelength flare in the blazar 3C 454.3
Alok C. Gupta,1,2‹ Arun Mangalam,3 Paul J. Wiita,4,5‹ P. Kushwaha,6‹ H. Gaur,1
H. Zhang,7 M. F. Gu,1 M. Liao,1,8 G. C. Dewangan,9 L. C. Ho,10,11 P. Mohan,12
M. Umeura,13 M. Sasada,14 A. E. Volvach,15,16 A. Agarwal,2 M. F. Aller,17
H. D. Aller,17 R. Bachev,18 A. Lahteenmaki,19 E. Semkov,18
A. Strigachev,18 M. Tornikoski19 and L. N. Volvach15,161Key Laboratory for Research in Galaxies and Cosmology, Shanghai Astronomical Observatory, Chinese Academy of Sciences, Shanghai 200030, China2Aryabhatta Research Institute of Observational Sciences (ARIES), Manora Peak, Nainital 263002, India3Indian Institute of Astrophysics, Sarjapur Road, Koramangala, Bangalore 560034, India4Department of Physics, The College of New Jersey, PO Box 7718, Ewing, NJ 08628-0718, USA5Kavli Institute for Particle Astrophysics and Cosmology, SLAC, Menlo Park, CA 94025, USA6Department of Astronomy (IAG-USP), University of Sao Paulo, Sao Paulo 05508-090, Brazil7Astrophysical Institute, Department of Physics and Astronomy, Ohio University, Athens, OH 45701, USA8University of Chinese Academy of Science, 19A Yuquanlu, Beijing 100049, China9Inter University Centre for Astronomy and Astrophysics (IUCAA), Post Bag 4, Ganeshkhind, Pune 411007, India10Kavli Institute for Astronomy and Astrophysics, Peking University, Yi He Yuan Lu 5, Hai Dian District, Beijing 100871, China11Department of Astronomy, Peking University, Yi He Yuan Lu 5, Hai Dian District, Beijing 100871, China12Shanghai Astronomical Observatory, Chinese Academy of Sciences, Shanghai 200030, China13Hiroshima Astrophysical Science Center, Hiroshima University, Kagamiyama 1-3-1, Higashi-Hiroshima 739-8526, Japan14Department of Astronomy, Graduate School of Science, Kyoto University, Kitashirakawa-Oiwake-cho, Sakyo-ku, Kyoto 606-8502, Japan15Radio Astronomy Laboratory of the Crimean Astrophysical Observatory, Katsiveli, Crimea 98688, Ukraine16Taras Shevchenko National University of Kyiv, 4 Academician Glushkov Ave., 03127 Kiev, Ukraine17Astronomy Department, University of Michigan, 311 West Hall, Ann Arbor, MI 48109-1107, USA18Institute of Astronomy and National Astronomical Observatory, Bulgarian Academy of Sciences, 72 Tsarigradsko Shosse Blvd., 1784 Sofia, Bulgaria19Aalto University, Metsahovi Radio Observatory, PO Box 11000, FI-00076 Aalto, Finland
Accepted 2017 August 8. Received 2017 August 8; in original form 2017 April 20
ABSTRACTThe blazar 3C 454.3 exhibited a strong flare seen in γ -rays, X-rays and optical/near-infraredbands during 2009 December 3–12. Emission in the V and J bands rose more gradually thandid the γ -rays and soft X-rays, though all peaked at nearly the same time. Optical polarizationmeasurements showed dramatic changes during the flare, with a strong anticorrelation betweenoptical flux and degree of polarization (which rose from ∼3 to ∼20 per cent) during thedeclining phase of the flare. The flare was accompanied by large rapid swings in polarizationangle of∼170◦. This combination of behaviours appears to be unique. We have cm-band radiodata during the same period but they show no correlation with variations at higher frequencies.Such peculiar behaviour may be explained using jet models incorporating fully relativisticeffects with a dominant source region moving along a helical path or by a shock-in-jet modelincorporating three-dimensional radiation transfer if there is a dominant helical magneticfield. We find that spectral energy distributions at different times during the flare can be fitusing modified one-zone models where only the magnetic field strength and particle breakfrequencies and normalizations need change. An optical spectrum taken at nearly the sametime provides an estimate for the central black hole mass of∼2.3× 10⁹ M�. We also considertwo weaker flares seen during the ∼200 d span over which multiband data are available. Inone of them, the V and J bands appear to lead the γ -ray and X-ray bands by a few days; in theother, all variations are simultaneous.
Key words: galaxies: active –BL Lacertae objects: general – quasars: individual: 3C 454.3.
� E-mail: [email protected] (ACG); [email protected] (PJW); [email protected] (PK)
C© 2017 The AuthorsPublished by Oxford University Press on behalf of the Royal Astronomical Society
Downloaded from https://academic.oup.com/mnras/article-abstract/472/1/788/4082226/A-peculiar-multiwavelength-flare-in-the-blazar-3Cby Aalto University Library useron 19 October 2017

Multiwavelength flare in 3C 454.3 789
1 INTRODUCTION
The flat spectrum radio quasar (FSRQ) 3C 454.3 (2251+158;z = 0.859) is a bright and frequently observed blazar. It sharesthe common FSRQ properties of non-thermal emission and signif-icant variability across the entire electromagnetic spectrum alongwith substantial optical polarization (Smith et al. 1988; Healeyet al. 2007; Sasada et al. 2013, 2014). FSRQs such as 3C 454.3have spectral energy distributions (SEDs) that show the usual twobroad humps peaking at mm-infrared (IR) wavelengths and around1GeV (Urry & Padovani 1995; Sambruna, Maraschi & Urry 1996).The lower energy one is ascribed to synchrotron emission from arelativistic jet pointing near our line of sight, while the high energypeak presumably arises from inverse Compton (IC) scattering oflower energy photons off the synchrotron emitting relativistic par-ticles (e.g. Urry & Padovani 1995). The strongest constraints onemission models and the locations of emission regions in blazarscan come from analysis of broad-band SEDs as they vary in time,and any clear correlations between different bands during flaresare of particular interest. The central engine of 3C 454.3 containsa supermassive black hole (SMBH) estimated in the range 0.5–1.5 × 10⁹ M� (Woo & Urry 2002; Liu, Jiang & Gu 2006; Sbarratoet al. 2012). The flow speed down the approaching relativistic jetis probably between 0.97c and 0.999c (Jorstad et al. 2005; Hovattaet al. 2009; Raiteri et al. 2011) and the angle to our line of sight isbetween 1◦ and 6◦ (Raiteri et al. 2011; Zamaninasab et al. 2013).
Several earlier multiband observations of 3C 454.3 have beenconducted. Those including simultaneous γ -ray fluxes are of inter-est to us here, and as they must incorporate Fermi or AGILE datathey must be relatively recent. In the observations of Bonning et al.(2009) excellent correlations between IR, optical, ultraviolet (UV)and γ -ray fluxes were seen, with lags within 1 d; however, the X-rayflux then was almost non-variable and not correlated with either thehigher or lower frequency measurements. Vercellone et al. (2009)also saw correlated optical and high-energy γ -raysmeasured byAG-ILE; they had INTEGRAL and Swift X-ray measurements, thoughthe latter were again not well correlated. More complete AGILE-led multiband monitoring of 3C 454.3 over 20 months (Vercelloneet al. 2010; Raiteri et al. 2011) found nearly simultaneous flux peaksacross all bands from millimetre (mm) to γ -rays during the strongflares, with the γ –optical correlation usually having a time lag lessthan a day. Strong correlations between γ -ray and optical lightcurves (LCs) were found by Gaur, Gupta & Wiita (2012), thoughin that case, the γ -ray LC led the optical one by 4.5 ± 1.0 d. Again,the X-ray LC was essentially constant and so showed no correlationwith the other bands. Similar strong correlations were found be-tween near-infrared (NIR)–optical and γ -rays by Kushwaha et al.(2017), but with Fermi-Large Area Telescope (LAT) γ -rays laggingthe optical–NIR by ∼3 d. While in this case the X-rays showed abehaviour similar to that observed in the optical–NIR, they werenot well sampled. Strong correlated flux variability between Fermiγ -rays and 37GHz radio flares have been seen on different oc-casions (Leon-Tavares et al. 2011; Ramakrishnan et al. 2015) inthis blazar. The above studies of 3C 454.3 did not include opticalpolarization measurements.
A detailed multiband analysis of the variability of 3C 454.3 be-tween 2009 and 2011 that did include some optical spectropolarime-try (Jorstad et al. 2013) discovered similar triple flare structures foreach of three γ -ray outbursts. These correlations indicate that thelocations and mechanisms are similar for all of those flares, the firstone of which in 2009 December we revisit here with the incorpo-ration of substantial additional optical photometry and polarimetry.
Radio knots in the inner jet were associated with the first and thirdoutbursts in mm-bands (Jorstad et al. 2013) and here we also in-clude cm-band LCs. Other studies of this large flare of 3C 454.3have included X-ray data from Swift-Burst Alert Telescope (BAT),INTEGRAL-Imager on-Board the INTEGRAL Satellite (IBIS) andHEXTandoptical data from Swift-Ultraviolet andOptical Telescope(UVOT; Pacciani et al. 2010). Sasada et al. (2012) also studied thisflare with a focus on optical polarimetric variations.
We now briefly note several multiband measurements of otherblazars that incorporated optical polarimetry measurements. An-other bright FSRQ that showed a γ -ray flare in Fermi observationsduring a multiband campaign is 3C 279 (1253−055; z = 0.536);Abdo et al. (2010) noted that it was coincident with a large changeof optical polarization. In this instance the γ -ray flux peaked shortlybefore the optical and NIR fluxes and once again there were no sig-nificant simultaneous X-ray or radio variations at that time; how-ever, there was a strong X-ray flare some 2 months later that mighthave had very modest optical/NIR and γ -ray counterparts. On an-other occasion in 2011 3C 279 was in a high γ -ray activity statethat showed multiple peaks and coincided exactly with a 352◦ rota-tion of the optical polarization angle and flaring activity at opticalbands (Kiehlmann et al. 2016). The prototype BLLacertae object,BLLac, has of course also been subject to a great deal of multi-band monitoring. Marscher et al. (2008) made multiple very longbaseline interferometry (VLBI) radio maps and optical polarizationmeasurements and were able to detect a knot in the jet that appar-ently produced a double flare that emitted between optical and TeVγ -ray energies along with a radio outburst detected later. Anotherpeculiar result for BLLac was the discovery of a phase in its opticalLC where the flux strongly anticorrelated with the degree of opticalpolarization (PD) while the angle of polarization stayed essentiallyfixed (Gaur et al. 2014). Finally, we mention multiwavelength [γ -ray, optical and optical polarization, plus Very Long Baseline Array(VLBA)] variations of another bright BLLac, S5 0716+714 (Lari-onov et al. 2013). They found rapid rotation of the linear polarizationvector to coincide with a peak in both γ -ray and optical fluxes andthat a new superluminal radio knot appeared at essentially the sametime (see also Chandra et al. 2015).
In Section 2 of this paper we bring together γ -ray, X-ray, op-tical/NIR and radio flux measurements for 3C 454.3, along withoptical polarimetry, during the period ∼MJD55000–55200. Dur-ing one substantial flare an apparently unique combination of fluxand polarization changes was detected. In Section 3 we discussmodels that could produce such observations.
2 DATA AND RESULTS
2.1 Gamma-ray fluxes
The LAT on the Fermi Gamma Ray Space Telescope (hereafterFermi-LAT; Atwood et al. 2009) has been observing the γ -ray skysince its launch in 2008 June. The high sensitivity and wide fieldof view (∼2.4 sr) of Fermi-LAT means that it has revolutionizedour knowledge of the sky in its energy band that covers 20MeV–300GeV. Fermi-LAT normally operates in a scanning mode thatcovers the entire sky every 3 h.
The γ -ray LC of 3C 454.3 is shown in the top panel of Fig. 1.We extracted daily γ -ray fluxes in the 100MeV–300GeV energyrange using the standard unbinned likelihood method implementedin the PYTHON likelihood library of the Fermi science tools version10r0p5. Our analysis considers only the SOURCE class events taggedas ‘EVCLASS=128, EVTYPE=3’ under the PASS 8 instrument response
MNRAS 472, 788–798 (2017)Downloaded from https://academic.oup.com/mnras/article-abstract/472/1/788/4082226/A-peculiar-multiwavelength-flare-in-the-blazar-3Cby Aalto University Library useron 19 October 2017

790 A. C. Gupta et al.
Figure 1. In the top and second panels γ -ray and X-ray fluxes from Fermi-LAT and Swift/XRT are, respectively, presented. The third panel gives opticalposition angle (PA) while the fourth gives the optical polarization degree (PD). In the fifth panel, we give optical V band data from KANATA, SMARTS andSteward as the lower LC along with NIR J-band data from KANATA and SMARTS as the upper one. In the bottom panel radio data are given from: UMRAOat 4.8, 8.0 and 14.5GHz; CrAO at 22.2GHz and Metsahovi at 36.8GHz. Except where shown, error bars are smaller than the symbols. Solid vertical linesmark the three segments in which multiband correlations are studied and dashed vertical lines, respectively, mark the peaks of the first and second flares, thepeak of the peculiar flare (PF) and a decaying phase of PF.
function P8R2_SOURCE_V6 from a circular region of interest (ROI)15◦ centred on the source location. The Earth’s limb γ -ray back-ground was minimized by avoiding photons arriving from zenithangle of >90◦ while satellite operation and data acquisition qualitywas insured using filter ‘(DATA_QUAL>0)&&(LAT_CONFIG==1)’. Thesource model file was generated from the third Fermi-LAT catalog(3FGL – gll_psc_v16.fit; Acero et al. 2015) incorporating the Galac-tic and isotropic extragalactic γ -ray background by the respectivetemplates gll_iem_v06.fits and iso_P8R2_SOURCE_V6_v06.txt
provided by the LAT team. The effect of other sources outsidethe ROI was accounted by generating an exposure on an additionalannulus of 10◦ around it. With all these inputs the likelihood fitwas iteratively performed by removing point sources that were notcontributing at the time and thus had a test statistic (TS; Mattoxet al. 1996) <0 (Kushwaha, Singh & Sahayanathan 2014). Weused a log-parabola model for the source with all parameters be-ing free and the converged best fit was used to derive the photonflux.
MNRAS 472, 788–798 (2017)Downloaded from https://academic.oup.com/mnras/article-abstract/472/1/788/4082226/A-peculiar-multiwavelength-flare-in-the-blazar-3Cby Aalto University Library useron 19 October 2017

Multiwavelength flare in 3C 454.3 791
2.2 X-ray fluxes
Swift X-Ray Telescope (XRT) data were gathered in the pointedPhoton Counting (PC) andWindowed Timing (WT)modes.Most ofthe PC data have rates requiring pile-up correction while many WTdata show varied position angles within one observation. We, thus,used the XRT data files generated from the online tools described byEvans et al. (2009) available at the UK Swift Science Data Center.1
It corrects the products for bad pixels and columns, pile-up and fieldof view effects. Additionally, for finding the spectrum, this reduc-tion also provides count-weighted auxiliary response and responsematrix files accounting for the off-axis angle effects. The pile-upcorrections for the PC data are done by using an annular sourceextraction region of varying inner radius depending on the rate.The resulting spectrum file for each observation was then modelledwith the PHABS*POWER-LAW model in XSPEC (version 12.9.0i) with afixed neutral hydrogen column density of 1.34 × 1021 cm−2 (Villataet al. 2006). The unabsorbed flux between 0.3and10 keV was thencalculated using the CFLUX task. The resultant LC is shown in thesecond panel of Fig. 1.
2.3 Optical/NIR photometry
We obtained photometric observations of 3C 454.3 from the TripleRange Imager and SPECtrograph (TRISPEC) instrument mountedon the 1.5-m ‘KANATA’ telescope at Higashi-Hiroshima Obser-vatory. TRISPEC is able to perform simultaneous three-band (oneoptical and two NIR bands) imaging or spectroscopy along with po-larimetry (Watanabe et al. 2005; Sasada 2012). The V- and J-bandphotometric data from the KANATA telescope are presented in redand cyan symbols, respectively, in the fifth panel of Fig. 1.
We also used the publicly available SMARTS2 data where theobservations are carried out on the 1.3m telescope located at CerroTololo Inter-American Observatory with the ANovel Double Imag-ing Camera (ANDICAM) instrument. Data reduction and analysisof SMARTS data is described in Bonning et al. (2012). The V- andJ-band SMARTS data are represented by the green and magentasymbols, respectively.
Finally, we also include optical V band public archival obser-vations from Steward Observatory3 (Smith et al. 2009); these arerepresented by black symbols in the fifth panel of Fig. 1. As canbe seen in Fig. 1 there is good agreement between measurementsmade at the different telescopes during times when more than oneof these observatories obtained data.
2.4 Optical polarimetry
We obtained polarimetric observations of 3C 454.3 at the 1.5-m‘KANATA’ telescope (Sasada et al. 2012). The polarization pa-rameters are calculated from four consecutive images, which wereobtained with half-wave-plate angles of 0◦, 22.◦5, 45◦ and 67.◦5. Theinstrumental polarization was less than 0.1 per cent in the V band.These data are presented in red symbols in the third (polarizationangle, PA) and fourth (polarization degree, PD) panels of Fig. 1.
Sparser data from the Steward Observatory spectropolarimetricmonitoring project (Smith et al. 2009) were previously published(Jorstad et al. 2013) and are also shown here (with black symbols)in the third and fourth panels of Fig. 1. There is excellent agreement
1 http://www.swift.ac.uk/user_objects2 http://www.astro.yale.edu/smarts/glast/tables/3C454.tab3 http://james.as.arizona.edu/∼psmith/Fermi/DATA/Objects/
Table 1. Lag results for all the segments (in days).
Light curves 55060–55082 55082–55110 55150–55200Segment 1 Segment 2 Segment 3
γ versus XRT −0.24+0.80−0.45 −0.09+0.52
−1.80 −0.32+0.58−0.54
γ versus V −3.9+2.1−1.6 −0.2+0.4
−0.2 +0.3+4.2−1.1
γ versus J −0.87+0.29−2.11 −2.2+2.1
−1.1 +2.5+2.5−1.9
XRT versus V −5.6+2.4−0.5 +0.08+0.41
−0.47 +10.1+1.9−3.5
XRT versus J −5.4+1.8−0.6 −0.38+0.78
−0.71 +0.8+7.5−1.8
V versus J −0.02+0.20−0.20 −0.05+0.38
−0.28 −0.86+0.69−0.14
Flux versus PA for Segment 3 (55150–55200)
γ versus PA −1.0+1.2−3.2
XRT versus PA −5.6+4.1−1.1
V versus PA +0.1+1.5−0.2
J versus PA −8.3+8.5−0.8
between the polarimetric measurements during the limited periodsof overlap.
2.5 Radio observations
The 22.2GHz radio observations of 3C 454.3 were carried out withthe 22-m radio telescope (RT-22) of the Crimea Astrophysical Ob-servatory (CrAO; Volvach 2006). Modulated radiometers were usedin combination with the ‘ON–ON’ registration regime (Nesterov,Volvach & Strepka 2000). Radio observations at 36.8GHz weremade with the 14-m radio telescope (RT-14) of Aalto UniversityMetsahovi Radio Observatory in Finland. A detailed description ofthe data reduction and analysis ofMetsahovi data is given in Teraes-ranta et al. (1998). The observations and data processing techniquesare similar for both RT-22 and RT-14. The results are given in thebottom panel of Fig. 1 in blue symbols for 22.2GHz and magentasymbols for 36.8GHz frequency.
Radio observations at 14.5, 8.0 and 4.8GHz were obtainedfrom the University of Michigan Radio Astronomical Observatory(UMRAO; Aller et al. 1999, 2014) that provided well sampled radioLCs at those frequencies for ∼100 active galactic nuclei (AGNs)over time spans of ∼30 yr.
2.6 Combined multiwavelength results
We show the multiwavelength (γ -ray, X-ray, optical, NIR, radiofluxes and optical polarization data) taken during MJD54980–55220 in Fig. 1. On visual inspection, three flares are seen and wefocused our study on them.To search for cross-correlated variability,we selected three segments from the whole data presented in Fig. 1.Searching for cross-correlated variability, the discrete correlationfunctions (DCFs) were estimated using the z-transformed discretecorrelation function (ZDCF; Alexander 1997, 2013) method, ap-plicable to both uniformly and non-uniformly sampled data. Theresults for these three selected segments are reported in Table 1 andFig. 2.
2.6.1 Segment 1 (MJD55060–55082)
In Fig. 1, it is clear that there is a strong X-ray flare startingat ∼MJD55060 and peaking at ∼MJD55070 that then declinesand reached a minimum flux state at ∼MJD55082. To search for
MNRAS 472, 788–798 (2017)Downloaded from https://academic.oup.com/mnras/article-abstract/472/1/788/4082226/A-peculiar-multiwavelength-flare-in-the-blazar-3Cby Aalto University Library useron 19 October 2017

792 A. C. Gupta et al.
Figure 2. DCFs for the three segments of the multiwavelength LCs of 3C 454.3 (see Fig. 1) between γ -ray versus optical (V), X-ray and NIR (J); X-ray versusoptical (V) and NIR (J), and optical (V) versus NIR (J). The last panel shows the DCFs between LCs with PA and PD for the Segment 3. The vertical dashedline marks the zero lag between the two LCs (see Section 2.6).
multiwavelength cross-correlated variability for this flare we se-lected Segment 1 to correspond to MJD55060–55082. On visualinspection, we noticed that there is no significant activity in opticalfractional polarization and radio fluxes, so, for our examination ofmultiwavelength cross-correlated variability we only considered γ -ray, X-ray, optical and NIR fluxes. The correlated variability resultsare plotted in the top left-hand panels of Fig. 2 and in Table 1. Theresults for this segment show simultaneous variation between the
X-ray and γ -ray, and between the optical-V and NIR-J bands withpeaks at zero lag. During this period the ZDCFs suggest a lag of∼3 d between the X-ray/γ -ray and the V/J bands with V/J leading.
2.6.2 Segment 2 (MJD55082–55110)
From Fig. 1, we also notice that there are nearly simultaneousγ -ray, optical/NIR flares starting at ∼MJD55082 and peaking at
MNRAS 472, 788–798 (2017)Downloaded from https://academic.oup.com/mnras/article-abstract/472/1/788/4082226/A-peculiar-multiwavelength-flare-in-the-blazar-3Cby Aalto University Library useron 19 October 2017

Multiwavelength flare in 3C 454.3 793
MJD55092. This flare has poor temporal coverage inX-rays, thoughthere is some evidence for an essentially simultaneous flare. Thereis only modest variability in optical polarization (which could beconsidered to show three small flares during that period, with one atthe multiband peak and no evidence for changes in any of the radiofluxes. To search for multiwavelength cross-correlated variabilityfor this flare we defined Segment 2 as MJD55082–55110. Againwe only considered γ -ray, X-ray, optical and NIR fluxes in ouranalysis of multiwavelength cross-correlated variability. The resultsare plotted in the top right-hand panel of Fig. 2 and in Table 1. Theresults for Segment 2 indicate simultaneous emission, with lagsconsistent with zero for all cross-correlations.
2.6.3 Segment 3 (MJD55150–55200)
Our main focus in this paper is the strong peculiar flare (PF) no-ticed as peaking in the γ -ray and X-ray band at ∼MJD55168 anddeclining to much lower flux states by∼MJD55177 (see Fig. 1). Toinclude the entire period of the activity in these bands we selectedthe Segment 3 to span MJD55150–55200. On visual inspection,the γ -ray, X-ray, optical and NIR fluxes are strongly correlated dur-ing the flare period; however, these are anticorrelated with the PDduring the decaying period of the flare between the vertical dashedlines in Fig. 1 and the PA goes through a large rotation duringthe flare. Our DCF analyses for Segment 3 are plotted in the bot-tom panels of Fig. 2; the left-hand panels give the multiwavelengthflux correlations as discussed above, whereas the right-hand panelsshow fluxes against PA and PD. We did not use radio flux data inthe cross-correlation analysis as the only significant activity seen isa nearly monotonic rise in the 36.8GHz flux density that appearsto have begun before this flare period and to continue afterwards.The flux correlation results for this segment suggest simultaneousemission with lags consistent with zero for fluxes in γ -ray, X-rayand optical/NIR bands, at least once the gap in V and J coveragetowards the end of Segment 3 is taken into account. However, thePA/PD correlations with fluxes show significant anticorrelations forPA against all fluxes at zero lag, while the PD shows negligible cor-relations at zero lag with any of the fluxes and marginal indicationsfor (see bottom right-hand panels of Fig. 2 and the bottom portionof Table 1).
As can been seen from the summary of previous work presentedin the Introduction, the combination of such correlations has neverbeen reported for this, or any other, blazar. We note that the opti-cal/NIR flare starts earlier than do the X-ray and γ -ray flares, butthe peak fluxes in all these bands are essentially cotemporal. Theflare in X-ray and γ -ray lasts for ∼10 d, which is the nearly sameduration noticed in earlier γ -ray flares (Bonning et al. 2009; Vercel-lone et al. 2009; Gaur et al. 2012). Unless there is a rather unlikelycoincidence, in the sense that the strong X-ray variation is indepen-dent of the other bands but just happened to coincide with them,these combined LCs strongly suggest that the dominant regions foroptical through γ -ray production are cospatial. The PA rotationsare also strong during the rising phase of the flare and during thepost-flare phase, indicating that the region producing the large fluxchanges possesses a strong, dominant magnetic field direction, butone that is changing rapidly.
Unfortunately, the radio observations were rather sparse duringthe strong flare, but while our higher frequency radio LCs show slowupward trends that start before the flare and continue after it, thereis no evidence for any rapid changes in these radio bands coincidentwith the strong flare; furthermore, the lower frequency radio LCs
Table 2. SED parameters.
Epoch
(MJD)Parameter 55019– 55070 55168– 55177
55023 55169
Particle index before breaka 2.0 2.6 2.1 2.3Particle index after breakb 4.1 4.2 4.0 4.0Magnetic field (G) 1.9 3.22 1.5 2.7Equipartition fractionc 0.05 0.2 1 0.9Doppler factor 12 17 16 16Particle break energy 1114 594 706 662Logarithm of jet power (erg s−1) 45.5 47.2 46.8 46.5
Minimum particle energy 30 8 15 20
Note. Size of emission region: 5 × 1016 cm; maximum particle energy:5 × 10⁴ electron rest mass energy; torus covering factor: 0.3; IR-torus tem-perature: 1200K.aFrom X-ray.bFrom optical–NIR (except for MJD 55019–55023).cParticle energy density/magnetic energy density.
are consistent with constant fluxes throughout this period. However,the 230 and 86GHz LCs and 43GHz VLBI measurements do showcorrelations (Jorstad et al. 2013). This type of behaviour is typicalof blazar flares, where variations at cm-radio wavelengths usuallylag those at optical and mm-bands, as can be explained by standardshock-in-jet models (e.g. Hughes, Aller & Aller 1985 ; Marscher &Gear 1985 ).
2.7 Spectral energy distributions
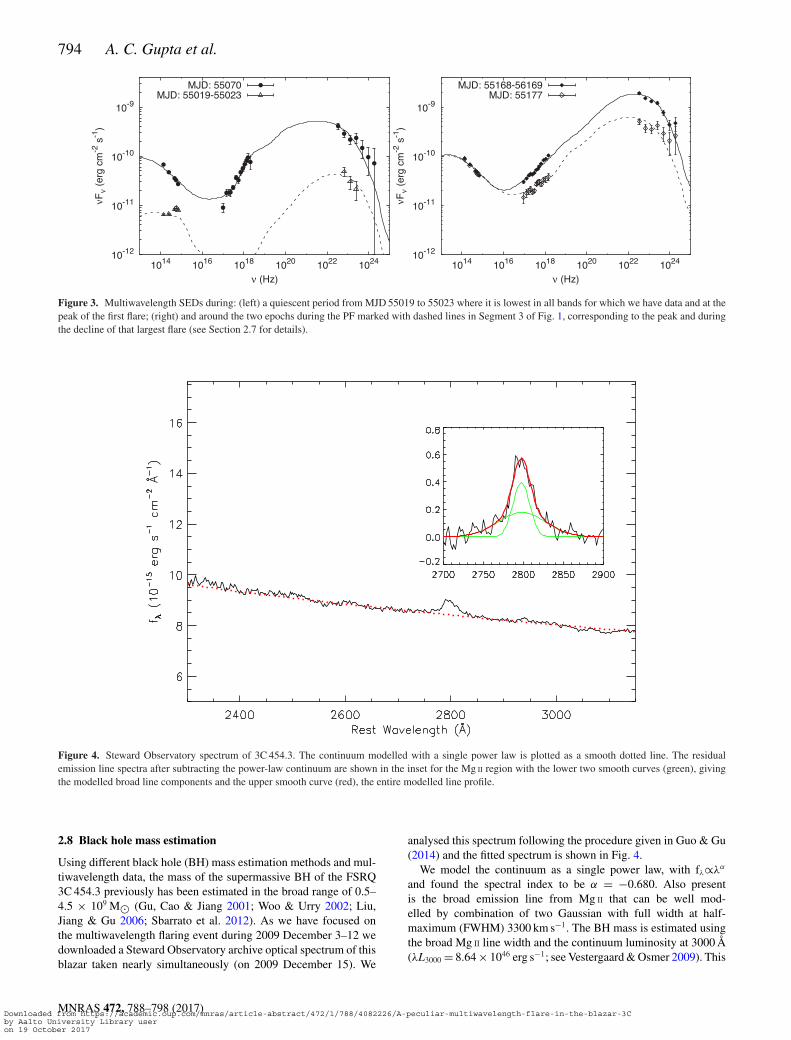
Fig. 3 shows SEDs at four epochs extracted from Fig. 1. The firstis for a quiescent state (MJD55019–55023), corresponding to thelowest brightnesses in optical–NIR along with a low γ -ray flux,although there were no X-ray data available then. The second isat the first significant rise in all bands (MJD55070). The thirdepoch, from MJD55168 to 55169, is at the peak of the PF for allof the γ -ray–NIR bands. For the final selected epoch, the SED isextracted from MJD55177, during the decaying phase of the PFwhen the high-energy bands have nearly reverted to their pre-flarelevels, whereas the optical and NIR emissions have barely begun todecay.
We model all the SEDs assuming a one-zone model with syn-chrotron and IC processes arising from a smoothed broken power-law particle spectrum with indices derived from the optical andX-ray data whenever available, following the approach of Kush-waha, Sahayanathan & Singh (2013). Those bands can be attributedto emissions from single components [synchrotron and synchrotronself-Compton (SSC), respectively] and thus directly reflect the par-ticle spectrum. In contrast, the γ -ray spectrum appears to requireinclusion of contributions from additional components: IC of thebroad line region (BLR) photons and IC of IR photons from thetorus around the central engine. During both these epochs, the fluxchanges significantly within a day in some bands, giving a rea-sonable constraint to the size of ∼1 light-day (∼5 × 1016 cm). Theresulting model fluxes are the curves plotted in Fig. 3 and the valuesof the model parameters are given in Table 2 (see Section 3 for moredetails).
MNRAS 472, 788–798 (2017)Downloaded from https://academic.oup.com/mnras/article-abstract/472/1/788/4082226/A-peculiar-multiwavelength-flare-in-the-blazar-3Cby Aalto University Library useron 19 October 2017
794 A. C. Gupta et al.
Figure 3. Multiwavelength SEDs during: (left) a quiescent period from MJD55019 to 55023 where it is lowest in all bands for which we have data and at thepeak of the first flare; (right) and around the two epochs during the PF marked with dashed lines in Segment 3 of Fig. 1, corresponding to the peak and duringthe decline of that largest flare (see Section 2.7 for details).
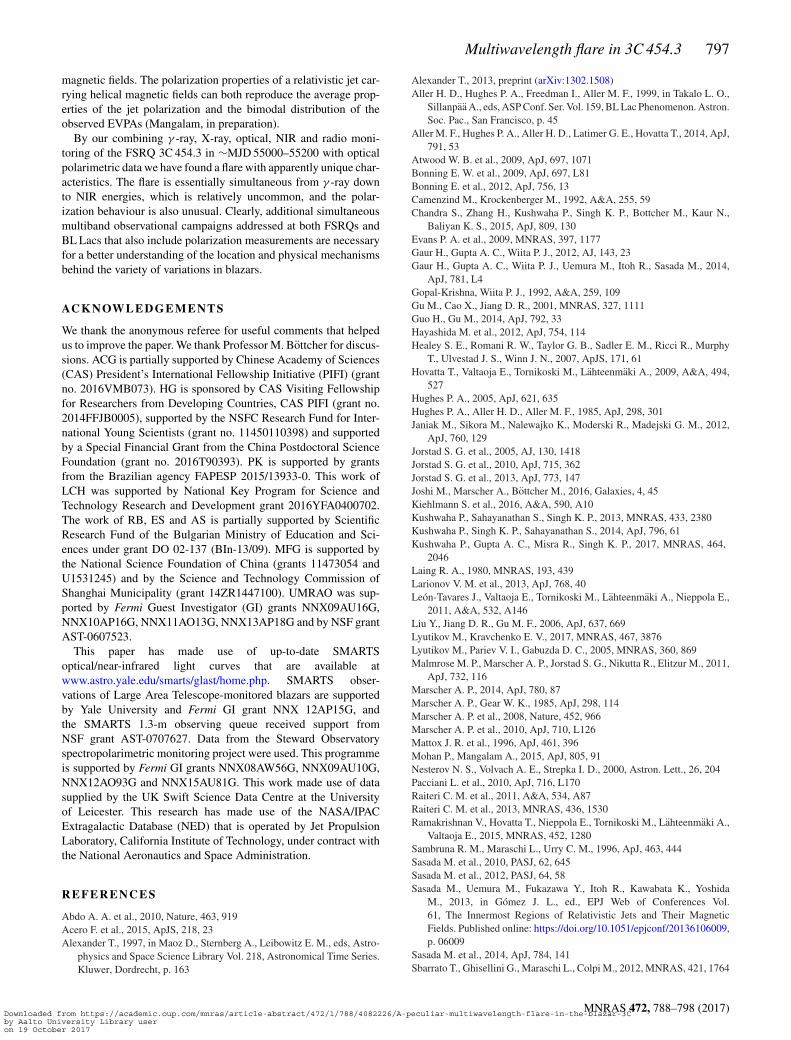
Figure 4. Steward Observatory spectrum of 3C 454.3. The continuum modelled with a single power law is plotted as a smooth dotted line. The residualemission line spectra after subtracting the power-law continuum are shown in the inset for the Mg II region with the lower two smooth curves (green), givingthe modelled broad line components and the upper smooth curve (red), the entire modelled line profile.
2.8 Black hole mass estimation
Using different black hole (BH) mass estimation methods and mul-tiwavelength data, the mass of the supermassive BH of the FSRQ3C454.3 previously has been estimated in the broad range of 0.5–4.5 × 10⁹ M� (Gu, Cao & Jiang 2001; Woo & Urry 2002; Liu,Jiang & Gu 2006; Sbarrato et al. 2012). As we have focused onthe multiwavelength flaring event during 2009 December 3–12 wedownloaded a Steward Observatory archive optical spectrum of thisblazar taken nearly simultaneously (on 2009 December 15). We
analysed this spectrum following the procedure given in Guo & Gu(2014) and the fitted spectrum is shown in Fig. 4.
We model the continuum as a single power law, with fλ∝λα
and found the spectral index to be α = −0.680. Also presentis the broad emission line from Mg II that can be well mod-elled by combination of two Gaussian with full width at half-maximum (FWHM) 3300 km s−1. The BH mass is estimated usingthe broad Mg II line width and the continuum luminosity at 3000Å(λL3000 = 8.64× 1046 erg s−1; see Vestergaard&Osmer 2009). This
MNRAS 472, 788–798 (2017)Downloaded from https://academic.oup.com/mnras/article-abstract/472/1/788/4082226/A-peculiar-multiwavelength-flare-in-the-blazar-3Cby Aalto University Library useron 19 October 2017

Multiwavelength flare in 3C 454.3 795
gives usMBH = 2.3 (± 0.5 dex)× 109 M�. OurBHmass estimate isthus in agreement with previous results given the substantial errorspresent in all these methods.
3 DISCUSSION AND CONCLUSIONS
Several competing models have been used to explain the earlierflare events seen in multiwavelength observations of blazars. Herewe will mention only some of those that have considered opticalpolarization properties to one degree or another. In most of the pre-vious observations of blazars including polarimetry (e.g. Marscheret al. 2008 , 2010; Jorstad et al. 2010 ; Sasada et al. 2010 ), a smoothrotation of the polarization angle with the rise in optical flux hasbeen noticed on long-term polarimetric observations. This can beexplained by a non-axisymmetric magnetic field distribution or acurved trajectory of the dissipation/emission pattern (e.g. Konigl &Choudhuri 1985; Marscher et al. 2008). The large swings of polar-ization can be explained by a ‘swinging jet’ model where the anglethe jet makes with our line of sight varies (e.g. Gopal-Krishna &Wiita 1992). However, in the simplest version of this model, involv-ing only Doppler factor variations, the fluxes in all bands shouldchange similarly, along with a swing in the in PA. That is not thecase here: modest changes in optical–IR fluxes are seen along withsubstantial increments in X-ray and γ -rays. If variability arises fromhelical magnetic field structures, the observed polarization can becalculated following Lyutikov, Pariev&Gabuzda (2005) andRaiteriet al. (2013).
The degree and direction of visible light polarization changeddrastically during the giant 20-d γ -ray flare in 3C 279 observedby Abdo et al. (2010). Their observations unambiguously connectthe γ -ray and visible light emission regions, showing that theyemerge from essentially the same location. They then argue that thechanging polarization properties is indicative of motion in the jet:as a blob of gas flows around a bend in the jet, for example, thechanging angle between the direction of the blob’s motion and ourline of sight can reproduce essentially the observed changes in theangle and degree of polarization. However, no explicit modellingwas carried out to quantify this scenario.
Marscher et al. (2008) very nicely modelled the variations theyobserved in BLLac during 2005–2006 by considering a shock trav-elling along a spiral path, and we now summarize their picture. Itassumes that activity originating close to the BH inserts energy intoa portion of the jet’s area. This would be seen as a knot of emissionas it propagates through both acceleration and collimation zonesand the Doppler beaming of synchrotron emission grows as theknot accelerates along its spiral path (Marscher et al. 2008). In thismodel the knot’s synchrotron output increases, producing the bulkof the emission from BLLac from the optical through γ -ray bandsuntil the disturbance exits the zone of helical path. The greatestbeaming, and hence the strongest flare, in the LC occurs during thefinal spiral, when the Lorentz factor of the jet is very high and thevelocity of the knot is closest to our line of sight. When the flaredominates the optical flux, we see the optical polarization vectorrotate. Including projection effects and relativistic aberration in themodel allows the optical PA data to be well fit and the similar PAseen at 7-mm VLBA measurements supports this picture. Owingto synchrotron self-absorption the first flare is not seen in the radioLCs. A second flare occurs when the knot crosses the radio core,which is identified with a standing shock by Marscher et al. (2008).
The relative constancy of the PA during these observations of3C 454.3 in 2009, aside from during and immediately after the ma-
jor flare, implies that the above scenario was not being observed inthis FSRQ at this time. However, recently Larinonov et al. (2013)have extended the Marscher et al. (2008) model to examine multi-wavelength variations of a major flare in the blazar S5 0716+714.They note that minor flares often both precede and follow majoroptical outbursts. They interpret this in terms of oscillating Dopplerbeaming of the emission (e.g. Camenzind & Krockenberger 1992).In the Larinonov et al. (2013) picture, the series of flares occur whenour viewing angle to the propagating shock wave is smallest. Manydifferent flux and polarization behaviours could be reproduced if thelarge number of parameters of the model are varied appropriately(Larinonov et al. 2013).
Recently, Mohan &Mangalam (2015) presented a fully relativis-tic [including gravitational redshift (GR) effects] model of vari-ability in AGN by considering synchrotron emitting blobs in helicalmotion along a funnel or cone-shaped magnetic surface anchored tothe accretion disc near the BH. The simulated LCs for the Mohan &Mangalam (2015)model include light bending, time delay and aber-ration, as well as both Doppler and gravitational shifts. They findthat the beamed intensity has a systematic phase shift with respectto that from the simpler special relativistic model of Camenzind &Krockenberger (1992). The results indicate that a realistic magneticsurface geometry in a general relativistic framework is needed to de-scribe how orbital features in the jet change the observed emission,at least in the vicinity of the BH. For these unique observations of3C 454.3, the critical results we need to explain are the systematicchanges in the PA and in the polarization fraction during the modestchange in optical–IR flux. A model along the lines of Mohan &Mangalam (2015) takes advantage of GR effects when the sourceis close to the BH and so bends, as invoked, e.g. by Abdo et al.(2010), can explain the optical PA variation. But it also exploits thehelical path to explain the PD variation (e.g. Marscher et al. 2008;Larianov et al. 2013) and so has a better chance of explaining thiscomplicated behaviour.
The overall boost factor g is given by (see Mohan & Man-galam 2015)
g = Eobs
Eem= (1 − 2M/R)1/2D = (1 − 2M/R)1/2
�(1 − β cos ξ ), (1)
where M is the BH mass, R is the distance (in mass units), D isthe Doppler factor, � the bulk Lorentz factor of the blob, while ξ
is the angle between the direction of the photon to the observerand the instantaneous velocity of the blob. The fact that the opticalflux does not seem to change much indicates the near constancy ofξ for the given viewing angle. For an appropriate choice of modelparameters, as observed fromGR simulations in a conical geometry,the LCs can flatten out (see fig. 11 in Mohan & Mangalam 2015).
We can take the blob to be equivalent to a minijet having aconstant rest-frame emission and polarization properties that is fol-lowing a bent helical path. The observed degree of polarization forsynchrotron emission coming from the region of helical magneticfields is found using P = Pmaxsin 2χ ′, where χ ′ is the viewing anglein the jet rest frame. This angle and the observed viewing angle, χ ,are related through the Lorentz transformation:
sinχ ′ = sinχ
�(1 − β cosχ ), (2)
where, as usual, � is the bulk Lorentz factor of the plasma. Notethat while the built-in GR features of this fully relativistic modelare particularly useful for time keeping, with respect to the clock ofa distant observer, of the trajectory of blobs starting from near theBH, the kinematic effects themselves are negligible when r � rg.
MNRAS 472, 788–798 (2017)Downloaded from https://academic.oup.com/mnras/article-abstract/472/1/788/4082226/A-peculiar-multiwavelength-flare-in-the-blazar-3Cby Aalto University Library useron 19 October 2017

796 A. C. Gupta et al.
As discussed in Lyutikov & Kravchenko (2017), the plane ofpolarization rotation lies in the projection of plane formed by lineof sight and the velocity field on the sky and so the PA rotation canresult from changes in magnetic field topology or Doppler boostingor a combination of these. On the other hand, the lag of γ -ray emis-sion behind the NIR–optical output, which has been observed in thissource during other episodes (e.g. Kushwaha et al. 2017), can resultfrom a steeper decline of the external radiation field as compared tothe magnetic field, as argued by Hayashida et al. (2012) and shownby Janiak et al. (2012). Further, a zero lag between X-rays andγ -rays, but both lagging with respect to the NIR–optical stronglysuggests that the X-ray emission has a substantial contribution fromthe process dominating the γ -ray band. Thus, a time-dependentmodel is required to actually understand the relative effect for boththese situations. However, SEDmodelling can still be used to under-stand the observation by exploring the relevant quantities expectedto cause such variation. In the SEDs displayed in Fig. 3 those corre-sponding to the peak and decay portions of the PF show essentiallyno change in optical–IR fluxes while X-rays and γ -rays both showsubstantial changes. At the same time, the PA rotates by 180◦. TheSED for the first flare, on the other hand, shows a substantial hard-ening at X-rays with a relatively steeper γ -ray spectrum comparedto the PF, while the quiescent SED provides some evidence for thepresence of a thermal bump in the optical–UV and displays a steeperγ -ray spectrum compared to the others.In FSRQs, within the framework of a one-zone leptonic origin of
the synchrotron emission, the explanation of γ -ray spectra requiresexternal Comptonization and can have contributions from multiplephoton fields such as the BLR and/or torus, depending on the loca-tion of the emission region along the jet. Because of contributionsfrom multiple components, the γ -rays can exhibit different spec-tra while the IR–optical region may have an essentially constantspectral slope. Further, as the IR–optical component is synchrotronemission, the observed spectrum is directly related to the relativis-tic particle spectra and in this case the IR–optical (except when athermal (accretion disc) bump contaminates this regime (as may bethe case here for the quiescent SED) and X-ray spectra can be usedto obtain the particle indices. With this, the relative contributionsof external IC from the BLR and IR regions can be determined byreproducing the γ -ray emission, if the IR temperature is known.
We wish to gain insights into the physics using a minimal num-ber of variations in the parameters that can give rise to SEDs thatare consistent with understanding the PA rotations during the PFand the observed lag during the PF, with the optical–NIR changesleading the X-ray/γ -ray ones. Hence we fixed the IR to a 1200Kblackbody with a covering fraction of 0.3 as inferred for the FSRQPKS 1222+216 (Malmrose et al. 2011). Parameters able to repro-duce the observed SEDs are given in Table 2 and the model fluxesfor them are as shown in Fig. 3. This SEDmodelling alone can onlyconstrain the magnitude of the magnetic field and not its direction(hence, not the PA). However, the only changes needed to explainthe essentially constant fluxes in the optical/IR and the very differ-ent fluxes in the X-ray and γ -ray parts of the SED involve B, theparticle normalization (which can be derived from the equipartitionfactor given in Table 2) and the particle spectrum before the break.So if there is no change to the Doppler factor, then the changein the strength and orientation of B is required to occur in such away that it does not affect the overall emission in the low-energyportion of the SED (e.g. Joshi, Marscher & Bottcher 2016) andcan also give rise to a hardening of the particle spectrum with aDoppler to bulk Lorentz factor ratio of ∼1.6. On the other hand,the SED of the first flare is dominated by the magnetic field, with
X-rays resulting from external Compton (EC), in contrast to the PFwhere the X-rays are mainly from SSC. For the quiescent SED, theNIR–optical portion is modelled as containing both synchrotron andthermal disc emission associated with the mass of SMBH derivedhere (∼2.3 × 10¹⁰ M�). However, most of the physical parametersare uncertain for the quiescent SED as substantially less data wereavailable then. Furthermore, it should be noted that the modelledthermal bump from an accretion disc is an upper limit so that itssignature is not visible in the other three flare SEDs.
An improved model for synchrotron polarization in blazars, in-volving three-dimensional radiation transfer and assuming a stan-dard shock-in-jet explanation for the flare in a jet with an origi-nally dominant helical magnetic field, recently has been developed(Zhang, Chen & Bottcher 2014, 2015). These simulations can re-produce the range of polarization behaviours seen during earlierflares without requiring either bent or helical jet trajectories (e.g.see Chandra et al. 2015).
From approximately MJD55080–55165, the PA generally staysat the same value, while the PD rises and falls. These changesin PD are coupled with some smaller flares in multiple bands aswell. These changes are likely to arise from shock compressionand acceleration. For example, Laing’s (1980) model argues thatan increase in PD is due to the shock compression of a turbulentfield (cf. Marscher 2014); however, PA variations associated withsuch a field can be erratic. In our data, especially the portion fromMJD55120 to 55130, where the PA has nearly no variation whilethe PD increases from ∼5 to ∼15 per cent, it appears that the PAvariation is not as erratic as expected from a turbulent field. So wesuggest that the background field indeed is likely to be generallydominated by the toroidal component of a helical magnetic field(Zhang, Chen & Bottcher 2014, 2015). This is also suggested in thestudy by Jorstad et al. (2013) where it was observed that the qui-escent state of 3C 454.3 during the current observation period wasassociated with the alignment of the optical polarization PA withthe jet opening angle and was interpreted in terms of a well-orderedtoroidal magnetic field.When a shock compresses the toroidal com-ponent, the PD will increase while the PA generally stays the sameand the radiation of this entire period may be from the same emis-sion region. From MJD55165 to 55185, the PA completes a 180◦
rotation, accompanied by a strong variation in PD. This is proba-bly due to some significant change in the emission region and itis very reasonable to suppose that reconnection may happen insidethe emission region. In that case the toroidal field component is dis-sipated and the reconnection strongly accelerates particles, leadingto strong flares extending up to the X-ray and γ -ray bands. Mean-while, the poloidal component becomes dominant and triggers a PArotation and PD variation. Afterward, the emission region recoversto its initial magnetic topology.
In AGN jets the electric vector position angles (EVPAs) on parsecscales tend to have polarization orthogonal to the jet in radio-loudquasars, while BLLac objects usually evince polarization along thejet (e.g. Lyutikov, Pariev & Gabuzda 2005). The basic shock mech-anism produces fields compressed in the shock plane and so fortransverse shocks it naturally yields EVPAs along the jet. However,as shocks are normally intrinsically transient events, it is difficultto see how the jet could retain its polarization orientation over ex-tensive distances. In addition, since internal shocks in relativisticjets normally are oblique (e.g. Hughes 2005), the bimodal dis-tribution of jet EVPAs between the AGN classes is unexpected.Hence, the EVPAs in BLLacs seem to be in disagreement with thebasic shock model. An alternative interpretation of the jet polar-ization, which we favour, is that the flow carries large-scale helical
MNRAS 472, 788–798 (2017)Downloaded from https://academic.oup.com/mnras/article-abstract/472/1/788/4082226/A-peculiar-multiwavelength-flare-in-the-blazar-3Cby Aalto University Library useron 19 October 2017
Multiwavelength flare in 3C 454.3 797
magnetic fields. The polarization properties of a relativistic jet car-rying helical magnetic fields can both reproduce the average prop-erties of the jet polarization and the bimodal distribution of theobserved EVPAs (Mangalam, in preparation).
By our combining γ -ray, X-ray, optical, NIR and radio moni-toring of the FSRQ 3C454.3 in ∼MJD55000–55200 with opticalpolarimetric data we have found a flare with apparently unique char-acteristics. The flare is essentially simultaneous from γ -ray downto NIR energies, which is relatively uncommon, and the polar-ization behaviour is also unusual. Clearly, additional simultaneousmultiband observational campaigns addressed at both FSRQs andBLLacs that also include polarization measurements are necessaryfor a better understanding of the location and physical mechanismsbehind the variety of variations in blazars.
ACKNOWLEDGEMENTS
We thank the anonymous referee for useful comments that helpedus to improve the paper. We thank Professor M. Bottcher for discus-sions. ACG is partially supported by Chinese Academy of Sciences(CAS) President’s International Fellowship Initiative (PIFI) (grantno. 2016VMB073). HG is sponsored by CAS Visiting Fellowshipfor Researchers from Developing Countries, CAS PIFI (grant no.2014FFJB0005), supported by the NSFC Research Fund for Inter-national Young Scientists (grant no. 11450110398) and supportedby a Special Financial Grant from the China Postdoctoral ScienceFoundation (grant no. 2016T90393). PK is supported by grantsfrom the Brazilian agency FAPESP 2015/13933-0. This work ofLCH was supported by National Key Program for Science andTechnology Research and Development grant 2016YFA0400702.The work of RB, ES and AS is partially supported by ScientificResearch Fund of the Bulgarian Ministry of Education and Sci-ences under grant DO 02-137 (BIn-13/09). MFG is supported bythe National Science Foundation of China (grants 11473054 andU1531245) and by the Science and Technology Commission ofShanghai Municipality (grant 14ZR1447100). UMRAO was sup-ported by Fermi Guest Investigator (GI) grants NNX09AU16G,NNX10AP16G, NNX11AO13G, NNX13AP18G and by NSF grantAST-0607523.
This paper has made use of up-to-date SMARTSoptical/near-infrared light curves that are available atwww.astro.yale.edu/smarts/glast/home.php. SMARTS obser-vations of Large Area Telescope-monitored blazars are supportedby Yale University and Fermi GI grant NNX 12AP15G, andthe SMARTS 1.3-m observing queue received support fromNSF grant AST-0707627. Data from the Steward Observatoryspectropolarimetric monitoring project were used. This programmeis supported by Fermi GI grants NNX08AW56G, NNX09AU10G,NNX12AO93G and NNX15AU81G. This work made use of datasupplied by the UK Swift Science Data Centre at the Universityof Leicester. This research has made use of the NASA/IPACExtragalactic Database (NED) that is operated by Jet PropulsionLaboratory, California Institute of Technology, under contract withthe National Aeronautics and Space Administration.
REFERENCES
Abdo A. A. et al., 2010, Nature, 463, 919Acero F. et al., 2015, ApJS, 218, 23Alexander T., 1997, in Maoz D., Sternberg A., Leibowitz E. M., eds, Astro-
physics and Space Science Library Vol. 218, Astronomical Time Series.Kluwer, Dordrecht, p. 163
Alexander T., 2013, preprint (arXiv:1302.1508)Aller H. D., Hughes P. A., Freedman I., Aller M. F., 1999, in Takalo L. O.,
Sillanpaa A., eds, ASPConf. Ser. Vol. 159, BLLac Phenomenon.Astron.Soc. Pac., San Francisco, p. 45
Aller M. F., Hughes P. A., Aller H. D., Latimer G. E., Hovatta T., 2014, ApJ,791, 53
Atwood W. B. et al., 2009, ApJ, 697, 1071Bonning E. W. et al., 2009, ApJ, 697, L81Bonning E. et al., 2012, ApJ, 756, 13Camenzind M., Krockenberger M., 1992, A&A, 255, 59Chandra S., Zhang H., Kushwaha P., Singh K. P., Bottcher M., Kaur N.,
Baliyan K. S., 2015, ApJ, 809, 130Evans P. A. et al., 2009, MNRAS, 397, 1177Gaur H., Gupta A. C., Wiita P. J., 2012, AJ, 143, 23Gaur H., Gupta A. C., Wiita P. J., Uemura M., Itoh R., Sasada M., 2014,
ApJ, 781, L4Gopal-Krishna, Wiita P. J., 1992, A&A, 259, 109Gu M., Cao X., Jiang D. R., 2001, MNRAS, 327, 1111Guo H., Gu M., 2014, ApJ, 792, 33Hayashida M. et al., 2012, ApJ, 754, 114Healey S. E., Romani R. W., Taylor G. B., Sadler E. M., Ricci R., Murphy
T., Ulvestad J. S., Winn J. N., 2007, ApJS, 171, 61Hovatta T., Valtaoja E., Tornikoski M., Lahteenmaki A., 2009, A&A, 494,
527Hughes P. A., 2005, ApJ, 621, 635Hughes P. A., Aller H. D., Aller M. F., 1985, ApJ, 298, 301Janiak M., Sikora M., Nalewajko K., Moderski R., Madejski G. M., 2012,
ApJ, 760, 129Jorstad S. G. et al., 2005, AJ, 130, 1418Jorstad S. G. et al., 2010, ApJ, 715, 362Jorstad S. G. et al., 2013, ApJ, 773, 147Joshi M., Marscher A., Bottcher M., 2016, Galaxies, 4, 45Kiehlmann S. et al., 2016, A&A, 590, A10Kushwaha P., Sahayanathan S., Singh K. P., 2013, MNRAS, 433, 2380Kushwaha P., Singh K. P., Sahayanathan S., 2014, ApJ, 796, 61Kushwaha P., Gupta A. C., Misra R., Singh K. P., 2017, MNRAS, 464,
2046Laing R. A., 1980, MNRAS, 193, 439Larionov V. M. et al., 2013, ApJ, 768, 40Leon-Tavares J., Valtaoja E., Tornikoski M., Lahteenmaki A., Nieppola E.,
2011, A&A, 532, A146Liu Y., Jiang D. R., Gu M. F., 2006, ApJ, 637, 669Lyutikov M., Kravchenko E. V., 2017, MNRAS, 467, 3876Lyutikov M., Pariev V. I., Gabuzda D. C., 2005, MNRAS, 360, 869Malmrose M. P., Marscher A. P., Jorstad S. G., Nikutta R., Elitzur M., 2011,
ApJ, 732, 116Marscher A. P., 2014, ApJ, 780, 87Marscher A. P., Gear W. K., 1985, ApJ, 298, 114Marscher A. P. et al., 2008, Nature, 452, 966Marscher A. P. et al., 2010, ApJ, 710, L126Mattox J. R. et al., 1996, ApJ, 461, 396Mohan P., Mangalam A., 2015, ApJ, 805, 91Nesterov N. S., Volvach A. E., Strepka I. D., 2000, Astron. Lett., 26, 204Pacciani L. et al., 2010, ApJ, 716, L170Raiteri C. M. et al., 2011, A&A, 534, A87Raiteri C. M. et al., 2013, MNRAS, 436, 1530Ramakrishnan V., Hovatta T., Nieppola E., Tornikoski M., Lahteenmaki A.,
Valtaoja E., 2015, MNRAS, 452, 1280Sambruna R. M., Maraschi L., Urry C. M., 1996, ApJ, 463, 444Sasada M. et al., 2010, PASJ, 62, 645Sasada M. et al., 2012, PASJ, 64, 58Sasada M., Uemura M., Fukazawa Y., Itoh R., Kawabata K., Yoshida
M., 2013, in Gomez J. L., ed., EPJ Web of Conferences Vol.61, The Innermost Regions of Relativistic Jets and Their MagneticFields. Published online: https://doi.org/10.1051/epjconf/20136106009,p. 06009
Sasada M. et al., 2014, ApJ, 784, 141Sbarrato T., Ghisellini G., Maraschi L., Colpi M., 2012, MNRAS, 421, 1764
MNRAS 472, 788–798 (2017)Downloaded from https://academic.oup.com/mnras/article-abstract/472/1/788/4082226/A-peculiar-multiwavelength-flare-in-the-blazar-3Cby Aalto University Library useron 19 October 2017

798 A. C. Gupta et al.
Smith P. S., Elston R., Berriman G., Allen R. G., Balonek T. J., 1988, ApJ,326, L39
Smith P. S., Montiel E., Rightley S., Turner J., Schmidt G. D., Jannuzi B. T.,2009, preprint (arXiv:0912.3621)
Teraesranta H. et al., 1998, A&AS, 132, 305Urry C. M., Padovani P., 1995, PASP, 107, 803Vercellone S. et al., 2009, ApJ, 690, 1018Vercellone S. et al., 2010, ApJ, 712, 405Vestergaard M., Osmer P. S., 2009, ApJ, 699, 800Villata M. et al., 2006, A&A, 453, 817Volvach A. E., 2006, in Gaskell C. M., McHardy I. M., Peterson B. M.,
Sergeev S. G., eds, ASP Conf. Ser. Vol. 360, AGN Variability fromX-Rays to Radio Waves. Astron. Soc. Pac., San Francisco, p. 133
Watanabe M. et al., 2005, PASP, 117, 870Woo J.-H., Urry C. M., 2002, ApJ, 579, 530ZamaninasabM., Savolainen T., Clausen-BrownE., Hovatta T., ListerM. L.,
Krichbaum T. P., Kovalev Y. Y., Pushkarev A. B., 2013, MNRAS, 436,3341
Zhang H., Chen X., Bottcher M., 2014, ApJ, 789, 66Zhang H., Chen X., Bottcher M., Guo F., Li H., 2015, ApJ, 804, 58
This paper has been typeset from a TEX/LATEX file prepared by the author.
MNRAS 472, 788–798 (2017)Downloaded from https://academic.oup.com/mnras/article-abstract/472/1/788/4082226/A-peculiar-multiwavelength-flare-in-the-blazar-3Cby Aalto University Library useron 19 October 2017