Gulf PetroLink, Bahrain GeoArabia, 2015, v. 20, no. 4, p ... · Al Huqf outcrops and subsurface...
34
183 GeoArabia, 2015, v. 20, no. 4, p. 183-216 Gulf PetroLink, Bahrain Arabian Orbital Stratigraphy revisited – AROS 2015 Moujahed I. Al-Husseini ABSTRACT ‘Arabian Orbital Stratigraphy’ (AROS) is an R&D program aimed at dating Arabia’s transgressive-regressive (T-R) depositional sequences using the ‘Orbital Scale’ of Matthews and Al-Husseini (2010). The scale consists of time-rock units named ‘orbitons’, ‘dozons’ and ‘stratons’ that are tuned by orbital-forcing of glacio- eustasy. Orbitons have durations of 14.58 million years (Myr), and are bounded by regional sequence boundaries (SB, hiatus, unconformity, disconformity, lowstand deposits). Orbiton 1 was deposited between SB 1 at 16.166 million years before present (Ma) and SB 0 (zero) at 1.586 Ma. The interval between SB 0 and the Precambrian/Cambrian Boundary (PCB) consists of 37 orbitons; at least 30 can be identified in Arabia based on published data. SB 37 is predicted at 541.046 Ma (1.586 + 37 × 14.58 Myr), and correlates to the PCB, calibrated in Oman at 541.0 Ma. An orbiton consists of 36 stratons. Stratons are T-R sequences that tracked the long-eccentricity orbital cycle (E-cycle). The age of base Straton 1 is 0.371 Ma. Their durations can range between about 300 thousand years (Kyr) and 550 Kyr, but average 405 Kyr over several million years. The Phanerozoic Era consists of 1,336 stratons that are typically referred to as 4 th -order sequences or cycle sets. Approximately 200 stratons are identified in this paper, and tentatively dated in the Orbital Scale. An orbiton also consists of three dozons, which are generally bounded by regional SBs. Dozons typically consist of 12 stratons (4.86 Myr). Examples of dozons are illustrated in this paper for the Permian–Triassic in Arabia. AROS predicts ages for Arabian and global T-R sequences that are deterministic, and they may be more accurate than those estimated by the Geological Time Scale GTS 2015. The paper proposes that the global T-R sequences should be recast in terms of stratons (E-cycles), and that stratons be used to calibrate biostratigraphy, magneto-stratigraphy and other global stratigraphic markers in future GTSs. INTRODUCTION ‘Orbital-forcing of glacio-eustasy’ is a theory that proposes variations in the Earth’s tilt (precession), obliquity and elliptical orbit around the Sun (eccentricity) cause fluctuations in the volume of ice stored on high-latitude continents, and therefore global sea level. It is more commonly known as ‘Milankovitch Theory’ (for mathematical treatment, see Berger and Loutre, 1991; Matthews et al., 1997; Laskar et al., 2004; for stratigraphic perspective and applications, see Matthews and Frohlich, 2002). The application of this theory to model Arabia’s transgressive-regressive (T-R) depositional sequences was first attempted by Matthews and Frohlich (2002). Since 2002 several studies have been published in GeoArabia to further advance this theory including the key essay “Orbital-forcing glacio-eustasy: A sequence stratigraphic Time Scale” (Matthews and Al- Husseini, 2010). The application of this ‘Orbital Scale’ continues to be tested for various stratigraphic intervals under the title of “Arabian Orbital Stratigraphy” (AROS). This paper revisits previous AROS studies, reports on new progress (Figure 1, Table 1), and outlines several directions for future studies. PREVIOUS STUDIES Matthews and Frohlich (2002) used orbital forcing to calculate variations in Antarctica’s ice sheet during the Jurassic and Cretaceous periods. The resulting glacio-eustatic curve tracked the long- Copyright Gulf PetroLink 2016. All Rights Reserved. Downloaded by [email protected] IP:41.35.128.212
Transcript of Gulf PetroLink, Bahrain GeoArabia, 2015, v. 20, no. 4, p ... · Al Huqf outcrops and subsurface...

183
GeoArabia, 2015, v. 20, no. 4, p. 183-216Gulf PetroLink, Bahrain
Arabian Orbital Stratigraphy revisited – AROS 2015
Moujahed I. Al-Husseini
ABSTRACT
‘Arabian Orbital Stratigraphy’ (AROS) is an R&D program aimed at dating Arabia’s transgressive-regressive (T-R) depositional sequences using the ‘Orbital Scale’ of Matthews and Al-Husseini (2010). The scale consists of time-rock units named ‘orbitons’, ‘dozons’ and ‘stratons’ that are tuned by orbital-forcing of glacio-eustasy. Orbitons have durations of 14.58 million years (Myr), and are bounded by regional sequence boundaries (SB, hiatus, unconformity, disconformity, lowstand deposits). Orbiton 1 was deposited between SB 1 at 16.166 million years before present (Ma) and SB 0 (zero) at 1.586 Ma. The interval between SB 0 and the Precambrian/Cambrian Boundary (PCB) consists of 37 orbitons; at least 30 can be identified in Arabia based on published data. SB 37 is predicted at 541.046 Ma (1.586 + 37 × 14.58 Myr), and correlates to the PCB, calibrated in Oman at 541.0 Ma.
An orbiton consists of 36 stratons. Stratons are T-R sequences that tracked the long-eccentricity orbital cycle (E-cycle). The age of base Straton 1 is 0.371 Ma. Their durations can range between about 300 thousand years (Kyr) and 550 Kyr, but average 405 Kyr over several million years. The Phanerozoic Era consists of 1,336 stratons that are typically referred to as 4th-order sequences or cycle sets. Approximately 200 stratons are identified in this paper, and tentatively dated in the Orbital Scale. An orbiton also consists of three dozons, which are generally bounded by regional SBs. Dozons typically consist of 12 stratons (4.86 Myr). Examples of dozons are illustrated in this paper for the Permian–Triassic in Arabia.
AROS predicts ages for Arabian and global T-R sequences that are deterministic, and they may be more accurate than those estimated by the Geological Time Scale GTS 2015. The paper proposes that the global T-R sequences should be recast in terms of stratons (E-cycles), and that stratons be used to calibrate biostratigraphy, magneto-stratigraphy and other global stratigraphic markers in future GTSs.
INTRODUCTION
‘Orbital-forcing of glacio-eustasy’ is a theory that proposes variations in the Earth’s tilt (precession), obliquity and elliptical orbit around the Sun (eccentricity) cause fluctuations in the volume of ice stored on high-latitude continents, and therefore global sea level. It is more commonly known as ‘Milankovitch Theory’ (for mathematical treatment, see Berger and Loutre, 1991; Matthews et al., 1997; Laskar et al., 2004; for stratigraphic perspective and applications, see Matthews and Frohlich, 2002). The application of this theory to model Arabia’s transgressive-regressive (T-R) depositional sequences was first attempted by Matthews and Frohlich (2002).
Since 2002 several studies have been published in GeoArabia to further advance this theory including the key essay “Orbital-forcing glacio-eustasy: A sequence stratigraphic Time Scale” (Matthews and Al-Husseini, 2010). The application of this ‘Orbital Scale’ continues to be tested for various stratigraphic intervals under the title of “Arabian Orbital Stratigraphy” (AROS). This paper revisits previous AROS studies, reports on new progress (Figure 1, Table 1), and outlines several directions for future studies.
PREVIOUS STUDIES
Matthews and Frohlich (2002) used orbital forcing to calculate variations in Antarctica’s ice sheet during the Jurassic and Cretaceous periods. The resulting glacio-eustatic curve tracked the long-
Copyright Gulf PetroLink 2016. All Rights Reserved. Downloaded by [email protected] IP:41.35.128.212

184
Al-Husseini
Figure 1: (a) Locations of orbitons identified in Arabia.
AL BASHAIR-1H1FARHA-1
CENTRALSAUDI ARABIA
(KSA)Orbitons 4–15 EAST ARABIA
Orbitons 1–4
YEMEN
OMANOrbitons 16–21,
31–38
(SOSB)
UAE
SUDAN
SYRIA IRAQOrbitons 23–25
NW KSAOrbitons 27–31
IRAN
LEBANON
Red Sea
ArabianSea
Gulf of Oman
MediterraneanSea
QATAR
BAHRAIN
KUWAIT
JORDAN
35°E 36° 37° 38° 39° 40° 41° 42° 43° 44° 45° 46° 47° 48° 49° 50° 51° 52° 53° 54° 55° 56° 57° 58°
32°
30°
28°
27°
21°
20°
19°
33°N
31°
26°
25°
24°
23°
22°
18°
N0 500
Km
Ghaba Salt Basin
SouthOman
Salt Basin
Al Jabalal-Akhdar
Arabian Shield
Al Huqf
EGYPT
Saudi Arabia (KSA)
HofufDhulaima
Dammam
Simsima
Fiqa
Natih
Nahr Umr
Upper Shu’aiba
Lower Shu’aiba
Habshan
Sahil
Rayda
Jilh
Jilh JSS-1Jilh JSS-2
Jilh JSS-3
Mahil MSS
Khuff KS6
Khuff KS5–KS1
Upper Gharif
Lower Gharif
Middle Gharif
Al Khlata
Mid-Carboniferous Hiatus
MinjurLower MafraqUpper Mafraq
Dhruma
HanifaTuwaiq Mt Lst
Jubaila
5
6
7
8
16
?
17
18
19
20
21
22
TaqaDam
Hadrukh
Upper Dammam
1
2
3
4
5
7
8
9
Lower Dammam(Qatar) Rus
Umm er Radhuma
Khanasir
Hajajah
Majma
Malihah
Buwaib
10
11
12
13
1415
Yammama
Sulaiy
Hith
Arab
Jubaila
Hanifa
Tuwaiq Mt Lst
Dhruma
Marrat
Minjur
Jilh
Sudair
Khuff
Unayzah
Huraysan
SallahKharaib
LekhwairBiyadh
Oman
Figure 1: (b) continued: Late Carboniferous–middle Permian Orbitons 21 to 19 are represented inAl Huqf outcrops and subsurface Oman (Figure 6, Enclosure II). The high-resolution sequencestratigraphy of the middle Permian to Middle Triassic Khuff and Jilh formations is documented inAl Jabal al-Akhdar, Oman (Figures 4 and 5, Enclosure II). The Late Triassic and Early Jurassicformations in Arabia are not well dated and tentatively assigned to orbitons 15 to 13. Orbitons 13to 1 are represented in either Saudi Arabia or Oman (orbitons 12 to 7, Enclosure III). The formationnames in orbitons 15 to 11 do not imply correlations between Oman and Saudi Arabia. Thesplitting of the Dammam Formation by SB 3 is documented in Qatar.
Mid-Paleozoic Hiatus
Oman
Sahmah
Hasirah
Ghudun
Barakat
Mabrouk
Barik
Al Bashair
Miqrat
Amin
Haradh
Karim
Upper AraPCB
Lower Ara
Buah
Saih Nihyada
31
33
34
541.046Ma
526.466 438.986Ma
424.406
409.826
395.246
380.666
366.086
351.506
336.926
322.346
16.166
30.746
45.326
59.906
74.486
89.066
103.646
118.226
132.806
147.386
161.966
176.546
191.126
205.706
220.286Ma
234.866
249.446
264.026
278.606
293.186
307.766Ma
497.306
482.726
468.146
453.566
438.986
511.88635
36
37
38
32
Harur
Raha
Ora
24
23
25
MidPaleozoic
Hiatus
Akkas
Khabbour
Kaista
Mid-Carboniferous Hiatus
Saudi Arabia (KSA)Iraq
Berwath
?
Jubah
Jauf
Tawil
Sharawra
Upper Qusaiba
Mid Sand
Lower Qusaiba
Uqlah
Tabuk
Qasim
24
2322
25
26
27
28
29
30
31
Figure 1: (b) Cambrian–early Silurian orbitons 37 to 31 are represented in subsurface Oman (Figure 3). The Precambrian/Cambrian Boundary (PCB) is correlated to SB 37 at base Orbiton 37 (Figure 2). The Mid-Palaeozoic Hiatus spans most of the middle Silurian to late Carboniferous in Oman. Silurian and Devonian orbitons 31 to 28 are represented in NW Saudi Arabia (Enclosure I). The Jubah Formation is not adequately dated and may be orbitons 27 to 24. Orbitons 25 to 23 are represented in northern Iraq. The Visean Raha and Berwath formations are assigned to Orbiton 23. The middle Carboniferous is represented by a hiatus in Arabia.See facing page for continuation.
ARABIAN ORBITONS 22–37
ARABIAN ORBITONS 1–22
Copyright Gulf PetroLink 2016. All Rights Reserved. Downloaded by [email protected] IP:41.35.128.212

185
Arabian Orbital Stratigraphy – AROS 2015
eccentricity orbital cycle (‘E-cycle’), which has an average duration of 405,000 years (405 Kyr, Laskar et al., 2004). They concluded that transgressive-regressive (T-R) depositional sequences will also last 405 Kyr on average, and form groups of longer-period T-R sequences that last either 2.025, 2.43 or 2.835 million years (2.43 ± 0.405 Myr). They correlated their glacio-eustatic model to Arabia’s Jurassic and Cretaceous sequences, as well as the maximum flooding surfaces (MFS) of Sharland et al. (2001).
The correlations proposed by Matthews and Frohlich (2002) were inconclusive because most Arabian sequences and MFSs cannot be accurately dated in ‘absolute time’. They are dated using local biozones, many of which can only be tentatively correlated to biostages in various, oftentimes conflicting geological time scales (GTS). Moreover, many biostages in GTSs were not clearly defined nor accurately dated in 2002. These problems became more evident when Immenhauser and Matthews (2004) attempted to correlate glacio-eustatic models to the Albian T-R sequences in Oman. They concluded that the models and GTS are not synchronized in absolute time – apparently differing by many millions of years.
In 2005, R.K. Matthews attempted to find ways to bypass the absolute time problem. He noticed that eccentricity, when computed over many tens of million years, formed semi-repeating patterns every 14 to 15 Myr. Eccentricity is the main driving force of long-period glacio-eustasy, implying that long-period sequences may also be semi-repeating. He tested various mathematical approximations to determine if the eccentricity pattern could be made to repeat exactly. By slightly rounding-off the periods of the Fourier components of the eccentricity equation of Laskar et al. (2004), he found a perfect repeating eccentricity pattern that lasts precisely 14.58 Myr. He referred to this approximation as ‘tuned eccentricity’. It predicted that a maximum sea-level drop, and therefore a major sequence boundary (SB), should occur every 14.58 Myr.
Figure 1: (a) Locations of orbitons identified in Arabia.
AL BASHAIR-1H1FARHA-1
CENTRALSAUDI ARABIA
(KSA)Orbitons 4–15 EAST ARABIA
Orbitons 1–4
YEMEN
OMANOrbitons 16–21,
31–38
(SOSB)
UAE
SUDAN
SYRIA IRAQOrbitons 23–25
NW KSAOrbitons 27–31
IRAN
LEBANON
Red Sea
ArabianSea
Gulf of Oman
MediterraneanSea
QATAR
BAHRAIN
KUWAIT
JORDAN
35°E 36° 37° 38° 39° 40° 41° 42° 43° 44° 45° 46° 47° 48° 49° 50° 51° 52° 53° 54° 55° 56° 57° 58°
32°
30°
28°
27°
21°
20°
19°
33°N
31°
26°
25°
24°
23°
22°
18°
N0 500
Km
Ghaba Salt Basin
SouthOman
Salt Basin
Al Jabalal-Akhdar
Arabian Shield
Al Huqf
EGYPT
Saudi Arabia (KSA)
HofufDhulaima
Dammam
Simsima
Fiqa
Natih
Nahr Umr
Upper Shu’aiba
Lower Shu’aiba
Habshan
Sahil
Rayda
Jilh
Jilh JSS-1Jilh JSS-2
Jilh JSS-3
Mahil MSS
Khuff KS6
Khuff KS5–KS1
Upper Gharif
Lower Gharif
Middle Gharif
Al Khlata
Mid-Carboniferous Hiatus
MinjurLower MafraqUpper Mafraq
Dhruma
HanifaTuwaiq Mt Lst
Jubaila
5
6
7
8
16
?
17
18
19
20
21
22
TaqaDam
Hadrukh
Upper Dammam
1
2
3
4
5
7
8
9
Lower Dammam(Qatar) Rus
Umm er Radhuma
Khanasir
Hajajah
Majma
Malihah
Buwaib
10
11
12
13
1415
Yammama
Sulaiy
Hith
Arab
Jubaila
Hanifa
Tuwaiq Mt Lst
Dhruma
Marrat
Minjur
Jilh
Sudair
Khuff
Unayzah
Huraysan
SallahKharaib
LekhwairBiyadh
Oman
Figure 1: (b) continued: Late Carboniferous–middle Permian Orbitons 21 to 19 are represented inAl Huqf outcrops and subsurface Oman (Figure 6, Enclosure II). The high-resolution sequencestratigraphy of the middle Permian to Middle Triassic Khuff and Jilh formations is documented inAl Jabal al-Akhdar, Oman (Figures 4 and 5, Enclosure II). The Late Triassic and Early Jurassicformations in Arabia are not well dated and tentatively assigned to orbitons 15 to 13. Orbitons 13to 1 are represented in either Saudi Arabia or Oman (orbitons 12 to 7, Enclosure III). The formationnames in orbitons 15 to 11 do not imply correlations between Oman and Saudi Arabia. Thesplitting of the Dammam Formation by SB 3 is documented in Qatar.
Mid-Paleozoic Hiatus
Oman
Sahmah
Hasirah
Ghudun
Barakat
Mabrouk
Barik
Al Bashair
Miqrat
Amin
Haradh
Karim
Upper AraPCB
Lower Ara
Buah
Saih Nihyada
31
33
34
541.046Ma
526.466 438.986Ma
424.406
409.826
395.246
380.666
366.086
351.506
336.926
322.346
16.166
30.746
45.326
59.906
74.486
89.066
103.646
118.226
132.806
147.386
161.966
176.546
191.126
205.706
220.286Ma
234.866
249.446
264.026
278.606
293.186
307.766Ma
497.306
482.726
468.146
453.566
438.986
511.88635
36
37
38
32
Harur
Raha
Ora
24
23
25
MidPaleozoic
Hiatus
Akkas
Khabbour
Kaista
Mid-Carboniferous Hiatus
Saudi Arabia (KSA)Iraq
Berwath
?
Jubah
Jauf
Tawil
Sharawra
Upper Qusaiba
Mid Sand
Lower Qusaiba
Uqlah
Tabuk
Qasim
24
2322
25
26
27
28
29
30
31
Figure 1: (b) Cambrian–early Silurian orbitons 37 to 31 are represented in subsurface Oman (Figure 3). The Precambrian/Cambrian Boundary (PCB) is correlated to SB 37 at base Orbiton 37 (Figure 2). The Mid-Palaeozoic Hiatus spans most of the middle Silurian to late Carboniferous in Oman. Silurian and Devonian orbitons 31 to 28 are represented in NW Saudi Arabia (Enclosure I). The Jubah Formation is not adequately dated and may be orbitons 27 to 24. Orbitons 25 to 23 are represented in northern Iraq. The Visean Raha and Berwath formations are assigned to Orbiton 23. The middle Carboniferous is represented by a hiatus in Arabia.See facing page for continuation.
ARABIAN ORBITONS 22–37
ARABIAN ORBITONS 1–22
Copyright Gulf PetroLink 2016. All Rights Reserved. Downloaded by [email protected] IP:41.35.128.212
186
Al-Husseini
Table 1: Arabian and Global Sequence Boundaries
37 541.046 Ara A4C Oman Cambrian, For1 541.00 major 0.046
36 526.466 Angudan Oman Cambrian, 2Ca2 523.80 medium 2.666
35 511.886 Miqrat Oman Cambrian, 4Ca1 512.43 major -0.544
34 497.306 Al Bashair Oman Paibian, Pai1 497.00 medium 0.306
33 482.726 Barakat Oman Tremadocian, Tre2 481.28 major 1.446
32 468.146 Saih Nihyada Oman Darriwilian, Dar1 466.38 major 1.766
31 453.566 Hasirah Oman Katian, Kat1 452.62 minor 0.946
SB Age(Ma) Boundary Location Global SB
Snedden and Liu (2011)Arabian Orbital Stratigraphy – AROS 2015
Age(Ma)
* Class
Difference(Myr)
0 1.586 MIS 52 Global Pleistocene, Cal2 1.54 medium 0.046
1 16.166 Hofuf KSA Burdigalian, Bur5 16.38 medium -0.214
2 30.746 Hadrukh KSA Rupelian, Rup2 32.10 minor -1.354
3 45.326 intra-Dammam Qatar Lutetian, Lut2 45.49 minor -0.164
4 59.906 UER Arabia Selandian, Sel2 59.69 major 0.216
5 74.486 Aruma KSA Campanian, Cam9 73.91 major 0.576
6 89.066 Fiqa Oman Coniacian, Co1 87.86 minor 1.206
7 103.646 Natih Oman Albian, Alb9 103.13 medium 0.516
8 118.226 intra-Shu'aiba Oman Aptian, Apt5 117.87 major 0.356
9 132.806 Biyadh KSA Hauterivian, Hau 132.89 medium -0.084
10 147.386 Sulaiy KSA Tithonian, Tit4 147.49 major -0.104
11 161.966 Hanifa KSA Oxfordian, Oxf1 161.95 medium 0.016
12 176.546 Dhruma KSA Toarcian, Toa5 175.91 medium 0.636
13 191.126 ?Marrat KSA Sinemurian, Sin5 191.32 medium -0.194
14 205.706 ?Minjur Oman Rhateian, Rha1 202.92 medium 2.786
15 220.286 Undefined Norian, Nor1 217.60 medium 2.686
16 234.866 Jilh JSS-1 Oman Carnian, Car2 233.99 medium 0.876
17 249.446 MSS Oman Olenekian, Ole1 249.86 medium -0.414
18 264.026 Khuff KS5 Oman Capitanian, Cap2 264.04 minor -0.014
19 278.606 U. Gharif Oman Kungurian, Kun1 279.33 medium -0.724
20 293.186 Gharif Oman Sakmarian, Sak7 294.15 minor -0.964
21 307.766 Al Khlata Oman Moscovian, Mos3 308.22 major -0.454
22 322.346 Hiatus Arabia Bashkirian, Bas2 322.90 major -0.554
23 336.926 Raha Iraq Visean, Vis4 336.00 medium 0.926
24 351.506 Harur Iraq Tournaisian, Tou4 349.92 medium 1.586
25 366.086 Kaista Iraq Famennian, Fam3 366.69 medium -0.604
26 380.666 Undefined Frasnian, Fra3 380.16 minor 0.506
27 395.246 Jubah KSA Emsian, Ems5 395.74 medium -0.494
28 409.826 Jauf KSA Pragian, Prg1 410.19 major -0.364
29 424.406 Tawil KSA Ludfordian, Lud2 424.66 medium -0.254
30 438.986 U. Qusaiba KSA Aeronian, Aer2 439.01 medium -0.024
31C 443.846 Uqlah KSA Rhuddanian, Rud1 443.83 major 0.016
* Adjusted to GTS 2012 (J. Ogg, 2012, written communication)The column “Difference” is orbital minus global age. Red numbers exceed 1.0 million years (Myr).
Copyright Gulf PetroLink 2016. All Rights Reserved. Downloaded by [email protected] IP:41.35.128.212

187
Arabian Orbital Stratigraphy – AROS 2015
These SBs should be separated by 36 T-R sequences that last on average 405 Kyr (Matthews and Al-Husseini, 2010).
In 2005, Al-Husseini and Matthews (2005) started searching for these long-period patterns in Arabia’s stratigraphy, but progress was hindered by several new problems. To begin with it was unclear at what age one 14.58 Myr stratigraphic pattern ends and the next one begins – what is the age of the first major sequence boundary SB 1? Two candidate ages were predicted for SB 1: 13.9 or 16.2 million years before present (Ma). In 2005 the younger one was chosen, but subsequently, based on a review of Arabia’s entire Phanerozoic stratigraphy, a better fit to regional sequence boundaries was found using SB 1 at 16.166 Ma.
The second problem was that age calibrations of stages in GTS 2004 (International Commission on Stratigraphy, ICS; Gradstein et al., 2004) typically carried uncertainties of ± 5 Myr in many periods – sometimes more. This source of uncertainty has been substantially reduced in GTS 2015 (www.stratigraphy.org) as noted throughout this paper.
The third problem, as explained above, was that the ages of many Arabian sequences and MFSs were not adequately constrained in the early 2000s. Since 2010 this source of uncertainty has been substantially reduced. In particular, the “Lexicon of Oman Subsurface Stratigraphy” (Forbes et al., 2010) now provides a comprehensive review of Oman’s Neoproterozoic–Phanerozoic stratigraphy, compiled by Petroleum Development Oman (PDO) since the 1950s. The present paper also refers to many other recent chrono- and sequence-stratigraphic studies in Arabia (Figure 1).
The other reasons for previous setbacks were caused by assuming that empirical sequences would naturally correspond to orbital ones, and that significant hiatuses do not occur in the studied sections. These assumptions are generally false. Local depositional settings will determine how global sea level is expressed in terms of relative sea level and T-R sequences. These settings include accommodation space, sediment supply, whether the deposits are evaporites, carbonates or clastics, continental or marine, as well as regional and global tectonism.
NOMENCLATURE AND CALIBRATIONS
In general, most stratigraphers do not assign orbital periods to the durations to T-R sequences (e.g. 405 Kyr, 2.43 ± 0.405 Myr). Instead empirical sequences are characterized by ‘orders’ (2nd-, 3rd-, 4th-order, etc.) or related terms (parasequence, parasequence set; cycle, cycle set, etc.). These descriptive terms imply a range of time durations rather than a specific period. For example, 3rd-order sequences are believed to have durations ranging from 0.5 to 5.0 Myr, and 4th-order sequences from 100 to 500 Kyr (Sharland et al., 2001, their table 2.2). The T-R sequence that tracks the long-eccentricity E-cycle has an average duration of 405 Kyr, but may range from about 300 to 550 Kyr. Therefore it falls between 3rd- and 4th-order empirical sequences, and its significance as a stratigraphic clock is completely missed.
In order to relate empirical and orbital sequences it became evident that the Orbital Scale required a different nomenclature than ‘orders’ and related terms. Accordingly, Matthews and Al-Husseini (2010) proposed naming the 14.58 Myr sequence the ‘orbiton’ (rather than 2nd-order), and the 405 Kyr T-R sequence, the ‘straton’ (rather than 3rd- or 4th-order). They did not name orbital sequences with shorter durations (obliquity, precession, etc.). They also recognized that the T-R sequences with durations of 2.025 Myr (short), 2.430 Myr (nominal) and 2.835 Myr (long) generally occurred in pairs that they named the ‘dozon’, typically consisting of 12 stratons and lasting 4.86 Myr.
The age calibration of the Orbital Scale is completely arithmetical. The Phanerozoic Eon/Erathum is divided into 37 equal time-rock intervals, each containing an orbiton. Orbiton 1 was deposited between SB 1 at 16.166 Ma, and SB 0 (zero) at 1.586 Ma. The age of the base of any orbiton (N) is calculated to the nearest thousand years by the formula:
Age of base Orbiton N = SB N = 1.586 + (N × 14.58) Ma
Copyright Gulf PetroLink 2016. All Rights Reserved. Downloaded by [email protected] IP:41.35.128.212

188
Al-Husseini
For example, SB 37 = 1.586 + (37 × 14.58) = 541.046 Ma, which implies it correlates to the Precambrian/Cambrian Boundary (PCB) at 541.0 ± 1.0 Ma (GTS 2015; Figures 2 and 3, Table 1).
Once the age of an SB is calculated, then the most current geological time scale (GTS 2015, www.stratigraphy.org) can be used to identify in which stage, epoch and period it occurs (Table 1). Many authors qualify the age/stage assignments of sequences by adding “early/lower, mid/middle, late/upper, latest” or “earliest” (e.g. latest Callovian). These qualifiers are helpful in narrowing the validity of the model-data age correlation, especially when the SB is dated near a stage boundary. Most authors use these qualifiers in a general sense, and so they are not capitalized in this paper.
In the Orbital Scale, the 36 stratons of an orbiton are named A-1 to A-12, B-1 to B-12, C-1 to C-12 based on their positions within the three dozons (A, B and C; see Matthews and Al-Husseini, 2010; Figure 2, Enclosures). They are also numbered according to the long-eccentricity E-cycle, and dated at their base using the 405-Kyr clock. The start of present-day E-cycle 1 (Straton 1) is 0.371 Ma, and that of any Straton M can be calculated as follows:
Age of base Straton M = 0.371 + (M-1) × 0.405 Ma
ACCURACY OF THE ORBITAL SCALE
The sea-level curve in Figure 2 was computed by R.K. Matthews using tuned eccentricity to force the volume of ice on a polar continent to fluctuate (e.g. Antarctica, Gondwana). It is one of several examples that he computed to model glacio-eustasy. It is not unique and does not apply to every orbiton, or even necessarily for the Precambrian–Cambrian Transition shown in Figure 2. The sea-level curve is correlated to the Ara Group in the South Oman Salt Basin (SOSB, Figure 1; Amthor et al., 2003, 2005; Bowring et al., 2007; Forbes et al., 2010).
The Ara Group in the SOSB is represented by cycles A0 to A6, consisting mainly of pairs of carbonates (e.g. A4C) and evaporites (e.g. A4E), which correspond to five formations (Figures 1 to 3). Bowring et al. (2007) obtained 206Pb/238U dates for ash beds from three samples across the Precambrian/Cambrian Boundary as defined by biostratigraphy (PCB, Ediacaran/Cambrian and Neoproterozoic/Phanerozoic boundaries; Amthor et al., 2003; see Forbes et al., 2010). Two samples from the Ediacaran A3 Carbonate (A3C) yielded dates of 542.90 ± 0.12 Ma (3 m above base A3C) and 542.33 ± 0.12 Ma (9 m below top A3C). A sample taken one meter above base Cambrian A4 Carbonate (A4C) was dated 541.0 ± 0.13 Ma, leading Bowring et al. (2007) to calibrate the age of the PCB at 541.0 Ma.
Amthor et al. (2005) interpreted Ara Cycle A4 (A4E and A4C, corresponding to the “U” and Athel formations) in terms of relative sea level in the SOSB (Figures 1 to 3). The cycle started after a major sea-level drop and a complete desiccation of the SOSB (ca. 542.33 Ma, Figure 2). They interpreted the carbonate platforms surrounding the SOSB to have been exposed, with the relief between the top of platforms and the basin floor possibly reaching 100s of meters. This estimate suggests that the amplitude of global sea-level fluctuations may have been many 10s of meters, possibly 100 m, during the Precambrian–Cambrian Transition (Figure 2).
Table 2: Abbreviations
ATS Astronomical Time ScaleCS cycle setE-cycle long-eccentricity orbital cycle lasting 405 Kyre-cyle short-eccentricity orbital cycle lasting approximately (ca.) 100 KyrGTS Geological Time ScaleHST highstand systems tractKyr thousand yearsLST lowstand systems tractm meterMa million years before present
MFI maximum flooding intervalMFS maximum flooding surfaceMyr million yearPCB Precambrian/Cambrian BoundaryPFM Parametric Forward ModelPSL peak sea levelSB sequence boundarySOSB South Oman Salt BasinT-R transgression-regressionTS transgressive surfaceTST transgressive systems tract
Copyright Gulf PetroLink 2016. All Rights Reserved. Downloaded by [email protected] IP:41.35.128.212

189
Arabian Orbital Stratigraphy – AROS 2015
HighLow (ca. 100 meter)Relative Sea level Stratigraphy
Orbital ScaleGTS2015 Straton Age
?
KarimFormation
A6
A4C
A5E
A5C
Doz
on 3
7AD
ozon
37B
Orb
iton
37
1,320 534.566
1,321 534.971
1,322 535.376
1,323 535.781
1,324 536.186
1,325 536.591
1,326 536.996
1,327 537.401
1,328 537.806
1,329 538.211
1,330 538.616
1,331 539.021
1,332 539.426
1,333 539.831
1,334 540.236
1,335 540.641
1,336 541.046
B-5
B-4
B-3B-2
B-1
A-12
A-11
A-10
A-9
A-8
A-7A-6
A-5
A-4
A-3
A-2A-1
SB 37
SB 37B
Huq
f Sup
ergr
oup
Nim
r Gro
up
Al N
oor a
nd D
haha
ban
Fms
“U” a
nd A
thel
For
mat
ions
PHA
NER
OZO
IC E
ON
/EO
NO
THEM
Cam
bria
n Pe
riod/
Syst
emEd
iaca
ran
Perio
d/Sy
stem
PALE
OZO
IC E
RA
/ER
ATH
EM
PCB
PREC
AM
BR
IAN
EO
N/E
ON
OTH
EM
NEO
PRO
TER
OZO
IC E
RA
/ER
ATH
EM
Fortu
nian
Sta
ge (E
arly
)
A3C
A3E
A2C
A2E
A1C
A1E
A0C
Ara
Gro
upN
afun
Gro
up
Birb
a Fo
rmat
ion
BuahFormation
Doz
on 3
8CD
ozon
38B
Orb
iton
38
C-12
C-11
RestrictionLevel
1,337 541.451
1,338 541.856
1,339 542.261
1,340 542.666
1,341 543.071
1,342 543.476
1,343 543.881
1,344 544.286
1,345 544.691
1,346 545.096
1,347 545.501
1,348 545.906
1,349 546.311
1,350 546.716
1,351 547.121
1,352 547.526
1,353 547.931
1,354 548.336
1,355 548.741
C-10
C-9C-8
C-7
C-6
C-5
C-4
C-3C-2
C-1
B-12
B-11
B-10
B-9B-8
B-7B-6
SB 38C
541.0± 0.13
541.0± 1.0
542.33± 0.12
542.90± 0.12
546.72± 0.21
A4E
ARA GROUP, SOUTH OMAN SALT BASIN
Figure 2: Model sea-level computed by R.K. Matthews based on orbital-forcing of glacio-eustasy correlated to Precambrian–Cambrian Transition in the South Oman Salt Basin (see Figure 1 for location). In the Orbital Scale the ages are for base of stratons as calibrated by the 405 Kyr long-eccentricity orbital cycle. The ages of the Ara units are 206Pb/238U dates obtained from samples of ash beds (Bowring et al., 2007).
Clastics
Evaporites
Carbonates
Copyright Gulf PetroLink 2016. All Rights Reserved. Downloaded by [email protected] IP:41.35.128.212

190
Al-Husseini
Amthor et al. (2005) concluded that the older “U” Formation was deposited after the major drop, and started with halite and potash salts deposited as a result of strong evaporitic drawdown (Ediacaran A4E, Figure 2); first in the deepest part of the desiccated basin, and later by onlap onto the exposed structural highs. The overlying “U” carbonate (Cambrian A4C) and “U” Shale represent the flooding of the basin, with the former deposited on paleohighs and the latter in the basins.
The age of SB 37 (base of Straton 1,336 = Straton 37A-1) at 541.046 Ma correlates almost precisely to the age of the PCB (541.00 ± 0.13, Bowring et al., 2007; 541.0 ± 1.0 Ma, GTS 2015), implying it coincides with the abrupt model sea-level rise predicted for Straton 37A-1 of Orbiton 37. The model is therefore consistent with the flooding that deposited the Ara A4C carbonate (Figure 2). The depositional duration of Ara A4E evaporite is about 1.33 Myr (542.33 to 541.00 Ma), suggesting it corresponds to upper Straton 1,340, and stratons 1,339, 1,338 and 1,337. In the sea-level model in Figure 2 these are predicted as lowstand stratons from upper 38C-9 to 38C-12 of Orbiton 38.
Additional correlations between stratons and Ara cycles are suggested in Figure 2. Stratons 38B-10 and 38B-11 of Dozon 38B (1,351 and 1,350, spanning 547.121–546.311 Ma) may correlate to A0C, dated in its middle part 546.72 ± 0.21 Ma (Bowring et al., 2007). The A1E evaporite may represent the closing Straton 38B-12 (1,349) of Dozon 38B. By introducing a ‘restriction limit’ to represent the level at which floodings enter the SOSB, it seems possible to correlate evaporites to lowstand stratons, and carbonate to ones with peak sea levels (PSL).
The main model-data mismatch is the difference of 575 Kyr that occurs between the dating in the lowermost part of A3C (542.90 ± 0.12 Ma) and the PSL of Straton 38C-7 (Figure 2). The two datings in A3C were made in samples from different wells (MKZ-11B and Minha-1A, Bowring et al., 2007), and it may be possible that the lower part of A3C is older in other parts of the SOSB.
The ages and lithologies of the Ara cycles are generally consistent with the glacio-eustatic model, which suggests the Orbital Scale may apply as far back as late Ediacaran, possibly even older. Moreover the correlation implies that the Cambrian Explosion followed a major glaciation caused by orbital forcing.
EXAMPLES OF ORBITONS AND DOZONS
The stage assignments of T-R sequences discussed in this paper are based on those of the original authors. Most of these examples use older GTS vintages to estimate ages (Ma). These are revised using more accurate estimates from GTS 2015 when attempting correlations to the Orbital Scale. For example, in Figure 3 the late Ediacaran–early Silurian sequences in Oman are reproduced from Forbes et al. (2010, their enclosure I, see following discussion of SBs), and as calibrated by them in GTS 2008. The other ages shown in Figure 3 are from GTS 2015 and the Orbital Scale. The candidates for orbiton SBs are very few and several are obvious hiatuses. With the exception of the Angudan Unconformity they are adequately constrained in specific stages by biostratigraphy (Forbes et al., 2010; see following discussion of SBs).
The early Cambrian Angudan Unconformity in Oman (Figure 3) can be correlated across Arabia and North Africa (Al-Husseini, 2010a). Its age is only constrained between 530 and 520 Ma (525 ± 5 Ma, see SB 36 below). Its approximate age and regional extent suggest it may correlate to SB 36 (526.446 Ma).
In several cases, where more detailed chrono- and sequence-stratigraphic analysis has been published, subdivisions of orbitons into dozons can be attempted. For example, the end of the Hirnantian Glaciation (latest Ordovician) in Gondwana was followed by the Silurian transgression (ice melt-out). The change from Ordovician glaciation to Silurian deglaciation (transgression) is documented across Gondwana, and marked by the Ordovician/Silurian Boundary dated at 443.8 ± 1.5 Ma (GTS 2015). By adding 4.86 Myr (Dozon 31C) to the age of SB 30, the age of SB 31C is 443.846 Ma, thus offering a possible correlation to the Silurian deglaciation/transgression (Figure 3, Enclosure I, Table 1).
Copyright Gulf PetroLink 2016. All Rights Reserved. Downloaded by [email protected] IP:41.35.128.212

191
Arabian Orbital Stratigraphy – AROS 2015
Period Silurian Ordovician Cambrian
'Early''Middle''Late'
Edia
cara
n
Epoc
hSt
age
Late
Edi
acar
an to
Ear
ly S
iluria
n Se
quen
ce S
trat
igra
phy
of O
man
Orb
ital
Tim
e Sc
ale
Figu
re 3
: Lat
e E
dia
cara
n–e
arly
Sil
uri
an s
equ
ence
s in
Om
an a
s ca
lib
rate
d in
the
geol
ogic
al ti
me
scal
e G
TS
200
8 b
y Fo
rbes
et a
l. (2
010,
thei
r en
clos
ure
2,
show
n i
n r
ed i
n l
eft-
sid
e co
lum
ns)
. T
he
ages
in
blu
e ar
e fr
om G
TS
201
5 (w
ww
.str
atig
rap
hy.
org)
. Th
e b
oun
dar
ies
bet
wee
n o
rbit
ons
and
doz
ons
are
alig
ned
acc
ord
ing
to G
TS
201
5. T
he
An
gud
an U
nco
nfo
rmit
y is
dat
ed b
etw
een
530
an
d 5
20 M
a, a
nd
is b
elie
ved
to c
orre
late
to S
B 3
6.
443.
7
460.
9
471.
8
488.
3
499.
0
510.
0
521.
0
542.
0
Llan
dove
ry
Late
Mid
dle
Early
Tely
chia
n
Aero
nian
Rhu
ddan
ian
Hirn
antia
n
Katia
n
Sand
bian
Dar
riwilia
n
Dap
ingi
an
Floi
an
Trem
adoc
ian
Furo
ngia
n
Epoc
h 3
Terre
neuv
ian
Epoc
h 2
GTS
201
0G
TS 2
010
GTS
201
5N
orth
Sou
thG
TS 2
015
440.
8
445.
2
453.
0
467.
3
477.
7
489.
5
494.
0
500.
550
4.5
514.
0
529.
0
438.
5
443.
8
458.
4
470.
0
485.
4
497.
0
509.
0
521.
0
541.
0
436.
043
9.0
445.
6
455.
8
468.
1
478.
6
492.
0
496.
0
503.
050
6.5
515.
0
528.
0
Age
10
Age
9Pa
ibia
nG
uzha
ngia
nD
rum
ian
Age
5
Age
4
Age
3
Age
2
Fortu
nian
?
Sahm
ah
Has
irah
Saih
Nih
ayda
Bas
eA
l Bas
hair
Miq
rat
Amin
Buah
Shur
am
Mab
rouk
Ghu
dun
Bara
kat
Doz
on 3
1C 4
.86
Myr
Barik
Mah
wis
Karim
Ara
Gro
up
Har
adh
East
ern
Flan
k
Asfa
r Seq
uenc
e
Dha
haba
n
Nim
rG
roup
Al B
asha
ir
Birb
aAl
Noo
r?
SB 3
4
SB 3
5
SB 3
6?
SB 3
7
SB 3
3
SB 3
2
SB 3
1
SB 3
0
453.
566
468.
146
482.
726
497.
306
511.
886
526.
466
541.
046
438.
986
Ma 14
.58
Myr
Orb
iton
32
Orb
iton
34
Orb
iton
35
Orb
iton
36
Orb
iton
37
Orb
iton
33
Orb
iton
3114
.58
Myr
14.5
8 M
yr
14.5
8 M
yr
14.5
8 M
yr
14.5
8 M
yr
14.5
8 M
yr
SB 3
1C44
3.84
6 M
a
Ang
udan
Unc
onfo
rmity
525
± 5
Con
glom
erat
e
Sand
ston
e
Siltst
one
Shal
e
Silic
ilyte
/Si
liceo
us s
hale
Lim
eston
e
Dol
omite
Salt
Copyright Gulf PetroLink 2016. All Rights Reserved. Downloaded by [email protected] IP:41.35.128.212

192
Al-Husseini
HIGH-RESOLUTION SEQUENCE STRATIGRAPHY
The ages of most Arabian formations and T-R sequences cannot be determined very accurately; they are based on correlations of local biozones from various regions in Arabia, to stages and ages in GTS 2015 (e.g. Figure 3). Another way to determine the ages of T-R sequences is to identify the 36 stratons within an orbiton, and then tie them to the ages of the orbiton’s SBs. This approach requires high-resolution sequence stratigraphy to confirm which T-R sequences are stratons, and if any significant hiatuses (≥ 100s Kyr) occur in the interval.
Figure 4 from Haase and Aigner (2013) illustrates an example of high-resolution sequence stratigraphy from the Permian Khuff Sequence KS4 in Wadi Bani Awf, Al Jabal al-Akhdar in Oman (Figure 1). They interpreted a 60 m-thick succession in terms of 5 cycle sets (CS-1 to CS-5 from base-up), 13 cycles (C-1 to C-13) and more than 44 mini-cycles.
In the model of Matthews and Frohlich (2002), five stratons typically form a short T-R sequence that lasts 2.025 Myr. If the five cycle sets are interpreted as stratons, then the average sediment accumulation rate for the 60 m-thick CS-1 to CS-5 section is about 30 m/Myr. Wu et al. (2013) estimated the durations of Late Permian shorter-period cycles were 107 Kyr (short-eccentricity e-cycle), 34 Kyr (obliquity) and 20.5 Kyr (precession). If the short-eccentricity e-cycles are faithfully recorded in the Bani Awf Section, and assuming their average period is 107 Kyr, then there should be 19 e-cycles (2.025/0.107) with an average thickness of about 3 m (60/19). The 19 e-cycles are interpreted by the present author in Figure 4 based on variations of the depositional settings. Eight cycles are interpreted as e-cycles, and the other five cycles are now split into 11 e-cycles.
Assuming the 19 e-cycles have average periods of 107 Kyr, then CS-1 has a duration of 535 Kyr, CS-2 and CS-5 each lasted 428 Kyr, and CS-3 and CS-4 each lasted 321 Kyr. These durations are approximately consistent with the range predicted by Matthews and Al-Husseini (2010) for stratons (285–505 Kyr), and average 406.6 Kyr. This example shows how sequence stratigraphy and the Astronomical Time Scale (ATS, Hinnov and Ogg, 2007; Wu et al., 2013) can be related, as discussed at the end of the paper.
Using mini-cycles to estimate time intervals is much more difficult, mainly because many may be missing or difficult to recognize. Assuming mini-cycles represent obliquity with an average duration of about 34 Kyr (Wu et al., 2013), then there should be about 60 obliquity cycles in this 60 m-thick section. The obliquity signal would therefore be characterized by cyclicity of about one meter. Cycle Set CS-5 is about 12 m thick and contains 10 mini-cycles ranging in thickness from 1–2 m, suggesting they approximately recorded the obliquity signal.
ORBITAL-FORCING OF GLACIO-EUSTASY AND SEQUENCE STRATIGRAPHY
The model used by Matthews and Frohlich (2002) to compute sea level is referred to as ‘Parametric Forward Model’ (PFM, see also Matthews and Al-Husseini, 2010). R.K. Matthews used tuned eccentricity and PFM to compute different sea-level curves for an entire orbiton (e.g. Figure 2). By modifying the parameters of PFM he found a wide array of sea-level curves could be described in terms of maximum-ice (lowstand, falling sea level, sequence boundary SB), and minimum-ice (transgression, peak sea level PSL, maximum flooding interval MFI containing a maximum flooding surface MFS).
Amplitude of Sea-Level Fluctuations
The amplitudes of absolute sea-level fluctuations will depend on the Earth’s ocean-atmosphere-cryosphere system in the context of astronomy and plate tectonics. In particular, the size of continents in high-latitude regions (typically latitudes between 60˚ and the poles) controls the volume of water that might be locked in ice, and therefore the amplitude of sea-level fluctuations. It is assumed that orbital-forcing of glacio-eustasy drives sequence stratigraphy so long as continents are situated in
Copyright Gulf PetroLink 2016. All Rights Reserved. Downloaded by [email protected] IP:41.35.128.212

193
Arabian Orbital Stratigraphy – AROS 2015
2
4
6
8
10
12
14
16
18
20
22
24
26
28
30
32
34
36
38
40
42
44
46
48
50
52
54
56
58
60
62
64
66
Dep
th(m
eter
s)
Bed
ding
Plan
eLi
thof
acie
sTy
peLi
thof
acie
sA
ssoc
iatio
n
CycleSetCycle
Min
i-cyc
le
Tida
l Fla
t
e-cy
cle
Low
-ene
rgy
Bac
ksho
al
Mod
erat
e-en
ergy
Bac
ksho
al
Shoa
l
Mod
erat
e-en
ergy
Fore
shoa
lDunhamTexture
MIDDLE PERMIAN LOWER KHUFF SEQUENCE KS4, WADI BANI AWF, OMAN
B G P W M
Figure 4: Sequence stratigraphy of the lower part of Middle Permian Khuff Sequence KS4 (reproduced from Haase and Aigner, 2013). Cycle sets CS-1 to CS-5 are here interpreted as stratons (average duration of 405 Kyr) with a total duration of 2.025 Myr. The present author interpreted the 19 short-eccentricity e-cycles based on depositional setting, and followed Wu et al. (2013) by assuming their average duration is 107 Kyr. This assumption implies the durations of the cycle sets range from 321–535 Kyr, and average 406.6 Kyr over the 2.025 Myr interval.
C-1319
18
17
16
15
14
13
10
6
5
4
3
2
1
7
8
9
11
12
C-12
C-11
C-10
C-9
C-8
C-7
C-6
C-5
C-4
C-3
C-2
C-1
CS-
5C
S-4
CS-
3C
S-2
CS-
1
Copyright Gulf PetroLink 2016. All Rights Reserved. Downloaded by [email protected] IP:41.35.128.212
194
Al-Husseini
high latitudes, a condition that is generally satisfied throughout the Phanerozoic and probably the Neoproterozoic eras.
Antarctica offers a quantifiable estimate for the amplitude of absolute sea-level fluctuations caused by ice sheets situated on high-latitude to polar continents. Its ice sheet today holds the equivalent of about 60 m of sea level, and during the Last Glacial Maximum, about 15,000 years ago, it held the equivalent of another 20 m (see review in Al-Husseini, 2013). So, on its own, Antarctica’s ice sheet is capable of storing a volume of ice that can cause global sea level to fluctuate by about 80 m. For comparison, the ice sheet on Greenland presently holds about 7 m of sea-level equivalent. The Late Ordovician (Hirnantian) ice sheet had a similar areal extent over Gondwana to Antarctica’s, and probably caused sea-level fluctuations of about 80–100 m.
R.K. Matthews found that by varying the PFM parameters for an ice sheet on Antarctica (essentially any high-latitude or polar continent) produced a wide variety of predictions for sea-level patterns (e.g. Figure 2). Typically it resulted in either: (1) stable ice sheets with maximum ice buildups and changes in sea-level of 25–35 m; (2) stable ice sheets with minimum ice buildups, with changes in sea level of 10–20 m; or (3) mid-sized, stable ice sheets with very pronounced lowstands between orbitons, and changes in sea level of 40–50 m. He concluded that the best match between global and model sea levels required fine-tuning the PFM parameters for each studied interval, probably lasting about 5 to 10 Myr.
Sequence Boundaries and Lowstands
By varying the parameters of PFM, R.K. Matthews found that lowstands often last one to three stratons (0.405 to 1.2 Myr) and are followed by an abrupt sea-level rise. This generally occurs in the uppermost stratons of an orbiton (C-12, C-11 and possibly all or part of C-10), and near the boundaries of dozons (A-12, B-12; Figure 2). The lowstand can be about 30–40 m below the neighboring highstands. Depending on local subsidence rates, the lowstand stratons may be altogether missing due to erosion or non-deposition (unconformity, disconformity, hiatus), or characterized by subaerial exposure, channeling, restricted evaporitic deposits (Figure 2), or other indications of a sea-level fall.
Lowstand deposits, particularly evaporites, are inconsistently positioned in traditional sequence stratigraphy. Some stratigraphers position the sequence boundary at the base of the lowstand deposits and assign them to the overlying T-R sequence. Others assign them to the closing stage of a T-R sequence. The example shown in Figure 2 illustrates how the Ara evaporite units in the Precambrian–Cambrian Transition might be assigned to specific lowstand stratons. Thick regionally extensive evaporitic units were deposited in Arabia during numerous intervals starting from the Middle Permian. They can be dated by various techniques (e.g. strontium isotope ratios) and therefore be used to identify specific lowstand stratons in the Orbital Scale.
In some cases, the closing interval of an orbiton (e.g. C-10 to C-12 in Figure 2) or dozon may be an unconformity/hiatus lasting more than a million years. Therefore the estimated age of the hiatus may differ depending on whether it is dated below or above the unconformity. The difference may be more than a million years and therefore it is important to specify the dated position in global cycle charts (e.g. Snedden and Liu, 2011; Table 1).
Dozons and Groups of Stratons
Dozons are prone to a division into a lower short T-R sequence (5 stratons: e.g. A-1 to A-5) and an upper long one (7 stratons, e.g. A-6 to A-12). In some cases they may form two nominal sequences each lasting 2.43 Myr (6 stratons, e.g. A-1 to A-6, and A-7 to A-12). These divisions are useful in recognizing dozons and their internal architecture.
Triassic Mahil Super-sequence MSSFigure 5 shows the Triassic Mahil Super-sequence MSS as interpreted by Pöppelreiter et al. (2011) in terms of 8 cycle sets and 48 cycles. If the 48 cycles recorded the ca. 100 Kyr short eccentricity e-cycle then MSS would be a ‘perfect dozon’ lasting 4.86 Myr, and correlate to Dozon 17A between
Copyright Gulf PetroLink 2016. All Rights Reserved. Downloaded by [email protected] IP:41.35.128.212

195
Arabian Orbital Stratigraphy – AROS 2015
249.446 and 244.586 Ma (Enclosure II). In this interpretation, cycle sets MCS 2.2, 2.1, 1.2 and 1.1, each containing 7 or 8 cycles, are now interpreted as ‘straton pairs’. The other four cycle sets contain 4 or 5 cycles and are interpreted as single stratons.
In the Orbital Scale, cycle sets MCS 3.1 to MCS 2.2 form a short T-R sequence (stratons 17A-1 to 17A-5 lasting 2.025 Myr). The 8 cycles of MCS 2.2 are thinner than those in older cycle sets due to reduced accommodation space and falling sea level. MCS 2.1 to MCS 1.1 form a long T-R sequence (stratons 17A-6 to 17A-12 lasting 2.835 Myr) with the main flooding interval in MCS 1.3 (Straton 17A-8), and a lesser one in upper MCS 1.2 (Straton 17A-10). In this interpretation cycles have greater thicknesses during peak sea levels (PSL; e.g. MCS 3.3, 3.2, 2.1), and become thinner during falling sea level and lowstands.
In the AROS chart (Figure 5, Enclosure II) Super-sequence MSS and its cycle sets are dated in absolute time without the benefit of any chronostratigraphic data. In the proposed calibration the 48 cycles can be used to attain an accuracy of approximately 1,000 years. As discussed in the below section on SB 17 the presented interpretations may clarify various chronostratigraphic and biostratigraphic uncertainties pertaining to the Olenekian–Anisian Transition in Arabia and GTS.
Silurian Sea LevelIdentifying dozons and how stratons may be grouped in them seems possible for the Ordovician–Silurian Transition. In Enclosure I, three interpretations of sea level and the graptolite zones for the Llandovery and Wenlock epochs (Silurian Period) are from figure 3 of Loydell (1998). They are linearly stretched so as to tie the average ages of stage boundaries in GTS 2015. The curves are highly dissimilar and the GTS calibrations carry uncertainties of ± 0.5–1.6 Myr. Nonetheless, the Orbital Scale highlights several possible correlations between the greatest sea-level drops in the curve of Loydell (1998) and the predicted positions of lowstand stratons, as follows:
• Hirnantian Glaciation to stratons 31B-10, 31B-11 and 31B-12 closing Dozon 31B,• Sedgewicki Zone lowstand to Straton 31C-12 of Dozon 31C closing Orbiton 31,• Lapworthi Zone lowstand to Straton 30A-12 closing Dozon 30A,• Nassa Zone to stratons 30B-11 and 30B-12 closing Dozon 30B.
These correlations could be confirmed if the high-resolution sequence stratigraphy of the Silurian System was described in a manner similar to Khuff Sequence KS4 (Figure 4) and Mahil Super-sequence MSS (Figure 5).
T-R sequences are traditionally divided into the ‘lowstand systems tract’ (LST), ‘transgressive systems tract’ (TST), MFI/MFS, followed by the ‘high-stand systems tract’ (HST). The present author finds some of these descriptive terms, as well others like ‘regressive systems tract’ (RST), ‘forced regression’, etc., tend to mask the orbital-forcing glacio-eustatic signal. In this paper down-pointing red triangles imply falling sea level and decreasing accommodation space, whereas blue upward-pointing triangles imply rising sea level, and increasing accommodation space.
Maximum Flooding Intervals and Surfaces
R.K. Matthews noticed that a persistent feature of the PFM is the prediction that several ‘peak sea levels” (PSL) occur in a dozon: typically in stratons 2 or 3, 4 or 5, 7 or 8, and 9 or 10 (Figure 2). The positions and number of PSLs varied depending on the model parameters that he tested. In the interpretation of Telychian sea level of Loydell (1998; Enclosure I) five graptolite zones are PSLs and they may correlate to stratons as follows: guerchi = 30A-2, turriculatus = 30A-4, sartorius = 30A-7 or 30A-8, crenulata = 30A-9, and spiralis-early lapworthi = 30A-10.
The relationship between peak sea levels (PSL) and maximum flooding intervals/surfaces (MFI/MFS) is not always clear to establish in practice. The flooding intervals of the guerchi, turriculatus and crenulata zones are significant, but they do not represent the greatest PSLs or MFI/MFS. These intervals were deposited after a sea-level drop, and possibly on an unconformity. This type of surface is sometimes referred to as a ‘transgressive unconformity’ or ‘transgressive surface (TS)’.
Copyright Gulf PetroLink 2016. All Rights Reserved. Downloaded by [email protected] IP:41.35.128.212

196
Al-Husseini
Gamma-Ray(API)
10 20 30 40
Figure 5: See facing page for caption.
Figure 5 (continued): Sequence stratigraphy of the Triassic Mahil Super-sequence MSS (reproduced from Pöppelreiter et al., 2011). The present author interprets the 48 cycles to have recorded the ca. 100 Kyr short-eccentricity e-cycles implying MSS is a ‘perfect dozon’ (Dozon 17A) consisting of stratons 616–605 or equivalently 17A-1 to 17A-12. The ages in the Orbital Scale are not based on any empirical data. They are based on the 405 Kyr clock implying an age accuracy of about 100 Kyr. A calibration using the 100 Kyr clock would imply an accuracy of about 10 Kyr. Dozons are usually manifested as a short transgressive-regressive (T-R) sequence (A-1 to A-5) lasting 2.025 Myr, and a long T-R sequence (A-6 to A-12) lasting 2.835 Ma. The MFS of the upper T-R sequence is re-positioned in MCS 1.3 based on the increased thicknesses of cycles 16–20, and as consistent with Straton A-8 generally corresponding to peak sea level (PSL).
Dep
th(m
eter
)
Rud
ston
eFl
oats
tone
Boun
dsto
neG
rain
ston
ePa
ckst
one
Wac
kest
one
Mud
ston
e
Dunham TextureOrbital Scale
Doz
onStraton(Ma)
SB 17B
SB 17
Sequ
ence
Mahil Super-sequence MSS, Saiq Plateau, Oman (Pöppelreiter et al., 2011)
Cycle(5th)
Cycleset (4th)
Sequ-ence(3rd)LF
T
GTS
201
5
10
20
30
40
50
60
70
80
90
100
110
120
130
140
150
160
170
180
190
200
210
220
230
240
250
01
23456789
101112131415
16
17
18
192021222324
25
26
2728
29303132333435363738
39
40
41
42
43
44
45
46
47
48
MS 3
MS 2
MS 1
MCS3.3
MCS3.2
MCS3.1
MCS2.2
MCS2.1
MCS1.3
MCS1.2
MCS1.1
Ole
neki
anA
nisi
an
249.466
249.041
248.636
248.231
247.826
247.421
247.016
246.611
246.206
245.801
245.396
244.991
244.586
A-6
616
615
614
613
612
611
610
609
608
607
606
605
A-1
A-2
A-3
A-4
A-5
A-7
A-8
A-9
A-10
A-11
A-12
Shor
t T-R
Seq
uenc
e (2
.025
Myr
)Lo
ng T
-R S
eque
nce
(2.8
35 M
yr)
Doz
on 1
7A
247.2
Copyright Gulf PetroLink 2016. All Rights Reserved. Downloaded by [email protected] IP:41.35.128.212

197
Arabian Orbital Stratigraphy – AROS 2015
Gamma-Ray(API)
10 20 30 40
Figure 5: See facing page for caption.
Figure 5 (continued): Sequence stratigraphy of the Triassic Mahil Super-sequence MSS (reproduced from Pöppelreiter et al., 2011). The present author interprets the 48 cycles to have recorded the ca. 100 Kyr short-eccentricity e-cycles implying MSS is a ‘perfect dozon’ (Dozon 17A) consisting of stratons 616–605 or equivalently 17A-1 to 17A-12. The ages in the Orbital Scale are not based on any empirical data. They are based on the 405 Kyr clock implying an age accuracy of about 100 Kyr. A calibration using the 100 Kyr clock would imply an accuracy of about 10 Kyr. Dozons are usually manifested as a short transgressive-regressive (T-R) sequence (A-1 to A-5) lasting 2.025 Myr, and a long T-R sequence (A-6 to A-12) lasting 2.835 Ma. The MFS of the upper T-R sequence is re-positioned in MCS 1.3 based on the increased thicknesses of cycles 16–20, and as consistent with Straton A-8 generally corresponding to peak sea level (PSL).
Dep
th(m
eter
)
Rud
ston
eFl
oats
tone
Boun
dsto
neG
rain
ston
ePa
ckst
one
Wac
kest
one
Mud
ston
e
Dunham TextureOrbital Scale
Doz
onStraton(Ma)
SB 17B
SB 17
Sequ
ence
Mahil Super-sequence MSS, Saiq Plateau, Oman (Pöppelreiter et al., 2011)
Cycle(5th)
Cycleset (4th)
Sequ-ence(3rd)LF
T
GTS
201
5
10
20
30
40
50
60
70
80
90
100
110
120
130
140
150
160
170
180
190
200
210
220
230
240
250
01
23456789
101112131415
16
17
18
192021222324
25
26
2728
29303132333435363738
39
40
41
42
43
44
45
46
47
48
MS 3
MS 2
MS 1
MCS3.3
MCS3.2
MCS3.1
MCS2.2
MCS2.1
MCS1.3
MCS1.2
MCS1.1
Ole
neki
anA
nisi
an
249.466
249.041
248.636
248.231
247.826
247.421
247.016
246.611
246.206
245.801
245.396
244.991
244.586
A-6
616
615
614
613
612
611
610
609
608
607
606
605
A-1
A-2
A-3
A-4
A-5
A-7
A-8
A-9
A-10
A-11
A-12
Shor
t T-R
Seq
uenc
e (2
.025
Myr
)Lo
ng T
-R S
eque
nce
(2.8
35 M
yr)
Doz
on 1
7A
247.2
Using the criteria that the MFI/MFS represents the most rapid increase in sea level (i.e. greatest accommodations space and deepest water) then the rise in the crispus Zone would qualify as the MFI/MFS, probably corresponding to 30A-6, with the PSL in the sartorius Zone (30A-7 and 30A-8). Another MFI/MFS should be picked in early spiralis Zone with the four sea-level fluctuations probably representing ca. 100 Kyr cycles in the PSL of Straton 30A-10. This example illustrates the advantage of identifying PSLs as stratons in a dozon, rather than attempting to select just one “major” MFI/MFS to characterize the Telychian sea level, or that of any other interval.
Stuck Glaciations
In some cases PFM testing by R.K. Matthews predicted situations where mid-sized, unstable ice sheets persisted for long periods and became ‘stuck’ in maximum-ice mode. It also predicted maximum ice sheets became ‘un-stuck’ and transitioned to minimum-ice sheets. An example of a stuck glaciation is believed to have occurred in the mid-Aptian starting at SB 8 (118.226 Ma, Enclosure III) as documented in GeoArabia Special Publication 4 (van Buchem et al., 2010) and Maurer et al. (2013). The mechanism that causes long-period stuck glaciations is not understood.
ARABIAN ORBITAL SEQUENCES
This section presents and organizes long-period Arabian sequences according to the Orbital Scale (Matthews and Al-Husseini, 2010; Figure 1, Table 1). In Arabia, several intervals are missing or not documented in the literature, requiring switches from one country to another. This framework is preliminary, and will be updated/revised as more data and interpretations become available, and shown in future AROS charts. Future studies will also focus on regional and global correlations and the internal architecture of orbitons.
SB 37: 541.046 Ma, Precambrian/Cambrian Boundary (PCB)
Base Ara AC Carbonate (A4C) Boundary, OmanThis sequence boundary was discussed above in the section on “Accuracy of the Orbital Scale” (Figures 1 and 2, Table 1). In Oman, Orbiton 37 consists of the Cambrian part of Ara Group (from base Ara A4C to top Ara Group) and probably the undated Nimr Group, consisting of the Haradh and Karim formations (Figures 1 and 3). The upper sequence boundary is believed to be Angudan Unconformity (see SB 36 below).
SB 36: 526.466 Ma, early Cambrian Period
Angudan Unconformity, OmanIn Oman, the Angudan Unconformity occurs at the base of the Amin Formation (Forbes et al., 2010; Figures 1 and 3). Al-Husseini (2010a) assigned the formation to the ‘Asfar Sequence’, which is a succession of lower Cambrian arkosic sandstones (up to several 100 m thick) that can be correlated across the Middle East. I further correlated the Angudan Unconformity to the Sub-Siq Unconformity in Saudi Arabia, Sub-Salib Unconformity in Jordan (Ram Unconformity in Powell et al., 2014, 2015)
Copyright Gulf PetroLink 2016. All Rights Reserved. Downloaded by [email protected] IP:41.35.128.212

198
Al-Husseini
and Sub-Lalun Unconformity in Iran. The unconformity is also recognized in North Africa, and has been referred to as the ‘lower Cambrian peneplain’ or ‘Afro-Arabian Peneplain’ (e.g. Stern et al., 2006; Miller et al., 2008).
The Angudan Unconformity is lower Cambrian by stratigraphic position above the Ediacaran/Cambrian Boundary in the Ara Group, radiometrically dated 541.0 Ma (see above, Figures 2 and 3). By accounting for the depositional duration of the Cambrian part of the Ara Group and overlying Nimr Group, Forbes et al. (2010) estimated the age of the unconformity at about 520 Ma (Figure 3).
In Jordan, the Angudan-correlative Ram Unconformity underlies the Salib Formation, which in turn is overlain by the middle Cambrian Burj Formation. The Burj Formation marine flooding interval is dated by biostratigraphy near the boundary between Epoch 3/Epoch 2 of the Cambrian Period (Powell et al., 2014, 2015), which has an approximate age of 509 Ma in GTS 2015 (Figure 3). In the Levant, the lower Cambrian sandstones that are coeval to the Salib Formation gave U-Pb SHRIMP detrital zircon dates of 550–530 Ma (Avigad et al., 2003; Kolodner et al., 2006). These age constraints and regional correlations imply the briefest hiatus corresponding to the Angudan Unconformity has an age between 530 and 520 Ma, or 525 ± 5 Ma, and likely to correlate to SB 36 at 526.466 Ma (Figure 3, Table 1).
Orbiton 36 is interpreted as the Asfar Sequence, above the Angudan and correlative unconformities, and base of the middle Cambrian Burj transgression (Al-Husseini, 2010a). In Oman, the Burj transgression is represented by the basal part of the Miqrat Formation. The regional correlation of the Asfar Sequence is discussed in Al-Husseini (2010a).
SB 35: 511.886 Ma, middle Cambrian Period
Base Miqrat Formation Boundary, OmanIn Oman, the boundary between the Miqrat Formation and underlying Amin Formation (Asfar Sequence) is usually sharp and a seismic onlap surface, which Droste (1997) suggests is an unconformity. The Miqrat and part-correlative Mahwis Formation are not dated by biostratigraphy and assigned to the middle Cambrian by stratigraphic position (Figure 3). Forbes et al. (2010), based on sedimentological evidence, suggest that the base of the Miqrat Formation, at least on the eastern flank of the Ghaba Salt Basin (Figure 1), may represent a short-lived marine incursion.
The marine incursion interval in the basal part of the Miqrat Formation and above the terrestrial Amin Formation (Asfar Sequence) has the same stratigraphic position as the Burj Formation marine flooding interval above the terrestrial Salib Formation (Asfar Sequence) in Jordan. The Burj Formation represents a plate-wide marine transgression that is also recognized in boreholes in NW and eastern Saudi Arabia (Al-Hajri and Owens, 2000; Al-Husseini, 2010a) and Syria (e.g. Lababidi and Hamdan, 1985). As explained above, the marine flooding of the Burj Formation in Jordan is approximately dated near the Epoch 2/Epoch 3 boundary, Cambrian, ca. 509 Ma (Powell et al., 2014, 2015).
The basal boundaries of the Burj and Miqrat formations are interpreted as a transgressive surface with an age that may be a few million years older than 509 Ma, and interpreted as correlative to SB 35 at 511.886 Ma (Figure 3, Table 1). The Miqrat Formation is assigned to Orbiton 35.
SB 34: 497.306 Ma, earliest Furongian Epoch, Cambrian Period
Base Al Bashair Formation Boundary, Oman(Forbes et al., 2010, and references therein) Above the Miqrat and part-coeval Mahwis formations, the base Al Bashair boundary is interpreted by Droste (1997) as an onlap/truncation regional unconformity and hiatus (Figures 1 and 3, Table 1). The age of the Al Bashair Formation is Furongian (late Cambrian equivalent) based on trilobites found in the Al Huqf outcrops, and palynological studies from boreholes. The base of the Furongian Series is dated ca. 497 Ma (GTS 2015), and closely correlates to SB 34 at 497.306 Ma. Orbiton 34 is interpreted as the Al Bashair, Barik and Mabrouk formations. The boundaries between the three formations are diachronous and therefore not sequence boundaries.Copyright Gulf PetroLink 2016. All Rights Reserved. Downloaded by [email protected] IP:41.35.128.212

199
Arabian Orbital Stratigraphy – AROS 2015
SB 33: 482.726 Ma, late Tremadocian Stage, Early Ordovician Epoch
Base Barakat Formation Boundary, OmanThis boundary is interpreted by Droste (1997) as a regional unconformity, characterized as a possible low-angle truncation surface of the underlying units, and a hiatus. He interprets the marine deposits of the Barakat Formation as an extensive transgression that extended over north and south Oman (Figures 1 and 3). Booth (2009, in Forbes et al., 2010) reported that the age of the Barakat Formation is constrained by the occurrence of late Tremadocian acritarchs. The Tremadocian spans 485.4 ± 1.9 to 477.7 ± 1.4 Ma (GTS 2015), and SB 33 at 482.726 Ma falls near the middle of this stage (Table 1). The Barakat and Ghudun formations are assigned to Orbiton 33. The boundary between the two formations is a sequence boundary and correlated to SB 33C (see SB 33C below).
SB 33C: 477.866 Ma, earliest Floian Epoch, Cambrian Period
Base Ghudun Formation Boundary, OmanAccording to Forbes et al. (2010) this boundary may locally be an unconformity over older units. The age of the Ghudun Formation is constrained by the occurrence of Tremadocian acritarchs in the underlying Barakat Formation, and an Early–Middle Ordovician (late Floian–early Dapingian) age, based on acritarchs, in its upper part (Booth, 2009, in Forbes et al., 2010). The base Floian Stage is dated at 477.7 ± 1.4 Ma (GTS 2015), which is close to the age of SB 33C. Such a correlation implies the Ghudun Formation may be assigned to Dozon 33C.
SB 32: 468.146 Ma, late Dapingian Stage, Middle Ordovician Epoch
Base Saih Nihyada Formation Boundary, Oman(Forbes et al., 2010, and references therein) The Saih Nihyada Formation unconformably overlies the clastics of the Ghudun Formation. Graptolites from cores taken from this formation indicate the Didymograptus murchisoni Zone of Darriwilian age (Rickards et al. 2010; Forbes et al., 2010). In GTS 2015 the base Darriwilian is dated 467.3 ± 1.1 Ma, which correlates closely with the age of SB 32 at 468.146 Ma near the Dapingian/Darriwilian boundary (Figure 3, Table 1). The Saih Nihyada Formation is assigned to Orbiton 32 (Figure 1).
SB 31: 453.566 Ma, earliest Katian Stage, Late Ordovician Period
Base Hasirah Formation Boundary, Oman(Droste, 1997; Forbes et al., 2010; and references therein) Above the Saih Nihyada Formation, the base Hasirah Formation is interpreted as a regional unconformity and a hiatus. On the basis of palynology, the formation is assigned a Late Ordovician, early–middle Katian age. In GTS 2015 the base Katian is dated 453.0 ± 0.7 Ma, which correlates closely with the age of SB 31 at 453.556 Ma (Figure 3, Table 1). The Hasirah and Sahmah formations are assigned to Orbiton 31 (Figure 1). The boundary between the two formations is a major unconformity (see SB 31C below).
SB 31C: 443.846 Ma, Ordovician/Silurian BoundaryCorrelation from Oman to Saudi Arabia
In Oman, the interval from the Aeronian Stage of the Silurian System to the Moscovian Stage of the Carboniferous System is mostly absent (Forbes et al., 2010). In this section a correlation of the Ordovician–Silurian Transition is briefly discussed, and in the following sections several younger sequences and their boundaries are identified in Saudi Arabia (Figure 1, Enclosure I). This country-country correlation coincides with the beginning of the Silurian transgression, which followed the melt-out of the Hirnantian ice sheet in Gondwana. The transgression started at the Ordovician/Silurian boundary estimated at 443.8 ± 1.5 Ma (GTS 2015), which is the age of the lower boundary of Dozon 31C (SB 31C) at 443.846 Ma (Figure 3, Enclosure I, Table 1).
Copyright Gulf PetroLink 2016. All Rights Reserved. Downloaded by [email protected] IP:41.35.128.212

200
Al-Husseini
Base Sahmah Boundary, Oman The Sahmah Formation overlies the Hasirah Formation, possibly unconformably (Booth, 2009, in Forbes et al., 2010), or rests unconformably on older sediments (Figure 3). The Sahmah Formation was considered to be early Silurian (e.g. Droste, 1997); palynological data supports a general early Silurian age, but with thin Hirnantian deposits found in just one well (Forbes et al., 2010). The lower part of the formation has been tentatively dated as Rhuddanian–early Aeronian on chitinozoan evidence (Paris, 2006, in Forbes et al., 2010).
Base Uqlah Formation Boundary, Saudi ArabiaThe Ordovician–Silurian Transition is exposed in the outcrops of NW Saudi Arabia, where the Tabuk Group includes all the Upper Ordovician glacial deposits (Vaslet et al., 1987; Vaslet, 1990; Janjou et al., 1997a, b, 1998; Figure 1, Enclosure I, Table 1). The group consists of the Zarqa, Sarah and Hawban formations. The youngest Hawban Formation is dated as Late Ordovician (Hirnantian) on the basis of palynology (Miller and Al-Ruwaili, 2007). Above the Tabuk Group, the Qalibah Group consists of the Uqlah, Qusaiba and Sharawra formations (Enclosure I). The Uqlah Formation sandstones lie unconformably on the glaciogenic deposits of the Hirnantian Hawban or Sarah formations, and are interpreted as shallow-marine deposits that represent the start of the Silurian transgression (Janjou et al., 1997a, b, 1998). As explained above, the base Silurian boundary at 443.8 ± 1.5 Ma (GTS 2015) correlates closely to the lower boundary of Dozon 31C (SB 31C) at 443.846 Ma.
SB 30: 438.986 Ma, intra-Aeronian Stage, Llandovery Epoch, Silurian Period
Top ‘Mid-Qusaiba Sand’ Boundary, Saudi ArabiaThe subsurface Aeronian ‘Mid-Qusaiba Sand” occurs within the deep-marine succession of shales and siltstones of the Qusaiba Formation (Wender et al., 1998; Miller and Melvin, 2005; Zalasiewicz et al., 2007; Enclosure I). This mainly sandstone interval is mapped regionally in the subsurface of Saudi Arabia (Wender et al., 1998), and corresponds to a lowstand in mid-Aeronian (Sedgwicki Graptolite Zone, Loydell, 1998). An intra-Aernonian age (between 440.8 ± 1.2 and 438.5 ± 1.1 Ma in GTS 2015) for this lowstand would correlate with the lowstand preceeding SB 30 (438.986 Ma; Enclosure I, Table 1).
Orbiton 30 is interpreted as the upper part of the Qusaiba Formation, above the Mid-Qusaiba Sand, and the Sharawra Formation (Figure 1, Enclosure I). The boundary between the Qusaiba and Sharawra formations is a disconformity (see SB 30B below).
SB 30B: 434.126 Ma, intra-Telychian Stage, Llandovery Epoch, Silurian Period
Base Sharawra Formation Boundary, Saudi ArabiaJanjou et al. (1997a, b, 1998) described the lower boundary of the Sharawra Formation with the underlying Qusaiba Formation as disconformable. They added that it is a marine erosion surface (transgressive unconformity) above the Qusaiba Formation and represented by a reworked layer containing lag deposits of orthocone and brachiopod debris of the Sharawra Formation. The boundary between Qusaiba and Sharawra formations occurs in the Telychian Stage on the basis of graptolites (e.g. Zalasiewicz et al., 2007; 438.5 ± 1.1 and 433.4 ± 0.8 Ma, GTS 2015) implying an age consistent with that of SB 30B at the close of Dozon 30A (Enclosure I).
SB 29: 424.406 Ma, intra-Ludfordian Stage, Ludlow Epoch, Silurian Period
Base Tawil Formation Boundary, Saudi ArabiaAbove the Sharawra Formation, the base Tawil Formation is widely known as the “pre-Tawil unconformity” and a hiatus (e.g. Wender et al., 1998; Al-Hajri and Owens, 2000; Enclosure I). According to Janjou et al. (1997a, b, 1998), the basal Samra Member of the Tawil Formation disconformably overlies the sandstone at the top of the Sharawra Formation, and the boundary is a regional erosional
Copyright Gulf PetroLink 2016. All Rights Reserved. Downloaded by [email protected] IP:41.35.128.212

201
Arabian Orbital Stratigraphy – AROS 2015
surface with slight channeling. Based on chitinozoans recovered from boreholes the age of the Tawil Formation spans the Ludlow Epoch (Silurian) to intra-Pragian Stage of the Early Devonian (Aoudeh and Al-Hajri, 1995; Al-Hajri and Owens, 2000). The predicted age of the SB 29 falls in the age interval of the Ludfordian Stage of the Ludlow Epoch (between 425.6 ± 0.9 and 423.0 ± 2.3 Ma, GTS 2015). The Tawil Formation in Saudi Arabia is assigned to Orbiton 29 (Figure 1, Enclosure I, Table 1).
SB 28: 409.826 Ma, intra-Pragian Stage, Early Devonian Epoch
Base Jauf Formation Boundary, Saudi ArabiaBase Jauf Formation is interpreted as a disconformity (Wallace et al., 1997), with the basal part of the formation marking an abrupt transgression that reworked the paleosol capping the underlying Tawil Formation (Janjou et al., 1997a, b, 1998; Enclosure I). On the basis of palynology the basal part of the Jauf Formation is interpreted as late Pragian (Al-Hajri et al., 1999; Al-Hajri and Owens, 2000: between 410.8 ± 2.8 and 407.6 ± 2.6 Ma in GTS 2015) as consistent with a correlation to SB 28 at 409.826 Ma (Table 1). Orbiton 28 is interpreted as the Jauf Formation (Figure 1), and its general orbital architecture was discussed by Al-Husseini and Matthews (2006).
SB 27: 395.246 Ma, late Emsian Stage, Middle Devonian Epoch
Base Jubah Formation Boundary, Saudi ArabiaAbove the Jauf Formation, the base Jubah Formation is described as a regional unconformity by Wallace et al. (1997) or regional disconformity (Al-Hajri and Owens, 2000; Enclosure I). The base Jubah is dated by palynology as late Emsian (Al-Hajri et al., 1999) suggesting it correlates to SB 27 (Table 1). The Jubah Formation is assigned to Orbiton 27, and it may extend into younger orbitons (Figure 1).
SB 26: 380.666 Ma, intra-Frasnian Stage,Late Devonian Epoch
The Middle and Upper Devonian Series are probably represented in Saudi Arabia by the Jubah Formation, which may contain the correlative of SB 26. Little has been published on this formation. Therefore Orbiton 26 remains unidentified in Arabia (Figure 1). The Late Devonian to early Carboniferous in Arabia is mainly represented in Iraq (see below).
SB 25: 366.086 Ma, intra-Famennian Stage,Late Devonian Epoch
Base Kaista Formation Boundary, IraqIn Iraq, the Mid-Paleozoic Hiatus spans the late Silurian to Late Devonian. In Late Devonian, the Kaista Formation, consisting of mixed clastics and carbonates, was deposited on the terrestrial Pirispiki Red Beds and Chalki Volcanics of probable Late Devonian age (van Bellen et al., 1959-2005; Aqrawi, 1998; Al-Hadidy, 2007). In its type section the basal shale of the Kaista Formation is separated from the Pirispiki Red Beds by a stratigraphic break (R. Wetzel, 1950, in van Bellen et al., 1959-2005). Based on palynology, the Kaista Formation is dated as late Famennian and early Tournaisian (early Carboniferous) by Al-Hasson (1999, in Al-Hadidy, 2007).
The base Kaista Formation represents the start of a late Famennian transgression (372.2 ± 1.5 to 358.9 ± 0.4 Ma, GTS 2015). The age of SB 25 is approximately the mid point of the Famennian, and is a likely correlative to base Kaista (Table 1). Above the Kaista Formation, the Ora Shale Formation was deposited on a shallow-marine shelf in northern Iraq (Buday et al., 1980). Based on palynology, the Ora Shale is dated as early Tournaisian (Al-Lami, 1998, and Al-Hasson, 1999, in Al-Hadidy, 2007). The Kaista and Ora formations in Iraq are assigned to Orbiton 25 (Figure 1).
Copyright Gulf PetroLink 2016. All Rights Reserved. Downloaded by [email protected] IP:41.35.128.212

202
Al-Husseini
SB 24: 351.506 Ma, intra-Tournaisian Stage, Early Mississippian Epoch, Carboniferous Period
Base Harur Formation Boundary, IraqIn Iraq, the Ora Shale is overlain by the Harur Formation, and the contact is described as a sedimentary break by Aqrawi (1998). The depositional setting of the Harur Formation is interpreted as neritic (Buday et al., 1980; Aqrawi, 1998), thus implying a major sea-level rise occurred after the shallow-marine Ora Shale was deposited (Orbiton 25). Based on palynology, the Harur Formation is dated as late Tournaisian (early Carboniferous) by Al-Hasson (1999, in Al-Hadidy, 2007).
The Harur Formation represents the start of a late Tournaisian transgression (358.9 ± 0.4 to 346.7 ± 0.4 Ma, GTS 2015). The age of SB 24 is about 1.2 Myr younger than the mid-point of Tournaisian Stage, and is the likely correlative for base Harur boundary (Table 1). The Harur Formation is assigned to Orbiton 24 (Figure 1).
SB 23: 336.926 Ma, intra-Visean Stage, Middle Mississippian Epoch, Carboniferous Period
Base Raha Formation Boundary, Iraq, and Base Berwath Formation Boundary, Saudi ArabiaIn Iraq, the upper Tournaisian Harur Formation is overlain by the Raha Formation, which is dated by palynology as late Visean–early Serpukhovian (Namurian) by Kaddo (1997, in Al-Hadidy, 2007; Table 1). The age interpretations of these two formations highlights a hiatus spanning ?late Tournaisian and early Visean. The Raha Formation consists of marine shales deposited after the hiatus and its basal boundary is late Visean (346.7 ± 0.4 to 330.9 ± 0.2 Ma, GTS 2015). The age of SB 23 is 1.9 Myr younger than the mid-point of the Visean and may correlate to the start of the Raha transgression (Table 1).
As in Iraq, the Berwath Formation in Saudi Arabia was deposited in late Visean; it marks a marine transgression following a hiatus in early Visean (J. Filatoff, written communication in Al-Husseini, 2004). The Berwath Formation is therefore correlated to the Raha Formation of Iraq, and both formations are assigned to Orbiton 23 (Figure 1).
SB 22: 322.346 Ma, early Bashkirian Stage, Late Mississipian Epoch, Carboniferous Period
Mid-Carboniferous Hiatus, ArabiaThe deposition of the Berwath and Raha formations (Orbiton 23) was followed by the Mid- Carboniferous Hiatus that spanned the Serpukovian, Bashkirian to late Moscovian (Enclosure II). The hiatus is interpreted as a period of non-deposition and erosion associated with a tectonic event (so-called ‘Hercynian orogeny”) and glaciation in southern Saudi Arabia, Yemen and Oman (see review in Al-Husseini, 2004). During this time interval at least four Alpine glaciations occurred in East Australia (denoted C1 to C4 in Fielding et al., 2008), and major ice sheets covered most of Gondwana (now joined with Laurussia in Pangea Supercontinent, see figure 9 in Ruban et al., 2007). The stratigraphic position of SB 22 is believed to occur in this unconformity/hiatus, and remains undefined (Table 1). Orbiton 22 may be absent or poorly documented in Arabia (Figure 1).
SB 21: 307.766 Ma, late Moscovian Stage, Late Pennsylvanian Epoch, Carboniferous Period
Base Al Khlata Formation Boundary, Oman (Stephenson et al., 2003; Osterloff et al., 2004a; Forbes et al., 2010, and references therein) The Haushi Group of Oman consists of the Al Khlata and Gharif formations (Figure 6, Enclosure II). The older Al Khlata Formation is dominated by glaciogenic deposits that unconformably overlie older formations. They were deposited in proglacial environments, mainly during non-glacial periods dominated by
Copyright Gulf PetroLink 2016. All Rights Reserved. Downloaded by [email protected] IP:41.35.128.212
203
Arabian Orbital Stratigraphy – AROS 2015
ice melt-outs (i.e. transgression). The oldest dated Al Khlata deposits are late Moscovian based on palynology.
The dating of the Haushi Group is based on local PDO biozones (see Chapter 10 in Forbes et al., 2010; Figure 6), and has large uncertainties. For example, Osterloff et al. (2004a) suggests that the Al Khlata could range down to possibly Bashkirian. The correlation of the Haushi Group to the Orbital Scale represents deposition during melt-outs or non-glacial periods (i.e. age of SB is the start of melt-out/transgression). It is implicitly understood that substantial hiatuses associated with glacial periods may separate the Haushi Group units due to erosion or non-deposition lasting 100s Kyr to possibly a few million years.
If the basal boundary of the Al Khlata Formation is indeed late Moscovian then it may correlate to SB
21 in latest Moscovian (Figure 6, Enclosure II, Table 1). The Al Khlata Formation is subdivided into units P9, P5 and P1, with the uppermost part of youngest Unit P1 passing to the Rahab Subunit. The Rahab represents the final glacial phase in Oman. Based on palynology, the P9 Unit is tentatively dated as late Moscovian–Gzhelian (PDO Zone 2159) suggesting it represents dozons 21A and 21B (Figure 6, Enclosure II). The P5 and P1 units are tentatively dated by palynology as Asselian to Sakmarian (PDO Zones 2165 and 2141), with the Rahab Subunit as probably early Sakmarian (PDO Zone 2141B). These stage assignments suggest that the P5 and P1 units represent Dozon 21C with the Rahab Subunit occurring in early Sakmarian. Orbiton 21 is interpreted as the Al Khlata Formation in Oman.
In East Australia, Fielding et al. (2008) conclude that a non-glacial interval, spanning late Moscovian–Gzhelian, separates the end of Carboniferous Glaciation C4 from the start of the first Permian Glaciation PA (‘P1–P4’ glaciations in Fielding et al. are here written PA–PD to avoid confusion with Al Khlata P units) of Asselian–Sakmarian age. The C4–PA non-glacial interval coincides with the estimated age of Al Khlata P9 Unit supporting the interpretation that it represents mainly melt-out deposits (Figure 6, Enclosure II). Al Khlata units P5 and P1 (including the Rahab) may be melt-out deposits that are coeval to the PA Glaciation in East Australia.
SB 20: 293.186 Ma, intra-Sakmarian Stage, Cisuralian Epoch, Permian Period
Base Gharif Formation Boundary, Oman(Osterloff et al., 2004a, b; Forbes et al., 2010, and references therein) Above the Al Khlata Formation, the Gharif Formation is subdivided into the Lower, Middle and Upper members (Figure 6, Enclosure II). The lower boundary of the formation is positioned at the base of a transgressive, potentially erosive, basal sandstone lying on the Rahab Subunit. The Lower Gharif Member is late Sakmarian (PDO palynozones 2141C and 2105, and PDO Zone 1115), suggesting its basal boundary correlates to SB 20 at 293.186 Ma in the Sakmarian (295.0 ± 0.18 to 290.1 ± 0.26 Ma, GTS 2015; Figure 6, Table 1).
Based on the orbital calibration, the implied age of maximum flooding surface MFS P10 is late Sakmarian, as consistent with Sharland et al. (2001) and Forbes et al. (2010). However, the Lower Gharif (including the Haushi Limestone) are dated as late Sakmarian (PDO 1115 Biozone), contrary to the implied Artinskian age shown in Figure 6. This discrepancy could be reconciled if a major stratigraphic gap of the order of several million years occurred in late Sakmarian and early Artinskian (PB? In Figure 6). In East Australia the oldest Permian non-glacial interval is interpreted between the PA and PB glaciations and occurs in mid Sakmarian (Fielding et al., 2008). The PA–PB non-glacial interval may therefore correlate to the Lower Gharif flooding event. In the AROS correlation the Lower and Middle Gharif members in Oman are assigned to Orbiton 20 (Figure 1).
SB 19: 278.606 Ma, intra-Kungurian Stage, Cisuralian Epoch, Permian Period
Base Upper Gharif Member Boundary, Oman(Osterloff et al., 2004a, b; Forbes et al., 2010, and references therein) Base Upper Gharif Member, above the ‘Playa Shale’ in uppermost Middle Gharif Member, represents the maximum regression surface in
Copyright Gulf PetroLink 2016. All Rights Reserved. Downloaded by [email protected] IP:41.35.128.212

204
Al-Husseini
Wordian
Roadian
?Kungurian
Artinskian
UpperSakmarian
(1115)
?Sakmarian
?Asselian
?
?
?Gzhelian
Kasimovian
Kasimovian?Upper
Moscovian
LowerGharif
OrbitalScale
Haushi Group, Oman
Dozon 19C
Dozon 19Band
Dozon 19A
Dozon 20Cand
Dozon 20B
Dozon 20A
Dozon 21C
Dozon 21Band
Dozon 21A
Wordian
Roadian
Kungurian
Artinskian
Sakmarian
Asselian
C4–PA
PA
PB?
PC
PA–PB
PB–PC
PC–PD
Gzhelian
Moscovian
268.8 ± 0.5
272.3 ± 0.5
283.5 ± 0.6
290.1 ± 0.6
295.0 ± 0.8
307.0 ± 0.1
298.9 ± 0.5
303.7 ± 0.1
SB 21 307.766
SB 20293.186
SB 21C298.046
SB 19278.606
SB 20B288.326
SB 19C268.886M
IDD
LE P
ERM
IAN
Gua
dalu
pian
LOW
ER P
ERM
IAN
Cis
ural
ian
UPP
ERC
ARBO
NIF
ERO
US
Figure 6: Tentative calibration of the upper Carboniferous–middle Permian Haushi Group in subsurface Oman (Osterloff et al., 2004a, b; Forbes et al., 2010) according to the Orbital Scale. The East Australia glacial intervals are from Fielding et al. (2008; glaciations P1–P4 are renamed PA–PD to avoid confusion with Al Khlata units P9, P5 and P1). Non-glacial intervals represent ice melt-outs, sea-level rises and depositional intervals. For example, non-glacial C4-PA interval correlates to melt-out deposits of Al Khlata P9 Unit; non-glacial PA-PB correlates to the Lower Gharif Member. Glacial intervals, like late Sakmarian–early Artinskian PB, may be represented by stratigraphic gaps (hiatus).
BasalSandstone
HaushiLmst
?RahabSst
Rahab Shale
Middle Gharif
“Playa Shale”
Upper GharifSandstone
KhuffFormation
Upp
er G
harif
Sha
le
Upp
er G
harif
P5 Unit
P1 Unit
Al K
hlat
a Fo
rmat
ion
P9 Unit
PDO Biozoneand Stage
C
2190
B
A
B
A
B
A
B
2252
2141
2165
2159
2141
2141
2105
A
?
?
MFSP10
East AustraliaGlacial Intervals in
GTS 2015
Diamictites
Terrestrial fine clastics
Terrestrial sandstones
Marine sandstones
Carbonates
Glacial
Non-glacial
Copyright Gulf PetroLink 2016. All Rights Reserved. Downloaded by [email protected] IP:41.35.128.212
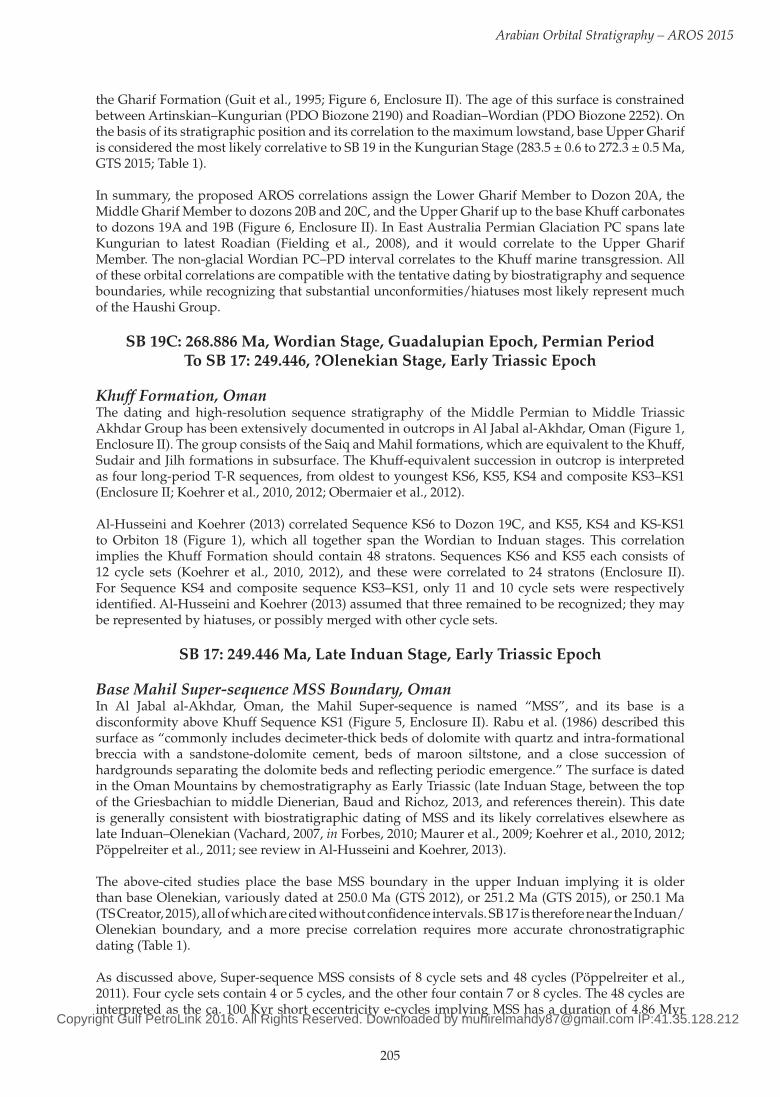
205
Arabian Orbital Stratigraphy – AROS 2015
the Gharif Formation (Guit et al., 1995; Figure 6, Enclosure II). The age of this surface is constrained between Artinskian–Kungurian (PDO Biozone 2190) and Roadian–Wordian (PDO Biozone 2252). On the basis of its stratigraphic position and its correlation to the maximum lowstand, base Upper Gharif is considered the most likely correlative to SB 19 in the Kungurian Stage (283.5 ± 0.6 to 272.3 ± 0.5 Ma, GTS 2015; Table 1).
In summary, the proposed AROS correlations assign the Lower Gharif Member to Dozon 20A, the Middle Gharif Member to dozons 20B and 20C, and the Upper Gharif up to the base Khuff carbonates to dozons 19A and 19B (Figure 6, Enclosure II). In East Australia Permian Glaciation PC spans late Kungurian to latest Roadian (Fielding et al., 2008), and it would correlate to the Upper Gharif Member. The non-glacial Wordian PC–PD interval correlates to the Khuff marine transgression. All of these orbital correlations are compatible with the tentative dating by biostratigraphy and sequence boundaries, while recognizing that substantial unconformities/hiatuses most likely represent much of the Haushi Group.
SB 19C: 268.886 Ma, Wordian Stage, Guadalupian Epoch, Permian PeriodTo SB 17: 249.446, ?Olenekian Stage, Early Triassic Epoch
Khuff Formation, OmanThe dating and high-resolution sequence stratigraphy of the Middle Permian to Middle Triassic Akhdar Group has been extensively documented in outcrops in Al Jabal al-Akhdar, Oman (Figure 1, Enclosure II). The group consists of the Saiq and Mahil formations, which are equivalent to the Khuff, Sudair and Jilh formations in subsurface. The Khuff-equivalent succession in outcrop is interpreted as four long-period T-R sequences, from oldest to youngest KS6, KS5, KS4 and composite KS3–KS1 (Enclosure II; Koehrer et al., 2010, 2012; Obermaier et al., 2012).
Al-Husseini and Koehrer (2013) correlated Sequence KS6 to Dozon 19C, and KS5, KS4 and KS-KS1 to Orbiton 18 (Figure 1), which all together span the Wordian to Induan stages. This correlation implies the Khuff Formation should contain 48 stratons. Sequences KS6 and KS5 each consists of 12 cycle sets (Koehrer et al., 2010, 2012), and these were correlated to 24 stratons (Enclosure II). For Sequence KS4 and composite sequence KS3–KS1, only 11 and 10 cycle sets were respectively identified. Al-Husseini and Koehrer (2013) assumed that three remained to be recognized; they may be represented by hiatuses, or possibly merged with other cycle sets.
SB 17: 249.446 Ma, Late Induan Stage, Early Triassic Epoch
Base Mahil Super-sequence MSS Boundary, OmanIn Al Jabal al-Akhdar, Oman, the Mahil Super-sequence is named “MSS”, and its base is a disconformity above Khuff Sequence KS1 (Figure 5, Enclosure II). Rabu et al. (1986) described this surface as “commonly includes decimeter-thick beds of dolomite with quartz and intra-formational breccia with a sandstone-dolomite cement, beds of maroon siltstone, and a close succession of hardgrounds separating the dolomite beds and reflecting periodic emergence.” The surface is dated in the Oman Mountains by chemostratigraphy as Early Triassic (late Induan Stage, between the top of the Griesbachian to middle Dienerian, Baud and Richoz, 2013, and references therein). This date is generally consistent with biostratigraphic dating of MSS and its likely correlatives elsewhere as late Induan–Olenekian (Vachard, 2007, in Forbes, 2010; Maurer et al., 2009; Koehrer et al., 2010, 2012; Pöppelreiter et al., 2011; see review in Al-Husseini and Koehrer, 2013).
The above-cited studies place the base MSS boundary in the upper Induan implying it is older than base Olenekian, variously dated at 250.0 Ma (GTS 2012), or 251.2 Ma (GTS 2015), or 250.1 Ma (TS Creator, 2015), all of which are cited without confidence intervals. SB 17 is therefore near the Induan/Olenekian boundary, and a more precise correlation requires more accurate chronostratigraphic dating (Table 1).
As discussed above, Super-sequence MSS consists of 8 cycle sets and 48 cycles (Pöppelreiter et al., 2011). Four cycle sets contain 4 or 5 cycles, and the other four contain 7 or 8 cycles. The 48 cycles are interpreted as the ca. 100 Kyr short eccentricity e-cycles implying MSS has a duration of 4.86 Myr
Copyright Gulf PetroLink 2016. All Rights Reserved. Downloaded by [email protected] IP:41.35.128.212

206
Al-Husseini
and represents Dozon 17A between 249.446 and 244.586 Ma (Figure 5, Enclosure II). Pöppelreiter et al. (2011) give inconclusive biostratigraphic evidence and present isotope correlations to suggest that MSS is exclusively Olenekian and followed by a major hiatus in early Anisian. The AROS calibration suggests it continues into the Anisian (Figure 5), and is capped by base Upper Mahil corresponding to SB 17B (Enclosure II).
SB 17B: 244.586 Ma, intra-Anisian Stage, Middle Triassic Epoch
Base Jilh Super-sequence JSS-1 Boundary, OmanIn Al Jabal al-Akhdar, above Mahil Super-sequence MSS (Pöppelreiter et al., 2011), the Upper Mahil Member (Jilh part-equivalent) is interpreted from base-up in terms of super-sequences JSS-3 to JSS-1 by Obermaier et al. (2012; Enclosure II). The basal boundary of JSS-3 is characterized by an exposure-related collapse breccia (see figures 14A of Obermaier et al., 2012). JSS-3 consists of 13 cycle sets and JSS-2 of 10 cycle sets. Together super-sequences MSS, JSS-3 and JSS-2 contain 35 cycle sets, and are just one short of the 36 that would complete Orbiton 17 (Figure 1). The missing straton is assumed to be either unrecognized or a hiatus. The latter interpretation is likely because the upper boundary of JSS-2 is an exposure surface as evident from mudcracks and heavily rooted mudstone (see figures 15A and 15B of Obermaier et al., 2012). Orbiton 17 is interpreted to span the ?late Induan and Olenekian (Early Triassic), Anisian and Ladinian (Middle Triassic), and early Carnian (Late Triassic; Enclosure II, Table 1).
SB 16: 234.866 Ma, intra-Carnian Stage, Middle Triassic Epoch
Base Jilh Super-sequence JSS 1The youngest outcropping Super-sequence JSS-1 in Al Jabal al-Akhdar consists of sequences JS-4 (6 cycle sets), JS-3 (5 cycle sets), JS-2 (5 cycle sets) and JS-1 (two cycle sets) capped by an unconformity (Obermaier et al., 2012; Enclosure II). Together sequences JS-4 and JS-3 have 11 cycle sets and could represent Dozon 16A, and sequences JSS-2 and JSS-1 together, could form the lower part on Dozon 16B. In AROS, base Super-sequence JSS-1 is correlated to SB 16 in early Carnian (Table 1), and the unconformity at the top of the Mahil Formation has an estimated age of 227 Ma, near base Norian. The lower part of Orbiton 16 is interpreted as JSS-1, and the rest of the orbiton is unassigned (Figure 1).
Note: The chrono- and sequence stratigraphy of the Upper Triassic and Lower Jurassic series are not fully understood in Arabia and in GTS. Therefore the correlations for SB 15 to SB 12 are very preliminary.
SB 15: 220.286 Ma, intra-Norian Stage, Late Triassic Epoch
Base Minjur Sandstone Boundary, Saudi ArabiaLe Nindre et al. (1990) interpreted the Norian–Rhaetian Minjur Sandstone as a second-order sequence. Issautier et al. (2012, and references therein) described its basal part as an 8 m-thick ribbon of dark ferruginous, micro-conglomeratic to medium-grained sandstone. Abundant wood trunks, up to 2 m long, and impressions of leaves occur in the basal sandstone. An erosional unconformity caps the formation. The Minjur Formation may represent part or all of Orbiton 15 and extend into Dozon 14A (Figure 1, Table 1).
In Al Jabal al-Akhdar outcrops the Norian–Rhaetian interval is missing (Bendias and Aigner, 2015). In subsurface Oman it may be represented by Palynozone 2255 in the upper part of the Jilh Formation (Forbes et al., 2010). SB 15 and Orbiton 15 are unassigned in Oman.
SB 14: 205.706 Ma, ?intra-Rhaetian Stage, Late Triassic Epoch
?Base Minjur Formation Boundary, OmanThe relationship between the Norian–Rhaetian Minjur Sandstone of Saudi Arabia and subsurface Minjur Formation of Oman is not clear. The Minjur of Oman is dated by palynology as Rhaetian (PDO Zone 2255), and its base is a disconformity, placed below the basal transgressive lag of the formation.
Copyright Gulf PetroLink 2016. All Rights Reserved. Downloaded by [email protected] IP:41.35.128.212

207
Arabian Orbital Stratigraphy – AROS 2015
A time gap may occur in the Lekhwair area between the Norian Jilh and Rhaetian Minjur (Forbes et al., 2010). However, the age of base Rhaetian in GTS 2012 is uncertain and estimated between 209.5 and 205.4 (ca. 208.5 in GTS 2015). If base Rhaetian is ca. 205.4 Ma, then the stratigraphic gap between the Minjur and Jilh formations in subsurface Oman could correlate to SB 14 (Table 1).
In Oman, the Minjur Formation could represent Dozon 14A between 205.706 (SB 14) and 200.846 Ma (SB 14B); the latter age is younger than that of the Triassic/Jurassic boundary (201.3 ± 0.2 Ma, GTS 2015), and occurs in the early Hettangian. The remainder of Orbiton 14, and Orbiton 13 may be represented by the early Jurassic Lower Mafraq Formation (Bendias and Aigner, 2015).
SB 13: 191.126 Ma, near Sinemurian/Pliensbachian Boundary, Early Jurassic Epoch
Base Marrat Formation, Saudi Arabia (Y.-M. Le Nindre, 2015, written communication) In Saudi Arabia’s outcrops, an unconformity separates the Jurassic Marrat and Triassic Minjur formations. The Marrat Formation consists of lower, middle and upper members. The Lower Member represents the basal transgression, and foraminifera suggest it may be Pliensbachian. The basal part of the middle member is dated by brachiopods as early Toarcian and represents a flooding interval. The basal part of the Upper Marrat is dated by ammonites as middle Toarcian, but its upper part is undated and could extend to late Toarcian and possibly early Aalenian.
The Lower Marrat Member could represent part or all of the Pliensbachian, and its base could therefore correlate to SB 13 (191.126 Ma) near the Sinemurian/Pliensbachian boundary at 190.8 ± 1.0 Ma (GTS 2015) (Table 1). The Marrat is separated from the overlying Dhruma Formation by an unconformity that represents a hiatus of ?late Toarcian–?Aalenian age. In the reference section the uppermost part of the Marrat Formation consists of massive gypsum beds. These could represent the closing lowstand stratons of Orbiton 13 in late Toarcian (Figure 1).
SB 12: 176.546 Ma, late Toarcian Stage, Middle Jurassic Epoch
Base Dhruma Formation Boundary, Saudi ArabiaIn central Arabia, the late or possibly all the Aalenian is absent. The early Oxfordian is also a hiatus (at least Early Oxfordian Mariae Zone and possibly Late Callovian, Y.-M. Le Nindre, 2015, written communication). These two hiatuses bound the Bajocian–early Callovian Dhruma Formation and late Callovian Tuwaiq Mountain Limestone, and these two formations are assigned to Orbiton 12 (Figure 1, Enclosure III, Table 1).
Base Upper Marrat Member Boundary, KuwaitIn Kuwait, the Marrat Formation is divided into Lower, Middle and Upper members (Kadar et al., 2015). The boundary between the Middle and Upper Marrat members is a karst surface that has been interpreted by Kadar et al. (2015) to span the Toarcian/Aalenian boundary (174.1 ± 1.0 Ma, GTS 2015), thus offering a possible correlative for SB 12 (Table 1). In Kuwait, Orbiton 12 is represented by the Upper Marrat Member, Dhruma, Sargelu, and Callovian part of the Najmah Formation (Kadar et al., 2015).
SB 11: 161.966 Ma, early Oxfordian Stage, Late Jurassic Epoch
Base Hanifa Formation Boundary, Saudi ArabiaIn Saudi Arabia, the boundary between the Callovian Tuwaiq Mountain Limestone and overlying Oxfordian Hanifa Formation corresponds to a hiatus (at least Early Oxfordian Mariae Zone, and possibly Late Callovian, Y.-M. Le Nindre, 2015, written communication). The Callovian/Oxfordian boundary is dated at 163.5 ± 1.0 Ma, implying the Hanifa transgression started in early Oxfordian as consistent with the age of SB 11 (Figure 1, Enclosure III). In Saudi Arabia, Orbiton 11 is represented by the Hanifa, Jubaila and Arab formations, and Hith main anhydrite.
Copyright Gulf PetroLink 2016. All Rights Reserved. Downloaded by [email protected] IP:41.35.128.212

208
Al-Husseini
SB 10: 147.386 Ma, middle Tithonian Stage, Late Jurassic Epoch
Base Sulaiy Formation Boundary, Saudi ArabiaThe Middle Tithonian–Berriasian Sulaiy Formation in Saudi Arabia, and coeval Makhul Formation in Kuwait and Iraq, represent a regional transgression over the Arabian Plate (see review in Wolpert et al., 2015; Figure 1, Enclosure III, Table 1). In these countries, the marine transgressive deposits overlie the massive anhydrites of the Middle Tithonian Hith Formation. In Saudi Arabia, Orbiton 10 is represented by the Sulaiy, Yamama and Buwaib formations and terminated by the “late Valanginian unconformity” below the Hauterivian Biyadh Sandstone (Figure 1, Table 1). In Oman the Habshan, Salil and Rayda formations are assigned to Orbiton 10.
SB 9: 132.806 Ma, early Hauterivian Stage, Early Cretaceous Epoch
Base Biyadh Formation Boundary, Saudi ArabiaAbove the Buwaib Formation, the base of the Hauterivian Biyadh Sandstone in Saudi Arabia is correlated across the Arabian Plate as the “late Valanginian unconformity” (Sharland et al., 2001; Le Nindre et al., 2008, see their figure 21). It is positioned near the Valanginian/Hauterivian boundary (ca. 132.9 Ma, GTS 2015), and closely correlates to SB 9 (Figure 1, Enclosure III, Table 1). In Saudi Arabia, Orbiton 9 is represented by the Biyadh Sandstone and the early Aptian Sallah Formation.
SB 8: 118.226 Ma, late Aptian Stage, Early Cretaceous Epoch
Intra-Shu’aiba Apt 4/Apt 5 Boundary, Oman and United Arab EmiratesThis boundary occurs in the Shu’aiba Formation, and is best documented in Oman and the UAE in GeoArabia Special Publication 4 (van Buchem et al., 2010; Al-Husseini and Matthews, 2010). It is interpreted as a glacio-eustatic lowstand of ca. 50 m that persisted for some 5 Myr. Maurer et al. (2013) correlated this lowstand event to other continental regions. In Oman, Orbiton 8 is represented by the upper part of the Shu’aiba Formation and Nahr Umr Formation. In Saudi Arabia outcrops the Upper Shu’aiba is absent, and the Huraysan Formation (Le Nindre et al., 2008) is assigned to Orbiton 8 (Figure 1, Enclosure III, Table 1).
The sequence-stratigraphic architecture of the Nahr Umr Formation was interpreted by Immenhauser and Matthews (2004). As explained above in “Previous Studies”, they encountered significant difficulties in tying ‘absolute time’ between their sea-level model and geological time scales. The positions of the discontinuities 2a to 8a shown in Enclosure III are approximately positioned by the present author and require further evaluation.
SB 7: 103.646 Ma, late Albian Stage, Early Cretaceous Epoch
Base Natih Formation Boundary, OmanThe Natih Formation overlies the Nahr Umr Formation, and it was correlated to Orbiton 7 by Al-Husseini (2010b, based on Homewood et al., 2008, and references therein; Enclosure III, Table 1). In Saudi Arabia outcrops the Majma and Malihah formations (Le Nindre et al., 2008) are assigned to Orbiton 7 (Figure 1).
SB 6: 89.066 Ma, earliest Coniacian Stage, Late Cretaceous Epoch
Base Fiqa Formation Boundary, Omanvan Buchem et al. (2011, their figure 2) characterized the Turonian–Coniacian Transition in several Middle Eastern countries. In Oman they interpreted a regional early Turonian unconformity, an undefined mid-upper Turonian unit, followed by the Coniacian Fiqa Formation. In AROS (see Al-Husseini, 2010b), the 34 fourth-order sequences reviewed in Homewood et al. (2008), when correlated to stratons, indicate that the main unconformity occurs in lowermost Coniacian below the Fiqa Formation (Enclosure III). The base Fiqa boundary is correlated to SB 6 (Table 1).
Copyright Gulf PetroLink 2016. All Rights Reserved. Downloaded by [email protected] IP:41.35.128.212

209
Arabian Orbital Stratigraphy – AROS 2015
Forbes et al. (2010) describe the Fiqa Formation to essentially consist of a shale facies, the Shargi Member, and a carbonate facies, the Arada Member. The Arada carbonates usually overlie the shales of the Shargi Member, but alternation occurs, pointing to lateral inter-fingering. The lower part of the Fiqa Formation is assigned to Orbiton 6 (Figure 1), probably corresponding to PDO foraminiferal biozones F63 to F66.
SB 5: 74.486 Ma, late Campanian Stage, Late Cretaceous Epoch
Base Aruma Formation Boundary at Outcrop, Saudi ArabiaIn central Saudi Arabia outcrops a regional hiatus, which spans the middle Turonian to the early Campanian, is referred to as the “pre-Aruma unconformity” (Le Nindre et al., 2008; Figure 1, Table 1). The hiatus corresponds to Orbiton 6. The Aruma Formation consists of the Khanasir, Hajajah and Lina members. The Khanasir Member was interpreted as Aruma Sequence 1 by Philip et al. (2002), and ammonites found in its basal part indicate a late Campanian–early Maastrichtian age (Le Nindre et al., 2008). Nannoflora recovered from the Khanasir Member also support a late Campanian–Maastrichtian age (H. Manivit, 1989, in Le Nindre et al., 1990, 2008). The age of the middle part of the Khanasir Member is late Maastrichtian (Zone NC 21, Arkhangelskiella cymbiformis, Le Nindre et al., 1990, 2008; Philip et al., 2002). The upper part of the member is also late Maastrichtian (NC22–NC23 nannoflora zones).
The Hajajah Member was interpreted as Aruma Sequences 2 and 3 by Philip et al. (2002). It is dated as latest Maastrichtian (Zone NC23, Micula murus, H. Manivit, in Le Nindre et al., 1990, 2008).
The Campanian Stage is estimated to have lasted about 11.5 Myr (83.6 ± 0.2 to 72.1 ± 0.2, GTS 2015), and a late Campanian age for the start of the Aruma transgression in central Arabia appears consistent with the late Campanian age of 74.486 Ma for SB 5 (Figure 1, Table 1). The Khanasir and Hajajah members of the Aruma Formation in central Saudi Arabia outcrops are assigned to Orbiton 5.
SB 4: 59.906 Ma, intra-Selandian Stage, Paleocene Epoch, Paleogene Period
Base Umm er Radhuma Formation Boundary, Saudi Arabia and OmanThe uppermost Lina Member of the Aruma Formation is dated as late Paleocene to early Eocene on the basis of marine vertebrate fauna found by Thomas et al. (1999, in Le Nindre et al., 1990, 2008). It corresponds to the shale member in the lower part of the Umm er Radhuma Formation of Powers (1968). Therefore a major unconformity/hiatus spans the latest Maastrichtian to late Paleocene in Saudi Arabia. It corresponds to the base Umm er Radhuma and correlative base Lina.
As in Saudi Arabia, the lower boundary of the Umm er Radhuma in Oman is a hiatus separating it from the Maastrichtian Simsima Formation (Forbes et al., 2010). The hiatus spanning the late Maastrichtian–Danian is recognized across most of the Arabian Plate (Sharland et al., 2001). The age of SB 4 is intra-Selandian (Table 1), which suggests the hiatus extends into the early Selandian (61.6 to 59.2 Ma, GTS 2015). Orbiton 4 is interpreted as the Umm er Radhuma and Rus formations, and lower part of the Dammam Formation (Figure 1; see below).
SB2 3: 45.326 Ma, intra-Lutetian Stage, Eocene Epoch, Paleogene Period
Intra-Dammam Formation, QatarDill et al. (2003) presented the sequence stratigraphy of the Rus and Dammam formations at outcrop in Qatar (Figure 1), and identified six sequence boundaries. In relation to the Lutetian Stage they recognized three SBs: (1) base Lutetian (47.8 Ma, GTS 2015) at the Rus/Dammam Formation boundary; (2) within the Dammam Formation with an intra-Lutetian age; and (3) top of the Lutetian Stage (41.2 Ma, GTS 2015) in the upper part of the Dammam Formation.
They described the intra-Lutetian SB as a collapse breccia, with abundant gypsum near this zone. At this boundary the measured level of gypcrete attains the maximum peak throughout the Rus and
Copyright Gulf PetroLink 2016. All Rights Reserved. Downloaded by [email protected] IP:41.35.128.212

210
Al-Husseini
Dammam formations. They noted that gypcrete may reflect the alteration of primary gypsiferous sediments by meteoric waters and pedogenic processes. The collapse breccia may represent an evaporitic depositional phase associated with a restricted marine setting and a sea-level lowstand. An intra-Lutetian sea-level lowstand presents a correlative candidate for SB 3 (Table 1). The upper part of the Dammam Formation in Qatar and neighboring countries is assigned to Orbiton 3 (Figure 1).
SB 2: 30.746 Ma, intra-Rupelian Stage, Oligocene Epoch, Paleogene Period
Base Hadrukh Formation Boundary, Saudi ArabiaThe Hadrukh Formation rests unconformably on the lower-middle Eocene Dammam Formation (Powers, 1968). The age of the Hadrukh Formation is not established but because of its apparent continuity with the overlying Miocene Dam Formation, it is considered early Miocene (Powers, 1968). The stratigraphic gap between the Hadrukh and Dammam formations is referred to as the “pre-Neogene unconformity”, and is widely recognized in Arabia. It typically starts in the Eocene (late Lutetian), and in some regions in Arabia it spans the entire Oligocene Epoch. The base Hadrukh (pre-Neogene unconformity) is correlated to SB 2 (Table 1), and the Hadrukh and Dam formations are assigned to Orbiton 2 (Figure 1).
SB 1: 16.166 Ma, late Burdigalian Stage, Miocene Epoch, Neogene Period
Base Hofuf Formation Boundary, QatarThe siliciclastics of the Hofuf Formation unconformably lie on the shallow-marine deposits of the Dam Formation in eastern Saudi Arabia and Qatar (Figure 1). The Hofuf Formation is unfossiliferous and may be either Late Miocene or Pliocene according to Powers (1968). Dill and Henjes-Kunst (2007) dated the Dam Formation in Qatar as early Miocene (ca. 22–18 Ma, Aquitanian to early Burdigalian) using 87Sr/86Sr isotope data. Al-Fahmi et al. (2014) reference Kier (1972) and state that the Dam Formation probably ranges to late Burdigalian. These estimates place the Sub-Hofuf Unconformity in upper Burdigalian to middle or ?upper Miocene, thus offering a correlative to SB 1 (Table 1). The Hofuf Formation is assigned to Orbiton 1 (Figure 1).
SB 0 (zero): 1.586 Ma, intra-Calabrian Stage,Pleistocene Epoch, Quaternary Period
MIS 52, Glaciation 52, GlobalMarine Isotope Stage MIS 52 (i.e. Glaciation 52) and Calabrian SB Cal2 have an estimated age of 1.54 Ma (Snedden and Liu, 2011) and are correlated to SB 0 (Al-Husseini, 2013).
ARABIAN, ORBITAL AND GLOBAL SEQUENCES
Snedden and Liu (2011) compiled 385 Phanerozoic global sequences, and abbreviated the names of their basal boundaries after GTS stages (e.g. For1 is oldest Fortunian SB of the Cambrian Period, Table 1). They estimated their ages based on their relative positions between stage boundaries as calibrated in GTS 2008, and classified them as major (24%), medium (45%) or minor (31%). J. Ogg (2012, written communication) recalibrated the ages of these sequences by prorating time according to stage calibrations in GTS 2012 (Table 1).
The data supporting the compilation of Snedden and Liu (2011) is not published rendering a correlation to orbital sequences highly uncertain. The correlations shown in Table 1 are only based on comparing numerical ages. Only 13 global SBs in Table 1 are classified as major, and nearly half are medium; surprisingly 7 candidates are minor. Half (19) of the correlations are within ± 0.5 Myr (one straton, black), and another 12 (32%, blue) are within ± 1.0 Myr. Major differences occur for Rhaetian SB 14 and Norian SB 15, where GTS 2012 stages remain unresolved by several million years. Other major differences may be due to (red): (1) global-orbital miscorrelations; (2) inaccurate calibrations of stages in GTS; (3) incorrectly prorating time intervals between SBs in GTS stages; or (4) whether the SB is dated below or above the stratigraphic break.
Copyright Gulf PetroLink 2016. All Rights Reserved. Downloaded by [email protected] IP:41.35.128.212
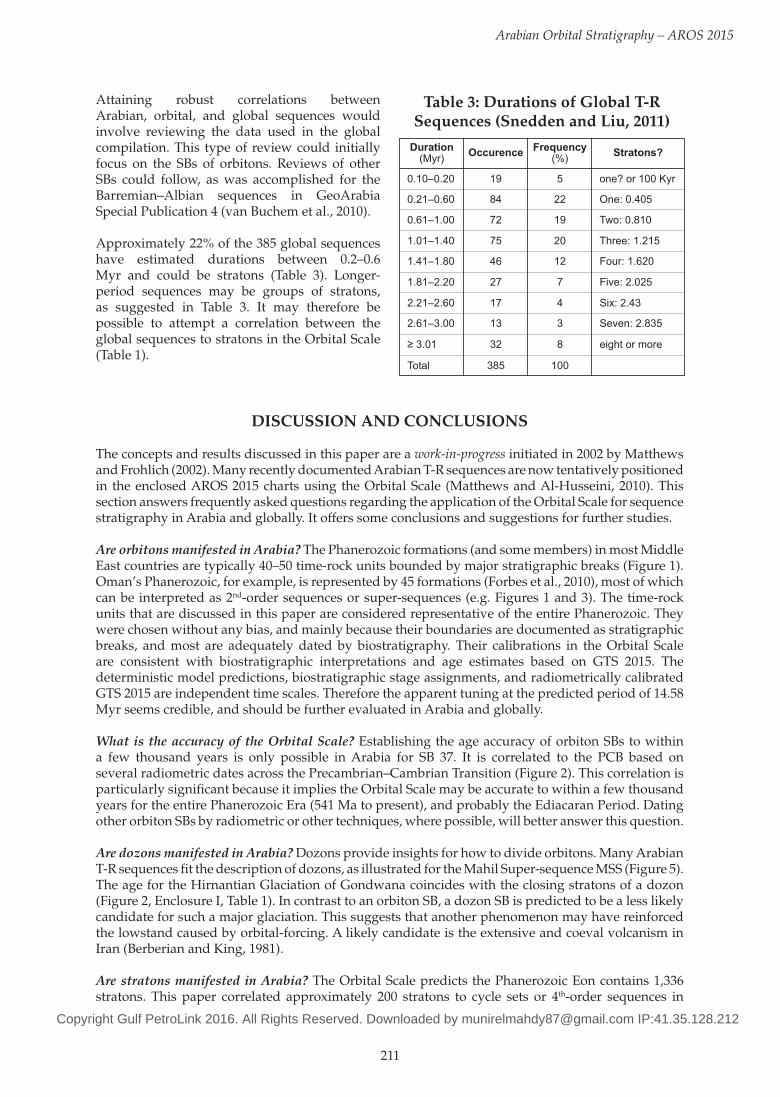
211
Arabian Orbital Stratigraphy – AROS 2015
Table 3: Durations of Global T-R Sequences (Snedden and Liu, 2011)
0.10–0.20 19 5
Duration(Myr) Occurence Frequency
(%) Stratons?
0.21–0.60 84 22
one? or 100 Kyr
0.61–1.00 72 19
One: 0.405
1.01–1.40 75 20
Two: 0.810
1.41–1.80 46 12
Three: 1.215
1.81–2.20 27 7
Four: 1.620
2.21–2.60 17 4
Five: 2.025
2.61–3.00 13 3
Six: 2.43
≥ 3.01 32 8
Seven: 2.835
Total 385 100
eight or more
Attaining robust correlations between Arabian, orbital, and global sequences would involve reviewing the data used in the global compilation. This type of review could initially focus on the SBs of orbitons. Reviews of other SBs could follow, as was accomplished for the Barremian–Albian sequences in GeoArabia Special Publication 4 (van Buchem et al., 2010).
Approximately 22% of the 385 global sequences have estimated durations between 0.2–0.6 Myr and could be stratons (Table 3). Longer-period sequences may be groups of stratons, as suggested in Table 3. It may therefore be possible to attempt a correlation between the global sequences to stratons in the Orbital Scale (Table 1).
DISCUSSION AND CONCLUSIONS
The concepts and results discussed in this paper are a work-in-progress initiated in 2002 by Matthews and Frohlich (2002). Many recently documented Arabian T-R sequences are now tentatively positioned in the enclosed AROS 2015 charts using the Orbital Scale (Matthews and Al-Husseini, 2010). This section answers frequently asked questions regarding the application of the Orbital Scale for sequence stratigraphy in Arabia and globally. It offers some conclusions and suggestions for further studies.
Are orbitons manifested in Arabia? The Phanerozoic formations (and some members) in most Middle East countries are typically 40–50 time-rock units bounded by major stratigraphic breaks (Figure 1). Oman’s Phanerozoic, for example, is represented by 45 formations (Forbes et al., 2010), most of which can be interpreted as 2nd-order sequences or super-sequences (e.g. Figures 1 and 3). The time-rock units that are discussed in this paper are considered representative of the entire Phanerozoic. They were chosen without any bias, and mainly because their boundaries are documented as stratigraphic breaks, and most are adequately dated by biostratigraphy. Their calibrations in the Orbital Scale are consistent with biostratigraphic interpretations and age estimates based on GTS 2015. The deterministic model predictions, biostratigraphic stage assignments, and radiometrically calibrated GTS 2015 are independent time scales. Therefore the apparent tuning at the predicted period of 14.58 Myr seems credible, and should be further evaluated in Arabia and globally.
What is the accuracy of the Orbital Scale? Establishing the age accuracy of orbiton SBs to within a few thousand years is only possible in Arabia for SB 37. It is correlated to the PCB based on several radiometric dates across the Precambrian–Cambrian Transition (Figure 2). This correlation is particularly significant because it implies the Orbital Scale may be accurate to within a few thousand years for the entire Phanerozoic Era (541 Ma to present), and probably the Ediacaran Period. Dating other orbiton SBs by radiometric or other techniques, where possible, will better answer this question.
Are dozons manifested in Arabia? Dozons provide insights for how to divide orbitons. Many Arabian T-R sequences fit the description of dozons, as illustrated for the Mahil Super-sequence MSS (Figure 5). The age for the Hirnantian Glaciation of Gondwana coincides with the closing stratons of a dozon (Figure 2, Enclosure I, Table 1). In contrast to an orbiton SB, a dozon SB is predicted to be a less likely candidate for such a major glaciation. This suggests that another phenomenon may have reinforced the lowstand caused by orbital-forcing. A likely candidate is the extensive and coeval volcanism in Iran (Berberian and King, 1981).
Are stratons manifested in Arabia? The Orbital Scale predicts the Phanerozoic Eon contains 1,336 stratons. This paper correlated approximately 200 stratons to cycle sets or 4th-order sequences in
Copyright Gulf PetroLink 2016. All Rights Reserved. Downloaded by [email protected] IP:41.35.128.212

212
Al-Husseini
various stratigraphic intervals, mainly where high-resolution sequence-stratigraphic studies have been documented. Some stratons cannot be verified because they can be confused with short-eccentricity e-cycles (ca. 100 Kyr) or a pair of stratons may be merged in a cycle set (Figure 5). As illustrated for Permian Sequence KS4 (Figure 4, Haase and Aigner, 2013) identifying mini-cycles, cycles and cycle sets provides a robust criterion for identifying stratons. A rule-of-thumb is to expect a complete straton (cycle set) to consist of either: (a) 3 cycles (ca. 100 Kyr e-cycles) and about 8 mini-cycles (obliquity); (b) 4 cycles and about 10 mini-cycles; or (c) 5 cycles and about 12 mini-cycles.
Can stratons be accurately dated? Stratons can be dated to an accuracy of about ± 100 Kyr if all 36 stratons per orbiton, or 12 stratons in a ‘perfect dozon’, are recognized. Where these sums exceed the predicted number then it is likely that shorter-period e-cycles (ca. 100 Kyr) have been mistaken for stratons. Where the sums are less than predicted the correlation to the Orbital Scale becomes uncertain. Generally, if stratons are missing, they are most likely a hiatus at the end of an orbiton, or between dozons. Adding age constraints from precisely dated volcanic rocks or evaporite units can substantially constrain correlations to the Orbital Scale.
How does tectonism affect the Orbital Scale? Tectonism can reinforce or eliminate orbital stratigraphy. For example, Oman’s Ara evaporite-carbonate cycles are interpreted as the orbital signal of glacio-eustasy (Figures 2 and 3). The tectonic setting – an intra-continental rift – reinforces the signal: evaporites are lowstand stratons and carbonates are peak sea-level stratons. Regional uplifts can eliminate the orbital signal by erosion or non-deposition, as seen for the late Silurian to late Carboniferous in Oman.
Are orbital T-R sequences global? The sequences identified in Arabia as candidate orbitons, dozons and stratons are interpreted to be tuned by the eccentricity of the Earth’s orbit, and should therefore be manifested globally. The Phanerozoic orbitons are one order of magnitude less than the 385 global sequences of (Snedden and Liu 2011). A tentative correlation is given in Table 1, and more accurate calibrations from other regions of the world should lead to a convergence between global and orbital T-R sequences.
How can glacio-eustasy exist in ice-free greenhouse times? The evidence being compiled in Arabia (AROS) indicates that T-R sequences populate the entire Phanerozoic, and continue into the Ediacaran. The Orbital Scale is being used to show that they ring at periods that can only be attributed to orbital-forcing of glacio-eustasy. Continents wandered into high latitudes and the poles throughout the Phanerozoic, and it is highly unlikely that ice sheets did not develop on them. The evidence that all the continents were free of ice during so-called “greenhouse times” is incomplete at best.
Can the Orbital Scale and GTS be combined? The Orbital Scale, Arabian and global sequences should be tied to the Astronomical Time Scale (ATS, Hinnov and Ogg, 2007), which is increasingly being used in GTS. ATS is calibrated by radiometric datings at numerous stratigraphic positions, and uses the same long-period E-cycle (405 Kyr) to calibrate biozones and magnetic chrons. It is based on the spectral analysis of sedimentary cyclicity in highly condensed sections deposited in deep-marine settings. However, deep-marine sections contain little, if any, sequence-stratigraphic information (e.g. SB, MFS). Using the 405 Kyr E-cycle as a standard clock should allow the ATS and the Orbital Scale to converge on a common dating for T-R sequences, and therefore biozones, magnetic chrons, chemostratigraphic curves, and other global stratigraphic markers.
ACKNOWLEDGEMENTS
This paper attempts to synthesize the work that R.K. Matthews and I did up to 2010, when he retired, and to add some new results. The paper was intentionally not peer reviewed because all the proposed correlations are considered a work-in-progress. As such it will require extensive revisions and additions as other geoscientists review it and propose improvements, not only from Arabia but worldwide. The author thanks Kathy Breining for proofreading the manuscript and Arnold Egdane for designing the graphics.
Copyright Gulf PetroLink 2016. All Rights Reserved. Downloaded by [email protected] IP:41.35.128.212
213
Arabian Orbital Stratigraphy – AROS 2015
REFERENCES
Al-Fahmi, M., M.L. Cooke and J.C. Cole 2014. Modeling of the Dammam outcrop fractures: Case study for fracture development in salt-cored structures. GeoArabia, v. 19, no. 1, p. 49-80.
Al-Hadidy, A. 2007. Paleozoic stratigraphic lexicon and hydrocarbon habitat of Iraq. GeoArabia, v. 12, no. 1, p. 63-130.
Al-Hajri, S.A., J. Filatoff, L.E. Wender and A.K. Norton 1999. Stratigraphy and operational palynology of the Devonian system in Saudi Arabia. GeoArabia, v. 4, no. 1, p. 53-68.
Al-Hajri, S.A. and B. Owens 2000. Sub-surface palynostratigraphy of the Palaeozoic of Saudi Arabia. In S. Al-Hajri and B. Owens (Eds.), Stratigraphic Palynology of the Palaeozoic of Saudi Arabia. GeoArabia Special Publication 1, Gulf PetroLink, Bahrain, p. 10-17.
Al-Husseini, M.I. 2004. Pre-Unayzah unconformity, Saudi Arabia. In, M.I. Al-Husseini (Ed.), Carboniferous, Permian and Early Triassic Arabian Stratigraphy. GeoArabia Special Publication 3, Gulf PetroLink, Bahrain, p. 15-59.
Al-Husseini, M.I. 2010a. Early Cambrian Asfar Sequence. GeoArabia, v. 15, no. 1, p. 137-160.Al-Husseini, M.I. 2010b. Late Albian, Cenomanian and Turonian Natih Supersequence of Oman: Type
section for Orbiton 7 (103.6–89.0 Ma). GeoArabia, v. 15, no. 4, p. 125-142.Al-Husseini, M.I. 2013. Antarctica’s glacio-eustatic signature in the Aptian and late Miocene–Holocene:
Implications for what drives sequence Stratigraphy. GeoArabia, v. 18, no. 1, p. 17-52.Al-Husseini, M.I. and B. Koehrer 2013. Chrono- and sequence-stratigraphy of the Mid-Permian to Early
Triassic Khuff sequences of the Arabian Plate. GeoArabia, v. 18, no. 3, p. 103-130.Al-Husseini, M.I. and R.K Matthews 2005. Arabian Orbital Stratigraphy: Periodic second-order sequence
boundaries. GeoArabia, v. 10, no. 2, p 165-184.Al-Husseini, M.I. and R.K. Matthews 2006. Devonian Jauf Formation, Saudi Arabia: Orbital Second-order
Depositional Sequence 28. GeoArabia, v. 11, no. 2, p. 53-70.Al-Husseini, M.I. and R.K. Matthews 2010. Tuning Late Barremian–Aptian Arabian Plate and global
sequences with orbital periods. In F.S.P. van Buchem, M.I. Al-Husseini, F. Maurer and H.J. Droste (Eds.), Barremian–Aptian Stratigraphy and Hydrocarbon Habitat of the Eastern Arabian Plate. GeoArabia Special Publication 4, Gulf PetroLink, Bahrain, v. 1, p. 199-228.
Amthor, J.E., J.P. Grotzinger, S. Schröder, S.A. Bowring, J. Ramezani, M.W. Martin and A. Matter 2003. Extinction of ‘Cloudina‘ and ‘Namacalathus‘ at the Precambrian – Cambrian boundary in Oman. Geology, v. 31, no. 5, p. 431-434.
Amthor, J.E., K. Ramseyer, T. Faulkner and P. Lucas 2005. Stratigraphy and sedimentology of a chert reservoir at the Precambrian – Cambrian Boundary: The Al Shomou Silicilyte, South Oman Salt Basin. GeoArabia, v. 10, no. 2, p. 89-122.
Aoudeh, S.M. and S.A. Al-Hajri 1995. Regional distribution and chronostratigraphy of the Qusaiba Member of the Qalibah Formation in the Nafud basin, NW Saudi Arabia. In, M.I. Al-Husseini (Ed.), Middle East Petroleum Geosciences Conference, GEO’94. Gulf PetroLink, Bahrain, v. 1, p. 143-154.
Aqrawi, A.A.M. 1998. Paleozoic stratigraphy and petroleum systems of the western and southwestern deserts of Iraq. GeoArabia, v. 3, no. 2, p. 229-248.
Avigad, D., K. Kolodner, M. McWilliams, H. Persing and T. Weissbrod 2003. Origin of northern Gondwana Cambrian sandstone revealed by detrital zircon SHRIMP dating. Geology, v. 31, no. 3, p. 227-230.
Baud, A. and S. Richoz 2013. Stratigraphic Note: The Permian–Triassic transition and the Saiq/Mahil Boundary in the Oman Mountains: Proposed correction for lithostratigraphic nomenclature. GeoArabia, v. 18, no. 3, p. 87-98.
Bendias, D. and T. Aigner 2015. Facies, sequence stratigraphy, reservoir and seal potential of the Mafraq Formation, Sultanate of Oman: An integrated outcrop analogue study. GeoArabia, 2015, v. 20, no. 3, p. 17-94.
Berberian, M. and G.C.P. King 1981. Towards a palaeogeographic and tectonic evolution of Iran. Canadian Journal of Earth Sciences, v. 18, no. 2, p. 210-265.
Berger, A. and M.F. Loutre 1991. Insolation values for the climate of the last 10 million years. Quaternary Science Reviews, v. 10, p. 297-317.
Bowring, S.A., J.P. Grotzinger, D.J. Condon, J. Ramezani, M.J. Newall and P.A. Allen 2007. Geochronologic constraints on the chronostratigraphic framework of the Neoproterozoic Huqf Supergroup, Sultanate of Oman. American Journal of Science, v. 307, p. 1097-1145.
Buday, T. 1980. The regional geology of Iraq. State Organization for Minerals, Baghdad, v. 1, 351 p. and v. 2, 1987, (with S. Jassim, I. Kassab, M. Abbas and J. Tyracek), 445 p.
Dill, H.G. and F. Henjes-Kunst 2007. Strontium (87Sr/86Sr) and calcium isotope ratios (44Ca/40Ca-44Ca/42Ca) of the Miocene Dam Formation in Qatar: Tools for stratigraphic correlation and environment analysis. GeoArabia, v. 12, no. 3, p. 61-76.
Copyright Gulf PetroLink 2016. All Rights Reserved. Downloaded by [email protected] IP:41.35.128.212

214
Al-Husseini
Dill, H.G., S. Nasir and H. Al-Saad 2003. Lithological and structural evolution of the northern sector of Dukhan anticline, Qatar, during the early Tertiary: With special reference to sequence stratigraphic bounding surfaces. GeoArabia, v. 8, no. 2, p. 201-226.
Droste, H.H.J. 1997. Stratigraphy of the lower Paleozoic Haima Supergroup of Oman. GeoArabia, v. 2, no. 4, p. 419-472.
Fielding, C.R., T.D. Franck, L.P. Birgenheier, A.T. Jones and J. Roberts 2008. Stratigraphic imprint of the Late Palaeozoic Ice Age in eastern Australia: a record of alternating glacial and nonglacial climate regime. Journal of the Geological Society, London, v. 165, p. 129-140.
Forbes, G.A., H.S.M. Jansen and J. Schreurs 2010. Lexicon of Oman subsurface stratigraphy: Reference guide to the stratigraphy of Oman’s hydrocarbon basins. GeoArabia Special Publication 5, Gulf PetroLink, Bahrain, 371 p.
Gradstein, F.M., J.G. Ogg, A.G. Smith et al. 2004. A Geological Time Scale 2004, GeoArabia, v. 10, no. 1, p. 142.
Guit, F.A, M.H. Al-Lawati and P.J.R. Nederlof 1995. Seeking new potential in the early-Late Permian Gharif play, west central Oman. In, M.I. Al-Husseini (Ed.), Middle East Petroleum Geosciences Conference, GEO’94. Gulf PetroLink, Bahrain, v. 2, p, 447-462.
Haase, M.L. and T. Aigner 2013. High-resolution anatomy of a grainstone package in Khuff Sequence KS4, Oman Mountains, Sultanate of Oman. GeoArabia, v. 18, no. 4, p. 17-44.
Hinnov, L.A. and J.G. Ogg 2007. Cyclostratigraphy and the astronomical time scale. Stratigraphy, v. 4, p. 239-251.
Homewood, P., P. Razin, C. Grélaud, H. Droste, V. Vahrenkamp, M. Mettraux and J. Mattner 2008. Outcrop sedimentology of the Natih Formation, northern Oman: A field guide to selected outcrops in the Adam Foothills and Al Jabal al Akhdar areas. GeoArabia, v. 13, no. 3, p. 39-120.
Immenhauser, A. and R.K. Matthews 2004. Albian sea-level cycles in Oman: the ‘Rosetta Stone’ approach. GeoArabia, v. 9, no. 3, p. 11-46.
Issautier, B., Y.-M. Le Nindre, S. Viseur, A. Memesh and S. Dini 2012. Managing clastic reservoir heterogeneity II: Geological modeling and reservoir characterisation of the Minjur Sandstone at the Khashm al Khalta type locality (Central Saudi Arabia). GeoArabia, v. 17, no. 3, p. 61-80.
Janjou, D., M.A. Halawani, M.S. Al-Muallem, C. Robelin, J.-M. Brosse, S. Courbouleix, J. Dagain, A. Genna, P. Razin, J.M. Roobol, H. Shorbaji and R. Wyns 1997a. Explanatory notes to the geologic map of the Al Qalibah Quadrangle, Kingdom of Saudi Arabia. Geoscience Map GM-135, scale 1:250,000, sheet 28C. Deputy Ministry for Mineral Resources, Ministry of Petroleum and Mineral Resources, Kingdom of Saudi Arabia. 44 p.
Janjou, D., M.A. Halawani, J.-M. Brosse, M.S. Al-Muallem, J.F. Becq-Giraudon, J. Dagain, A. Genna, P. Razin, M.J. Roobol, H. Shorbaji and R. Wyns 1997b. Explanatory notes to the geologic map of the Tabuk Quadrangle, Kingdom of Saudi Arabia. Geoscience Map GM-137, scale 1:250,000, sheet 28B. Deputy Ministry for Mineral Resources, Ministry of Petroleum and Mineral Resources, Kingdom of Saudi Arabia. 49 p.
Janjou, D., M.A. Halawani, M.J. Roobol, A. Memesh, P. Razin, H. Shorbaji and J. Roger 1998. Explanatory notes to the geologic map of the Jibal Al Misma Quadrangle, Kingdom of Saudi Arabia. Geoscience Map GM-138, scale 1:250,000, sheet 27D. Deputy Ministry for Mineral Resources, Ministry of Petroleum and Mineral Resources, Kingdom of Saudi Arabia. 36 p.
Johnson, M.E. 1996. Stable cratonic sequences and a standard for Silurian eustasy. In, B.J. Witzke, G.A. Ludvigson and J. Day (Eds.), Paleozoic Sequence Stratigraphy: Views from the North American Craton. Boulder, Colorado, Geological Society of America, Special Paper, no. 306, p. 203-211.
Kadar, A.P., T. De Keyser, N. Neog and K.A. Karam (with contributions from Y.-M. Le Nindre and R.B. Davies) 2015. GeoArabia, v. 20, no. 4, p. 125-180.
Kier, P. 1972. Tertiary and Mesozoic echinoids of Saudi Arabia. Smithsonian Institution. Contributions in Paleobiology, no. 10, 242 p.
Koehrer, B., M. Zeller, T. Aigner, M. Poeppelreiter, P. Milroy, H. Forke and S. Al-Kindi 2010. Facies and stratigraphic framework of a Khuff outcrop equivalent: Saiq and Mahil formations, Al Jabal al-Akhdar, Sultanate of Oman. GeoArabia, v. 15, no. 2, p. 91-156.
Koehrer, B., T. Aigner, H. Forke and M. Pöppelreiter 2012. Middle to Upper Khuff (Sequences KS1 to KS4) outcrop- equivalents in the Oman Mountains: Grainstone architecture on a subregional scale. GeoArabia, v. 17, no. 4, p. 59-104.
Kolodner, K., D. Avigad, M. McWilliams, J.L. Wooden, T. Weissbrod and S. Feinstein 2006. Provenance of north Gondwana Cambrian-Ordovician sandstone: U-Pb SHRIMP dating of detrital zircons from Israel and Jordan. Geological Magazine, v. 143, p. 367-391.
Lababidi, M.M. and A.N. Hamdan 1985. Preliminary lithostratigraphic correlation study in OAPEC member countries. Organization of Arab Petroleum Exporting Countries, Kuwait, 168 p., 6 charts.
Copyright Gulf PetroLink 2016. All Rights Reserved. Downloaded by [email protected] IP:41.35.128.212

215
Arabian Orbital Stratigraphy – AROS 2015
Laskar, J., P. Robutal, F. Joutel, M. Gastineau, A. Correia and B. Levrard 2004. A long term numerical solution for the insolation quantities of the Earth. Astronomy and Astrophysics, v. 428, p. 261-285.
Le Nindre, Y.M., J. Manivit, H. Manivit and D. Vaslet 1990. Stratigraphie sequentielle du Jurassique et du Cretace en Arabie Saoudite. Bulletin de la Societe Geologique de France, v. 6, p. 1025-1034.
Le Nindre, Y.-M., D. Vaslet, S.S. Maddah and M.I. Al-Husseini 2008. Stratigraphy of the Valanginian? to Early Paleocene succession in central Saudi Arabia outcrops: Implications for regional Arabian sequence stratigraphy. GeoArabia, v. 13, no. 2, p. 51-86.
Loydell, D.K. 1998. Early Silurian sea-level changes. Geological Magazine, v. 135, p. 447-471.Matthews, R.K. and M.I. Al-Husseini 2010. Orbital-forcing glacio-eustasy: A sequence-stratigraphic time
scale. GeoArabia, v. 15, no. 3, p. 155-167.Matthews, R.K. and C. Frohlich 2002. Maximum flooding surface and sequence boundaries: comparisons
between observation and orbital forcing in the Cretaceous and Jurassic (65-190 Ma). GeoArabia, v. 7, no. 3, p. 503-538.
Matthews, R.K., C. Frohlich and A. Duffy 1997. Orbital forcing of global change throughout the Phanerozoic: A possible stratigraphic solution to the eccentricity phase problem. Geology, v. 25, p. 807-810.
Maurer, F., R. Martini, R. Rettori, H. Hillgärtner and S. Cirilli 2009. The geology of Khuff outcrop analogues in the Musandam Peninsula, United Arab Emirates and Oman. GeoArabia, v. 14, no. 3, p. 125-158.
Maurer, F., F.S.P. van Buchem, G.P. Eberli, B.J. Pierson, M.J. Raven, P.-H. Larsen, M.I. Al-Husseini and B. Vincent 2013. Late Aptian long-lived glacio-eustatic lowstand recorded on the Arabian Plate. Terra Nova, v. 25, no. 2, p. 87-94. DOI: 10.1111/ter.12009.
Miller, M.A. and J. Melvin 2005. Significant new biostratigraphic horizons in the Qusaiba Member of the Silurian Qalibah Formation of central Saudi Arabia, and their sedimentologic expression in a sequence stratigraphic context. GeoArabia, v. 10, no. 1, p. 49-92.
Miller, M.A. and M.H. Al-Ruwaili 2007. Preliminary palynological investigation of Saudi Arabian Upper Ordovician glacial sediments. In, F. Paris, B. Owens and M.A. Miller (Eds.), Palaeozoic Palynology of the Arabian Plate and Adjacent Areas. Revue de micropaléontologie, Elsevier, v. 50, no. 1, p. 17-26.
Miller, N., P.R. Johnson and R.E. Stern 2008. Marine versus non-marine environments for the Jibalah Group, NW Arabian Shield: A sedimentological and geochemical survey and report of possible metazoa in the Dhaiqa Formation. The Arabian Journal for Science and Engineering, v. 22, no. 1C, p. 55-77.
Obermaier, M., T. Aigner and H.C. Forke 2012. Facies, sequence stratigraphy and reservoir/seal potential of a Jilh Formation outcrop equivalent (Wadi Sahtan, Triassic, Upper Mahil Member, Sultanate of Oman). GeoArabia, v. 17, no. 3, p. 85-128.
Osterloff, P., R. Penney, J. Aitken, N. Clark and M. Al-Husseini 2004a. The Al Khlata Formation in Interior Oman. GeoArabia Special Publication 3. Gulf PetroLink, Bahrain, p. 61-81.
Osterloff, P.L., A. Al-Harthy, R. Penney, P. Spaak, F. Al-Zadjali, N.S. Jones, R.W.O.B Knox, M.H. Stephenson, G. Oliver and M.I. Al-Husseini 2004b. Gharif and Khuff formations, subsurface Interior Oman. GeoArabia Special Publication 3, Gulf PetroLink, Bahrain, p. 83-147.
Philip, J.M., J. Roger, D. Vaslet, F. Cecca, S. Gardin and A.M.S. Memesh 2002. Sequence stratigraphy, biostratigraphy and paleontology of the (Maastrichtian-Paleocene) Aruma Formation in outcrop in Saudi Arabia. GeoArabia, v. 7, no. 4, p. 699-718.
Pöppelreiter, M.C., C.J. Schneider, M. Obermaier, H.C. Forke, B. Koehrer and T. Aigner 2011. Seal turns into reservoir: Sudair equivalents in outcrops, Al Jabal al-Akhdar, Sultanate of Oman. GeoArabia, v. 16, no. 1, p. 69-108.
Powell, J.H., A.M. Abed and Y.-M. Le Nindre 2014. Cambrian Stratigraphy, Jordan Cambrian stratigraphy of Jordan. GeoArabia, v. 19, no. 3, p. 81-134.
Powell, J.H., A. Abed and G.H. Jarrar 2015. Ediacaran Araba Complex of Jordan. GeoArabia, v. 20, no. 1, p. 99-156.
Powers, R.W. 1968. Lexique stratigraphique international. Volume III, Asie, Fas. 10 b1, Arabia Saoudite. Centre Nationale de la Recherche Scientifique, Paris, 177 p.
Rabu, D., F. Béchennec, M. Beurrier and G. Hutin 1986. Explanatory notes to the geological map of the Nakhl Quadrangle, Sultanate of Oman. Geoscience map, scale 1:100,000, sheet NF 40-3E. Ministry of Petroleum and Minerals, Directorate General of Minerals, Sultanate of Oman, 42 p.
Rickards, B.R., G.A. Booth, F. Paris and A.P. Heward 2010. Marine flooding events of the Early and Middle Ordovician of Oman and the United Arab Emirates and their graptolite, acritarch and chitinozoan associations. GeoArabia, v. 15, no. 4, p. 81-120.
Ross, C.A. and R.P. Ross 1996. Silurian sea-level fluctuations. In B.J. Witzke, G.A. Ludvigson and J. Day (Eds.), Paleozoic sequence stratigraphy: Views from the North American craton. Geological Society of America Special Paper no. 306, p. 187-192.
Ruban, D.A., M.I. Al-Husseini and Y. Iwasaki 2007. Review of Middle East Paleozoic plate tectonics. GeoArabia, v. 12, no. 3, p. 35-56.
Copyright Gulf PetroLink 2016. All Rights Reserved. Downloaded by [email protected] IP:41.35.128.212

216
Al-Husseini
Sharland, P.R., R. Archer, D.M. Casey, R.B. Davies, S.H. Hall, A.P. Heward, A.D. Horbury and M.D. Simmons 2001. Arabian Plate sequence stratigraphy. GeoArabia Special Publication 2, Gulf PetroLink, Bahrain, 371 p., with 3 charts.
Snedden, J.W. and C. Liu 2011. Recommendations for a uniform chronostratigraphic designation system for Phanerozoic depositional sequences. Bulletin of the American Association of Petroleum Geologists, v. 95, p. 1095-1122.
Stephenson, M.H., P.L. Osterloff and J. Filatoff 2003. Palynological biozonation of the Permian of Oman and Saudi Arabia: progress and challenges. GeoArabia, v. 8, no. 3, p. 467-496.
Stern, R.J., D. Avigad, N.R. Miller and M. Beyth 2006. Evidence for the snowball Earth hypothesis in the Arabian-Nubian Shield and the east African Orogen. Journal of African Earth Science, v. 44, p. 1-20.
van Bellen, R.C., H.V. Dunnington, R. Wetzel and D.M. Morton 1959-2005. Lexique Stratigraphique International. 03 10 Asie, (Iraq), 333 pages. Reprinted by permission of CNRS by Gulf PetroLink, Bahrain.
van Buchem, F.S.P., M.I. Al-Husseini, F. Maurer and H.J. Droste 2010. Barremian – Aptian stratigraphy and hydrocarbon habitat of the eastern Arabian Plate. GeoArabia Special Publication 4, Gulf PetroLink, Bahrain, v. 1,2, 614 p.
van Buchem, F.S.P., M.D. Simmons, H.J. Droste and R.B. Davies 2011. Late Aptian to Turonian stratigraphy of the eastern Arabian Plate – depositional sequences and lithostratigraphic nomenclature. Petroleum Geoscience, v. 17, p. 211-222. DOI: 10.1144/1354-079310-061.
Vaslet, D. 1990. Upper Ordovician glacial deposits in Saudi Arabia. Episodes, v. 13, no. 3, p. 147-161.Vaslet, D., K.S. Kellogg, A. Berthiaux, P. Le Strat and P.-L. Vincent 1987. Explanatory notes to the geologic
map of the Baq’a Quadrangle, Kingdom of Saudi Arabia. Geoscience Map GM-116 C, scale 1:250,000, sheet 27F. Deputy Ministry for Mineral Resources, Ministry of Petroleum and Mineral Resources, Kingdom of Saudi Arabia. 45 p.
Vaslet, D., Y.-M. Le Nindre, D. Vachard, J. Broutin, S. Crasquin-Soleau, M. Berthelin, J. Gaillot, M. Halawani and M.I. Al-Husseini 2005. The Permian-Triassic Khuff Formation of central Saudi Arabia. GeoArabia, v. 10, no. 4, p. 77-134.
Wallace, C.A., S.M. Dini and A.A. Al-Farasani 1997. Explanatory notes to the geological map of the Al Jawf Quadrangle, Kingdom of Saudi Arabia. Geoscience Map GM-128C, scale 1:250,000, sheet 29D. Deputy Ministry for Mineral Resources, Ministry of Petroleum and Mineral Resources, Kingdom of Saudi Arabia. 31 p.
Wender, L.E., J.W. Bryant, M.F. Dickens, A.S. Neville and A.M. Al-Moqbel 1998. Paleozoic (pre- Khuff) hydrocarbon geology of the Ghawar area, eastern Saudi Arabia. GeoArabia, v. 3, no. 2, p. 273-302.
Wolpert, P., M. Bartenbach, P. Suess, R. Rausch, T. Aigner and Y.-M. Le Nindre 2015. Facies analysis and sequence stratigraphy of the uppermost Jurassic– Lower Cretaceous Sulaiy Formation in outcrops of central Saudi Arabia. GeoArabia, v. 20, no. 4, p. 67-122.
Wu, H. S. Zhang, L.A. Hinnov, G. Jiang, Q. Feng, H. Li and T. Yang 2013. Time-calibrated Milankovitch cycles for the late Permian. Nature Communications, DOI: 10.1038/ncomms3452.
Zalasiewicz, J., M. Williams, M. Miller, A. Page and E. Blackett 2007. Early Silurian (Llandovery) graptolites from central Saudi Arabia: First documented record of Telychian faunas from the Arabian Peninsula. GeoArabia, v. 12, no. 4, p. 15-36.
ABOUT THE AUTHOR
Moujahed I. Al-Husseini founded Gulf PetroLink in 1993 in Manama, Bahrain. Gulf PetroLink is a consultancy aimed at promoting technology in the Middle East petroleum industry. Moujahed received his BSc in Engineering Science from King Fahd University of Petroleum and Minerals in Dhahran (1971), MSc in Operations Research from Stanford University, California (1972), PhD in Earth Sciences from Brown University, Rhode Island (1975) and Program for Management Development from Harvard University, Boston (1987). Moujahed joined Saudi Aramco in 1976 and was the Exploration Manager from 1989 to 1992. In 1996, Gulf PetroLink launched the journal of Middle East Petroleum Geosciences, GeoArabia, for which Moujahed is Editor-in-Chief. Moujahed also represented the GEO Conference Secretariat, Gulf PetroLink-GeoArabia in Bahrain from 1999–2004.
Copyright Gulf PetroLink 2016. All Rights Reserved. Downloaded by [email protected] IP:41.35.128.212