Gujarat Social Infrastructure Development Society (GSIDS ...
162
Gujarat Social Infrastructure Development Society (GSIDS) General Administration Department (Planning) Government of Gujarat, Gandhinagar
Transcript of Gujarat Social Infrastructure Development Society (GSIDS ...

Gujarat Social Infrastructure Development Society (GSIDS) General Administration Department (Planning) Government of Gujarat, Gandhinagar

District Human Development Report: BANASKANTHA
Core Committee Chairperson : District Collector, Banaskantha Co-Chairperson : District Development Officer, Banaskantha Members : District Agricultural Officer, Banaskantha Additional Director, Animal Husbandry Officer, Banaskantha District Education Officer, Banaskantha District Primary Education Officer, Banaskantha Chief District Health Officer, Banaskantha Program Officer, ICDS, Banaskantha Director, District Rural Development Agency (DRDA), Banaskantha District Superintendent of Police, Banaskantha Additional Collector, Banaskantha Project Officer, Tribal Sub-Plan, Banaskantha Deputy Conservator of Forest (Extension), Palanpur Deputy Conservator of Forest (Normal), Palanpur Executive Engineer, Road & Building (State), Banaskantha Executive Engineer, Road & Building (Panchayat), Banaskantha District Employment Officer, Banaskantha District Social Welfare Officer, Banaskantha District Backward Class Welfare Officer, Banaskantha District Supply Officer, Banaskantha District Information Officer, Banaskantha District Registrar (Cooperation) , Banaskantha Executive Engineer, Irrigation (Panchayat), Banaskantha General Manager, District Industry Centre (DIC), Banaskantha Managing Director, Banas Dairy, Palanpur Divisional Controller, State Transport, Palanpur Director, Agriculture University, Dantiwada DHDR Project Director
: Principal, V. M. Patel College of Management Studies, Ganpat University
Member Secretary : District Planning Officer, Banaskantha Add. Member Secretary
: District Statistical Officer, Banaskantha
Project Team
Dr. K. M. Chudasama, (Project Director), Principal, VMPCMS, Ganpat University Mr. Kundan Patel, (Project Associate), Assistant Professor, VMPCMS, Ganpat University Mr. Maulik Prajapati, (Project Associate), Assistant Professor, VMPCMS, Ganpat University Mr. Vipul Patel, (Project Associate), Assistant Professor, VMPCMS, Ganpat University Mr. Kiran Patel, (Project Associate), Assistant Professor, VMPCMS, Ganpat University

MESSAGE
12-02-2015


MESSAGE
Human Development is a development paradigm which is beyond mere rise or fall of
national incomes. It is about creating an environment where people can develop their full
potential and lead productive, creative lives in accordance with their needs and interests.
People are the real wealth of nation. Development is thus about expanding the choices
people have to lead lives that they value.
The District Human Development Report is a Document which gives the present status
of Human Development in different talukas of the District. Human Development, requires
focus on the basic as well as crucial indicators of Human Development. Thus this report has
highlighted three important pillars which are: Education, Health and Livelihood.
I commend the efforts put in by stakeholders in preparing this publication and hope
that it will be useful to all the state & district level officials, policy makers and planners
working towards improving Human Development scenario of the District .
(S. Aparna)
Principal Secretary (Planning) and
Chairperson, GSIDS


i
PREFACE
Over the past few decades, there had been concern about the socio-economic developments particularly in backward areas; however special emphasis has been laid on the human development aspects recently. Consequently, along with the economic growth and development, the due importance is given to aspects pertaining to people living long and healthy life, to acquire knowledge and to have access to the resources needed for a decent standard of living. The rationale is to observe how economic growth can be translated in to the overall development of society. The first Human Development Report, commissioned by the United Nations Development Programme (UNDP) was launched in 1990 with the single target of putting people at the center of the development process in terms of economic debate, policy and advocacy. The first Human Development Report introduced a new way of measuring development by combining indicators of life expectancy, educational attainment and income into a composite Human Development Index. It signified development of the people, by the people, and for the people, and emphasizing that the goals of development are choices and freedoms. Human Development Reports at the regional, national and state levels take the human development approach to the regional, national and state levels and are prepared and owned by regional, national and state teams. India launched its first Human Development Report in 2001 prepared by National Human Development Report project team of Planning Commission, Government of India. UNDP has signed an initiative with the Government of India to assist State Governments to move from analysis to action. The Project "Strengthening State Plans for Human Development (SSPHD)" is designed to assist state governments in following up to their respective State Human Development Reports (SHDRs). Under this program Government of Gujarat has initiated the process of integrating human development in planning and policy documents. The initiative has been transformed in terms of the preparation of State Human Development Report in 2004. The preparation of SHDR has supported analysis on status of human development at the state level and has led to better investigative alternatives for policies and strategies. To incorporate human development all through the Planning process, a special initiative was taken by Government of Gujarat by establishing the Gujarat Social Infrastructure Development Society (GSIDS) under the Chairmanship of Additional Chief Secretary (Planning) with a more specific objective of raising Human Development Index of the State. In 2008 under SSPHD, Gujarat initiated preparation of District Human Development Reports (DHDR). The DHDR concentrates on the issue of strategy formulation to bring about human development at taluka level in particular district. The DHDRs aims at understanding the level of human development and disparities existing among regional as well as social groups to provide clarity on the need and direction of initiated program intervention.

ii
Banaskantha being one of the backward districts of Gujarat is characterized by low level of human development. According to the Gujarat State Human Development Report (2004), out of 25 districts of Gujarat, Banaskantha district ranked 25th with reference to overall Human Development Index (HDI) amongst all the 25 districts of Gujarat in 1991. While after a decade, Banaskantha district ranked 24th with reference to overall HDI amongst all the 25 districts of Gujarat in 2001. Since then various efforts for enhancing human development has been undertaken through district administration by the State Government. Special emphasis with specific efforts has been laid on Agriculture, Animal Husbandry, Education, Health Care, Poverty Reduction, Food Security and other aspects of human development by district administration, which has been reflected in the Banaskantha DHDR. The Banaskantha DHDR aims to assist process of district planning through the human development prism. It does so by analyzing the status of human development attainment and key human development challenges faced with a special focus on efficiency of delivery systems. The Banaskantha DHDR is fondly hoped to become an important reference document for integrated district planning in future. It is expected to effectively assist district planning committees and Government line departments in directing adequate public resources towards priority areas and sectors of persisting backwardness within district.
Dilip Rana May : 2015 Collector
Palanpur Banaskantha

iii
FOREWORD
The Human Development approach arose in part as a result of growing criticism to the leading development approach, which presumed a close link between national economic growth and the expansion of individual human choices. As of 1990, the human development concept was applied to a systematic study of global themes, as published in the yearly Global Human Development Reports under the auspice of the UNDP.
The Human Development story of India is unique in its kind. India initiated Human Development issues during 8th Five Year Plan (1992-97). In order to integrate Human Development into state planning in India the preparation of reports at state level has been started. Now-a-days the Gujarat State is on the fast track of development. Planning Commission- Government of India and UNDP had partnered Strengthening State Plan for Human Development (SSPHD) Programme, under which the Government of Gujarat had initiated the process of integrating Human Development in planning and policy documents.
Human Development is increasingly becoming an area of concern and priority is given to development a strategy which conceptually goes beyond per capita income as a measure of development. The preparation of DHDR (District Human Development Report) marks the beginning of the process whereby people are mobilized and actively participate in the developmental process.
The DHDR is expected to be an important document for formulating the District Human Development Plan. The report has studied the status of Human Development in different talukas of Banaskantha District. The report depicts the present status of the district with available information for various indicators of Education, Health, Nutrition and Livelihood.
I hope this report will form a milestone in the overall planning and development of the district. DHDR will also be very useful to concerned State and District level Officials, policy makers, decision makers and NGOs.
H.K. Patel (District Development Officer, Banaskantha)

iv

v
ACKNOWLEDGEMENTS
The Banaskantha DHDR is prepared under the aegis of Gujarat Social Infrastructure Development Society (GSIDS), General Administration Department (Planning), Government of Gujarat. The GSIDS has initiated the project of preparing District Human Development Reports (DHDR). For this purpose GSIDS has assigned the task of preparing Banaskantha DHDR to Ganpat University. The HDR is the culmination of the concentrated efforts all the agencies involved in preparation of this report. We express our deep sense of gratitude to the Principal Secretary, General Administration Department (Planning), Government of Gujarat (Chairman, GSIDS) and the Member Secretary, GSIDS for entrusting us and our organization for such an important project. We are thankful to the Vice Chancellor of Ganpat University for his kind consent to undertake this work. We would like to wholeheartedly thank the District Collector, Banaskantha and his office for the support and guidance. We are thankful to District Development Officer and his team for assistance rendered. The cooperation of the officers of the line departments of Banaskantha district administration, executives of GSIDS, Directorate of Economics and Statistics and representatives of other departments of Government of Gujarat has been acknowledged. We express our sincere gratitude to the villagers for sharing their experiences and enriched the report input by way of discussion during the field visits to the villages in Banaskantha district. We have no words to thank those respondents who spared their time to answer the queries. Similarly, the project has been facilitated in countless ways through the cooperation of the experts who helped us at various stages of the project. Their cooperation in providing the guidance is very much appreciated. We wish this modest effort will contribute towards insights into the ‘human development’ in Banaskantha district and facilitate strategies for the future. Dr. K. M. Chudasama Ganpat University

vi

vii
EXECUTIVE SUMMARY Introduction
The concept of Human Development became popular after the first Human Development Report was published by UNDP in 1990. Since then, the concept is evolving continuously over a period of time and is gaining immense significance. The first Human Development Report has defined human development as the process of enlarging the choices of people and the most critical of those choices are those of long and healthy life, education and decent standard of living. This highlights the aspects pertaining to people living long and healthy life, to acquire knowledge and to have access to the resources needed for a decent standard of living. Given this basic background, the Planning Commission, Government of India has joined hands with UNDP for Strengthening State Plan for Human Development (SSPHD) Programme. In this context, Government of Gujarat has initiated the process of incorporating human development in planning and policy formulations. In order to ensure human development perspective in the Governmental functions, the Government of Gujarat has established Gujarat Social Infrastructure Development Board Society under the Chairmanship of Additional Chief Secretary (Planning) with the purpose of enhancing Human Development in the State and initiated preparation of District Human Development Reports. Banaskantha District Human Development Report is the outcome of the series of the initiatives.
Banaskantha district being one of the developing districts of Gujarat is characterized by low level of human development. As per the Gujarat State Human Development Report (2004), out of 25 districts of Gujarat, Banaskantha district ranked 25th with reference to overall Human Development Index amongst all the 25 districts of Gujarat in 1991. While after a decade, Banaskantha district ranked 24th with reference to overall Human Development Index amongst all the 25 districts of Gujarat in 2001. Thus, the Banaskantha District Human Development Report aims to assist process of district planning through the human development prism. The Banaskantha District Human Development Report address the issues pertaining to agriculture, animal husbandry and livelihood; literacy and education; health, nutrition and sanitation; poverty, food security and vulnerability and provides insight for strategy formulation to bring about human development at district and taluka level.
Agriculture, Animal Husbandry and Livelihood
Agriculture and allied activities (including animal husbandry) are major source of livelihood in Banaskantha. Almost 66.16% of working population of Banaskantha is engaged in agriculture sector and more than 70% of workforce in Amirgadh, Bhabhar, Danta, Dantiwada, Kankrej, Tharad and Vav depend on agriculture and allied activities. Agriculture in Banaskantha is dominated by medium farmers (owning 4 to 10 hectares), that shares 39.40% hectares of operational holdings. Considering the distribution of population across categories and across the talukas, SC and ST population shares less operational holdings out of the total operational land holdings as compared to the other population in Banaskantha.
The land use pattern in the district has been stagnant over last decade, where nearly 70% of area is under cultivation. Out of the total reported area of the district almost 70% of area falls under net cropped area and has remained stagnant during last decade, but the cropping pattern of the district has been volatile, shifting sometimes towards cultivation of non food

viii
crops and sometimes towards cultivation of food crops. Consequently, at times farmer produce cash crops and sell after harvesting, compromising the nutrition need on one hand and on other hand some farmers are forced by emergencies to opt for loan in case of unavailability of resources during emergency, leading to uncertainty in the critical time.
The cultivation of food crops has been fluctuating, but the productivity of major food crops (wheat and Bajra) has been relatively stagnant, while productivity of vegetables has increased. Moreover the cropping intensity has decreased in Bhabhar, Danta, Deesa, Dhanera, Tharad and Vadgam talukas. Out of the total geographical area of district, about 47.23% of area is irrigated, accounting nearly 47.75% of the total cropped area. Bhabhar, Danta, Kankrej, Tharad and Vav have more than half of its cropped area that is unirrigated. The major cause of concern is that despite various schemes for farmers in all the talukas, the farmers in Bhabhar, Dhanera, Kankrej, Tharad and Vav bear lower standard of living compared to other talukas like Deesa, Palanpur and Dantiwada. The other problems faced in agriculture are salinity, decreasing soil fertility and volatile cultivation pattern. The extensive campaigning about the various agricultural schemes and workshops at local level can enhance the awareness of farmers pertaining to their agricultural planning and can provide opportunities for better livelihood.
Animal husbandry plays an important role in Banaskantha. Animal husbandry has been generating gainful employment in the rural Banaskantha, particularly among the landless labourers, small and marginal farmers and women by supplementing their family incomes. Consequently, animal husbandry has developed on large scale in Banaskantha and the district ranks 1st in volume of cows and buffalos, as well as ranks 1st in average milk yield per day per cow (indigenous) and average milk yield per day per buffalo as well as ranks 1st in total production of milk. Banas Dairy is fostering livelihood options for people and it can offer still more income and employment opportunities by backward and forward linkage strategies.
Literacy and Education
The overall literacy in Banaskantha stood at 65.32, while the male literacy and female literacy stood at 78.15 and 51.75 respectively in 2011. Moreover, the overall gap between male and female literacy has been 26.40 in 2011, while the gap between male and female literacy in rural area has been 27.64 in 2011, whereas the gap between male and female literacy in urban area has been 18.26 in 2011. In Banaskantha, the total number of schools has increased during last decade. In primary and middle education, most of the schools are administered by local bodies, while in secondary and higher secondary education most of the schools are aided/unaided. In Banaskantha, 87.298% of schools are managed by local bodies and 78.01% of schools possess government buildings. The network of schools in Banaskantha indicate that majority (92.18%) of schools are in rural area. Banaskantha has 55.72% of schools with primary/upper primary sections and 41.50% of school are into only primary education.
In Banaskantha, most of the schools have pucca buildings with classrooms in good condition. Nearly 10% to 12% of classrooms in Danta, Tharad and Vav respectively require major repair. However, new class rooms are required in almost all talukas of Banaskantha. Moreover, Banaskantha needs to prioritize the provision of computers and book banks. Especially schools in Bhabhar, Danta, Deodar and Kankrej talukas needs to be provided

ix
computers, while schools in Danta, Dhanera and Vav talukas needs to be provided book banks. There are sharp intra-district differentiations within the district in terms of access to computers and book bank. Such differentials between talukas will widen further unless a conscious effort is made to improve the essential infrastructure in schools. Banaskantha has improved on construction of separate girls’ toilets. As far as taluka wise scenario is concerned, almost all the schools in all the talukas except a very few schools in Danta and Dantiwada is yet to provide separate girls’ toilets. However, in Banaskantha 10 out of 12 talukas have 100% schools with separate girls’ toilet. In Banaskantha, most of the schools have drinking water facilities. Provision of drinking water facilities shows improvement in 2013-14 as compared to 2005-06 in all sections and categories of schools in Banaskantha.
Student enrolments in Banaskantha depicts fluctuating trend at primary level, while it maintained relatively steady growth at upper primary level during last decade. The Gross Enrolment Ratio (GER) at primary level for Banaskantha has improved from 121.8 in 2005-06 to 157.91 in 2009-10 and deteriorated to 99.38 in 2013-14. The GER at upper primary level has declined from 95.3 in 2005-06 to 68.56 in 2009-10 and increased to 99.28 in 2013-14. The Net Enrolment Ratio (NER) at primary level for Banaskantha has remained stagnant at 100 between 2005-06 and 2009-10 and declined to 86.98 in 2013-14, while NER at upper primary level has improved from 44.2 in 2005-06 to 50.89 in 2009-10 and 71.01 in 2013-14.There has been a small improvement in girls’ enrolment in primary level and in upper primary level in Banaskantha. The gap between boys and girls enrolment at primary and upper primary level ranges between 0.3% to 15% in Banaskantha.
Class-wise enrolment in the elementary education in Banaskantha from 2005-06 to 2010-11 shows tendency for Class 1 enrolments to decline over successive years and the enrolments to rise successively thereafter in the higher classes. Also the steep decline between Class 1 and Class 2 enrolments occurs every year and thus Class 2 enrolments hover between 75% and 90% of the students enrolled in Class 1 in the previous year. However, the dropout rate in Banaskantha has been declining over the years, but further shrinkage every successive year ranges between 4% and 13% of the remaining transited students, at every stage of higher classes. Such usual pattern in enrolments leads to decline during transition when large number of students initially enrolled drops out of school.
In Banaskantha, the PTR ranges from 29:1 to 38:1 and SCR ranges from 26:1 to 31:1, which is comparatively at par with the national norms specified in Model school criteria. However, almost 15.98% of schools have SCR greater than 40:1 and about 15.83% of schools have PTR greater than 40:1. Furthermore, out of total schools in Amirgadh, Bhabhar, Danta, Deesa, Dhanera, Kankrej, Palanpur and Vav, more than 15% of schools have SCR more than 40:1, while out of total schools in Amirgadh, Dhanera, Tharad and Vav more than 15% of schools have PTR more than 40:1.
In Banaskantha, 9.95% of schools are located within the 1 km, while 51.02% of schools are located within 1 km to 5 km distance and 33.50% of schools are located within 5 km to 10 km, where 5.54% of schools are located beyond 10 km distance from CRC. In Bhabhar, Dantiwada, Deesa, Deodar, Tharad and Vav talukas, more than 35% of schools are located beyond the 5 km distance from CRC. Moreover, Mid –Day meal is provided in almost all the schools of Banaskantha.

x
State Government provides Vidya Laxmi Bonds to the girls enrolled in Class 1 in rural areas and BPL girls in urban areas. The volatility is noticed in the trend of benefeciaries of Vidya Laxmi Bonds between 2003-04 and 2013-14. This indicates fluctuating trend in girls, enrolment in district. Moreover, distribution of uniforms and textbooks has played vital role in encouraging enrolment of students in schools of Banaskantha and regular school health checkups has facilitated better monitoring of school going children in Banaskantha.
Specific efforts for providing primary education to social groups (especially SC and ST) and women in backward talukas should be given greater importance along with the measures to reduce the literacy gap between male and female in Banaskantha. Special efforts should be made not only to enrol the students but to retain them and provide higher education. Drinking water and sanitation being the matter of prime concern in education, availability of such facilities should be ensured by linking it with grants (school development funds) for strict implementation. It is expected that provisions made available under the SSA should be optimally utilized, as it has gained significance in view of the RTE provisions.
Health, Nutrition and Sanitation
Banaskantha district has 450 sub centres and 88 PHCs and 19 CHCs. The provision of health care facilities has special emphasis in tribal area viz. 2 CHCs, 10 PHCs and 86 sub centres are functional in tribal areas. There are 1548, 528 and 710 beds are available in hospitals, PHCs and CHCs respectively. Moreover, 1 district hospital, 1 sub divisional hospital, 102 State Govt. medical institutions, 7 other medical institutions, 7 first referral units, 5 mobile medical units, 19 ambulance and 43 AYUSH health facilities are available in Banaskantha.
As far as health care institutions (Govt, municipality and grant in aid other than panchayat) are concerned in Banaskantha, the number of clinics has grown by 2.92% CAGR, the number of beds has grown by -0.71% CAGR, number of doctors has grown by -0.87% CAGR and number of nurses has grown by -1.78% CAGR between 2003 and 2014. This depicts the lopsided growth in health sector leading to bottleneck in provision of health care services in Banaskantha. However, the problem of vacant posts is evident in class 1 staff under certain medical divisions as compared to class 2 staff across medical divisions in Banaskantha. Prompt efforts are required to fill up the key positions at various levels across the talukas of Banaskantha to ensure the quality of health care services offered in district.
Major diseases prevailing in Banaskantha are Acute Diarrhoeal Disease, Acute Respiratory Infection, Acute Viral Hepatitis, Measles, Malaria P. Falciparum, Malaria P. Vivax, Bacillary Dysentery, Enteric Fever and Fever of Unknown Origin. The cases suffering from Acute Diarrhoeal Disease, Acute Respiratory Infection and Acute Viral Hepatitis have been highly volatile and has increased over time (except in 2014) in Banaskantha. This indicates that the district is highly vulnerable to number of diseases and therefore regular campaigning of prevention of diseases, health care tips and hygiene instructions along with drinking water and sanitation guidelines are required to create the awareness amongst the people.
During last decade, significant change is noticed in maternal health care in Banaskantha. The institutional (Govt. & Private) deliveries have increased from 62.66% in 2007-08 to 95.10 % in 2013-14, while the deliveries at home have declined in Banaskantha between 2007-08 and 2013-14. Moreover it has been observed that CHCs, PHCs and sub centres has played vital

xi
role in deliveries at Govt. institutions, but hospitals has performed remarkably well in serving patients for maternal health care. The deliveries assisted by untrained dais have remarkably gone down and majority of deliveries are assisted by trained dais and ANMs indicating better environment for maternal health care in Banaskantha.
Significant proportion of underweight new born babies persists in Banaskantha between 2006-07 and 2010-11, indicating that prevalence of malnutrition in Banaskantha. As far as nutrition in Anganwadi going children in Banaskantha is concerned, nearly 45% of children were reported undernourished suffering from malnutrition in 2013-14. ICDS scheme in Banaskantha is operational in all the 12 talukas and has 18 clusters. There are more than 3300 operational Anganwadi centers in Banaskantha. The most innovative scheme implemented by ICDS Banaskantha is “Bhagwan No Bhaag” in which milk is provided to the beneficiaries. It has been reported that milk which is a rich nutrition supplement is provided by 1674 Anganwadi centres. It is noteworthy that, 19437 beneficiaries that were under nourished and provide milk by Anganwadi centres and the total number of under nourished beneficiaries decreased to 12323 indicating 36% decline in the number of under nourished cases. However, the infrastructure of Anganwadi, location and efficiency are the matters of concern in Banaskantha.
As far as sanitation of households in Banaskantha is concerned nearly 84.39% of households has sanitation (individual household latrine) facility, while 15.61% of households lack the sanitation facility. The households without individual household sanitation facilities are targeted under total sanitation campaign for providing the sanitation facilities. In Banaskantha 80.52% of target is achieved in provision of household sanitation facilities.
It has been observed that ANC registration remained above 92% of the workload while ANC 3 checkups coverage ranged between 68% and 81% last decade. BCG coverage ranged from 89% to 102%, while DTP 3 coverage hovered between 92% and 97% last decade. DTP booster coverage remained between 83% and 90%, while OPV booster lingered from 83% to 88%. Measles vaccination coverage ranged from 92% to 94% and full immunisation coverage remained between 90% and 93% last decade in Banaskantha. Proper administering at micro level and monitoring the implementation is required, which shall improve the full immunisation coverage in Banaskantha. Considerable efforts are required through community groups, NGOs, religious institutions and other suitable agencies to handle the conservative socio-cultural practices and shift illiterate people to opt for better health care.
Poverty, Food Security and Vulnerability
In Banaskantha, out of the total families covered under socio-economic survey 2002-03 and successive add-on lists 2008-09 and 20013-14, almost 48.61% families turned out to be poor, with the score of 20 or below. Out of total BPL families in Banaskantha, 55.15% families turned out to be very poor with the score ranging from 0 to 16, while 44.84% of BPL families had the score ranging from 17 to 20. Amirgadh, Bhabhar, Danta, Dantiwada, Deodar and Kankrej talukas had more than 50% of BPL families with the score between 0 and 16 (very poor families).
xii
The income level of the BPL families (score 0-20) in Banaskantha, depicts that 73.44% of families have average monthly income below Rs. 500, while 22.56% of families have average monthly income between Rs. 500 and Rs. 1500, whereas, 4.0% of families have average monthly income above Rs. 1500. In Bhabhar, Danta, Deodar, Dhanera, Kankrej, Palanpur, Tharad, Vadgam and Vav talukas had more than 70% of BPL families with average monthly income below Rs. 500. The literacy scenario of BPL families (score 0-20) in Banaskantha indicate that almost 68.45% of families are illiterate, while 31.55% of families are literate. In Amirgadh, Dantiwada, Deodar, Kankraj, Tharad and Vav talukas have more than 70% of families which are illiterate.
The land holding features of BPL families (score 0-20) in Banaskantha reveals that 61.26% of families do not possess land, while only 38.74% of families possess land. Moreover, out of the total BPL families (score 0-20) who possess land, as much as 80.83% of family have less than 1 hectare of unirrigated and 0.5 hectare of irrigated land. In Deesa, Deodar, Kankrej, Palanpur, Vadgam and Vav talukas, more than 60% of BPL families do not possess land. The housing condition of BPL families (score 0-20) in Banaskantha shows that 22.10% of families do not possess housing facilities, while 61.8% of families possess kachha houses and 16.1% of families have half pakka, pakka and city type houses. In Bhabhar, Deesa, Deodar, Dhanera, Kankrej, Palanpur and Vadgam talukas had more than 20% of BPL families that do not possess housing facilities. The sanitation conditions of BPL families (score 0-20) in Banaskantha indicate that as many as 94.71% of families do not possess sanitation facilities, while 4.88% of families use group sanitation facilities and only 0.41% of families have private sanitation facilities. In Amirgadh, Danta, Tharad, Vadgam and Vav talukas, more than 95% of BPL families do not have sanitation facilities.
The conditions of children in BPL families (score 0-20) of Banaskantha depict that in 53.02% of families children are not going to school and working, while in 29.46% of families children are going to school and working, whereas in 17.52% of families children are going to school and not working. In Amirgadh, Danta, Deesa, Deodar, Dhanera, Kankrej, Tharad and Vav talukas, more than 50% of children in BPL families do not go to school and work. The indebtedness dimension of BPL families (score 0-20) of Banaskantha illustrate that 62.88% of families out of total BPL families take debt for daily purpose from informal sources, while 19.99% of families out of total BPL families take debt for production and other purpose from informal sources, whereas 8.93% of families out of total BPL families borrow from institutional agencies and 8.20% of families from total BPL families are not under indebtedness. In Bhabhar, Danta, Deodar, Kankrej and Vadgam talukas, more than 65% of BPL families take debt for daily purpose from informal sources.
The food security in BPL families (score 0-20) of Banaskantha illustrate that 7.14% of families out of total BPL families can manage less than 1 square meal per day for major part of the year, while 13.29% of families out of total BPL families can manage 1 square meal per day, but less than 1 square meal occasionally, whereas 8.02% of families out of total BPL families can manage 1 square meal per day throughout the year, however, 49.40% of families out of total BPL families can manage 2 square meals per day, with occasional shortage. In Bhabhar and Vadgam talukas, more than 10% of BPL families can manage less than 1 square meal per day for major part of the year, while in Bhabhar, Dantiwada, Deodar and Palanpur

xiii
talukas, more than 15% of BPL families can manage 1 square meal per day, but less than 1 square meal occasionally. Out of total ration card holders in 2008-09, 68.15% of card holders were APL card holders, 24.26% of card holders were BPL card holders and 7.59% of card holders were Antodaya card holders, whereas, out of total ration card holders in 2013-14, 62.44% of card holders were APL card holders, 27.18% of card holders were BPL card holders and 10.38% of card holders were Antodaya card holders, which indicates that proportion of BPL and Antodaya card holders has increased compared to APL card holders between 2008-09 and 2013-14 in Banaskantha.
There are 3 Major dams in Banaskantha, viz. Dantiwada, Sipu and Mukteshwar and more than 4000 check dams in Banaskantha. The three projects of Banaskantha are located in the eastern part of Banaskantha and its command area extends up to the north eastern Banaskantha and south eastern Banaskantha and mostly serves Dantiwada, Palanpur, Vadgam, and eastern part of Deesa, and Dhanera and Kankrej. Consequently, talukas of Bhabhar, Deodar, Tharad, Vav totally depend on ground water for irrigation and other purposes. Moreover, western part of Kankrej, Dhanera and Deesa talukas also depend on ground water for irrigation and other purposes. The prevailing distribution of irrigation projects depicts that only 107 out of 1244 villages of Banaskantha are under the command area of these projects, which indicates that merely 8.6% of villages fall under the command area of these projects of Banaskantha. The scanty rainfall and excess pumping results in over exploitation of ground water as well as deterioration in quality. Out of the total sources of water tested for quality of water in Banaskantha between 2008 and 2012, almost 50% of sources turned out to be contaminated. In Amirgadh, Danta, Dantiwada, Deesa, Dhanera, Palanpur and Vadgam talukas, more than 50% of sources of water turned out to be contaminated. Overexploitation of ground water and its depletion is one of the major prevalent issues in Banaskantha. Out of 12 talukas of Banaskantha 5 talukas fall under the category of ‘Over Exploited’ while 2 talukas fall under the category of ‘Critical’.
In Banaskantha still there exists economic and social inequality and consequently there are people who remain vulnerable to various conditions. The overall extent of crime incidents reported in Banaskantha has increased. The total cognizable crime incidents reporting in Banaskantha has expanded at 5.72% CAGR between 2004 and 2010. The major increase in reporting is noticed in the incidents for burglary, theft, robbery and kidnaping in Banaskantha. The reporting of incidents pertaining to crime against women in Banaskantha has increased between 2004 and 2010. This also reflects that due to increasing awareness and literacy the reporting of crime and violence against women have increased in Banaskantha. Over a period, the increasing awareness amongst women is leading to protest against domestic violence. It replicates the wakefulness of women and society towards women dignity and right to live respectful life.

xiv
KEY STATISTICS: BANASKANTHA
Demographic Banaskantha Gujarat
2001 2011 2001 2011 Population 2504244 3120506 50671017 60439692 % Decadal Growth in Population 26.38 24.60 22.66 19.27 % Rural Population 88.99 86.70 62.64 57.40 % Male 51.81 51.61 52.07 52.10 % Female 48.19 48.39 47.93 47.90 % Male (0-6) 9.81 8.62 7.89 6.81 % Female (0-6) 8.89 7.74 6.97 6.06 Sex Ratio (Over All) 930 938 920 919 Sex Ratio (0-6) 907 898 883 890 % Scheduled Cast (SC) Population 10.8 10.5 7.1 6.7 % Scheduled Tribe (ST) Population 8.2 9.1 14.8 14.8 Sex Ratio (SC) 925 934 925 931 Sex Ratio (ST) 946 968 974 981 Male Literacy 66.47 78.15 79.66 85.75 Female Literacy 34.4 51.75 57.8 69.68 Total Literacy 50.97 65.32 69.14 78.03 Male-Female Literacy Gap 32.07 26.40 21.86 16.07 Rural-Urban Literacy Gap 26.64 17.47 20.55 14.60 Population Density 233 290 258 308 Work Participation Ratio 43.6 40.0 41.9 41.0
Agriculture Banaskantha Gujarat
2002-03 2006-07 2002-03 2006-07 % Area under Forest 10.59 10.59 9.85 9.75 % Area not available for cultivation 8.03 8.06 19.95 19.98 % Other Uncultivated Area 7.91 7.93 15.09 15.05 % Fallow Land 3.44 2.61 5.00 3.41 % Net Sown Area 70.03 70.80 50.10 51.80 % Net Sown Area more than once 30.41 23.47 6.10 10.66 % Gross Cropped Area 101.71 94.27 56.51 62.46 Per Capita Net Sown Area 0.29 0.30 0.19 0.19 Cropping Intensity 145.25 133.14 112.79 120.57 % Net Irrigated Area 37.93 40.08 16.19 22.42 % Gross Irrigated Area 46.92 49.54 19.33 28.06 % Net Irrigated Area to Net Sown Area 54.16 56.61 32.32 43.28 % Gross Irrigated Area to Gross Cropped Area 46.13 52.55 34.21 44.93 Irrigation Intensity 123.72 123.59 119.40 125.16 % of Irrigation by Wells to Gross Irrigated Area 99.96 96.93 87.64 79.75

xv
Animal Husbandry Banaskantha Gujarat
2003 2007 2003 2007 Total Livestock 1862318 2164984 22845982 23793513 % Cattle (Cross Breed) 3.28 6.05 2.80 4.80 % Cattle (Indigenous) 23.29 24.44 29.70 28.72 % Buffaloes 38.41 44.12 31.25 36.87 % Goat 17.77 14.29 19.87 19.50
Education Banaskantha Gujarat
2005- 2006
2007- 2008
2009- 2010
2012- 2013
2013- 2014
2005- 2006
2007- 2008
2009- 2010
2012- 2013
2013- 2014
Total Schools 2377 2481 2577 2651 2654 37256 39039 39939 49447 43176
Government Schools (%) 92.85 91.54 91.35 89.90 89.41 87.59 84.82 83.69 81.35 79.81 Private Schools (%) 7.15 8.46 8.65 9.27 9.72 12.41 15.18 16.31 18.56 20.18
Rural Government Schools (%) 90.79 88.84 89.13 87.89 87.11 78.70 76.95 76.09 73.54 72.02 Rural Private Schools (%) 5.13 5.44 5.28 5.62 5.73 6.41 7.16 7.48 7.97 8.76 Schools with Common Toilet (%) 47.75 57.76 47.38 3.51 3.39 57.26 70.65 32.80 5.95 5.73
Schools with Separate Girls Toilet (%) 39.00 46.43 47.73 81.68 72.45 50.17 65.30 42.90 96.09 98.27
Schools with drinking water facility (%) 78.97 81.46 88.36 100 100 80.92 87.19 96.74 99.95 99.98
Total Classrooms 12151 13996 14568 16981 18659 186090 220245 229586 277666 307929 Classrooms in Good Condition (%) 88.91 88.16 81.05 73.53 83.02 82.24 84.87 82.56 85.10 84.00
Total Enrolment 488421 512257 530207 598322 541110 7155000 7662493 7814391 9376963 9228029
Total Enrolment Government (%) 92.18 90.58 89.46 87.94 88.21 84.77 78.72 75.26 70.19 68.53
Total Enrolment Private (%) 7.82 9.42 10.54 10.76 10.61 15.23 21.28 24.74 29.79 31.45
Rural Enrolment Government (%) 88.12 85.83 85.27 83.83 83.92 70.68 65.96 63.23 58.43 56.65
Rural Enrolment Private (%) 4.22 4.55 4.97 4.89 4.76 5.77 7.44 8.71 13.05 14.34 Total Girls 43.29 44.75 44.90 45.07 41.07 46.31 46.36 46.41 46.10 46.05
Gross Enrolment Ratio (Primary) 121.8 153.45 157.91 95.80 99.38 100.3 107.2 109 102.9 101.1
Gross Enrolment Ratio (Upper Primary) 95.3 61.89 68.56 99.35 99.28 49.91 55.9 59.7 104.04 90.9
Net Enrolment Ratio (Primary) 100 100 100 95.75 86.98 78.89 86.3 85.8 99.53 82.0
Net Enrolment Ratio (Upper Primary) 44.2 46.05 50.89 96.87 71.01 36.64 41.0 42.4 98.97 68.4
Teachers Total 12761 14463 14829 19041 18260 206693 234507 243342 302254 309755
Teachers Government School (%) 91.03 89.67 89.14 84.55 83.79 83.71 79.11 76.88 70.98 68.38
Teachers Private School (%) 8.97 10.33 10.86 14.30 15.31 16.29 20.89 23.12 28.88 31.68 Pupil Teacher Ratio 38 35 36 31 30 35 33 32 30.36 29.79
Student Classroom Ratio 40 37 36 35 29 38 35 34 33.05 29.97 Drop Out Rate (I-V) 2.6 5.3 3.7 1.74 2.14 5.13 2.98 2.20 2.04 2.00

xvi
Health Banaskantha Gujarat
2008-09
2010-11
2012-13
2008-09
2010-11
2012- 13
Number of CHCs 14 20 20 273 305 318
Number of PHCs 68 68 81 1084 1114 1158
Chiranjeevi Yojana
% of Normal Delivery 92.41 89.98 89.74 48.82 89.10 86.26
% of LSCS 3.74 4.50 7.19 48.82 6.37 7.82
% of Complicated 3.85 5.52 3.06 2.36 4.53 5.92
National Program for Control of Blindness
% cases served by District Hospital 4.68 5.26 3.54 3.12 3.18 3.18
% cases served by Sub-District Hospital 0.41 0.74 3.50 2.72 2.72 3.25
% cases served by DMU / CMU 2.83 0.00 0.00 0.39 0.37 0.19
% cases served by NGO 26.66 27.47 24.20 37.96 38.76 4.70
% cases served by Private 64.51 65.75 68.74 54.89 52.86 52.24
% cases served by Others 0.92 0.78 0.00 0.93 1.05 1.04
Performance of ANC Registration
% against Workload 83.40 94.03 68.71 87.60 93.11 72.97
% of Early Registration to Total ANC 59.02 59.98 68.71 60.60 66.21 72.97
BCG Immunization
% against Workload 88.43 93.13 87.11 90.67 91.81 91.47
% against Live Birth 102.26 101.72 99.27 106.09 103.64 103.18
DPT 3rd Dose Immunization
% against Workload 83.91 94.41 92.65 84.48 93.13 92.04
% against Live Birth 97.04 97.78 99.19 98.85 99.69 99.41
Measles Immunization
% against Workload 80.94 92.27 91.94 81.36 90.09 91.17
% against Live Birth 93.60 95.57 98.43 95.20 96.43 98.48
Fully Immunized Children
% against Workload 77.40 90.14 93.03 79.14 88.70 90.71
% against Live Birth 89.51 93.02 99.59 92.60 94.94 97.97
Performance of Sterilization
% against Workload 100.27 92.61 94.60 92.89 85.72 83.80
% of NSV to total Sterilization 1.00 0.12 0.00 3.55 2.12 0.70
Incidents of Crime / Violence Registered
Banaskantha Gujarat
2005-2006
2007-2008
2009-2010
2010- 2011
2005-2006
2007-2008
2009-2010
2010- 2011
Total Cognizable Crimes 2085 2527 2872 3014 78316 82133 76102 72396
% Incidents of Murder 1.82 2.02 1.39 1.33 1.37 1.38 1.27 1.50
% Incidents of Dacoity 0.43 0.28 0.49 0.30 0.39 0.33 0.32 0.27
% Incidents of Burglary 8.44 8.07 8.08 6.70 6.55 5.74 5.44 5.39
% Incidents of Theft 15.20 16.78 17.48 17.85 22.88 22.89 24.98 22.69
% Incidents of Robbery 1.06 1.11 1.74 2.02 1.25 1.41 1.85 1.91
% Incidents of Kidnapping 1.15 1.90 3.59 3.09 1.43 1.60 1.89 1.93
% Incidents of Riots 1.25 2.33 1.85 1.73 1.64 1.87 1.74 1.83
% Incidents of Culpable Homicide 0.05 0.00 0.00 0.03 0.03 0.02 0.05 0.06
% Incidents of Counterfeit Coins 0.53 0.24 0.21 0.40 0.40 0.33 0.28 0.37
% of Miscellaneous Incidences 70.07 67.27 65.18 66.56 64.07 64.42 62.18 64.05

xvii
Living Condition Banaskantha Gujarat
2011 2011 Total number of households 561128 12181718
Households by Main Source of Drinking Water (%)
Tap water from treated source 15.91 39.85 Tap water from untreated source 46.09 29.18 Covered well 1.92 2.30 Un-covered well 3.47 4.79 Hand pump 3.88 11.62 Tube well/Borehole 27.03 9.60 Spring/ River/Canal 0.19 0.43 Tank/Pond/Lake 0.02 0.22 Other sources 1.50 2.00
Households by the Condition of Houses Occupied (%)
Good 59.79 67.26 Liveable 36.60 31.21 Dilapidated 3.61 1.54
Households by Predominant Material of Roof of Houses Occupied (%)
Grass/Thatch/Bamboo/Wood/Mud etc. 4.36 1.53 Plastic/Polythene 0.68 0.49 Hand made Tiles 11.61 8.94 Machine made Tiles 37.09 22.55 Burnt Brick 0.23 0.52 Stone/Slate 1.31 3.10 G.I./Metal/Asbestos sheets 22.66 18.89 Concrete 22.00 43.89 Any other material 0.06 0.10
Households by Availability of Bathing Facility & Drainage (%)
Households having bathing facility within the premises 40.83 67.43 Households having Bathroom 30.14 56.46 Households having Enclosure without roof 10.68 10.97 Households not having bathing facility within the premises 59.17 32.57 Waste water outlet connected to Closed drainage 10.25 37.29 Waste water outlet connected to Open drainage 9.07 9.44 Waste water outlet without drainage 80.68 53.27
Households by Main Source of Lighting (%)
Electricity 70.73 90.41 Kerosene 24.05 8.08 Solar energy 0.18 0.13 Other oil 1.44 0.21 Any other 0.60 0.21 No lighting 3.00 0.96

xviii
Table of Content
Preface I Foreword III Acknowledgements V Executive Summary VII Key Statistics XIV Table of Content XVIII List of Tables XX List of Figure XXI List of Boxes XXII List of Maps XXII List of Abbreviations XXIII
1 Introduction in Brief 1-9 1.1 Historical Overview 2 1.2 Location 2 1.3 Administrative Setup 3 1.4 Physical Characteristics 4 1.5 Basic Demographics 4 1.6 Banaskantha in Human Development Ladder of Gujarat 5 1.7 District Human Development Report: Banaskantha 7
1.7.1 Background 7
1.7.2 Objectives 8
1.7.3 Methodology 8
1.7.4 Structure of Report 9
2 Agriculture, Animal Husbandry and Livelihood 11-33 2.1 Introduction 11 2.2 Land Use Pattern 11 2.3 Land Holding Features 12 2.4 Cropping Pattern 13 2.5 Major Crops and Productivity 15 2.6 Irrigation Status and Scope of Irrigation 17 2.7 Livestock in Banaskantha 21 2.8 Livelihood by Agriculture and Animal Husbandry 23 2.9 Schemes and Programs for Agriculture and Animal Husbandry 27 2.10 Success Stories 31 2.11 Summary 32 2.12 Agriculture and Animal Husbandry: Taluka Wise Status of by Radars 33
3 Literacy and Education 39-63 3.1 Introduction 37 3.2 Status of Literacy 37 3.3 School Infrastructure 39 3.4 School Amenities 45 3.5 School Staffing Pattern 48 3.6 Enrolment and Transition 50 3.7 Teaching and Learning Environment 55 3.8 Incentives for Education 57 3.9 Schemes and Programs for Education 58 3.10 Success Stories 60 3.11 Summary 61 3.12 Literacy and Education: Taluka Wise Status of by Radars 62

xix
4 Health, Nutrition and Sanitation 64-89
4.1 Introduction 65 4.2 Health Care Scenario 65 4.3 Health Care Infrastructure Accessibility 66 4.4 Human Resource Availability in Health Care 69 4.5 Health Care Services Offered 72 4.6 Prevalence of Major Diseases 74 4.7 Women and Child Health Care 75 4.8 Nutrition 78 4.9 Drinking Water and Sanitation 81 4.10 Schemes and Programs for Health Care 83 4.11 Success Stories 85 4.12 Summary 88 4.13 Health, Nutrition and Sanitation: Taluka Wise Status of by Radars 89
5 Poverty, Food Security and Vulnerability 90-117
5.1 Introduction 91 5.2 Poverty 91
5.2.1 Income Level 92
5.2.2 Land Holding Features 93
5.2.3 Housing Conditions 94
5.2.4 Sanitation Conditions 95
5.2.5 Literacy Aspects 96
5.2.6 Status of Household Labour Force 97
5.2.7 Means of livelihood 98
5.2.8 Condition of Children 99
5.2.9 Indebtedness Dimension 100
5.2.10 Preference of Assistance 100 5.3 Food Security 101 5.4 Vulnerability 105
5.4.1 Water Management 105
5.4.2 Crime and Violence 107
5.4.3 Condition of Migrants 109
5.4.4 Desertification 109 5.5 Schemes and Programs for Poor and Vulnerable Families 110
5.5.1 Developments in Backward Areas 111
5.5.2 Provision of Employment, Housing and Sanitation 112
5.5.3 Water Resource Developments 114 5.6 Success Stories 115 5.7 Poverty and Food Security: Taluka Wise Status of by Radars 117
6 The Way Ahead 120-125
6.1 Introduction 121 6.2 Issue in Agriculture, Animal Husbandry and Livelihood 121 6.3 Challenges in Literacy and Education 122 6.4 Problems in Health, Nutrition and Sanitation 123 6.5 Concerns in Poverty, Food Security and Vulnerability 125
Bibliography 127-129

xx
List of Tables
1.1 Taluka Wise Villages, Gram Panchayats and Towns 3 1.2 Decadal Growth Dimension of Population in Banaskantha 5 1.3 Gender wise Demographic Features of Banaskantha 5 1.4 Human Development Indices (HDM-1) and Ranking at a Glance 6 1.5 Human Development Indices (GDM-1) and Ranking at a Glance 6 1.6 Human Development Indices (GEI) and Ranking at a Glance 7 1.7 Human Development Indices (HDM-2) and Ranking at a Glance 7 2.1 Taluka wise Land Use Classification (2011) 12 2.2 Taluka wise Operational Holdings 13 2.3 Taluka wise Area (% Hectares) Under Food Crops and Non Food Crops 14 2.4 Productivity of Major Crops (In Million Tons/Hectare) 15 2.5 Taluka wise Cropping Intensity 16 2.6 Taluka wise Irrigation Scenario 19 2.7 Developments in Agricultural Activities 25 2.8 Developments in Animal Husbandry 26 2.9 Animal Husbandry Infrastructure in Banaskantha 30 3.1 Status of Literacy in Banaskantha 37 3.2 Taluka wise Rural and Urban Literacy Rate in Banaskantha 38 3.3 Number of Schools in Banaskantha 39 3.4 Distribution of Schools by Locality and Type (2013-14) 42 3.5 Number of Teachers in Schools of Banaskantha 48 3.6 Compound Annual Growth Rate (CAGR) of Enrolment in Banaskantha 50 3.7 Students Enrolment in Banaskantha 51 3.8 Category Wise Students Enrolment in Banaskantha (2013-14) 52 3.9 Trend in (Class 1 to 5) Flow Rates in Banaskantha 53 3.10 Access to School and Mid Day Meal in Banaskantha (2013-14) 58 3.11 Gunotsav Average Marks and Grade of Schools in Banaskantha 60 3.12 School Health Check Up in Banaskantha (2013-14) 61 4.1 Health Infrastructure in Banaskantha District (2014) 67 4.2 CHCs, PHCs and Sub Centres in Banaskantha (2014) 67 4.3 Medical Staff (Class 1 & 2) Details of Banaskantha (2014) 69 4.4 Medical and Para-Medical Staff at District Hospital, Banaskantha (2014) 70 4.5 Indoor and Outdoor Patients Served (2012-13) 73 4.6 Disease wise Cases Reported in Banaskantha 74 4.7 Taluka wise Water Supply Status in Banaskantha 82 4.8 Students served under School Health Program in Banaskantha (2013-14) 87 5.1 Household Labour Force in BPL List (2013-14) Families in Banaskantha 97 5.2 Indebtedness Dimension of BPL List (2013-14) Families in Banaskantha 100 5.3 Food Security Status of BPL List (2013-14) Families in Banaskantha 102 5.4 Fair Price Shops in Banaskantha (2014) 102 5.5 Water Storage Details (2014) 105 5.6 Incidence of Crimes Reported in Banaskantha 107 5.7 Progress under Various Schemes and Programs in Banaskantha (2013-14) 112 5.8 Swajaldhara / Sector Reform Scheme in Banaskantha 114
xxi
List of Figures 2.1 Taluka Wise Irrigated Area as a % of Cropped Area in Banaskantha 18 2.2 Details of Livestock in Banaskantha 21 2.3 Taluka Wise Livestock in Banaskantha 22 2.4 Taluka Wise Workforce Engaged in Agriculture and Animal Husbandry 24 2.5 Taluka Wise Classification of Total Agricultural Workers in Banaskantha 24 2.6 Achievements of Agriculture Schemes in Banaskantha (2010-11) 28 2.7 Achievements of Veterinary Camps in Banaskantha (2010-11) 30 3.1 Status of Literacy in Banaskantha 38 3.2 Taluka wise Gap in Male and Female Literacy Rate in Banaskantha 39 3.3 Taluka wise distribution of Schools in Banaskantha 40 3.4 Distribution of Schools by Management and Building Status (2013-14) 41 3.5 School Building and Class Rooms in Schools of Banaskantha 43 3.6 Schools with Electricity, Computers and Book Bank (2013-14) 43 3.7 Sanitation Facilities in Schools of Banaskantha 45 3.8 Taluka Wise Sanitation Facilities in Schools of Banaskantha (2013-14) 46 3.9 Drinking Water Facilities in Schools of Banaskantha 47 3.10 Classification of Teachers in in Banaskantha (2013-14) 49 3.11 Taluka wise Distribution of Teachers in Banaskantha (2013-14) 49 3.12 Grade (Class) Wise Trend of Enrolment in Banaskantha 51 3.13 Gap in Boys and Girls Enrolment in Banaskantha (2013-14) 52 3.14 Enrolment, Transition and Dropout in Banaskantha 53 3.15 Taluka Wise Student-Class Ratio and Pupil-Teacher Ratio (2013-14) 55 3.16 Taluka Wise Schools with SCR and PTR More than 40 (2013-14) 56 3.17 Incentives Given to the Students in Schools of Banaskantha 57 3.18 Achievements of Vidya Laxmi Bond Scheme in Banaskantha 59 4.1 Health Care Profile of Banaskantha District 66 4.2 Taluka wise Medical Institutions and Beds Available in Banaskantha 68 4.3 Taluka wise details of Doctors and Nurses in Banaskantha 72 4.4 Taluka wise Patients Admitted in Govt./Govt. Aided Hospitals in Banaskantha 73 4.5 Details of Deliveries at Home and Institutional Deliveries 75 4.6 Classification of Deliveries at Government Institutions and Deliveries at Home 76 4.7 Weight of New Born Children 78 4.8 Nutrition in Anganwadi Going Children 78 4.9 Developments under ICDS in Banaskantha 79 4.10 Beneficiaries of Various Schemes under ICDS in Banaskantha 80 4.11 Taluka wise Sanitation Facility available in Households of Banaskantha 82 4.12 Women and Child Health Care Coverage in Banaskantha 84 4.13 Beneficiaries of Dudh Sanjivani Yojana in Tribal Banaskantha 86 4.14 Percentage of Students covered under School Health Program in Banaskantha 87 5.1 BPL List (2013-14) Families in Banaskantha 92 5.2 Average Monthly Income Level of BPL List (2013-14) Families in Banaskantha 93 5.3 Land Holding Features of BPL List (2013-14) Families in Banaskantha 94 5.4 Housing Condition of BPL List (2013-14) Families in Banaskantha 95 5.5 Sanitation Conditions of BPL List (2013-14) Families in Banaskantha 96 5.6 Literacy Level of BPL List (2013-14) Families in Banaskantha 96 5.7 Livelihood Features of BPL List (2013-14) Families in Banaskantha 98 5.8 Condition of Children in BPL List (2013-14) Families in Banaskantha 99 5.9 Assistance Preference of BPL List (2013-14) Families in Banaskantha 101 5.10 APL, BPL and Antodaya Cards in Banaskantha 103 5.11 Water Quality Profile of Banaskantha 106 5.12 Incidences of Crime and Violence against Women Reported in Banaskantha 108 5.13 Progress made under BRGF Plan in Banaskantha (2013-14) 110 5.14 Preference and Provision of Assistance to BPL Families in Banaskantha 113

xxii
List of Boxes 1.1 Golden Goals of Banaskantha District Administration 8 2.1 Pros and Cons of Shift in Cropping Pattern 14 2.2 Agriculture Management for Raising Productivity 17 2.3 Salinity Issues in Irrigation 19 2.4 Banas Dairy-An Oasis in the Desert 22 2.5 Schemes / Awards by Banas Dairy 27 2.6 Major Schemes and Programs for People in Agriculture Sector 27 2.7 Major Schemes and Programs for People in Animal Husbandry Sector 28 2.8 Success Stories of Agriculture in Banaskantha 31 2.9 Success Stories of Animal Husbandry in Banaskantha 31 2.10 SWOC Analysis for Agriculture and Animal Husbandry in Banaskantha 32 3.1 Infrastructure and Amenities in Schools of Bhabhar and Dhanera 44 3.2 Requirement of Class Rooms in Banaskantha (2014) 45 3.3 Infrastructure and Amenities in Schools of Deesa, Palanpur, Vadgam 47 3.4 Infrastructure and Amenities in Schools of Tribal Area 56 3.5 Schemes and Programs for Education Sector 58 3.6 Kasturba Gandhi Balika Vidyalaya- Manki 60 3.7 SWOC Analysis for Education in Banaskantha 61 4.1 Health Care Facilities at CHCs in Banaskantha 68 4.2 Women Health Care Facilities in Banaskantha 71 4.3 Major Schemes and Programs for Health Care 83 4.4 Performance of Banaskantha in Health Care Compared of Gujarat (2012-13) 85 4.5 Helping Hands: Jani Suraksha / Chiranjivi Yojana 85 4.6 Providing Nutrition: Bhagwan No Bhaag and Dudh Sanjivani Schemes 86 4.7 SWOC Analysis for Health, Nutrition and Sanitation in Banaskantha 88 5.1 Education Facilities for Poor Girls in Tribal Areas of Banaskantha 97 5.2 Desertification in Western Banaskantha 110 5.3 Major Schemes and Programs for BPL Families 110 5.4 Providing Shelter: Indira Awas Yojana in Banaskantha 115 5.5 Multiple Benefits to BPL Families in Banaskantha 115 5.6 Taking on New Roles: Operation and Maintenance by Women 116 5.7 Livelihood Alternatives by Banaskantha DWCRA Mahila SEWA Association 116 5.8 BanasCraft: Transforming Traditional Technique to Trade 116
List of Maps
1.1 Location of Banaskantha District in Gujarat 2 1.2 Taluka Map of Banaskantha District 3 2.1 Taluka wise Land Use Classification of Banaskantha (2011) 20 2.2 Taluka wise Livestock Classification of Banaskantha (2007) 20 3.1 Taluka wise % of schools with distance from CRC in Banaskantha (2013-14) 54 3.2 Taluka wise Changes in % share in Upper Primary Enrolment of Banaskantha 77 4.1 Taluka wise Status of Deliveries in Banaskantha (2013-14) 77 4.2 Taluka Wise Status of Nutrition in Anganwadi Children of Banaskantha (2014) 77 5.1 Taluka wise BPL List (2013-14) Households in Banaskantha 104 5.2 Taluka wise Food Security in Banaskantha (2013-14) 104 5.3 Ground Water Resource Estimation Status of Banaskantha 107

xxiii
List of Abbreviations <1M/DY : Less than 1 Square Meal per day for Major part of the Year 1M/D<1MO : Normally 1 Square Meal per day, but less than 1 Square Meal Occasionally 1M/DY : 1 square meal per day throughout the year
2M/DOS : 2 square meals per day with occasional shortage AFNCL : Adult Female and No Child Labour AHPTP : Associated Herd Progeny Testing Programme AIDS : Acquired Immune Deficiency Syndrome
AML : Adult Male Labour ANC : Ante Natal Care ANM : Auxiliary Nurse Midwife APL : Above Poverty Line
ASHA : Accredited Social Health Activist ATMA : Agricultural Technology Management Agency AYUSH : Department of Ayurveda, Yoga and Naturopathy, Siddha and Homoeopathy BCG : Bacille Calmette Guérin Vaccine for preventing tuberculosis BIA : Borrowing only from Institutional Agencies
BISAG : Bhaskaracharya Institute for Space Applications and Geo-Informatics BPL : Below Poverty Line BRGF : Backward Region Grant Fund BT(COTTON) : Bacillus Thuringiensis Cotton
CAGR : Compound Annual Growth Rate CDPOs : Child Development Project Officers CHCs : Community Health Centers CHMSMER : Commissionerate of Health, Medical Services, Medical Education & Research
CMU : Central Mobile Unit CRC : Cluster Resource Centre DD : Door Darshan DMU : District Mobile Unit DPIS : Daily Purpose from Informal Sources
DPO : District Programme Officer DPT : Diphtheria, Tetanus and Pertussis (Vaccine) DWSC : District Water and Sanitation Committees EFY : Enough Food Throughout The Year
ENT : Ear Nose and Throat (Surgen) FCL : Female and Child Labour FHW : Female Health Workers GDI : Gender Development Index
GDM-1 : Gender Development Measure-1 GEI : Gender Equity Index

xxiv
GER : Gross Enrolment Ratio
GGY : Gokul Gram Yojana GoG : Government of Gujarat GPs : Gram Panchayats GSDP : Gross State Domestic Product
GVT : Government GVTRF : Government Rent Free GWIL : Gujarat Water Infrastructure Limited GWSSB : Gujarat Water Supply and Sewerage Board
HDI : Human Development Index HDM-1 : Human Development Measure-1 HDM-2 : Human Development Measure-2 IAY : Indira Awas Yojana
ICDS : Integrated Child Development Service IDDP : Intensive Dairy Development Project IMR : Infant Mortality Rate IPC : Indian Penal Code IPHS : Indian Public Health Standards.
ISRO : Indian Space Research Organisation IWMP : Integrated Watershed Management Program KGBV : Kasturba Gandhi Balika Vidyalaya LB : Local Body
LHV : Lady Health Visitor LSCS : Lower segment Cesarian Section MM : Modified Mercalli Intensity MMR : Maternal Mortality Rate
MNREGA : Mahatma Gandhi National Rural Employment Guarantee Act MSP : Minimum Support Price NER : Net Enrolment Ratio NFSM : National Food Security Mission NGO : Non Governmental Organization
NGSW : Not Going to School and Working NICU : Neonatal Intensive Care Unit NIPA : No Indebtedness and Possess Assets NSMC : National Swajaldhara Monitoring Committee
NSV : Non Surgical Vasectomy OBC : Other Backward Caste OP : Only Primary OPD : Out Patient Department
OPV : Oral Polio Vaccine OTH : Others

xxv
OUP : Only Upper Primary
P, UP : Primary with Upper Primary P, UP,HS : Primary with Upper Primary, Secondary / Higher Secondary PHC : Primary Health Centre PHN : Public Health Nurse
POPIS : Production Purpose from Informal Source PS : Pani Samitis PTR : Pupil-Teacher Ratio PVT : Private
RKVY : Rastriya Krushi Vikash Yojna RNT : Rented RSVY : Rashtriya Sam Vikas Yojana RTI : Reproductive Tract Infections
SC : Scheduled Caste Score 0-16 : Socio Economic Survey Score for Extreme Poor Families Score 0-20 : Socio Economic Survey Score for Poor Families SCR : Student-Class Ratio SGNW : School Going & Not Working
SGSY : Swarnajayanti Gram Swarojgar Yojana SGW : School Going and Working SHG : Self Help Group SMY : Sakhi Mandal Yojana
SPAY : Sardar Patel Awas Yojana SSA : Sarva Siksha Abhiyan ST : Schedule Tribal STI : Sexually Transmitted Infections
SWOC : Strengths, Weaknesses, Opportunities, Challenges SWSM : State Water and Sanitation Mission TASP : Tribal Area Sub Plan TSC : Total Sanitation Campaign TSWD : Tribal/Social Welfare Department
UNDP : United Nations Development Programme UNIECEF : United Nations International Children's Emergency Fund UP,HS : Upper Primary with Secondary / Higher Secondary VAP : Village Action Plan
VWSC : Village Water and Sanitation Committees WASMO : Water And Sanitation Management Organization WHO : World Health Organization


BANASKANTHA Human Development Report
1
Chapter 1
INTRODUCTION
IN BRIEF

BANASKANTHA Human Development Report
2
Chapter 1
INTRODUCTION IN BRIEF 1.1 Historical Overview
Banaskantha district obtained it name from words ‘Banas’ and ‘Kantha’, which means bank of river Banas. Banaskantha region was ruled by several Kings and Navabs in ancient times. Palanpur, Vav, Tharad, Danta, Deodar, Thara, Varohi and Shihori happened to be the princely states in ancient times. Palanpur and Danta were reputed princely states, whose history dates back to 15th Century. Banaskantha region witnessed the rulers like Maurayas, Guptas, Chavadas, Greeks, Mugals, Marathas and British. After the independence of India, all the princely states in the region of Banaskantha were incorporated in the Indian union and Banaskantha became the integral part of the Mumbai state. Since 1st May 1960, on separation of Gujarat from Mumbai state, Banaskantha region became an integral part (Banaskantha district) of Gujarat state. In 1997, Banaskantha district was restructured and Patan district was carved out from the Banaskantha district (Census of India, 2001).
1.2 Location
The Banaskantha district is located between the parallels of 23°. 49’ and 24°. 42’ North Latitude and the meridians of 71°.1’ and 73°.0’ East Longitude situated in the northern part of Gujarat. The Banaskantha district covers the geographical area of 10,757 sq. km and ranks 4th in terms of area in the state. The district is positioned on the west bank of Banas River which runs through the valley between Mount Abu and Aravalli Range, entering into the plains of Gujarat in this region and flowing towards the little Desert of Kutch. The district is bounded by Rajasthan in the north, Sabarkantha district in east, Kutch district in west and Patan and Mehsana districts in the south. The major rivers that flow through the Banaskantha district are Banas and Saraswati. National Highway 15 connects the district with Kutch, Rajasthan and Punjab, while National Highway 14 connects the district with Patan and Rajasthan. State Highway 7 connects the district to Ahmedabad and Patan, whereas other state highways passing through the district are 9, 41, 54, 56, 63, 72, 127, 128, 129, 130 and 132 linking it most parts of the state. Palanpur is the largest railway Junction of the district and connects the Mumbai-Ahmedabad-Jaipur-Delhi corridor.
Map 1.1: Location of Banaskantha District in Gujarat

BANASKANTHA Human Development Report
3
Map 1.2: Taluka Map of Banaskantha District
1.3 Administrative Setup
For the administrative purpose, Gujarat has a three-tier arrangement; Gram Panchayat, Taluka Panchayat and District Panchayat. Banaskantha district is divided into 12 talukas viz. Amirgadh, Bhabhar, Danta, Dantiwada, Deesa, Deodar, Dhanera, Kankrej, Palanpur, Tharad, Vadgam, and Vav. In 1997, Government of Gujarat (GoG), vide Notification No. GHM-97-84-M-PFR-1097-L restructured Banaskantha district by merging Radhanpur and Santalpur talukas with newly formed Patan district, however, 3 new talukas viz. Amirgadh, Bhabhar and Dantiwada talukas were created from the remaining talukas of Banaskantha (Census of India, 2001). These 12 talukas all together consists of 1249 villages, 783 gram panchayats and 6 municipal towns. The taluka wise administrative setup details are shown in Table 1.1.
Table 1.1: Taluka Wise Villages, Gram Panchayats and Towns
Taluka / District
Villages Gram/Village Panchayats Municipal Towns In-Habited Un-Habited Group Independent Total
Amirgadh 69 19 09 28 Bhabhar 53 07 34 41 Bhabhar Danta 181 3 40 13 53 Dantiwada 54 13 18 31 Deesa 150 24 101 125 Deesa Deodar 71 13 40 53 Dhanera 80 22 16 38 Dhanera Kankrej 106 17 59 76 Thara Palanpur 116 2 14 85 99 Palanpur Tharad 134 36 46 82 Tharad Vadgam 110 20 60 80 Vav 120 1 32 45 77 Banaskantha 1244 6 257 526 783 6
Source: District Statistics Office, Banaskantha (2009)
Palanpur
Vadgam
DeesaAmirgadh
Danta
Dhanera
Deodar
Kankrej
Vav
TharadDantiwada
Bhabhar
PatanDistrict
MehsanaDistrict
SabarKanthaDistrict
Kutch District
Rajasthan
scale
BANASKANTHA Human Development Report
4
Danta taluka has highest number of in-habited villages (181) and group Gram Panchayats (40), while Bhabhar taluka has least number of in-habited villages (53) and group Gram Panchayats (07). Deesa taluka has highest number of independent Gram Panchayats (101) and total Gram Panchayats (125). Amirgadh taluka has least number of independent Gram Panchayats (09) and total Gram Panchayats (28). Moreover, there are 6 towns with municipalities viz. Tharad, Dhanera, Palanpur, Deesa, Bhabhar and Thara (Kankrej) in Banaskantha district. Furthermore, Banaskantha constituency is the Lok Sabha (parliamentary) constituency for the district and there are seven Vidhan Sabha (legislative assembly) segments in Banaskantha viz. Vav, Tharad, Dhanera, Danta, Palanpur, Deesa and Deodar.
1.4 Physical Characteristics
Geologically the area has different type of geological formation from Archean to recent Alluvium. The central port of Banaskantha has high potential for groundwater development, while in the eastern part of district recharge is very negligible due to hard and massive granite formation. The scanty rainfall and excess pumping results in over exploitation of ground water as well as deterioration in quality. The ground water conditions in the north and north-eastern part, where rock encounters at shallow depth, is not feasible for deep tube wells because of less permeable formation. Dhanera area is feasible for shallow to deep tube-wells. Central part of Banaskantha district is feasible for deep tube wells. In western part of Banaskantha, the upper aquifers are saline but the quality of ground water improves with depth in the Deodar, Bhabhar, Tharad and Kankrej talukas, however, the Vav taluka which is near to little Desert of Kutch is highly saline and not feasible for development of Groundwater sources. The entire region of Banaskantha district falls into seismic zone IV, pertaining to an area with earthquakes corresponding to intensities of V to VI of Modified-Mercalli-Intensity (MM) scale.
Banas, Arjuni, Saraswati, Sipu, Balaram, Sabarmati, Khari, Khapra. Kalari, Gujudi, Dholka, Umardashi, Chekaria, Selvan, Rel, Ravi and Sirinala Rivers passes through the Banaskantha district. The Banas River originates from Dhebar Lake in Udaipur hills of Rajasthan, passes through Banaskantha and enters into the little Desert of Kutch. Total length of Banas River is 142 km in the district. The origin of Arjuni River is in the hills of Ambaji and meets Saraswati River. The length of the Arjuni River is 42 km in the district. The Sipu River originates from Himaj hills of Sihori in the east and meets the River Banas near Bhadath and Chhota Ranpuravas. The length of this River is 32 km in the district. The River Balaram originates from north-east hills and meets Banas River. The length of this River is 32 km in the district. The River Saraswati originates from Mahi Kantha hills near Bramanvada in south-east of Vadgam taluka. It enters into the little desert of Kutch. The length of Saraswati River is 52 km in the district. All these Rivers have water only in monsoon, while all the Rivers dry up after monsoon. There are few lakes in the district viz. Ganga Sagar and Man Sarovar near in palanpur taluka and Dantiwada Lake near Dantiwada dam in Dantiwada taluka.
1.5 Basic Demographics
As per the abstracts of Census of India (2011) the total population of Banaskantha increased from 2,504,244 in 2001 to 3,120,506 in 2011 reporting a decadal growth of 24.61%. In 2001, Banaskantha shared 4.94% of population of Gujarat, while in 2011, Banaskantha shared 5.16% of the state population and maintained 5th rank in terms of population in Gujarat in 2001 and 2011. The decadal growth dimension of population is shown in Table 1.2.

BANASKANTHA Human Development Report
5
Table 1.2: Decadal Growth Dimension of Population in Banaskantha
% Decadal Growth 2001-2011 Sex Ratio Urbanisation Work Participation
Population Male Female 2001 2011 2001 2011 2001 2011 Amirgadh 30.87 28.67 33.21 939 972 0.00 0.00 39.7 36.11 Bhabhar 26.20 25.66 26.79 919 928 0.00 17.78 45.6 44.43 Danta 29.69 28.38 31.09 938 958 7.90 7.90 43.2 39.35 Dantiwada 31.68 31.01 32.42 915 925 0.00 0.00 41.0 37.99 Deesa 28.33 27.58 29.14 923 934 17.21 19.75 42.4 39.53 Deodar 21.54 21.35 21.74 928 931 0.00 8.38 45.2 39.92 Dhanera 27.36 26.74 28.03 921 931 12.24 12.82 43.8 40.14 Kankrej 22.10 21.77 22.46 924 929 0.00 6.55 45.7 44.24 Palanpur 15.25 14.99 15.53 933 937 35.05 36.52 37.2 33.90 Tharad 29.31 28.81 29.85 927 935 9.01 8.54 51.6 44.10 Vadgam 16.67 16.47 16.87 962 966 0.00 3.49 39.6 37.12 Vav 27.37 28.04 26.65 931 921 0.00 0.00 51.6 46.11 Banaskantha 24.61 24.12 25.13 930 938 11.00 13.30 43.6 40.01
Source: Census of India (2011)
The sex ratio in Banaskantha has marginally improved from 930 females per 1000 males in 2001 to 938 females per 1000 males in 2011. However, the sex ratio (0-6 age group) in the district worsened from 907 females per 1000 males in 2001 to 898 females per 1000 males in 2011. Furthermore, the urbanization has increased from 11% in 2001 to 13.30% in 2011. The overall literacy rate has increased from 50.97 in 2001 to 65.32 in 2011. The ranking of Banaskantha in terms of sex ratio has improved from 16th in 2001 to 13th in 2011, while the ranking in terms of sex ratio (0-6 age group) has deteriorated from 10th in 2001 to 14th in 2011. Banaskantha ranked second last in terms of overall literacy, third last in terms of male literacy and second last in terms of female literacy in Gujarat in 2001 as well as in 2011. The gender wise demographic features of Banaskantha are presented in Table 1.3.
Table 1.3: Gender wise Demographic Features of Banaskantha % Male % Female % Male (0-6) % Female (0-6) Male Literacy Female Literacy
2001 2011 2001 2011 2001 2011 2001 2011 2001 2011 2001 2011 51.81 51.60 48.19 48.40 9.81 8.61 8.89 7.73 66.47 78.15 34.4 51.75
Source: Census of India (2011)
The density of population in Banaskantha has increased from 233 to 290 per square kilometer from 2001 to 2011 respectively. In terms of population density Banaskantha ranked 17th in Gujarat in 2001, while it ranked 15th in Gujarat as per the Census 2011.
1.6 Banaskantha in Human Development Ladder of Gujarat
Gujarat Human Development report published in 2004 captured human development attainments of the districts in the State. The Human Development Index (HDI) was derived from the 4 components viz. (1) Human Development Measure-1 (HDM-1) that measures opportunities / capabilities of individuals; (2) Gender Development Measure-1 (GDM-1) that measures the level of opportunities / capabilities available to women in relation to men; (3) Gender Equity Index (GEI) that measures gender inequality per se, independent of level of development and (4) Human Development Measure-2 (HDM-2) measures macro level capabilities and opportunities available to both men and women and includes macro capabilities relating to macro processes and structures. Accordingly the 25 (now 26)

BANASKANTHA Human Development Report
6
districts of Gujarat were ranked. Banaskantha was placed at a lowest rank of human development. The HDI value and Gender Development Index (GDI) value of Banaskantha turned out to be 0.312 and 0.341 respectively and ranked 24th amongst all the 25 districts of Gujarat as compared to the HDI value and GDI value of Gujarat that turned out to be 0.565 and 0.454 respectively and ranked 6th amongst the 15 major states of India.
In terms of HDM-1, Banaskantha was ranked 25th in Income and Education with corresponding index values 0.011 and 0.484, while it ranked 24th in Health and 22nd in Housing with the index values 0.440 and 0.169 respectively. However, Banaskantha ranked 6th in Participation with the index value 0.473. The overall HDM-1 rank of district was 23rd with the index value 0.316. This indicates that Banaskantha lags far behind other districts in terms of HDM-1 indicators except participation. Moreover, it is revealed from the Table 1.4 that the index values for Income, Education, Health and Housing in Banaskantha district are much lower than the state average indices pertaining to HDM-1.
Table 1.4: Human Development Indices (HDM-1) and Ranking at a Glance
Indicators Income Education Health Housing Participation HDM-1 HDI Banaskantha Index 2001 0.011 0.484 0.440 0.169 0.473 0.316 0.312 Gujarat Index 2001 0.241 0.744 0.710 0.266 0.434 0.479 0.565 Banaskantha Rank 2001 25 25 24 22 6 23 24 Gujarat Rank 2001 6 6 9 2 10 6 6
Source: Hirway and Mahadevia (2004)
In terms of GDM-1, Banaskantha was ranked 25th in Education and Health with corresponding index values 0.437 and 0.339, while it ranked 22nd in Housing and 14th in Income with the index values 0.169 and 0.186 respectively. However, Banaskantha ranked 6th in Participation with the index value 0.421. The overall GDM-1 rank of Banaskantha was 23rd with the index value 0.322. This depicts that Banaskantha lags much behind other districts in terms of GDM-1 indicators except Participation. Moreover, it is revealed from the Table 1.5 that the index values for Income, Education, Health and Housing in Banaskantha district are much lower than the state average indices pertaining to GDM-1.
Table 1.5: Human Development Indices (GDM-1) and Ranking at a Glance
Indicators Income Education Health Housing Participation GDM-1 GDI Banaskantha Index 2001 0.186 0.437 0.399 0.169 0.421 0.322 0.341 Gujarat Index 2001 0.208 0.736 0.710 0.266 0.348 0.454 0.551 Banaskantha Rank 2001 14 25 25 22 6 23 24 Gujarat Rank 2001 4 6 9 2 12 6 6
Source: Hirway and Mahadevia (2004)
In terms of GEI, Banaskantha was ranked 25th in Education and Health with corresponding index values 0.527 and 0.752, while it ranked 14th in Income with the index values 0.706. However, Banaskantha ranked 10th in Participation with the index value 0.405. The overall GEI rank of Banaskantha was 25th with the index value 0.597. This reveals that Banaskantha lags drastically behind other districts in terms of GEI indicators except participation. Table 1.6 shows the index and rank of Banaskantha and Gujarat for indicators of GDM-1.

BANASKANTHA Human Development Report
7
Table 1.6: Human Development Indices (GEI) and Ranking at a Glance
Indicators Income Education Health Participation GEI Banaskantha Index 2001 0.706 0.527 0.752 0.405 0.597 Gujarat Index 2001 0.509 0.804 1.055 0.358 0.682 Banaskantha Rank 2001 14 25 25 10 25 Gujarat Rank 2001 4 9 8 10 8
Source: Hirway and Mahadevia (2004)
In terms of HDM-2, Banaskantha was ranked 21st in Environment, 18th in Patriarchy and 16th in Basic Services with the index values 0.296, 0.548 and 0.334 respectively. However, Banaskantha ranked 9th in Regional Equality with the index value 0.711. The overall HDM-2 rank of Banaskantha was 21st with the index value 0.472. This exhibits that Banaskantha lags considerably behind other districts in terms of GEI indicators except regional equality. Table 1.7 presents the index and rank of Banaskantha and Gujarat for indicators of HDM-2.
Table 1.7: Human Development Indices (HDM-2) and Ranking at a Glance
Indicators Environment Basic Services Regional Equality Patriarchy HDM-2 Banaskantha Index 2001 0.296 0.334 0.711 0.548 0.472 Gujarat Index 2001 0.315 0.692 0.769 0.563 0.585 Banaskantha Rank 2001 21 16 9 18 21 Gujarat Rank 2001 13 2 9 9 6
Source: Hirway and Mahadevia (2004)
1.7 District Human Development Report: Banaskantha
1.7.1 Background
Since the inception of Gujarat as a separate state in 1960, certain regions in the state have been identified as less developed. Banaskantha district in the north Gujarat region is one of them. Considering the variation in the intra-district socio-economic conditions, the Govt. of Gujarat in 1966 opted for taluka as a unit of identifying backwardness in line with the recommendations of the Planning Commission. In this context, 7 talukas of Banaskantha district were declared as backward. In 1966, Banaskantha district shared 12.5% of backward talukas of the state. Hathi Committee declared 5 talukas of Banaskantha district as economically backward due to the fact that Banaskantha district shared highest number of backward talukas (20%) of the state (GoG, 1971), while on the basis of selected indicators viz. agriculture, urbanisation, industries, infrastructure, transport, education and health Dr. I. G. Patel Committee declared 4 talukas of Banaskantha district as backward sharing 16% of backward talukas of the state (GoG, 1984). According to the report of the committee to study backwardness of talukas of Gujarat (GoG, 2005) on the basis of group indicators (levels of living, economic indicators, infrastructural indicators and social development indicators), out of 12 talukas of Banaskantha district, 6 talukas were included amongst the 50 most backward talukas of state, while altogether 9 out of 12 talukas were included amongst the 100 most backward talukas of state. This depicts that over a period of past 5 decades, Banaskantha district have remained backward with reference to various indicators. It implies that not only the poor socio-economic conditions but also the poor human development conditions of the district has played significant role in the backwardness of the district.
BANASKANTHA Human Development Report
8
1.7.2 Objectives
To understand the present state of human development in different dimensions at the district and at the inter-taluka levels of the Banaskantha district.
To study the major challenges pertaining to human development in Talukas of Banaskantha.
To discover the inter Taluka gaps pertaining to human development aspects in Banaskantha.
To identify the constraints and propose remedy to translate the development programs into action in Banaskantha.
To understand the priority area of development in Banaskantha.
1.7.3 Methodology
The procedure and methodologies of measuring human development are continuously evolving and are being and refined since the introduction of Human Development concept. Due to the all-inclusive nature of human development and its significance, it is relatively complex to appraise the progress in human development. Given the availability of secondary data required for analyzing the human development in Banaskantha, the inter taluka comparisons of socio-economic variables has been applied. The situation of human development across talukas (wherever possible) has been studied with reference to socioeconomic variables. The preparation of DHDR Banaskantha done in a participatory manner involving concerned line departments of district administration, NGOs, academia, women’s groups and people’s representatives. The workshops at the district level, discussions at taluka level and sub-committee meetings were organized for a open consultations with the concerned stakeholders. The DHDR Banaskantha is based on various data sources. The governmental as well as nongovernmental data sources have been consulted. The governmental sources include the departments such as agriculture, animal husbandry, irrigation, health, education, rural development, and so on. The data were also collected from the concerned branches of District Panchayat and Taluka Panchayats. The published as well as unpublished data and reports of Directorate of Economics and Statistics have been used. The nongovernmental database includes concerned research reports and information from NGOs. However, field studies have been carried out and focus group discussions were undertaken to review the schemes and programs.
Box 1.1: Golden Goals of Banaskantha District Administration
Gujarat state was formed on 1st May 1960 after its split from Bombay State (at present Maharashtra). The state celebrated 50 years of vibrant journey during 2010-11 as a Golden Jubilee year. At this juncture various activities were undertaken under the umbrella of “Golden Gujarat / Swarnim Gujarat”. Citizens, Government and agencies pledge for contribution in the development of Gujarat. The Golden Goals of Banaskantha District Administration are as follows.
• Water Management by Drip, Sprinkle, Farm Ponds, Check Dams and other Methods. • Provision of Plots and Houses to Very Poor Households. • Integrated and Large Scale Tree Plantation Movement. • Emphasize and Implement Child Health Care. • To elevate the status of health by National Rural Health Mission. • Complementing improvements in health and hygiene by means of Total Sanitation
Campaign and Nirmal Gujarat activities. • To get liberated from the evil of (female) foeticide • Promoting Girl Education and Women Empowerment
Source: District Collector Office, Banaskantha (2011)

BANASKANTHA Human Development Report
9
1.7.4 Structure of Report
For analytical convenience the report has been organized into six chapters.
Chapter 1: Introduction in Brief; is introductory and gives an overview of Banaskantha district. It discusses the historical, location, administrative, physical and demographic features of Banaskantha. The chapter highlights the position of Banaskantha in human development ladder of Gujarat.
Chapter 2: Agriculture, Animal Husbandry and Livelihood; discusses land use pattern, land holding features, cropping pattern, major crops and productivity, livestock in Banaskantha, livelihood by agriculture and animal husbandry, schemes and programs for agriculture and animal husbandry, success stories and status of talukas in pertaining to agriculture and animal husbandry in Banaskantha.
Chapter 3: Literacy and Education; reviews the status of literacy, literacy gaps, school infrastructure and amenities, staffing pattern, enrolment and transition pattern, teaching and learning environment, incentives for education, schemes and programs in education, success stories and status of talukas pertaining to education in Banaskantha.
Chapter 4: Health, Nutrition and Sanitation; deals with health care scenario in Banaskantha. It studies health care infrastructure accessibility, human resource availability in health care, health care services offered, prevalence of major diseases, women and child health care, nutrition, drinking water and sanitation, schemes and programs for health care, success stories and status of talukas pertaining to health, nutrition and sanitation in Banaskantha.
Chapter 5: Poverty, Food Security and Vulnerability; analyses aspects of poverty (including income level, housing conditions, sanitation conditions, literacy aspects, status of household labour force, means of livelihood, condition of children, etc), aspects of food security as well as vulnerability, programs for BPL and vulnerable groups, success stories and status of talukas on poverty, food security and vulnerability in Banaskantha.
Chapter 6: The Way Ahead; discusses the issues of major concern in Banaskantha and highlights the possible actions to deal with the issues for betterment in human development.

BANASKANTHA Human Development Report
10
Chapter 2
AGRICULTURE,
ANIMAL HUSBANDRY
AND LIVELIHOOD

BANASKANTHA Human Development Report
11
Chapter 2
AGRICULTURE, ANIMAL HUSBANDRY AND LIVELIHOOD
2.1 Introduction
The primary sector, including agriculture and animal husbandry holds significant position in the economy of Banaskantha district. Since majority of the workforce is engaged in this sector, it is important that this sector develops to ensure sustainable earnings to the people engaged in the primary sector. Well-developed agriculture, establishes strong linkages between agriculture and the rest of the economy, which helps agricultural population to access higher incomes and better opportunities for human development. The animal husbandry also plays vital role in providing nutritive food and supplementary income to the economically weaker section of society. It offers employment potential, if adopted on a large commercial basis and provides opportunities for woman empowerment in rural area.
Agriculture and allied activities (including animal husbandry) are major source of livelihood in Banaskantha. Almost 66.16% of working population is engaged in agriculture sector out of which 57.57% are cultivators and 42.43% are agricultural labourers. Majority of the cultivators (81.69%) and most of the agricultural labourers (54.57%) are male. The land use pattern in the district has been stagnant over last decade, where nearly 70% of area is under cultivation. Out of total cropped area 45.68% of area is irrigated and 30% of irrigation is shared by food crops and 70% of irrigation is shared by non food crops. The average size of the operational holdings of the district is 2.83 hectare. Agriculture in Banaskantha is dominated by medium farmers (owning 4 to 10 hectares), which shares 39.40% hectares of operational holdings. Banaskantha ranks 1st in volume of cows and buffalos, as well as ranks 1st in average milk yield per day per cow (indigenous) and average milk yield per day per buffalo as well as ranks 1st in total production of milk.
The chapter discusses land use pattern, land holding features, cropping pattern, major crops and productivity, livestock in Banaskantha, livelihood by agriculture and animal husbandry, schemes and programs for agriculture and animal husbandry, success stories and status of talukas in pertaining to agriculture and animal husbandry in Banaskantha.
2.2 Land Use Pattern
Livelihoods are the means that people use to support themselves, to survive and to prosper. It comprises the abilities, assets and activities for a means of living (Chambers and Conway, 1991). Access to various levels and combination of asset has major influence on choice of livelihood options. Land being a vital natural asset, its efficient use is the prerequisite for development as it has greater significance in livelihoods especially for backward agrarian area like Banaskantha where majority of working population is dependent on agriculture.
The total reported area of Banaskantha is about 10 Lakh hectares, of which 10.59% is forest, 5.07% is under non agricultural use and 6.23% is grazing land. However, 71.22% of total reported area is net cropped area and 47.23% of total reported area is irrigated. Geographically, Vav is the biggest taluka sharing 16.36% of district area, while Dantiwada is the smallest taluka sharing 4.00% of area of district. Danta shares maximum forest area (45.82%) of the district, while Deodar, Kankrej and Bhabhar do not share forest at all. Deesa

BANASKANTHA Human Development Report
12
shares largest area (20.59%) under non agricultural use and Deodar shares least area (3.19) under non agricultural use. Deesa shares maximum area (20.28%) under grazing and Danta shares least area (2.36%) under grazing. Vav shares largest net cropped area (17.03%) of the district, while Amirgadh shares least portion (2.36%) of net cropped area of the district. Deesa shares highest proportion (25.08%) of net irrigated area of district, while Amirgadh shares least proportion (2.43%) of net irrigated area of district as shown in Table 2.1.
Table 2.1: Taluka wise Land Use Classification (2011)
Taluka / District
Forest Area
Non- Agricultural
Grazing Land
Net Cropped Area
Net Irrigated Area
Total Area
Dist % Tal % Dist % Tal % Dist % Tal % Dist % Tal % Dist % Tal % Dist % Amirgadh 33.65 61.15 3.83 3.33 4.15 4.44 2.36 28.83 2.43 19.69 5.83 Bhabhar 0.00 0.00 4.31 5.32 4.34 6.58 4.77 82.73 3.55 40.85 4.11 Danta 45.82 59.02 5.04 3.10 2.36 1.79 3.05 26.42 2.60 14.95 8.22 Dantiwada 6.35 16.82 9.00 11.41 3.90 6.08 3.49 62.09 5.42 63.98 4.00 Deesa 0.36 0.27 20.59 7.48 20.28 9.07 15.28 78.07 25.08 84.97 13.94 Deodar 0.00 0.00 3.19 2.85 7.84 8.62 6.80 85.27 10.96 91.17 5.68 Dhanera 0.35 0.45 9.14 5.74 8.45 6.53 9.05 79.90 10.63 62.25 8.07 Kankrej 0.00 0.00 6.12 3.93 7.00 5.53 8.86 79.87 8.34 49.86 7.90 Palanpur 4.96 6.93 8.60 5.75 7.32 6.02 7.94 74.57 11.11 69.22 7.58 Tharad 0.02 0.01 7.36 2.88 15.68 7.56 15.72 86.60 9.64 35.20 12.93 Vadgam 1.19 2.35 6.76 6.36 6.52 7.56 5.65 74.75 7.14 62.68 5.38 Vav 7.30 4.72 16.05 4.97 12.15 4.63 17.03 74.11 3.10 8.95 16.36 Banaskantha 100 10.59 100 5.07 100 6.23 100 71.22 100 47.23 100
Source: Computed from database of District Statistics Office, Banaskantha (2011)
Majority of area in Amirgadh and Danta is forest region, while majority of area in all other talukas is cropped area. More than 70% of area in all the talukas except Amirgadh, Danta and Dantiwada is under cultivation and more than 60% of area in Dantiwada, Deesa, Deodar, Dantiwada, Palanpur and Vadgam is net irrigated area. It is noteworthy that 9 out of 12 talukas in Banaskantha shares greater proportion of net cropped area as compared to district average.
2.3 Land Holding Features
Land holding is the concept which involves operating of land for the purpose of producing agricultural goods (Subedi et al., 2007a). Distribution and ownership of land has greater significance in determining income level. The diversity of livelihoods in agrarian region exists as a result of variation land holdings. The economic wellbeing of agrarian region people is tied-up with amount of land owned by the household. Land is regarded as the means of piling of wealth that also symbolizes social status and political power and hence land being a basic and primary resource, the poor livelihoods is due to poor status of arable land.
Out of total population of Banaskantha, 10.84% belongs to SC, 8.22% belongs to ST and 80.94% belongs to other categories, while out of total operational holdings (in numbers) 5.55% belongs to SC, 4.75% belongs to ST and 89.7% belongs to other categories, whereas out of total operational holdings (in hectares) 4.21% belongs to SC, 3.47% belongs to ST and 92.32% belongs to other categories in Banaskantha as exhibited in Table 2.2.

BANASKANTHA Human Development Report
13
Table 2.2: Taluka wise Operational Holdings
Taluka / District
Total Holdings Average Size (Ha)
SC Holdings ST Holdings Other Holdings (No) (Hectares) (% No) (% Area) (% No) (% Area) (% No) (% Area)
Amirgadh 7543 22503 2.98 2.89 1.87 46.35 37.54 50.76 60.59 Bhabhar 10059 38019 3.78 3.83 3.16 0.01 0.00 96.16 96.83 Danta 13678 20507 1.5 4.12 4.05 42.07 43.04 53.82 52.91 Dantiwada 10693 24619 2.3 3.34 2.13 0.07 0.06 96.59 97.81 Deesa 52557 113772 2.16 5.64 3.79 1.77 1.68 92.59 94.53 Deodar 14323 49667 3.47 5.05 2.99 1.17 0.86 93.78 96.14 Dhanera 20363 67943 3.34 7.29 5.40 3.26 3.07 89.46 91.54 Kankrej 25507 63496 2.49 4.05 2.81 0.12 0.11 95.83 97.07 Palanpur 24974 57373 2.3 3.04 1.73 1.35 1.07 95.61 97.20 Tharad 33216 110476 3.33 5.05 3.61 2.69 2.70 92.26 93.68 Vadgam 20485 40212 1.96 5.32 3.81 0.84 0.67 93.84 95.51 Vav 32077 143406 4.47 10.85 7.58 0.51 0.32 88.64 92.10 Banaskantha 265475 751993 2.83 5.55 4.21 4.75 3.47 89.70 92.32 Source: Computed from database of District Statistics Office, Banaskantha (2011)
Amirgadh and Danta talukas shares majority of ST population of Banaskantha and consequently the Amirgadh and Danta talukas shares majority of ST operational holdings of Banaskantha district and similarly Vav and Dhanera talukas shares majority of SC population of Banaskantha and consequently the Vav and Dhanera talukas shares majority of SC operational holdings of Banaskantha district. However, it is noticed that considering the distribution of population across categories and across the talukas, SC population and ST population shares less operational holdings from the total operational land holdings as compared to the other population that shares the operational land holdings in Banaskantha district. Moreover, when it comes to the operational land holdings in terms of hectares SC population and ST population shares even lesser operational holdings from the total operational land holdings as compared to the other population that shares the operational land holdings in Banaskantha. Agriculture being a major source of livelihood in Banaskantha, the landholding share significantly impacts the standard of living of people in Banaskantha.
2.4 Cropping Pattern
The cropping pattern used on a farm and its interactions with farm resources are significantly determined by the soil characteristics and available technology. Sustainable cropping pattern promotes the cultivation of short duration, less water intensive cash crops combined with horticulture using improved seeds resulting in an increase in income.
Out of the total reported area of Banaskantha more than 70% of area is the net cropped area (under cultivation). More than 80% of reported area in Bhabhar, Deodar and Tharad talukas is under cultivation, while less than 80% but more than 70% of reported area in Deesa, Dhanera, Kankrej, Palanpur, Vadgam and Vav is under cultivation. However, only 25% to 30% of reported area in Amirgadh and Danta is under cultivation.
The proportion of net cropped area (70% to 71%) of the total reported area has remained stagnant during last decade in Banaskantha, but the cropping pattern of the district remained fluctuating during last decade. In 2002-03 food crops were cultivated in 51.99% of cropped area, while the area under food crops increased to 59.31% in 2003-04, whereas, the area

BANASKANTHA Human Development Report
14
under food crops sharply decreased to 49.30% in 2008-09, but the area under food crops sharply increased to 81.85% in 2010-11. Correspondingly, in 2002-03 non food crops were cultivated in 48.01% of cropped area, while the area under non food crops decreased to 40.69% in 2003-04, whereas, the area under non food crops sharply increased to 50.70% in 2008-09, but the area under non food crops sharply declined to 18.15% in 2010-11. However, it has been noticed that more than 50% of cropped area in Amirgadh, Danta, Dantiwada, Tharad and Vav talukas have remained under the cultivation of food crops throughout the decade. Moreover, in Deodar and Dhanera talukas, the majority of cropped area remained under cultivation of non food crops except 2010-11 as depicted in Table 2.3.
Table 2.3: Taluka wise Area (% Hectares) Under Food Crops and Non Food Crops
Taluka / District
% Area 2002-03 % Area 2003-04 % Area 2008-09 % Area 2010-11 Food Crops
Non Food Crops
Food Crops
Non Food Crops
Food Crops
Non Food Crops
Food Crops
Non Food Crops
Amirgadh 66.86 33.14 50.90 49.10 54.72 45.28 77.46 22.54 Bhabhar 45.85 54.15 53.03 46.97 36.18 63.82 81.05 18.95 Danta 81.21 18.79 60.75 39.25 68.51 31.49 84.53 15.47 Dantiwada 51.56 48.44 56.72 43.28 50.19 49.81 74.48 25.52 Deesa 48.70 51.30 51.99 48.01 47.77 52.23 82.50 17.50 Deodar 49.87 50.13 43.21 56.79 16.85 83.15 77.87 22.13 Dhanera 47.65 52.35 41.24 58.76 44.68 55.32 80.88 19.12 Kankrej 42.79 57.21 58.71 41.29 35.75 64.25 83.72 16.28 Palanpur 43.19 56.81 51.31 48.69 54.30 45.70 73.81 26.19 Tharad 56.23 43.77 74.89 25.11 57.61 42.39 85.56 14.44 Vadgam 50.66 49.34 64.10 35.90 49.45 50.55 70.63 29.37 Vav 63.49 36.51 90.97 9.03 70.59 29.41 91.52 8.48 Banaskantha 51.99 48.01 59.31 40.69 49.30 50.70 81.85 18.15
Source: Computed from database of District Statistics Office, Banaskantha (2006-2011).
This scenario indicate volatile trend in area under food crops and non food crops in Banaskantha during last decade and reveals that cropping pattern in Banaskantha has depicted uncertainty and vagueness during last decade. The unpredictable cropping pattern and fluctuating production in food crops and non food crops impose criticality on food security on one hand and assured returns on other hand.
Box 2.1: Pros and Cons of Shift in Cropping Pattern When more land is brought under the cash crop cultivation, there is a shift from subsistence to cash crop production and has enormous effects on rural farmers. Farmers shift from cultivation of food crops to cultivation of cash crops due to the attractive returns in cash crops. When food crops are cultivated, the return are less compared to cash crops, but the part of food crops (grains, pulses) is used for family consumption and sufficient (nutritional) food for consumption is ensured throughout the year. Moreover, at the time of emergency, food crops are sold to meet the exigencies, but when the farmer produce cash crops, the investment is high and farmers sell the produce (cash crops) after harvesting, getting the higher returns. But ultimately farmers have to compromise with the food security and nutrition. In such circumstances, farmers are forced by emergencies to opt for loan in case of unavailability of resources during emergency, leading to uncertainty in the critical time. Source: Field Survey, Deesa (2011)

BANASKANTHA Human Development Report
15
2.5 Major Crops and Productivity
Crop yields are inevitably affected by weather, input quality, input prices, etc. Agricultural productivity is measured as the ratio of agricultural outputs to agricultural inputs. The productivity of a region's farms is important for food sufficiency, growth prospects, income distribution, etc. An increase in a region's agricultural productivity implies a more efficient utilization of scarce resources, which leads to higher incomes from low cost. It can help to alleviate poverty in agrarian regions, where agriculture often employs the greatest portion of the population. As farms become more productive, the wages earned by workers in agriculture also increases and at the same time, food supplies become more stable. Main food grain crops cultivated in Banaskantha are Bajra, Wheat and Maize, while major oil seeds grown in the district are Mustard and Castor, whereas main cash crops cultivated in Bansakantha are Cumin, Cotton, Fennel and Psyllium (Isabgul). On the other hand major vegetables grown in the district are Potato, Tomato, Cabbage and Brinjal. It has been noticed that productivity of main food grain crops (Bajra and wheat) has generally remained lower in Banaskantha compared to state, while the productivity of major cash crops (castor, mustard and cotton) and major vegetables (potato and brinjal) has generally remained higher in Banaskantha compared to state as shown in Table 2.4.
Table 2.4: Productivity of Major Crops (In Million Tons/Hectare)
Major Crops Banaskantha Gujarat
2006-07
2007-08
2008-09
2009-10
2010-11
2006-
07 2007-
08 2008-
09 2009-
10 2010-
11 Wheat 2.50 2.86 2.10 2.75 3.02 2.60 3.01 2.38 2.68 3.16 Bajra 0.79 1.28 1.00 0.94 1.66 1.03 1.42 1.37 1.23 1.72 Maize 1.55 2.70 1.77 1.59 2.18 0.45 1.38 1.44 0.24 1.73 Castor 1.55 2.23 2.16 2.36 2.37 1.80 1.98 1.96 1.97 2.01 Mustard 1.41 1.66 1.14 1.60 1.54 1.37 1.64 1.14 1.58 1.57 Cotton 5.17 3.52 4.06 3.64 3.51 3.32 3.42 2.98 3.00 3.75 Cumin 0.51 0.68 0.42 0.62 0.55 0.49 0.62 0.47 0.54 0.66 Fennel 1.58 1.70 1.93 1.77 1.61 1.58 1.59 1.46 1.51 1.36 Isabgul 0.69 0.49 0.55 0.63 0.74 0.74 0.56 0.57 0.64 0.65 Potato 28.00 30.00 28.00 29.00 31.00 26.95 22.91 25.44 27.58 28.81 Brinjal 21.00 21.00 21.50 24.00 25.00 16.17 17.69 16.72 17.37 17.17 Cabbage 14.00 14.00 15.00 16.00 17.00 17.29 17.23 17.62 18.53 19.63 Tomato 39.00 40.00 42.00 43.00 45.00 23.72 24.00 24.44 24.90 25.22 Cauliflower 13.30 13.50 14.00 15.00 16.00 16.91 18.08 17.37 18.00 18.36
Source: Computed from database of (1) Directorate of Agriculture, Gujarat (2006-2011), (2) Directorate of Horticulture, Gujarat (2006-2011).
The productivity of brinjal, cabbage, tomato and cauliflower has increased, while the productivity of wheat, bajra and cumin has been volatile in Banaskantha. Moreover, it has been noticed that the area under production of mustard, isabgul and fennel has declined over a period of time as well as the production has also declined between 2006 and 2011. On the other hand the production of castor, cotton, potato, tomato, cabbage and brinjal has increased over a period of time with the increase in its area under cultivation between 2006 and 2011. This reflects that cultivation of vegetables and cash crops has been a more lucrative activity

BANASKANTHA Human Development Report
16
(despite volatility) as compared to cultivation of food crops. Moreover, as the larger area in Banaskantha is under the cultivation of food crops, the earnings are largely unpredictable as they are directly associated with the uncertain productivity.
There are two ways to satisfy the increasing food and other agricultural demands of the rising population: either expanding the net area under cultivation or intensifying cropping over the existing area. The net cropped area of Banaskantha has risen only by about 1.7% in last decade indicating less possibility to make any appreciable increase. Thus; raising the cropping intensity is the only viable option left. Cropping intensity refers to rising of a number of crops from the same field during one agriculture year. It can be expressed as Cropping Intensity = (Gross Cropped Area / Net Cropped Area) x 100. Thus, higher cropping intensity means that a higher portion of the net area is being cropped more than once during one agricultural year. The cropping intensity of Banaskantha is shown in Table 2.5.
Table 2.5: Taluka wise Cropping Intensity
Taluka / District
Cropped Area (Hectares) (2002-03)
Cropping Intensity
(2002-03)
Cropped Area (Hectares) (2010-11)
Cropping Intensity
(2010-11) Net Total Net Total Amirgadh 17164 22135 128.96 17560 22724 129.41 Bhabhar 35245 48140 136.59 35510 41445 116.71 Danta 21693 26745 123.29 22698 26402 116.32 Dantiwada 25856 36654 141.76 25950 39696 152.97 Deesa 116029 208221 179.46 113729 202396 177.96 Deodar 63340 94854 149.75 50568 81982 162.12 Dhanera 50068 103372 206.46 67350 99298 147.44 Kankrej 63550 74877 117.82 65907 82375 124.99 Palanpur 58393 86173 147.57 59079 88395 149.62 Tharad 116430 156861 134.73 116990 150888 128.98 Vadgam 41148 66504 161.62 42041 63749 151.64 Vav 122764 125039 101.85 126705 134195 105.91 Banaskantha 731680 1049575 143.45 744087 1033545 138.90
Source: Computed from database of District Statistics Office, Banaskantha (2006-11)
Over a period of time the net cropped area has increased in Banaskantha but due to decline in area cropped more than once, the total cropped area has also declined and the overall cropping intensity in Banaskantha seems to have declined from 143.45 to 138.90 between 2003 and 2011. However it has been noticed that cropping intensity has increased in Amirgadh, Dantiwada, Deodar, Kankrej, Palanpur and Vav talukas, while the cropping intensity has decreased in Bhabhar, Danta, Deesa, Dhanera, Tharad and Vadgam talukas. With the increasing cropping intensity farmers see that there is a greater opportunity to earn their living by farming and are attracted to agriculture either as owners of farms or as labourers. Increase in cropping intensity is often linked with sustainable development to ensure that future generations will also have the resources they will need to live and thrive.

BANASKANTHA Human Development Report
17
Box 2.2: Agriculture Management for Raising Productivity
Farmer: Parthibhai Patel and Partners Farming: Potato, Groundnut, Bajra
Village: Dangiya Taluka: Dantiwada
Mr. Parthibhai Patel and his partners together hold nearly 90 acres of land at Dangiya village of Dantiwada taluka in Banaskantha district. The entire land is irrigated by sprinkler irrigation. Usually 3 crops (Potato in winter, bajri in summer and groundnut in monsoon) are cultivated during the year. There are 25 people working on the farms throughout the year. During plantation and harvesting, labours are hired from nearby locality. Key to his success is as follows: Potato Seeds: CHIPSONA-3 and LR (Jalandhar, Punjab). Sprinkler Irrigation System: Balson Polyplast Pvt. Ltd and Jain Irrigation Systems Ltd. Sprinkler Irrigation Coverage: 40 sprinkler per acre. Cost of Irrigation System: About Rs. 10,000 per Bigha Temperature Maintained: Between 5 and 15 degree centigrade. Fertilizer: NPK, 8 Bags of 50 kg per acre. Equipments: Digger, Planter, Plough Potato Production: More than 20 tons per acre. Customers of Potato: Mccain Foods India Pvt. Ltd, PEPISICO, Balaji Wafers Pvt. Ltd.
According to Mr. Parthibhai provision of water and fertiliser in time gives best production. He has maintained prize and penalty policy for his workers and adopted zero wastage policy for material, water and available electricity by constructing work specific time tables for farm services. He has motivated other farmers in the region to adopt the technology and prosper.
Source: Field Survey, Dangiya (2011)
2.6 Irrigation Status and Scope of Irrigation
Out of the total geographical area of district, about 47% of area is irrigated, accounting nearly 47.75% of the total cropped area. It has been noticed that the share of irrigated area as compared to the total cropped area in Banaskantha has marginally increased during last decade. Amirgadh, Dantiwada, Deesa, Deodar, Dhanera Palanpur and Vadgam has more than half of its cropped area that is irrigated, while Bhabhar, Danta, Kankrej, Tharad and Vav has more than half of its cropped area that is unirrigated as shown in Figure 2.1.

BANASKANTHA Human Development Report
18
Figure 2.1: Taluka Wise Irrigated Area as a % of Cropped Area in Banaskantha
% of Cropped Area Irrigated 2003-04 % of Cropped Area Irrigated 2010-11
Source: Based on database of District Statistics Office, Banaskantha (2003-11)
Proportion of irrigated area to the cropped area has marginally increased in all the talukas except Dhanera in last decade, however, Amirgadh, Danta and Dantiwada witnessed major increase in proportion of irrigated area to the cropped area irrigated cropped area, while Dhanera witnessed major decline in irrigated cropped area. Moreover, it is noticed that out of total area under cultivation of food crops, only 32.70% of area under cultivation of food crops availed irrigation in 2002-03 and out of total area under cultivation of non food crops, about 46.96% of area under cultivation of non food crops availed irrigation in 2002-03. Over a period of time in 2010-11, out of total area under cultivation of food crops, merely 32.46% of area under cultivation of food crops availed irrigation, while out of total area under cultivation of non food crops, about 37.94% of area under cultivation of non food crops availed irrigation in 2010-11. The cultivable area can be irrigated by various sources on the perception that unlimited quantity of water is available. The intensity of irrigation is the percentage of the irrigation proposed to be irrigated annually. Usually the area irrigated during each crop season (Rabi, Kharif, etc) is expressed as a percentage of the cultivable area which represents the intensity of irrigation for the crop season. The percentage of cultivated area under irrigation can be close representation of irrigation intensity, while the percentage of cultivated area unirrigated can be close representation of scope of irrigation.

BANASKANTHA Human Development Report
19
Table 2.6: Taluka wise Irrigation Scenario
Taluka / District
Area under Cultivation (Hectare)
Area under Irrigation (Hectare)
Irrigation Status (% of Area Irrigated)
Area not Under Irrigation (Hectare)
Scope of Irrigation (% of Area
Unirrigated)
Amirgadh 22724 10210 44.93 12514 55.07 Bhabhar 41445 15860 38.27 25585 61.73 Danta 26402 11620 44.01 14782 55.99 Dantiwada 39696 24950 62.85 14746 37.15 Deesa 202396 121200 59.88 81196 40.12 Deodar 81982 52380 63.89 29602 36.11 Dhanera 99298 50790 51.15 48508 48.85 Kankrej 82375 39350 47.77 43025 52.23 Palanpur 88395 52740 59.66 35655 40.34 Tharad 150888 45880 30.41 105008 69.59 Vadgam 63749 33570 52.66 30179 47.34 Vav 134195 13610 10.14 120585 89.86 Banaskantha 1033545 472160 45.68 561385 54.32
Source: Computed from database of District Statistics Office, Banaskantha (2011)
As far as Banaskantha is concerned, only 45.68% of cultivable land is irrigated, while more than 54.32% of cultivable land has scope for further irrigation by various sources. Amirgadh, Bhabhar, Danta, Kankrej, Tharad and Vav has more than 50% areas for further scope of irrigation.
Box 2.3: Salinity Issues in Irrigation
Banaskantha has diversified physiographic features with hilly region as well as sandy plains. Vav, Deodar, Tharad, Deesa and Dhanera falls into sandy region. The scanty rainfall and excess pumping results in over exploitation of ground water as well as deterioration in quality. In western part of Banaskantha, the upper aquifers are saline but the quality of ground water improves with depth in the Deodar, Bhabhar, Tharad and Kankrej talukas, however, the Vav taluka which is near to little Desert of Kutch is highly saline and not feasible for development of Groundwater sources.
Vav taluka is very dry region due to scarcity of water. Moreover, bore wells are not feasible in this region. However, Narmada branch canal construction work is going on to provide water to the region. But farmers of Suigam in Vav taluka opine that soil and land are such that the irrigation would help only in initial phase and later on the problem of salinity will increase further due to irrigation. This is because the soil is already saline at present and irrigation will accumulate salts in the topsoil under irrigation. By means of irrigation the saline water table would rise and bring salts to the soil surface. The problem would be exacerbated due to hot summers because evaporation and plant uptake remove the water, leaving the salt to accumulate in the soil.
According to the farmers of Suigam, the salinity caused by irrigation would decrease agricultural productivity, reduce the quality of groundwater and surface water as well as damage the farms and irrigation equipments.
Source: Field Survey, Suigam (2011)
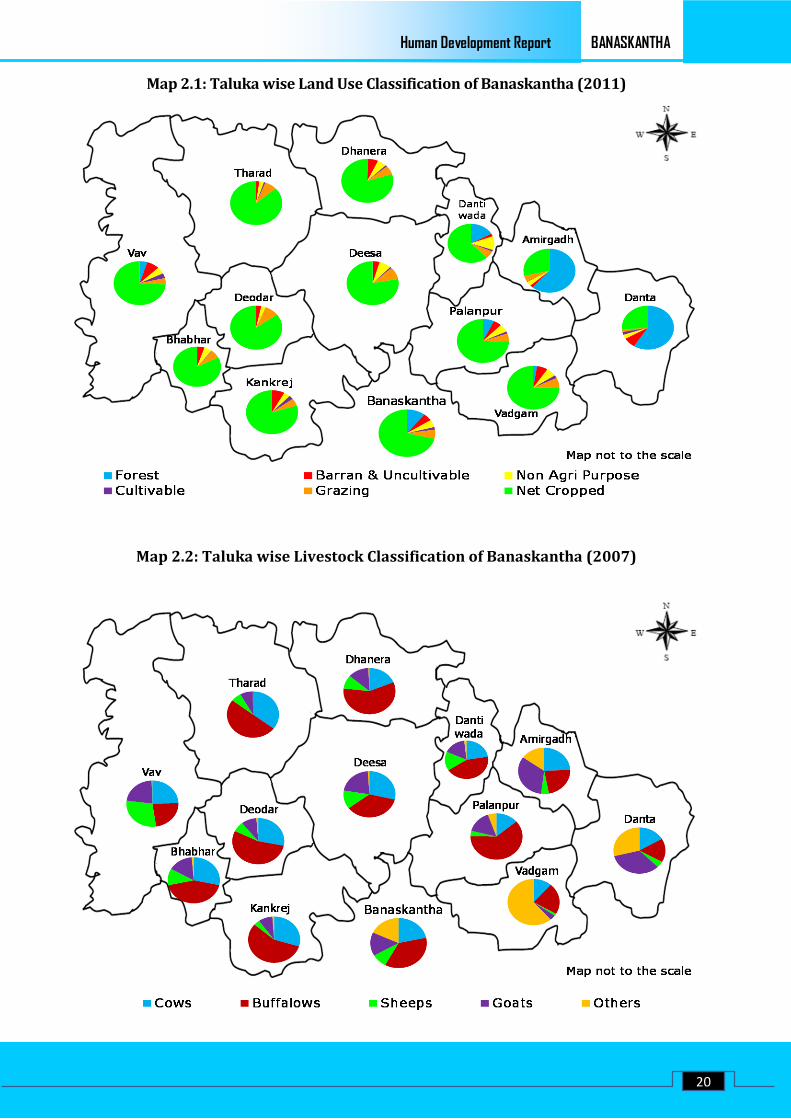
BANASKANTHA Human Development Report
20
Map 2.1: Taluka wise Land Use Classification of Banaskantha (2011)
Map 2.2: Taluka wise Livestock Classification of Banaskantha (2007)

BANASKANTHA Human Development Report
21
2.7 Livestock in Banaskantha
Animal husbandry plays an important role in the socio economic development by providing nutritional food to people, by generating gainful employment in the rural sector, particularly among the landless labourers, small and marginal farmers and women by supplementing their family incomes. Livestock are the best insurance against the vagaries of nature like drought, famine and other natural calamities. Livestock development is a labour intensive activity which happens to be a boon for the small farmers and landless who are mostly unemployed or under-employed.
As per Livestock Census 2007, Banaskantha shares 9.10% of livestock of Gujarat and ranks first in total volume of livestock in state. Moreover, Banaskantha shares 8.28% of cattle and 10.89% of buffaloes of Gujarat and ranks first in volume of cattle and buffaloes in Gujarat. Furthermore, the district also ranks first in total milk production (10.89%0 of Gujarat. This depicts that animal husbandry plays a vital role in the district economy. Significant change is noticed in volume of livestock in Banaskantha during last decade. There has been expansion in the volume of cattle, buffaloes and poultry, while there has been decline in the volume of sheep, goat and other livestock. Interestingly, the volume of cattle, buffalo and poultry has grown by 7.47%, 7.50% and 21.80% CAGR respectively between 2003 and 2007. Nevertheless, the total volume of buffaloes has always remained higher compared to other livestock in Banaskantha during last decade as shown in Figure 2.2.
Figure 2.2: Details of Livestock in Banaskantha
Category Wise Number of Livestock (2003-07) Taluka Wise Number of Livestock (2007)
Source: Based on database of (1) Directorate of Animal Husbandry, Gujarat (2011), (2) Animal Husbandry Office, Banaskantha (2011)
Taluka wise review of livestock shows that Deesa possessed highest volume of livestock, while, Bhabhar possessed least volume of livestock amongst all the talukas of Banaskantha in 2007. It is notable that just five talukas viz. Danta, Deesa, Dhanera, Tharad and Vav together shares 54.33% of the volume of livestock in Banaskantha.

BANASKANTHA Human Development Report
22
It is noteworthy that just four talukas viz. Danta, Deesa, Tharad and Vav together shared nearly half of the volume of cow in Banaskantha as per livestock census 2007. Taluka wise trend in volume of cow show that the volume of cow has increased in all the talukas except Kankrej in last decade. Deesa recorded highest increase in absolute volume of cows, while Tharad recorded highest growth in CAGR (15.33%) in volume of cows between 2003 and 2007. Vav recorded least increase in absolute volume of cows and recorded least growth in CAGR (1.15%) in volume of cows between 2003 and 2007 as shown in Figure 2.3. However, the CAGR in volume of cows in Bhabhar, Danta, Deesa, Deodar, Dhanera, Tharad and Vadgam talukas remained higher than that of district average.
Figure 2.3: Taluka Wise Livestock in Banaskantha
Number of Cows (in 000s) Number of Buffalo (in 000s)
Source: Based on database of District Statistics Office, Banaskantha (2003-07)
It is remarkable that just four talukas viz. Deesa, Dhanera, Kankrej and Tharad together shared nearly half of the volume of buffaloes in Banaskantha as per livestock census 2007. Taluka wise trend in volume of buffaloes show that the volume of buffaloes has increased in all the talukas except Deesa and Palanpur in last decade. Kankrej recorded highest increase in absolute volume of buffaloes, while Dhanera recorded highest growth in CAGR (16.50%) in volume of buffaloes between 2003 and 2007. Amirgadh recorded least increase in absolute volume of buffaloes and Vadgam recorded least growth in CAGR (2.49%) in volume of buffaloes between 2003 and 2007 as shown in Figure 2.3. However, the CAGR in volume of buffaloes in Bhabhar, Danta, Dantiwada, Deesa, Deodar, Dhanera, Kankrej, Tharad and Vav talukas remained higher than that of district average.
Box 2.4: Banas Dairy-An Oasis in the Desert
Majority of population in Banaskantha dwells in rural hinterland and depends on agriculture and animal husbandry. The agriculture in Banaskantha largely depends on monsoons which are uncertain and due to severe shortage of ground water besides poor quality of soil, people mainly depend on animal husbandry. To uplift socio-economic status of rural farmers the co-operative milk union for Banaskantha district was created, and was registered under the Co-operative Act on 31-1-1969 as Banaskantha District Co-operative Milk Producers' Union Limited, Palanpur, known as "BANAS DAIRY".

BANASKANTHA Human Development Report
23
The foundation stone of dairy was laid on 14-1-1971 at 122 acres land near Jagana village under the Operation Flood Programme launched by National Dairy Development Board and the dairy was operational on 7-5-1971 with handling capacity of 1.5 lakh liters of milk per day, which increased more than 16 lakh litres of milk per day.
Out of 1250 villages of Banaskantha district, more than 1200 villages are covered in the ambit of Banas Dairy as village dairy co-operative society. Through these societies the milk is collected from more than 3.1 lakh individual members. Even though the district has recorded lowest literacy rate among women, more than 55000 women are enrolled as members of dairy cooperatives and also play a vital role in managing village level dairy cooperatives.
Almost 1368 dairy cooperatives are fully computerized for milk collection, fat testing and daily payments, which has enhanced administration, productivity and viability of dairy cooperatives. The dairy provides various services like emergency veterinary services, artificial insemination, infertility camp, vaccination camp, mass de-worming programs, selective breeding and disease diagnostic facilities to improve productivity of the animals of producer members.
The bull mother farm, centralized semen collection station, semen processing laboratory and frozen semen bank has also been set up. The union provides financial assistance for purchase of cattle and buffalo to BPL families of tribal community in Amirgadh and Danta Talukas in collaboration with the Government of Gujarat. It is heartening to note that the Union has given direct employment to 1300 persons and indirectly engaged more than 5 lakh people of the district. Banaskantha district ranks 1st in terms of milk production in Gujarat as well as ranks 1st in terms of average yield per indigenous cow (4.230 kg milk daily).
Source: Field Survey, Palanpur (2011)
2.8 Livelihood by Agriculture and Animal Husbandry
More than 66% of workforce of Banaskantha is engaged in agriculture and allied activities (Census, 2011), which depicts major workforce depend on primary sector. More than 70% of workforce in Amirgadh, Bhabhar, Danta, Dantiwada, Kankrej, Tharad and Vav depends on agriculture and allied activities, while 60% to 70% of workforce in Deesa, Deodar and Dhanera are engaged in agriculture and allied activities. This indicated that in majority of talukas, majority of workforce is dependent for livelihood on primary sector. It is noticeable that Palanpur being more urbanised, only 37.19% of working people are engaged in agriculture as shown in Figure 2.4.

BANASKANTHA Human Development Report
24
Figure 2.4: Taluka Wise Workforce Engaged in Agriculture and Animal Husbandry % of Workers Involved in Agriculture (2011) Families Involved in Animal Husbandry (2010)
Source: Based on Census of India (2011), Database of Animal Husbandry Office, Banaskantha (2011)
As far as animal husbandry is concerned, it complements agriculture in Banaskantha. The contribution of livestock products towards the State income is really remarkable because on an average it contributes nearly 5% to the total GSDP (DAH, 2011). The output value of livestock products is considerably higher in arid and semi-arid areas like Banaskantha.
The large number of rural women folk finds good opportunities to work in several operations of animal husbandry. It is noteworthy that Deesa has highest number of families keeping livestock followed by Tharad and Vav talukas.
Out of total population engaged in agriculture and allied activities (Cultivators + Agriculture Labours), about 70.19% of workers are male workers and nearly 29.81% of workers are female workers (Census, 2011). Moreover, about 57.57% of workforce is engaged in cultivating, while 42.43% of workers are agricultural labourers as shown in Figure 2.5.
Figure 2.5: Taluka Wise Classification of Total Agricultural Workers in Banaskantha % of Male and Female Workers in Agriculture (2011) % of Cultivators and Agriculture Labour (2011)
Source: Based on Census of India (2011)

BANASKANTHA Human Development Report
25
In Vadgam, Palanpur, Dhanera, Deodar, Deesa and Dantiwada 70% to 80% of agriculture workers (Cultivators + Agriculture Labours) are male, while in Vav, Tharad, Kankrej, Danta, Bhabhar and Amirgadh almost 60% to 70% of agriculture workers (Cultivators + Agriculture Labours) are male.
This depicts that there are more female workers in agriculture in eastern tribal talukas (Amirgadh and Danta) and western talukas (Vav, Tharad, Bhabhar and Kankrej) as compared to central talukas of Banaskantha which are more prosperous in Agriculture.
Moreover, out of total population engaged in agriculture and allied activities in Banaskantha, about 57.57% of workers are cultivators (who own land and are engaged in effective supervision or direction in cultivation), while 42.43% of workers are Agricultural Labours (who works on another person's land for wages and does not own the land).
More than 50% of agricultural workers in Amirgadh, Kankrej and Vadgam talukas are Agricultural Labours, while 40% to 46% of agricultural workers in Danta, Dantiwada, Deesa, Deodar, Palanpur and Vav talukas are Agricultural Labours; whereas, in Bhabhar, Dhanera and Tharad talukas nearly 30% to 35% of agricultural workers are agricultural labours.
Developments in agricultural activities can be observed from trends in agriculture cooperative societies and its memberships by agriculturists. Cooperative societies in agriculture sector in Banaskantha depicts that not only the number of societies has increased, but the membership in these societies has also increased during last decade.
The agriculture related societies has grown by 14.75% CAGR and it members have grown by 17.30% CAGR between 2003 and 2011, while the agricultural credit societies has grown by 6.02% CAGR and it members have grown by 1.20% CAGR between 2003 and 2011 in Banaskantha, however, the vegetables and fruits societies has declined by 0.47% CAGR and it members declined by 0.35% CAGR between 2003 and 2011 in Banaskantha.
Table 2.7: Developments in Agricultural Activities
Taluka / District
Agricultural Credit Vegetables and Fruits Agriculture Related Societies Members Societies Members Societies Members 0 3 - 1 0 - 0 3 - 1 0 - 0 3 - 1 0 - 0 3 - 1 0 - 0 3 - 1 0 - 0 3 - 1 0 -
Amirgadh 17 19 7532 7740 1 1 80 115 3 3 126 160 Bhabhar 41 67 7240 9550 22 19 1801 889 1 17 45 860 Danta 18 24 10620 11808 1 1 80 115 0 0 0 0 Dantiwada 29 65 6701 9817 2 5 140 289 0 1 0 69 Deesa 169 248 31862 37612 56 44 3050 2390 10 56 447 2774 Deodar 68 121 13460 24742 5 0 270 0 2 11 94 781 Dhanera 80 162 20336 26880 35 41 1790 2317 2 22 98 1162 Kankrej 135 232 21348 28273 47 41 2400 2368 38 64 1751 3284 Palanpur 76 81 19259 19130 6 12 310 724 8 6 334 300 Tharad 99 119 29713 32136 4 3 230 190 2 2 82 113 Vadgam 50 73 14920 17525 7 13 350 846 4 3 168 162 Vav 91 103 24920 26291 0 0 0 0 1 1 45 81 Banaskantha 873 1314 207911 226074 186 180 10501 10243 71 186 3190 9746
Source: Computed from database of District Statistics Office, Banaskantha (2003-11)

BANASKANTHA Human Development Report
26
Highest growth in agriculture related societies and its members are observed in Bhabhar and Dhanera talukas, while major decline in agriculture related societies and its members are noticed in Palanpur and Vadgam talukas during last decade. Dantiwada witnessed highest growth (12.22% CAGR) in agricultural credit societies, while Palanpur experienced least growth (0.91% CAGR) in agricultural credit societies between 2003 and 2011. Whereas, Deodar witnessed highest growth (9.09% CAGR) in members of agricultural credit societies, while Palanpur experienced decline (-0.10% CAGR) in members of agricultural credit societies between 2003 and 2011. However, Dantiwada witnessed highest growth in vegetables and fruits societies and Vadgam witnessed highest growth in members of vegetables and fruits societies between 2003 and 2011, but Deodar taluka experienced major decline in vegetables and fruits societies and its members between 2003 and 2011 as shown in Table 2.7.
Developments in animal husbandry are illustrated from trends in cooperative societies and its membership pertaining to animal husbandry. Cooperative societies in animal husbandry sector in Banaskantha exhibits that number of societies as well as membership in these societies has also increased during last decade in Banaskantha. Deesa shared highest number of animal husbandry societies and highest number of members in animal husbandry societies in Banaskantha between 2003 and 2011, while Palanpur and Amirgadh together shared highest number of milk cooperative societies and highest number of members in milk cooperative societies in Banaskantha between 2003 and 2011. However, Vadgam ranked first in terms of milk production in 2003, while Palanpur and Amirgadh together ranked first in terms of milk production in 2011. The animal husbandry societies has grown by 5.32% CAGR and its members have grown by 5.56% CAGR, while milk cooperative societies have grown by 3.89% CAGR and its members have grown by 8.09% CAGR, where as the milk production has grown drastically by 116.40% CAGR between 2003 and 2011 in Banaskantha. Highest growth in number of animal husbandry societies is observed in Dhanera and Dantiwada talukas, while major decline in number of animal husbandry societies is noticed in Tharad taluka, whereas, highest growth in members of animal husbandry societies is noticed in Vav, Bhabhar and Deodar talukas and major decline in members of animal husbandry societies is found in Tharad and Danta talukas between 2003 and 2011 as shown in Table 2.8.
Table 2.8: Developments in Animal Husbandry Taluka / District
Animal Husbandry Milk Cooperatives Milk Collection (Lakh Litres) Societies Members Societies Members (in 000) 0 3 - 1 0 - 0 3 - 1 0 - 0 3 - 1 0 - 0 3 - 1 0 - 0 3 - 1 0 -
Danta 2 2 136 135 87 113 14.69 22.68 1.68 333.06 Deesa 78 112 4453 6742 157 202 18.28 41.18 3.68 1075.58 Deodar & Bhabhar 31 47 1994 3296 126 157 11.42 26.11 2.49 511.17
Dhanera & Dantiwada 18 32 1203 1950 118 131 18.25 33.78 3.32 1071.09
Kankrej 47 67 3148 3993 79 142 11.71 22.87 2.33 454.12 Palanpur & Amirgadh 9 9 432 625 173 214 41.95 55.94 6.48 1254.03
Tharad 5 3 328 220 104 144 12.73 30.27 2.13 549.51 Vadgam 2 3 138 215 118 123 28.57 38.42 7.08 1242.27 Vav 0 1 0 110 69 121 13.87 24.27 1.17 255.64 Banaskantha 192 276 11832 17286 1031 1347 171.48 295.52 30.36 6746.46 Source: Computed from database of District Statistics Office, Banaskantha (2006-11)

BANASKANTHA Human Development Report
27
On the other hand maximum growth in number of milk cooperative societies is observed in Kankraj and Vav talukas, while least growth in number of milk cooperative societies is noticed in Vadgam taluka, whereas, highest growth in members of milk cooperative societies is noticed in Tharad taluka and least growth in members of milk cooperative societies is found in Palanpur and Amirgadh talukas between 2003 and 2011. Milk production witnessed highest growth of 128.24% CAGR in Dhanera and Dantiwada, while it witnessed least growth of 109.22% CAGR in Vadgam during last decade between 2003 and 2011. Banas Dairy in Banaskantha is a leading cooperative organization having large membership spread almost all over the district and therefore backward and forward strategies linking agriculture and animal husbandry with Banas Dairy could offer still more livelihood options, help in poverty alleviation and promote socioeconomic development.
Box 2.5: Schemes / Awards by Banas Dairy
'Shresth Banas Laxmi Scheme' is run by Banas Dairy. The woman member who pours milk worth of Rs.10 lakh and more is eligible for the entry at district level scheme, while the woman member who pours milk worth of Rs. 5 lakh and more is eligible for the entry at taluka level scheme. The 1st, 2nd and 3rd winners are honoured with the Shresth Banas Laxmi award with the cash prize of Rs. 25000, Rs. 21000 and Rs. 15000 respectively along with the certificate and memento at the district level, while the 1st, 2nd and 3rd winners are honoured the Banas Laxmi award with the cash prize of Rs. 11000, Rs. 7500 and Rs. 5000 respectively along with the certificate and memento at taluka level.
Source: Field Survey, Palanpur (2011)
2.9 Schemes and Programs for Agriculture and Animal Husbandry
Various schemes and programs pertaining to agriculture development are being implemented for farmers. Every year Agriculture Fair is organised by State Government.
Box 2.6: Major Schemes and Programs for People in Agriculture Sector
Schemes / Programs Brief Details of Schemes / Programs National Agriculture Insurance Scheme
To provide insurance coverage / financial support to the farmers in the event of failure of any of insurable notified crop due to natural calamities/pest/diseases.
Farmers Accident Insurance Scheme
To assist the successor of the farmer financially in case of death or disability due to accident.
Schemes for Remunerative Farm Produce Price (MSP)
To ensure the minimum support prices for food crops and additional incentive for selected pulses and cotton.
Farmers Training Center Program To provide access to the knowledge, skills and services in agriculture and allied activities to raise agriculture output and income for socioeconomic stability.
Soil and Water Testing Laboratory Program
To provide free of charge testing facilities to all the farmers under soil health card programme. To provide information of the soil and fertilizers for future crop planning to all the farmers.
AGR-3 Agriculture Support Program in Tribal Area Sub Plan and Dispersed Tribes (TASP)
To facilitate ST farmers in increasing agricultural yield/ income. To provide improved seed, fertilizer, bio-fertilizer organic manure, plant protection equipments, gypsum, extension services, bullock, carts etc. To grant subsidy to cultivators for wells, oil engine/ electric motors, pump sets and pipeline.

BANASKANTHA Human Development Report
28
Schemes / Programs Brief Details of Schemes / Programs AGR-4 Agriculture Support Program for SC Farmers (SCSP)
To uplift the living standard of SC farmers by increasing agricultural production and income. To provide improved seed, fertilizer kits, organic manure, equipments, bullock carts, etc. To grant subsidy to cultivators for construction of new wells, improvement of wells, installation of engine/ motors/pump and pipeline to raise agriculture yield.
AGR-8 Agricultural Technology Management Agency (ATMA)
To promote role of farm women in agriculture and allied fields. To promote farmers as stakeholders in extension. Capacity building of extension workers and farmers. To strengthen research extension farmers linkage.
AGR-23 : Scheme for Integrated Horticulture Development Program
To provide inputs kit for horticulture crops to the BPL farmers to up-lift them. To financially assist farmers for perennial fruit crops. To assist general category farmers to establish new fruit nurseries / develop old fruit nurseries. To financially assist Hi-technology, post-harvest management, marketing and export. To assist establishment of low cost Green Houses.
Source: Compiled from database of Directorate of Agriculture, Gujarat (2011)
Other schemes and programs for agriculture sector are: Rastriya Krushi Vikash Yojna (RKVY), National Food Security Mission (NFSM), AGR-5 (Technology Mission on Cotton), AGR-6 (Technology Mission on Oilseeds, Pulses & Maize), AGR-9 (Work Plan – Macro Management), AGR-17 (National Project on Organic Farming), AGR-18 (AGRISNET), Kisan Credit Card, etc. In Banaskantha, some schemes have achieved more physical targets in less finance, while other schemes have achieved less physical targets in more finance. The RKVY has been out standing compared to other schemes. It is noteworthy that RKVY (Maize) has achieved 100% of physical target with 96.42% of targeted finance, while RKVY has achieved more than 100% (i.e. 171.56%) of physical target with 77.30% of targeted finance, whereas, NFSM (Wheat) has achieved 96.35% of physical target with 65.65% of targeted finance. AGR-6 (Maize) has achieved 55.16% of physical target with 45.02% of targeted finance, while AGR-6 (Oil Seeds) has achieved 94.79% of physical target with 85.39% of targeted finance, whereas AGR-3 (Old) has achieved 39.15% of physical target with 34.17% of targeted finance as shown in Figure 2.6.
Figure 2.6: Achievements of Agriculture Schemes in Banaskantha (2010-11) % Achievement of Physical Target % Achievement of Financial Target
Source: Based on database of District Agriculture Office, Banaskantha (2011)

BANASKANTHA Human Development Report
29
NFSM (Pulse) has achieved just 25.81% of physical target with 70.96% of targeted finance, while AGR-9 has achieved only 59.32% of physical target with 83.23% of targeted finance, whereas AGR-5 has achieved merely 24.35% of physical target with 56.28% of targeted finance. Moreover, AGR-4 (SCPS) has achieved only 60.98% of physical target with 97.29% of targeted finance, while AGR-3 (TASP) has achieved just 62.83% of physical target with 85.75% of targeted finance and AGR-2 has achieved merely 32.49% of physical target with 85.43% of targeted finance. This indicate that NFSM (Pulse), AGR-9 (Work Plan Macro Management), AGR-5 (Technology Mission on Cotton), AGR-4 (SC Farmers Support Program), AGR-3 (Tribal Area Sub Plan) and AGR-2 (Compost Fertilizers) schemes requires more efforts for creating better awareness and generating success stories.
Various schemes and programs pertaining to the development in animal husbandry are being implemented for people involved in animal husbandry as shown in Box 2.7.
Box 2.7: Major Schemes and Programs for People in Animal Husbandry Sector
Schemes / Programs Brief Details of Schemes / Programs Intensive Cattle Development Program
To facilitate pure-breeding and cross-breeding to preserve and improve genetic potentiality of cattle and buffalo breed. To produced and supply elite breeding bulls to the institutes at nominal cost.
Sankalpa Patra Yojna To provide the veterinary care by organizing camps at rural areas. To increase the general awareness of farmers/animal keepers for the scientific management of their animals.
National Bull Production Program Associated Herd Progeny Testing Programme (AHPTP) and there by increasing milk production potentiality and conservation of pure Gir and Kankrej breed of cattle.
Interest Subsidy Schemes To establish farm of Cow-Gir or Kankrej or Buffalo-Mehsana, Surti or Jafarabadi. To provide interest subsidy 100%, for interest 12% for loan of Farm of 1-4 milch animals and 75% for interest 12% for loan of Farm of 5-10 milch animals.
Fodder Development Program Distribution of fodder mini kits. Subsidy to establish fodder seed production farm. Subsidy for cattle shed for scheduled cast people. Subsidy for cattle shed for general people. Subsidy for cattle shed for BPL people in tribal area.
Subsidy Schemes Milk enhancement program for animals of SC people. Assistance for establishment of poultry birds unit / goat unit for SC people. Assistance for establishment of broiler poultry birds farm for unemployed educated youths of SC people. Assistance for fodder mini kits, round wheel chaff-cutter to ST farmers. Assistance for poultry units / rabbit unit to ST farmers. Assistance for poultry unit/broiler birds unit to women. Assistance for fodder mini kit / round wheel chaff-cutter to the general category farmers.
Source: Compiled from database of Directorate of Animal Husbandry, Gujarat (2011)

BANASKANTHA Human Development Report
30
Other schemes and programs for animal husbandry sector are: Livestock Health Scheme, Rinderpest Eradication Program, Dairy Development Program, Sheep And Goat Development Program, Intensive Dairy Development Project (IDDP) , Strengthening infrastructure for quality & clean milk production, Assistance to Cooperatives Dairy/Poultry venture capital funds, National Programme for Prevention of Animal Diseases, Conservation of Threatened Breeds of Small Ruminants, Rabbits, Pigs, Pack Animals and Equines, etc.
State Government organises Cattle Camps and Cattle Fair every year to develop the animal husbandry sector in Gujarat. The details of Veterinary Camps organised in Banaskantha is presented in Figure 2.7.
Figure 2.7: Achievements of Veterinary Camps in Banaskantha (2010-11)
Source: Based on database of District Animal Husbandry Office, Banaskantha (2011)
The performance of all the districts in providing veterinary services has been outstanding in Banaskantha. More than 99% of physical target has been achieved in Danta, Deesa and Vadgam talukas, while nearly 95% of physical target has been achieved in all other talukas. Only Tharad taluka achieved 89.53% of physical target. However, Dantiwada achieved 96.88% of target with just 72.09% of target finance in Banaskantha.
Table 2.9: Animal Husbandry Infrastructure in Banaskantha Units Nos. Units Nos.
Veterinary Science/Animal Husbandry College 1 Mobile Veterinary Dispensary 2 Rural Primary Veterinary Health Care Centers 27 First Aid Veterinary Centers 27 Animal Disease Investigation Center 1 Veterinary Polyclinic 1 Intensive cattle Development Project 50 Veterinary Dispensary 55 District Poultry Extension Centre 1 Cattle Breeding Farm 2 District Poultry Extension Service Centre 6 Buffalo Breeding Farm 1 Poultry Demonstration / Training Centre 2 Gaushalas 16 Intensive Sheep Development Project 21 Panjarapoles (Registered) 13 District Sheep & Wool Extension Programs 6 Fodder Bank 1 Village Fodder Production Farm 1 Cattle Feed Factories 1 Village Milk Producer Cooperative Society 1200 Artificial Insemination Center 30 Veterinary Service Centre Run By Dairy 14 A.I. Centre Run By Dairy 252
Source: Compiled from database of Directorate of Animal Husbandry, Gujarat (2011)

BANASKANTHA Human Development Report
31
2.10 Success Stories
Box 2.8: Success Stories of Agriculture in Banaskantha
Name: Nagjibhai Mali Name: Bhikhaji Solanki Village: Laxmipura Village: Vadgam Taluka: Dantiwada Taluka: Vadgam Cultivated Area: 9.60 Hectare Cultivated Area: 1 Hectare Crop: Papaya (Taiwan) Crop: Castor-7 Income (Rs.): 50,40,000/- Income (Rs.): 2,49,000/- Expenditure (Rs.): 20,00,000/- Expenditure (Rs.): 30,000/- Profit (Rs.): 30,40,000/- Profit (Rs.): 2,19,000/- Name: Jotabhai Patel Name: Tulsibhai Joshi Village: Shergadh Village: Kumbhariya Taluka: Dhanera Taluka: Danta Cultivated Area: 2.5 Hectare Cultivated Area: 2.4 Hectare Crop: Chilli (Gujarat-1) Crop: Marigold Flower Income (Rs.): 6,40,700/- Income (Rs.): 20,00,000/- Expenditure (Rs.): 60,000/- Expenditure (Rs.): 25,000/- Profit (Rs.): 5,80,700/- Profit (Rs.): 1,75,000/-
Source: Compiled from database of District Agriculture Office, Banaskantha (2011)
Box 2.9: Success Stories of Animal Husbandry in Banaskantha
Name: Madhuben Chaudhari Name: Gitaben Patel Milk Coop. Society: Chhapi Milk Coop. Society: Arantwa Taluka: Vadgam Taluka: Tharad Milk Yield (Ltr): 197,328.3 Milk Yield (Ltr): 44,654.6 Income (Rs.): 33,50,028/- Income (Rs.): 8,55,306.40/- Name: Ramilaben Judal Name: Khemiben Patel Milk Coop. Society: Kushkal Milk Coop. Society: Fangadi Taluka: Palanpur Taluka: Vav Milk Yield (Ltr): 1,40,236.5 Milk Yield (Ltr): 19,175.5 Income (Rs.): 23,99,370.30/- Income (Rs.): 5,41,896/- Name: Hansaba Chavada Name: Gaytriben Vaghela Milk Coop. Society: Joita Milk Coop. Society: Ranakpur Taluka: Vadgam Taluka: Kankrej Milk Yield (Ltr): 1,39,114.2 Milk Yield (Ltr): 55,155.9 Income (Rs.): 23,22,706.30/- Income (Rs.): 9,54,878.7/- Name: Daiben Chaudhari Name: Babiben Chaudhari Milk Coop. Society: Rajaramnagar Milk Coop. Society: Odha Taluka: Deesa Taluka: Deodar Milk Yield (Ltr): 1,33,101.6 Milk Yield (Ltr): 59.881.6 Income (Rs.): 23,63,702.30/- Income (Rs.): 12,28,813.60/- Name: Bhuriben Patel Name: Jabunben Maknejya Milk Coop. Society: Shergadh Milk Coop. Society: Khoraj Taluka: Dhanera Taluka: Danta Milk Yield (Ltr): 72,196.8 Milk Yield (Ltr): 40,371.9 Income (Rs.): 15,50,559/- Income (Rs.): 7,83,436.59/-
Source: Compiled from database of District Animal Husbandry Office, Banaskantha (2011)

BANASKANTHA Human Development Report
32
2.11 Summary
Box 2.10: SWOC Analysis for Agriculture and Animal Husbandry in Banaskantha
Strengths Weaknesses
• More than 70% of the reported area is under cultivation.
• About 45% of cultivable land is irrigated. • Almost 9 out of 12 talukas shares greater
proportion of net cropped area as compared to district average.
• The average size of holdings in most of the talukas is similar indicating near equality in resource distribution.
• Area under cultivation of non food crops has increased due to high yielding form non food crops.
• More than 60% of people are engaged in agriculture are cultivators.
• More than 75% of agricultural workers are main workers mostly employed in agriculture for major part of year.
• Increase in cows, buffalos, milk cooperative societies and its members along with increase in milk production depict animal husbandry as major source of income.
• Forest coverage in Kankrej, Deodar and Bhabhar is nil.
• About 55% of the cultivable land is unirrigated.
• Lopsided irrigation resulting to inter taluka disparity (Deesa, Deodar highly irrigated, Vav, Tharad highly unirrigated)
• Across the talukas, SC and ST population shares less operational holdings in context of its population and compared to other population, leaving them marginalised.
• Declining area under cultivation of food crops places the challenge for food security if the similar trend continues.
• Almost 56% of people are non workers, which are dependent on 44% of working population and as most of the working population is engaged in agriculture sector, the non workers are indirectly depended on agriculture sector for livelihood.
• Illiterate sections of people are reluctant towards cross breeding of animals.
Opportunities Challenges
• One third of land is not under cultivation, which can be utilized for cultivation.
• More and more area can be covered under micro irrigation system.
• Regular awareness campaigns of Govt. schemes and programs to facilitate people in agriculture and animal husbandry.
• Banas Dairy is fostering livelihood options for people and it can offer still more income and employment opportunities by backward and forward linkage strategies.
• If the essential agriculture and animal husbandry infrastructure, technology and knowhow related gaps are filled, the district can progress to the desired level of development.
• Dantiwada Agriculture University can assist in addressing the issues pertaining to crop productivity, cropping intensity and agribusiness management.
• Uncertain rains hampering the sustainable development of agriculture.
• Needy people are not much aware about various schemes and programs by Government and therefore the priority section of people cannot get intended benefit.
• Volatile cultivation pattern impose risk of returns to farmers.
• Various benefits given in kind (especially poultry) by Government schemes for business/livelihood are consumed by households leaving them disadvantaged.
• A large tribal population does not have proper land records and entitlements to their rightful land deeds and due to this problem the tribal farmers fail to put their land parcels as collaterals for bank loans.

BANASKANTHA Human Development Report
33
2.12 Agriculture and Animal Husbandry: Taluka Wise Status of by Radars
Irrigated Area out of Total Cropped Area (%) Cropping Intensity
Area under Food Crops out of Total Cropped Area (%) Area under Non Food Crops out of Total Cropped Area (%)
Irrigated Food Crops Area out of Total Food
Crops Area (%) Irrigated Non Food Crops Area out of Total Food
Crops Area (%)

BANASKANTHA Human Development Report
34
Average Land Holding Size (Hectares) Total No. of Operational Holdings (% Share)
SC Holdings out of Total Holdings (%) SC Holdings out of Total Holdings (%)
Cultivators out of Total Workers (%) Agriculture Labourers out of Total Workers (%)

BANASKANTHA Human Development Report
35
Agricultural Credit Society Members (% Share) Vegetables & Fruits Society Members (% Share)
No of Livestock (% Share) Families with Livestock (% Share)
Milk Cooperative Society Members (% Share) Milk Collection (% Share)

BANASKANTHA Human Development Report
36
Chapter 3
LITERACY
AND
EDUCATION

BANASKANTHA Human Development Report
37
Chapter 3
LITERACY AND EDUCATION
3.1 Introduction
Literacy and Education are important non-income dimensions of human development and are the basic requirements for capability development and functional empowerment. It enables people to make informed choices about their lives and opportunities and enhances the capacity of an individual to participate in the process of development. Education is generally perceived as the foundation of society which brings economic wealth and social prosperity. Education acts as an instrument in the human development process, and improvements in educational status directly enhance skill-acquisition, occupational mobility and earning capabilities, reducing existing income asymmetries within the population. Hence, apart from its intrinsic value, the importance of education in contribution towards human development is well accepted and education, particularly elementary education, has been accorded a reasonable amount of centrality in policy initiatives.
The education system in India attempts to impart ability to read, write and count through a formal system. It also imparts knowledge and skills mainly to increase productivity of workers in the formal economy. Education when viewed more broadly, imparts values, ideas, attitudes, and aspirations that are in the best interests of a nation, a community, an individual, and above all, in the interests of humankind (Hirway and Mahadevia, 2004). Gujarat has a higher literacy rate than India, but Banaskantha district is far behind the state as well as national average. Over the years, a vast network of schools for effective teaching learning process, provision of infrastructure and incentives for education and regular monitoring have paid dividends in terms of improvement in enrolments, teaching and learning activities.
The chapter discusses status of literacy and literacy gaps in Banaskantha, school infrastructure and amenities, staffing pattern, enrolment and transition pattern, teaching and learning environment, incentives for education, schemes and programs in education, success stories and status of talukas pertaining to education in Banaskantha.
3.2 Status of Literacy
The overall literacy in Banaskantha was 50.97 in 2001, which increased to 65.32 in 2011. The male literacy increased from 66.47 in 2001 to 78.15 in 2011, whereas the female literacy increased from 34.40 in 2001 to 51.75 in 2011 as shown in Table 3.1.
Table 3.1: Status of Literacy in Banaskantha
2001 2011
Total Rural Urban Regional Gap Total Rural Urban Regional Gap Person 50.97 47.91 74.55 26.64 65.32 62.91 80.38 17.47 Males 66.47 64.02 85.11 21.09 78.15 76.37 89.15 12.78 Female 34.40 30.73 63.04 32.31 51.75 48.73 70.89 22.16 Gender Gap 32.07 33.29 22.07 26.40 27.64 18.26
Source: Census of India (2001, 2011)

BANASKANTHA Human Development Report
38
Moreover, the overall gap between male and female literacy that was 32.07 in 2001, which decreased to 26.40 in 2011, while the gap between male and female literacy in rural area that was 33.29 in 2001, which decreased to 27.64 in 2011, whereas the gap between male and female literacy in urban area that was 22.07 in 2001, which decreased to 18.26 in 2011.
Taluka wise status of literacy exhibits that literacy rate has been highest in Palanpur and lowest in Amirgadh in 2001 and 2011. However, Deoder, Tharad and vav talukas reported noticeable improvement in literacy between 2001 and 2011 as shown in Figure 3.1.
Figure 3.1: Status of Literacy in Banaskantha Over All Literacy Rate Female Literacy Rate
Source: Based on Census of India (2001, 2011)
Taluka wise female literacy exhibits that literacy amongst women has been highest in Palanpur and lowest in Amirgadh in 2001 and 2011. However, Deoder, Tharad and vav talukas reported noticeable improvement in female literacy between 2001 and 2011 as shown in Figure 3.1. The gap in literacy rate of rural and urban regions of talukas in Banaskantha has considerably declined between 2001 and 2011. However, in Deesa and Dhanera talukas the gap in rural and urban literacy persist and the gap is higher than that of the district average as shown in Table 3.2.
Table 3.2: Taluka wise Rural and Urban Literacy Rate in Banaskantha
Literacy Rate 2001 Literacy Rate 2011 Taluka/District Rural Urban Gap Rural Urban Gap Amirgadh 34.87 50.85 Bhabhar 44.82 56.11 73.19 17.08 Danta 44.86 77.05 32.19 62.05 78.39 16.34 Dantiwada 47.25 62.68 Deesa 45.20 71.47 26.27 61.59 80.23 18.64 Deodar 44.75 63.55 75.42 11.87 Dhanera 37.52 66.74 29.22 56.42 75.74 19.31 Kankrej 46.10 59.63 72.76 13.13 Palanpur 65.19 79.90 14.71 74.95 85.68 10.73 Tharad 39.58 59.19 19.61 58.91 68.63 9.73 Vadgam 68.78 77.85 80.78 2.93 Vav 40.77 59.40 Banaskantha 47.91 74.55 26.64 62.91 80.38 17.47 Source: Based on Census of India (2001, 2011)
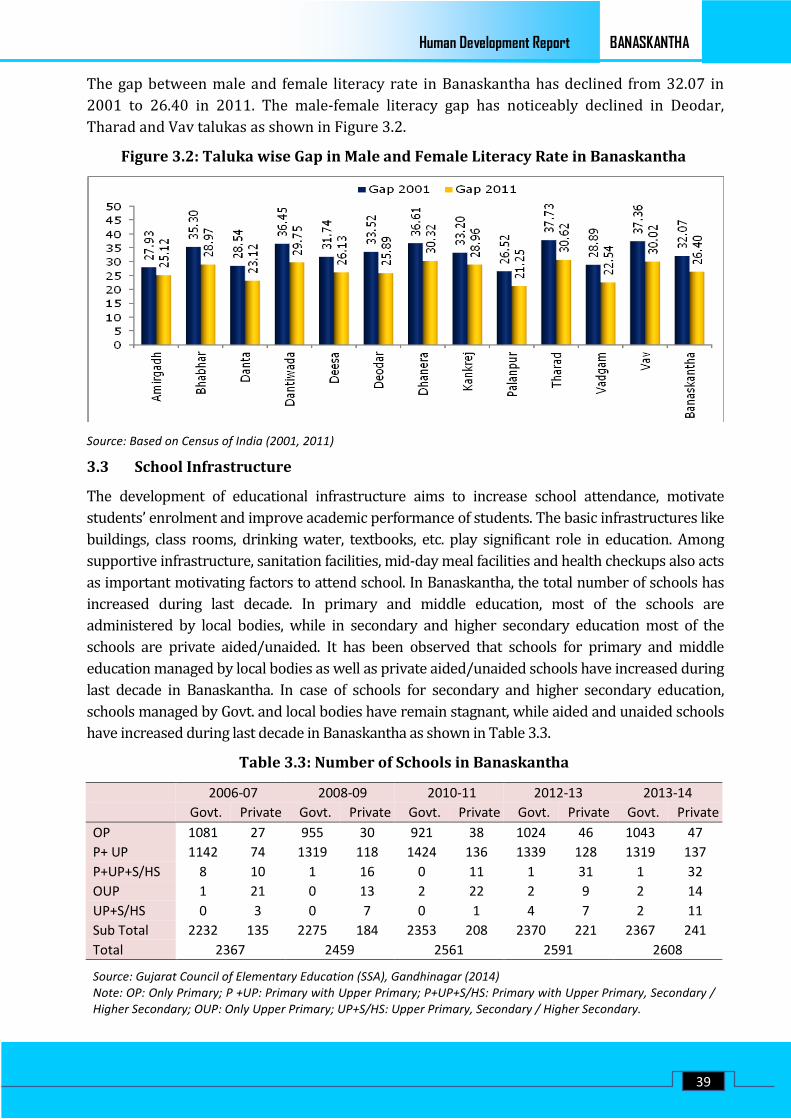
BANASKANTHA Human Development Report
39
The gap between male and female literacy rate in Banaskantha has declined from 32.07 in 2001 to 26.40 in 2011. The male-female literacy gap has noticeably declined in Deodar, Tharad and Vav talukas as shown in Figure 3.2.
Figure 3.2: Taluka wise Gap in Male and Female Literacy Rate in Banaskantha
Source: Based on Census of India (2001, 2011)
3.3 School Infrastructure
The development of educational infrastructure aims to increase school attendance, motivate students’ enrolment and improve academic performance of students. The basic infrastructures like buildings, class rooms, drinking water, textbooks, etc. play significant role in education. Among supportive infrastructure, sanitation facilities, mid-day meal facilities and health checkups also acts as important motivating factors to attend school. In Banaskantha, the total number of schools has increased during last decade. In primary and middle education, most of the schools are administered by local bodies, while in secondary and higher secondary education most of the schools are private aided/unaided. It has been observed that schools for primary and middle education managed by local bodies as well as private aided/unaided schools have increased during last decade in Banaskantha. In case of schools for secondary and higher secondary education, schools managed by Govt. and local bodies have remain stagnant, while aided and unaided schools have increased during last decade in Banaskantha as shown in Table 3.3.
Table 3.3: Number of Schools in Banaskantha
2006-07 2008-09 2010-11 2012-13 2013-14
Govt. Private Govt. Private Govt. Private Govt. Private Govt. Private OP 1081 27 955 30 921 38 1024 46 1043 47 P+ UP 1142 74 1319 118 1424 136 1339 128 1319 137 P+UP+S/HS 8 10 1 16 0 11 1 31 1 32 OUP 1 21 0 13 2 22 2 9 2 14 UP+S/HS 0 3 0 7 0 1 4 7 2 11 Sub Total 2232 135 2275 184 2353 208 2370 221 2367 241 Total 2367 2459 2561 2591 2608
Source: Gujarat Council of Elementary Education (SSA), Gandhinagar (2014) Note: OP: Only Primary; P +UP: Primary with Upper Primary; P+UP+S/HS: Primary with Upper Primary, Secondary / Higher Secondary; OUP: Only Upper Primary; UP+S/HS: Upper Primary, Secondary / Higher Secondary.

BANASKANTHA Human Development Report
40
The increase in educational institutions in Banaskantha, particularly at the primary level, has been reasonably commendable. The accessibility of schools from the places of habitation has been the additional enabling condition that played a vital role in determining the achievement of basic education. Although the number of secondary education institutions has increased, but the increase has been comparatively lesser than primary education institutions to meet the educational needs of all potential learners. However at the secondary and higher secondary stage, school accessibility is still a challenge in Banaskantha.
Banaskantha had 2367 schools in 2006-07, which increased to 2561 in 2010-11, and 2608 in 2013-14. Between 2005-06 and 2013-14 Banaskantha recorded the increase of 241 schools in the district which reflected the growth of schools at 0.26% CAGR in the district between 2005-06 and 2013-14. Moreover, it has been observed that Govt. schools have grown at 0.84% CAGR between 2006-07 and 2013-14 in Banaskantha. On the other hand private schools have grown at 8.63% CAGR between 2006-07 and 2013-14 in Banaskantha. It is revealed that there is major reliance of basic education on public schools in Banaskantha, however private schools are also growing in the district.
The distribution of schools in Banaskantha reveal that Deesa shared highest proportion of schools in 2006-07 (17.83%) as well as in 2013-14 (18.01%) in Banaskantha, while Dantiwada shared least proportion of schools in 2006-07 (4.15%) as well as in 2013-14 (4.07%) in Banaskantha. Out of the total increase of schools in Banaskantha between 2006-07 and 2013-14, major increase in schools is found in Palanpur (14.34% of increase), Tharad (11.40% of increase) and Danta (11.16% of increase), while least increase in schools is found in Vadgam (2.81 % of increase) and Kankrej (3.83 % of increase). However, the %share of schools in Amirgadh, Dantiwada, Kankrej, Vadgam and Vav has decreased in 2013-14 compared to 2006-07 as shown in Figure 3.3.
Figure 3.3: Taluka wise distribution of Schools in Banaskantha
Taluka wise Distribution of Schools (2006-07) Taluka wise Distribution of Schools (2013-14)
Source: Based on database of Gujarat Council of Elementary Education (SSA), Gandhinagar (2014)
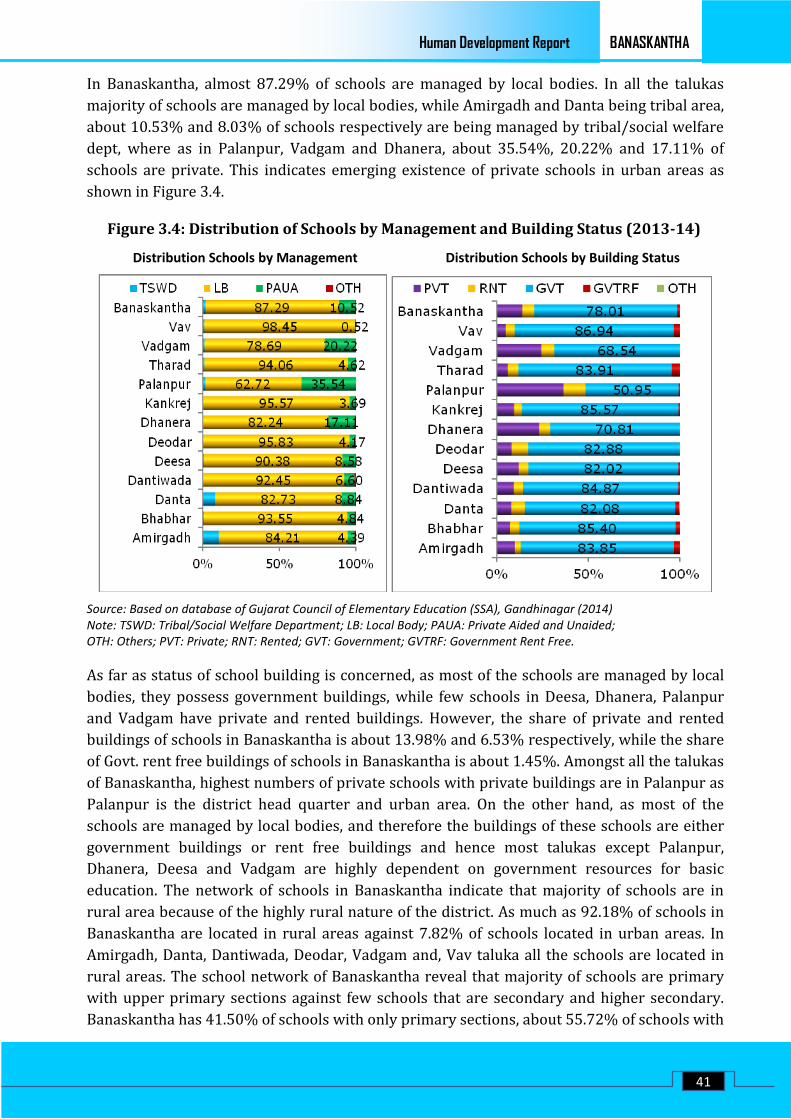
BANASKANTHA Human Development Report
41
In Banaskantha, almost 87.29% of schools are managed by local bodies. In all the talukas majority of schools are managed by local bodies, while Amirgadh and Danta being tribal area, about 10.53% and 8.03% of schools respectively are being managed by tribal/social welfare dept, where as in Palanpur, Vadgam and Dhanera, about 35.54%, 20.22% and 17.11% of schools are private. This indicates emerging existence of private schools in urban areas as shown in Figure 3.4.
Figure 3.4: Distribution of Schools by Management and Building Status (2013-14)
Distribution Schools by Management Distribution Schools by Building Status
Source: Based on database of Gujarat Council of Elementary Education (SSA), Gandhinagar (2014) Note: TSWD: Tribal/Social Welfare Department; LB: Local Body; PAUA: Private Aided and Unaided; OTH: Others; PVT: Private; RNT: Rented; GVT: Government; GVTRF: Government Rent Free.
As far as status of school building is concerned, as most of the schools are managed by local bodies, they possess government buildings, while few schools in Deesa, Dhanera, Palanpur and Vadgam have private and rented buildings. However, the share of private and rented buildings of schools in Banaskantha is about 13.98% and 6.53% respectively, while the share of Govt. rent free buildings of schools in Banaskantha is about 1.45%. Amongst all the talukas of Banaskantha, highest numbers of private schools with private buildings are in Palanpur as Palanpur is the district head quarter and urban area. On the other hand, as most of the schools are managed by local bodies, and therefore the buildings of these schools are either government buildings or rent free buildings and hence most talukas except Palanpur, Dhanera, Deesa and Vadgam are highly dependent on government resources for basic education. The network of schools in Banaskantha indicate that majority of schools are in rural area because of the highly rural nature of the district. As much as 92.18% of schools in Banaskantha are located in rural areas against 7.82% of schools located in urban areas. In Amirgadh, Danta, Dantiwada, Deodar, Vadgam and, Vav taluka all the schools are located in rural areas. The school network of Banaskantha reveal that majority of schools are primary with upper primary sections against few schools that are secondary and higher secondary. Banaskantha has 41.50% of schools with only primary sections, about 55.72% of schools with

BANASKANTHA Human Development Report
42
primary/upper primary sections, 1.26% schools with primary/upper primary with higher secondary sections, 0.95% of schools with only upper primary sections and just 0.57% of schools with upper primary and higher secondary sections. However in Dhanera and Palanpur more than 60% of schools have primary/upper primary sections, while in Bhabhar, Danta and Kankrej more than 50% of schools have only primary sections as shown in Table 3.4.
Table 3.4: Distribution of Schools by Locality and Type (2013-14)
Rural Urban
OP P,UP P,UP,HS OUP UP,HS
Amirgadh 100.00 0.00
39.64 58.56 1.80 0.00 0.00 Bhabhar 87.59 12.41
50.81 48.39 0.00 0.81 0.00
Danta 100.00 0.00
52.50 46.25 0.00 0.83 0.42 Dantiwada 100.00 0.00
37.38 59.81 0.93 0.00 1.87
Deesa 90.52 9.48
45.26 52.84 0.63 0.42 0.84 Deodar 100.00 0.00
51.04 47.40 0.00 1.04 0.52
Dhanera 86.49 13.51
28.86 66.44 2.01 2.01 0.67 Kankrej 95.42 4.58
57.20 41.70 0.00 0.74 0.37
Palanpur 69.02 30.98
23.49 67.26 6.05 3.20 0.00 Tharad 94.56 5.44
39.93 59.08 0.33 0.33 0.33
Vadgam 100.00 0.00
35.52 57.38 3.28 1.64 2.19 Vav 100.00 0.00
28.50 71.50 0.00 0.00 0.00
Banaskantha 92.18 7.82
41.50 55.72 1.26 0.95 0.57
Source: Based on database of Gujarat Council of Elementary Education (SSA), Gandhinagar (2014) Note: OP: Only Primary; P, UP: Primary with Upper Primary; P,UP,HS: Primary with Upper Primary, Secondary / Higher Secondary; OUP: Only Upper Primary; UP,HS: Upper Primary with Secondary /Higher Secondary.
It is apparent that the structure of the educational network in the Banaskantha places institutional obstacle on the path of progress by rural learners as they transit from one educational stage to the other as they prepare to enter the secondary stage. The absolute dearth of secondary/higher secondary schools in the district is enough to stop most of the rural students who had previously enrolled under the upper primary system in their tracks. Thus for rural students in Banaskantha, the possibility of progressing through the given institutional network stage-after-stage places constraint and hence access to secondary/higher secondary schools should be emphasized to enhance education in district.
School buildings and classrooms are crucial elements for basic school infrastructure. The Pucca buildings and good condition classrooms reveal provision of permanent and good basic infrastructure. In Banaskantha, most of the schools have pucca buildings with classrooms in good condition. The percentage of schools with pucca buildings in case of all type of schools shows improvement in 2013-14 as compared to 2005-06.
The percentage of schools with pucca buildings in case of schools with only primary section, schools with primary and schools with primary, upper primary and secondary/higher secondary education improved by 18.68%, 6.60%, 5.26% and 2.94% between 2005-06 and 2013-14 as shown in Figure 3.5.

BANASKANTHA Human Development Report
43
Figure 3.5: School Building and Class Rooms in Schools of Banaskantha % of Schools with Pucca Building Status of (%) Class Rooms (2013-14)
Source: Based on database of Gujarat Council of Elementary Education (SSA), Gandhinagar (2014) Note: OP: Only Primary; P, UP: Primary with Upper Primary; P,UP,HS: Primary with Upper Primary, Secondary / Higher Secondary; OUP: Only Upper Primary; UP,HS: Upper Primary with Secondary /Higher Secondary.
As far as class rooms are concerned, 90.79% of classrooms in Banaskantha are in good conditions against 7.99% of classrooms that require major repair and 1.22% of classrooms that require minor repair in Banaskantha. However, more than 90% of classrooms in Amirgadh, Bhabhar, Dantiwada, Deesa, Dhanera, Kankrej, Palanpur and Vadgam are in good condition, while almost 12.28%, 11.86% and 10.81% of classrooms in Danta, Tharad and Vav respectively require major repair. This indicates that despite most of classrooms are in good condition across schools, good numbers of classrooms are yet required to repair in schools of Banaskantha.
Basic infrastructure like electricity, computers and book bank are essential for effective teaching-learning transaction and enhanced the process of teaching and learning. Most of the schools in Banaskantha have electricity connectivity and is functional status, but as far as computers and book banks are concerned, Banaskantha needs to prioritize the provision of computers and book banks. Bhabhar, Danta, Deodar and Kankrej talukas are far behind in availability of computers in schools and Danta, Dhanera and Vav talukas are far behind in availability of book bank as evident from the Figure 3.6
Figure 3.6: Schools with Electricity, Computers and Book Bank (2013-14)
Source: Based on database of Gujarat Council of Elementary Education (SSA), Gandhinagar (2014)

BANASKANTHA Human Development Report
44
All schools in all talukas of Banaskantha have electricity, while Amirgadh and Palanpur has highest proportion of schools with computers (84.21% and 81.18% respectively) whereas Deodar has highest proportion of schools with book banks (99.48%) out of its total schools. On the other hand Kankrej has least proportion of schools with computers (45.76%) out of its total schools, while Danta has least proportion of schools with book banks (84.34%) out of its total schools. Electricity, book bank and computer facilities enhance the knowledge and skills for career development in general and significantly facilitates the poor and rural students who cannot afford these facilities otherwise, if not provided by schools. There are sharp intra-district differentiations within the district in terms of access to computers and book bank. Such differentials between talukas will widen further unless a conscious effort is made to improve the essential infrastructure in schools. Apart from linking grants that are to be utilized for infrastructure development, regular monitoring of infrastructure deficiencies is required for improvement.
Box 3.1: Infrastructure and Amenities in Schools of Bhabhar and Dhanera
The overall literacy in Bhabhar is 59.20%, with 28.98% gap between male and female literacy. There are 124 schools in Bhabhar out of which 87.59% schools are in rural area. The PTR and SCR in Bhabhar is 1:33 and 1:28 respectively. Bhabhar ranks 10th amongst all the 12 talukas of Banaskantha in terms of Gunotsav 2013. Out of total schools of Bhabhar, 50.81% schools run only primary sections, while 48.39% schools run primary as well as upper primary sections. All the schools in Bhabhar have separate girls toilet, electricity connectivity and drinking water facility. However, 47.58% schools in Bhabhar have computers and 91.13% schools in Bhabhar have book bank facility.
The overall literacy in Dhanera is 58.98%, with 30.32% gap between male and female literacy. There are 152 schools in Dhanera out of which 86.49% schools are in rural area. The PTR and SCR in Dhanera is 1:37 and 1:30 respectively. Dhanera ranks 3rd amongst all the 12 talukas of Banaskantha in terms of Gunotsav 2013. Out of total schools of Dhanera, 28,86% schools run only primary sections, while 66.44% schools run primary as well as upper primary sections. All the schools in Dhanera have separate girls toilet, electricity connectivity and drinking water facility. However, 78.95% schools in Dhanera have computers and 86.18% schools in Dhanera have book bank facility.
Source: Field Survey, Bhabhar, Dhanera (2014)
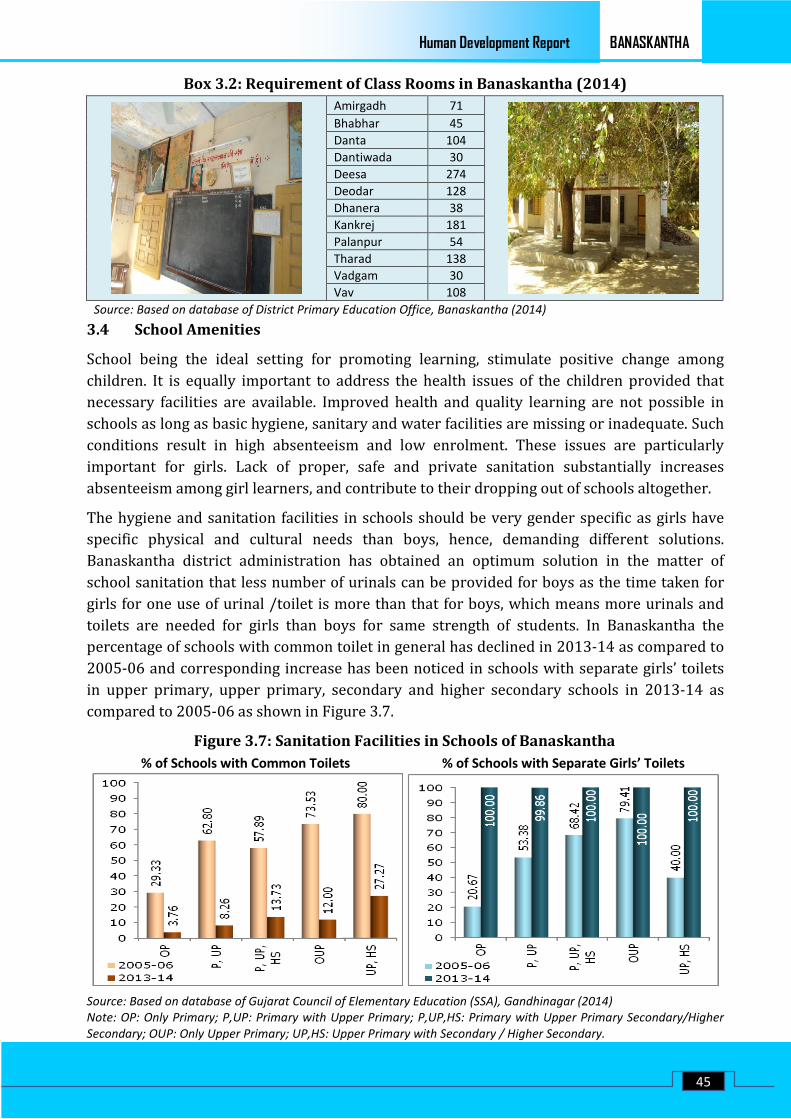
BANASKANTHA Human Development Report
45
Box 3.2: Requirement of Class Rooms in Banaskantha (2014)
Amirgadh 71
Bhabhar 45 Danta 104 Dantiwada 30 Deesa 274 Deodar 128 Dhanera 38 Kankrej 181 Palanpur 54 Tharad 138 Vadgam 30 Vav 108
Source: Based on database of District Primary Education Office, Banaskantha (2014)
3.4 School Amenities
School being the ideal setting for promoting learning, stimulate positive change among children. It is equally important to address the health issues of the children provided that necessary facilities are available. Improved health and quality learning are not possible in schools as long as basic hygiene, sanitary and water facilities are missing or inadequate. Such conditions result in high absenteeism and low enrolment. These issues are particularly important for girls. Lack of proper, safe and private sanitation substantially increases absenteeism among girl learners, and contribute to their dropping out of schools altogether.
The hygiene and sanitation facilities in schools should be very gender specific as girls have specific physical and cultural needs than boys, hence, demanding different solutions. Banaskantha district administration has obtained an optimum solution in the matter of school sanitation that less number of urinals can be provided for boys as the time taken for girls for one use of urinal /toilet is more than that for boys, which means more urinals and toilets are needed for girls than boys for same strength of students. In Banaskantha the percentage of schools with common toilet in general has declined in 2013-14 as compared to 2005-06 and corresponding increase has been noticed in schools with separate girls’ toilets in upper primary, upper primary, secondary and higher secondary schools in 2013-14 as compared to 2005-06 as shown in Figure 3.7.
Figure 3.7: Sanitation Facilities in Schools of Banaskantha % of Schools with Common Toilets % of Schools with Separate Girls’ Toilets
Source: Based on database of Gujarat Council of Elementary Education (SSA), Gandhinagar (2014) Note: OP: Only Primary; P,UP: Primary with Upper Primary; P,UP,HS: Primary with Upper Primary Secondary/Higher Secondary; OUP: Only Upper Primary; UP,HS: Upper Primary with Secondary / Higher Secondary.

BANASKANTHA Human Development Report
46
This indicates conscious efforts for emphasizing privacy, safety, dignity of girl students in the school education in Banaskantha. Despite improvement in provision of separate sanitation facilities for girls in schools of Banaskantha, few schools (especially primary with upper primary sections) are yet to be provided with the separate sanitation facilities for girls.
Few schools in Banaskantha still have common toilets, while majority of schools in Banaskantha have separate girls’ toilets. This indicates Banaskantha has progressed in terms of construction of separate girls’ toilets. As far as taluka wise scenario is concerned, Bhabhar and Deesa taluka have least number of schools with separate girls’ toilets. Besides that, Amirgadh, Dantiwada, Deodar, Palanpur and Vadgam still have common toilets, however, separate girls toilets are also available in almost all the schools of these talukas as shown in Figure 3.8.
Figure 3.8: Taluka Wise Sanitation Facilities in Schools of Banaskantha (2013-14)
Source: Based on database of Gujarat Council of Elementary Education (SSA), Gandhinagar (2014)
Although most of the schools in Banaskantha are coeducational, the provision of separate toilet facilities for boys and girls at the large number of schools in the district has proved to be a much more daunting task and hence the coverage rates for the provision of separate toilet facilities to school girls in few talukas of Banaskantha has slowly and steadily increased over a period of time to match the target of 100%.
Provision and availability of drinking water is an essential aspect of educational institution. It has been observed that there has been improvement in drinking water facilities at schools in Banaskantha, large numbers of schools have achieved the target of provision of the drinking water facilities and hence most of the schools in Banaskantha have drinking water facilities. The percentage of schools with drinking water facilities shows improvement in 2013-14 as compared to 2005-06 and all the schools imparting primary, upper primary, secondary and higher secondary education are acquainted with drinking water facilities as shown in Figure 3.9.

BANASKANTHA Human Development Report
47
Figure 3.9: Drinking Water Facilities in Schools of Banaskantha
% of Schools with Drinking Water Facility % of Schools by Source of Drinking Water (2013-14)
Source: Based on database of Gujarat Council of Elementary Education (SSA), Gandhinagar (2014) Note: OP: Only Primary; P, UP: Primary with Upper Primary; P,UP,HS: Primary with Upper Primary Secondary / Higher Secondary; OUP: Only Upper Primary; UP,HS: Upper Primary with Secondary /Higher Secondary.
In Banaskantha the major source of drinking water is tap water. However, Amirgadh and Danta being hilly and tribal area, major source of drinking water in schools are hand pumps. In Amirgadh, Danta, Dhanera, Palnpur and Vav talukas, about 2% to 4% of schools also have well as a source of drinking water. The coverage rate for provision of drinking water in Banaskantha has reached 100% in 2014.
Box 3.3: Infrastructure and Amenities in Schools of Deesa, Palanpur, Vadgam
The overall literacy in Deesa, Palanpur and Vadgam is 65.40%, 78.91% and 77.95% respectively, with the gap between male and female literacy in Deesa, Palanpur and Vadgam of 26.13%, 21.25% and 22.53% respectively. There are 478 schools in Deesa out of which 90.52% of schools are in rural area and 8.58% of schools are private schools. There are 273 schools in Palanpur out of which 69.02% of schools are in rural area and 35.53% of schools are private schools. There are 183 schools in Vadgam and all the schools are in rural area and 20.22% of schools are private schools. Out of total classrooms 8.02% classrooms in Deesa, 7.19% classrooms in Palanpur and 8.82% of classrooms in Vadgam require major and minor repairs. The PTR in Deesa is 1:35, while Palanpur has 1:29 PTR, whereas, PTR in Vadgam is 1:29. In Deesa 14.44% of schools, in Palanpur 6.27% of schools and in Vadgam 6.56% of schools have PTR greater than 40. The SCR in Deesa is 1:31, while Palanpur has 1:27 SCR, whereas, SCR in Vadgam is 1:26. In Deesa 16.53% of schools, in Palanpur 16.03% of schools and in Vadgam 9.84% of schools have SCR greater than 40. Deesa ranks 5th, Palanpur ranks 4st and Vadgam ranks 6nd amongst all the 12 talukas of Banaskantha in terms of Gunotsav 2013.

BANASKANTHA Human Development Report
48
Out of total schools of Deesa, 45.26% schools run only primary sections, while 52.84% schools run primary as well as upper primary sections. All the schools of Deesa have separate girls toilet. 100% schools in Deesa have electricity connectivity, 64.44% schools have computers, 90.38% schools have book banks and all schools have drinking water facility. Out of total schools of Palanpur, 23.49% schools run only primary sections, while 67.26% schools run primary as well as upper primary sections. All the schools of Palanpur have separate girls toilet. 100% of total schools in Palanpur have electricity connectivity, 81.18% schools have computers, 88.15% schools have book banks and all schools have drinking water facility. Out of total schools of Vadgam, 35.52% schools run only primary sections, while 57.38% schools run primary as well as upper primary sections. All the schools of Vadgam have separate girls toilet. 100% of schools in Vadgam have electricity connectivity, 65.57% schools have computers, 91.26% schools have book banks and all schools have drinking water facility.
Source: Field Survey, Deesa, Palanpur, Vadgam (2014)
3.5 School Staffing Pattern
The number of teachers in Banaskantha has increased over a period of time. The major increase of teachers is noticed in primary with upper primary section schools as there are more schools having primary with upper primary sections in Banaskantha.
Table 3.5: Number of Teachers in Schools of Banaskantha
2005-06 2008-09 2010-11 2013-14
Govt. Private Govt. Private Govt. Private Govt. Private
OP 2574 113 2508 133 2565 131 3120 257 P+ UP 8950 802 10352 977 8398 635 12057 1500 P+UP+S/HS 92 71 4 128 0 46 39 887 OUP 138 0 48 12 43 10 102 UP+S/HS 21 0 29 0 0 74 214 Sub Total 11616 1145 12864 1315 10975 855 15300 2960 Total 12761 14179 11830 18260
Source: Based on database of Gujarat Council of Elementary Education (SSA), Gandhinagar (2014) Note: OP: Only Primary; P +UP: Primary with Upper Primary; P+UP+S/HS: Primary with Upper Primary, Secondary / Higher Secondary; OUP: Only Upper Primary; UP+S/HS: Upper Primary, Secondary / Higher Secondary.

BANASKANTHA Human Development Report
49
The distribution of teachers across the categories of school reveals that number of teachers has increased in Govt. schools as well as private schools. Moreover, it has been noticed that schools with only primary sections and schools with upper primary to higher secondary sections are dominated by private management and hence more private teachers are found in such schools of Banaskantha. However, Banaskantha has more number of male teachers in all the categories of schools in Banaskantha as shown in Figure 3.10.
Figure 3.10: Classification of Teachers in in Banaskantha (2013-14)
% of Teachers in Govt / Private Schools % of Male and Female Teachers
Source: Based on database of Gujarat Council of Elementary Education (SSA), Gandhinagar (2014) Note: OP: Only Primary; P, UP: Primary with Upper Primary; P,UP,HS: Primary with Upper Primary Secondary / Higher Secondary; OUP: Only Upper Primary; UP,HS: Upper Primary with Secondary /Higher Secondary.
The taluka wise distribution of teachers reflects that Deesa shares maximum school teachers and Bhabhar shares least school teachers. Palanpur has greater proportion of female teachers out of its total number of teachers, while all other taluka has greater proportion of male teachers out of its total number of teachers. This depicts that Palanpur being the urban area is more suitable for female teachers, while as rural areas are scattered and thus strength of female teachers is less in other talukas as shown in Figure 3.11.
Figure 3.11: Taluka wise Distribution of Teachers in Banaskantha (2013-14) % of Male and Female Teachers % of Total Teachers
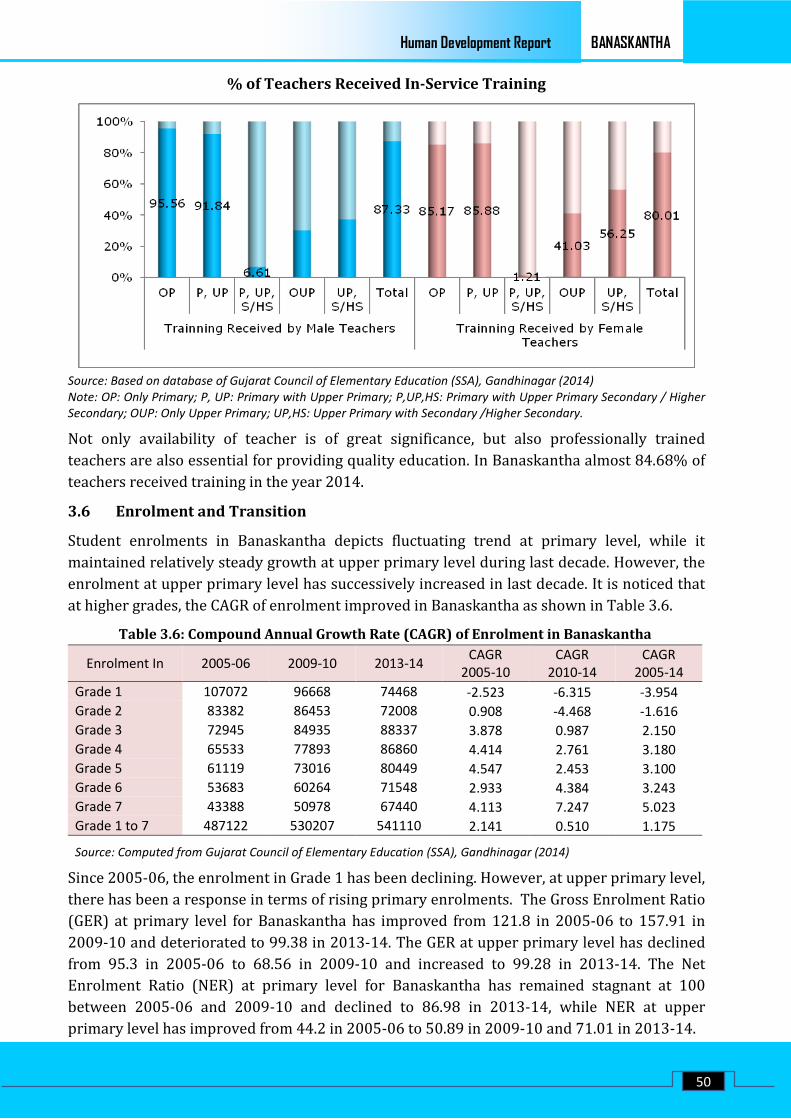
BANASKANTHA Human Development Report
50
% of Teachers Received In-Service Training
Source: Based on database of Gujarat Council of Elementary Education (SSA), Gandhinagar (2014) Note: OP: Only Primary; P, UP: Primary with Upper Primary; P,UP,HS: Primary with Upper Primary Secondary / Higher Secondary; OUP: Only Upper Primary; UP,HS: Upper Primary with Secondary /Higher Secondary.
Not only availability of teacher is of great significance, but also professionally trained teachers are also essential for providing quality education. In Banaskantha almost 84.68% of teachers received training in the year 2014.
3.6 Enrolment and Transition
Student enrolments in Banaskantha depicts fluctuating trend at primary level, while it maintained relatively steady growth at upper primary level during last decade. However, the enrolment at upper primary level has successively increased in last decade. It is noticed that at higher grades, the CAGR of enrolment improved in Banaskantha as shown in Table 3.6.
Table 3.6: Compound Annual Growth Rate (CAGR) of Enrolment in Banaskantha
Enrolment In 2005-06 2009-10 2013-14 CAGR 2005-10
CAGR 2010-14
CAGR 2005-14
Grade 1 107072 96668 74468 -2.523 -6.315 -3.954 Grade 2 83382 86453 72008 0.908 -4.468 -1.616 Grade 3 72945 84935 88337 3.878 0.987 2.150 Grade 4 65533 77893 86860 4.414 2.761 3.180 Grade 5 61119 73016 80449 4.547 2.453 3.100 Grade 6 53683 60264 71548 2.933 4.384 3.243 Grade 7 43388 50978 67440 4.113 7.247 5.023 Grade 1 to 7 487122 530207 541110 2.141 0.510 1.175
Source: Computed from Gujarat Council of Elementary Education (SSA), Gandhinagar (2014)
Since 2005-06, the enrolment in Grade 1 has been declining. However, at upper primary level, there has been a response in terms of rising primary enrolments. The Gross Enrolment Ratio (GER) at primary level for Banaskantha has improved from 121.8 in 2005-06 to 157.91 in 2009-10 and deteriorated to 99.38 in 2013-14. The GER at upper primary level has declined from 95.3 in 2005-06 to 68.56 in 2009-10 and increased to 99.28 in 2013-14. The Net Enrolment Ratio (NER) at primary level for Banaskantha has remained stagnant at 100 between 2005-06 and 2009-10 and declined to 86.98 in 2013-14, while NER at upper primary level has improved from 44.2 in 2005-06 to 50.89 in 2009-10 and 71.01 in 2013-14.

BANASKANTHA Human Development Report
51
Figure 3.12: Grade (Class) Wise Trend of Enrolment in Banaskantha
Source: Based on database of Gujarat Council of Elementary Education (SSA), Gandhinagar (2014)
Gender wise review of enrolment depicts that scenario has changed in 2013-14 as compared to 2005-06. There has been an improvement in girls’ enrolment at lower primary level as well as at upper primary level in Banaskantha as shown in Table 3.7.
Table 3.7: Students Enrolment in Banaskantha
Enrolment 2005-06 2013-14
Total % Boys % Girls Total % Boys % Girls Grade 1 107072 51.86 48.14 74468 52.08 47.92 Grade 2 83382 53.84 46.16 72008 52.47 47.53 Grade 3 72945 54.84 45.16 88337 53.60 57.72 Grade 4 65533 55.70 44.30 86860 53.53 46.47 Grade 5 61119 60.00 40.00 80449 54.58 45.42 Grade 6 53683 63.07 36.93 71548 56.12 43.88 Grade 7 43388 66.14 33.86 67440 57.25 42.75
Source: Computed from Gujarat Council of Elementary Education (SSA), Gandhinagar (2014)
However, at Grade 1 there has been decline in girls’ enrolment in 2013-14 as compared to 2005-06. Despite the fact, the overall enrolment of girls in Banaskantha has increased from 43.31% in 2005-06 to 47.69% in 2013-14. This depicts continuous but slow improvement in girls’ enrolment as compared to boys’ enrolment in Banaskantha. The gap between boys and girls enrolment at upper primary level in Banaskantha ranges between 4% and 13%, while the gap between boys and girls enrolment at primary level ranges between 0.3% and 15.3%. Amongst all the talukas, biggest gap between boys and girls enrolment at primary level prevails in Palanpur, while smallest gap prevails in Vav. Whereas, amongst all the talukas, biggest gap between boys and girls enrolment at upper primary level prevails in Dantiwada, while smallest gap prevails in Danta as shown in Figure 3.13.

BANASKANTHA Human Development Report
52
Figure 3.13: Gap in Boys and Girls Enrolment in Banaskantha (2013-14)
Source: Based on database of Gujarat Council of Elementary Education (SSA), Gandhinagar (2014)
The gender wise enrolment of students across the social groups in the talukas of Banaskantha depicts that girls’ enrolment has been lower compared to boys’ enrolment in case of SC students, ST students and OBC students. SC girls’ enrolment in Banaskantha stood at 46.18% as compared to SC boys’ enrolment in Banaskantha which stood at 53.82% in 2013-14. ST girls’ enrolment in Banaskantha stood at 45.72% as compared to ST boys’ enrolment in Banaskantha that stood at 54.28% in 2013-14. OBC girls’ enrolment in Banaskantha stood at 45.05% as compared to OBC boys’ enrolment in Banaskantha that stood at 54.95% in 2013-14. Total girls’ enrolment in Banaskantha stood at 45.41% as compared to total boys’ enrolment in Banaskantha that stood at 45.59% in 2013-14. This depicts that girls’ enrolment across the social categories is lower in Banaskantha as compared to boys’ enrolment in Banaskantha as shown in Table 3.8.
Table 3.8: Category Wise Students Enrolment in Banaskantha (2013-14)
Taluka/District SC Enrolment ST Enrolment OBC Enrolment Total Enrolment
% Boys % Girls % Boys % Girls % Boys % Girls % Boys % Girls Amirgadh 53.91 46.09 53.75 46.25 56.21 43.79 54.49 45.51 Bhabhar 53.45 46.55 59.65 40.35 54.34 45.66 54.49 45.51 Danta 52.58 47.42 51.84 48.16 53.54 46.46 52.54 47.46 Dantiwada 67.68 32.32 59.63 40.37 55.56 44.44 55.97 44.03 Deesa 53.46 46.54 57.21 42.79 55.59 44.41 55.39 44.61 Deodar 52.77 47.23 60.15 39.85 55.20 44.80 54.72 45.28 Dhanera 53.61 46.39 60.38 39.62 55.48 44.52 55.92 44.08 Kankrej 52.85 47.15 55.62 44.38 55.36 44.64 55.22 44.78 Palanpur 54.90 45.10 57.96 42.04 56.11 43.89 56.13 43.87 Tharad 52.15 47.85 56.60 43.40 53.35 46.65 53.16 46.84 Vadgam 53.98 46.02 56.99 43.01 54.26 45.74 53.76 46.24 Vav 50.87 49.13 52.27 47.73 52.63 47.37 51.96 48.04 Banaskantha 53.82 46.18 54.28 45.72 54.95 45.05 54.59 45.41
Source: Computed from Gujarat Council of Elementary Education (SSA), Gandhinagar (2014)

BANASKANTHA Human Development Report
53
The SC girls’ enrolment has been highest (49.13%) in Vav taluka and lowest (32.32%) in Dantiwada taluka, while, ST girls’ enrolment has been highest (48.16%) in Danta taluka and lowest (39.62%) in Deodar taluka, whereas, OBC girls’ enrolment has been highest (47.37%) in Vav taluka and lowest (43.79%) in Amirgadh taluka. However, total girls’ enrolment has been highest (48.04%) in Vav taluka and lowest (43.87%) in Palanpur taluka. As far as SC girls’ enrolment is concerned, Amirgadh, Dantiwada, Palanpur and Vadgam lags behind the district average of 46.18 %, while as far as ST girls’ enrolment is concerned, all the talukas except Amirgadh, Danta and Vav lags behind the district average of 45.72 %.
Class-wise enrolment in the elementary education in Banaskantha from 2005-06 to 2013-14 shows tendency for Class 1 enrolments to decline over successive years and the enrolments to rise successively thereafter in the higher classes. Also the steep decline between Class 1 and Class 2 enrolments occurs every year and thus Class 2 enrolments hover between 75% and 90% of the students enrolled in Class 1 in the previous year as shown in Figure 3.14.
Figure 3.14: Enrolment, Transition and Dropout in Banaskantha Class Wise Enrolment (in 1000s) Class Wise Transition (in 1000s)
Source: Based on database of Gujarat Council of Elementary Education (SSA), Gandhinagar (2014)
Class 1 students enrolled in 2005-06 reduced by 14% of their initial strength as they transit to Class 2 in 2006-07. Further shrinkage every successive year ranges between 4% and 13% of the remaining transited students, at every stage of higher classes. Such usual pattern in enrolments leads to decline during transition when large number of students initially enrolled drops out of school. Due to such dips in enrolment, the mass of students enrolled in Class 1 every year is downsized to fit the limited intake of the upper primary system. The flow rates (Repetition Rate, Drop Out Rate, Promotion Rate, Transition Rate and Retention Rate has improved between 2005 and 2014 in Banaskantha as shown in Table 3.9.
Table 3.9: Trend in (Class 1 to 5) Flow Rate in Banaskantha
2005-06 2009-10 2013-14 Repetition Rate 19.3 12.9 0.37 Drop Out Rate 2.6 3.7 2.14 Promotion Rate 78.1 83.4 96.86 Transition Rate (Primary to Upper Primary) 82.1 87.6 95.14 Retention Rate (Primary Level) 59.1 69.3 97.86 Source: Computed from Gujarat Council of Elementary Education (SSA), Gandhinagar (2014)

BANASKANTHA Human Development Report
54
Map 3.1: Taluka wise % of schools with distance from CRC in Banaskantha (2013-14)
< 1 KM 1 KM to 5 KM 5 KM to 10 KM > 10 KM
o the scale
Map 3.2: Taluka wise Changes in % share in Upper Primary Enrolment of Banaskantha
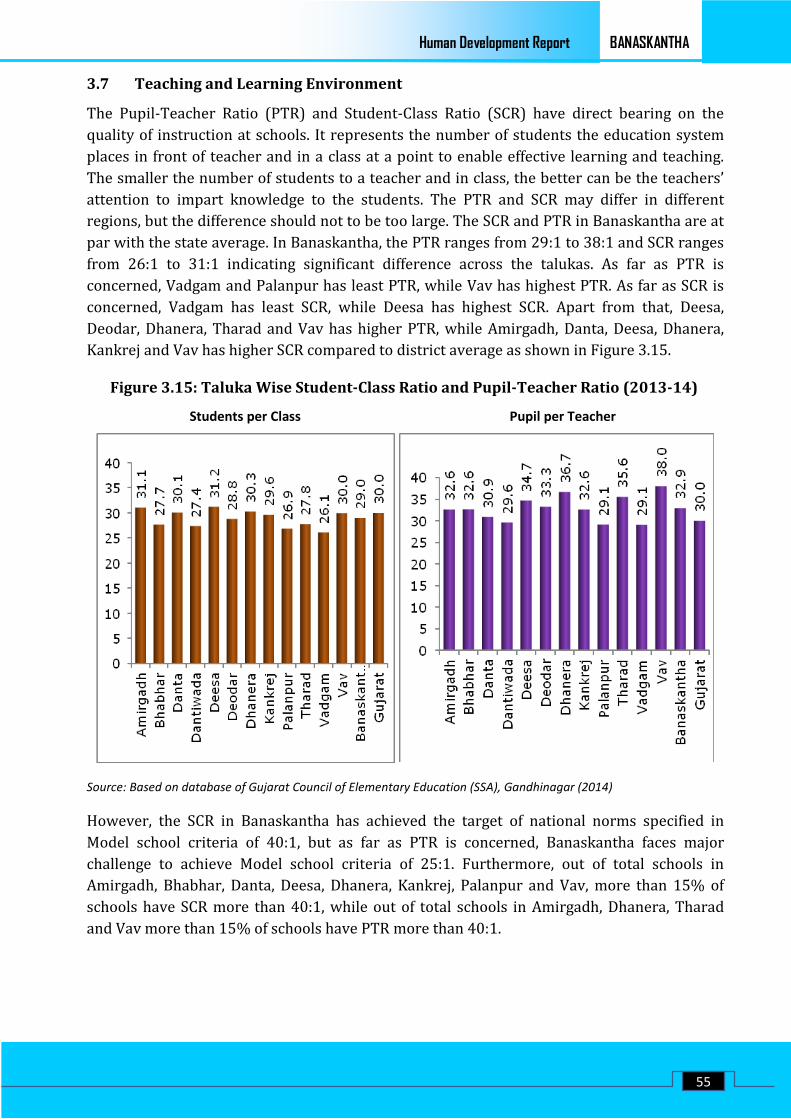
BANASKANTHA Human Development Report
55
3.7 Teaching and Learning Environment
The Pupil-Teacher Ratio (PTR) and Student-Class Ratio (SCR) have direct bearing on the quality of instruction at schools. It represents the number of students the education system places in front of teacher and in a class at a point to enable effective learning and teaching. The smaller the number of students to a teacher and in class, the better can be the teachers’ attention to impart knowledge to the students. The PTR and SCR may differ in different regions, but the difference should not to be too large. The SCR and PTR in Banaskantha are at par with the state average. In Banaskantha, the PTR ranges from 29:1 to 38:1 and SCR ranges from 26:1 to 31:1 indicating significant difference across the talukas. As far as PTR is concerned, Vadgam and Palanpur has least PTR, while Vav has highest PTR. As far as SCR is concerned, Vadgam has least SCR, while Deesa has highest SCR. Apart from that, Deesa, Deodar, Dhanera, Tharad and Vav has higher PTR, while Amirgadh, Danta, Deesa, Dhanera, Kankrej and Vav has higher SCR compared to district average as shown in Figure 3.15.
Figure 3.15: Taluka Wise Student-Class Ratio and Pupil-Teacher Ratio (2013-14)
Students per Class Pupil per Teacher
Source: Based on database of Gujarat Council of Elementary Education (SSA), Gandhinagar (2014)
However, the SCR in Banaskantha has achieved the target of national norms specified in Model school criteria of 40:1, but as far as PTR is concerned, Banaskantha faces major challenge to achieve Model school criteria of 25:1. Furthermore, out of total schools in Amirgadh, Bhabhar, Danta, Deesa, Dhanera, Kankrej, Palanpur and Vav, more than 15% of schools have SCR more than 40:1, while out of total schools in Amirgadh, Dhanera, Tharad and Vav more than 15% of schools have PTR more than 40:1.

BANASKANTHA Human Development Report
56
Figure 3.16: Taluka Wise Schools with SCR and PTR More than 40 (2010-11)
% Schools with SCR more than 40 % Schools with PTR more than 40
Source: Based on database of Gujarat Council of Elementary Education (SSA), Gandhinagar (2014)
Future efforts have to be such that the PTR and SCR in Banaskantha are progressively brought further down and the difference has to be narrowed down uniformly everywhere.
Box 3.4: Infrastructure and Amenities in Schools of Tribal Area
The overall literacy in Amirgadh and Danta is 50.85% and 63.45% respectively, with male-female literacy gap in Amirgadh and Danta of 25.12% and 23.11% respectively (Census 2011). There are 130 schools in Amirgadh out of which all the schools are in rural area and 5 (4.39%) of schools are private schools. There are 280 schools in Danta and all the schools are in rural area and 22 (8.89%) of schools are private schools. Out of total classrooms 7.64% classrooms in Amirgadh and 14.33% of classrooms in Danta require repairs. In Amirgadh 15.79% of schools and in Danta 12.05% of schools have PTR>40. In Amirgadh 21.93% of schools and in Danta 23.29% of schools have SCR>40. Amirgadh ranks 12th and Danta ranks 11th amongst all the 12 talukas of Banaskantha in terms of Gunotsav 2013.
Amirg
adh
Only primary schools: 39.64%
Dant
a
Only primary schools: 52.50% Primary/U. Primary schools: 58.56% Primary/U. Primary schools: 46.25% Schools with separate girls toilet: 100% Schools with separate girls toilet: 99.60% Schools with electricity: 100% Schools with electricity: 100% Schools with computers: 84.21% Schools with computers: 54.22% Schools with bookbank: 94.74% Schools with bookbank: 84.34% Schools without drinking water: 100%) Schools without drinking water: 100%
Source: Field Survey, Amirgadh, Danta (2014)
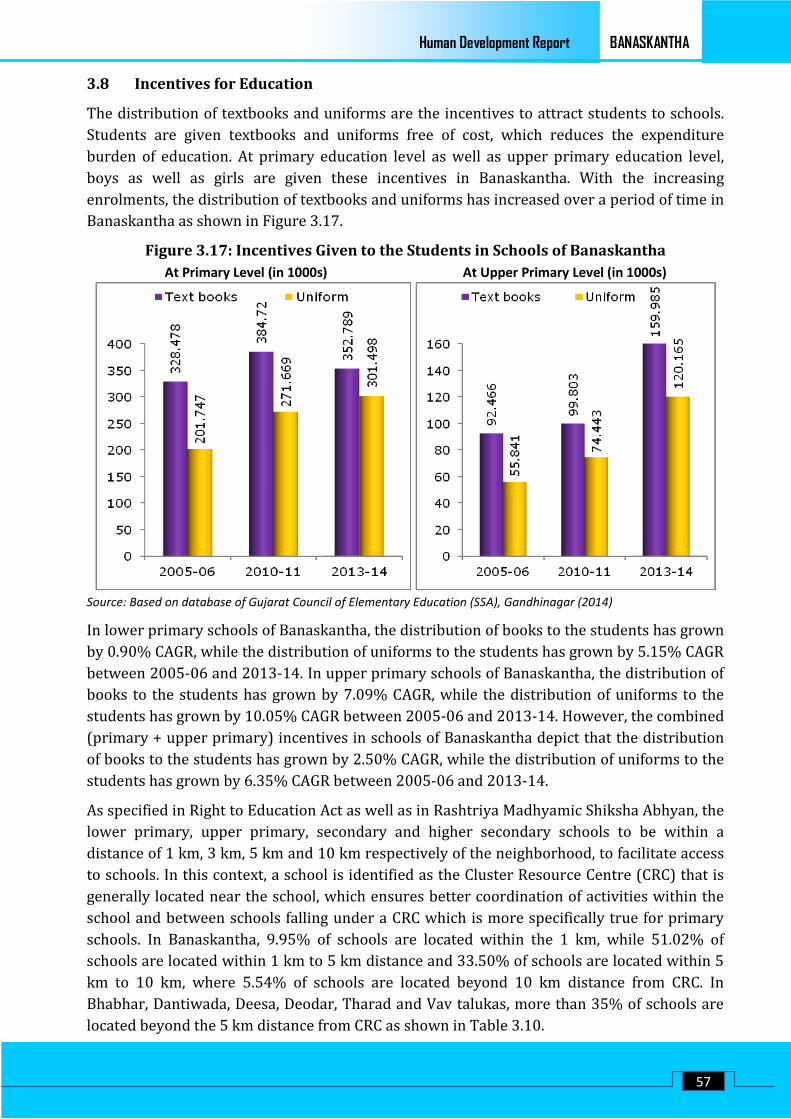
BANASKANTHA Human Development Report
57
3.8 Incentives for Education
The distribution of textbooks and uniforms are the incentives to attract students to schools. Students are given textbooks and uniforms free of cost, which reduces the expenditure burden of education. At primary education level as well as upper primary education level, boys as well as girls are given these incentives in Banaskantha. With the increasing enrolments, the distribution of textbooks and uniforms has increased over a period of time in Banaskantha as shown in Figure 3.17.
Figure 3.17: Incentives Given to the Students in Schools of Banaskantha At Primary Level (in 1000s) At Upper Primary Level (in 1000s)
Source: Based on database of Gujarat Council of Elementary Education (SSA), Gandhinagar (2014)
In lower primary schools of Banaskantha, the distribution of books to the students has grown by 0.90% CAGR, while the distribution of uniforms to the students has grown by 5.15% CAGR between 2005-06 and 2013-14. In upper primary schools of Banaskantha, the distribution of books to the students has grown by 7.09% CAGR, while the distribution of uniforms to the students has grown by 10.05% CAGR between 2005-06 and 2013-14. However, the combined (primary + upper primary) incentives in schools of Banaskantha depict that the distribution of books to the students has grown by 2.50% CAGR, while the distribution of uniforms to the students has grown by 6.35% CAGR between 2005-06 and 2013-14.
As specified in Right to Education Act as well as in Rashtriya Madhyamic Shiksha Abhyan, the lower primary, upper primary, secondary and higher secondary schools to be within a distance of 1 km, 3 km, 5 km and 10 km respectively of the neighborhood, to facilitate access to schools. In this context, a school is identified as the Cluster Resource Centre (CRC) that is generally located near the school, which ensures better coordination of activities within the school and between schools falling under a CRC which is more specifically true for primary schools. In Banaskantha, 9.95% of schools are located within the 1 km, while 51.02% of schools are located within 1 km to 5 km distance and 33.50% of schools are located within 5 km to 10 km, where 5.54% of schools are located beyond 10 km distance from CRC. In Bhabhar, Dantiwada, Deesa, Deodar, Tharad and Vav talukas, more than 35% of schools are located beyond the 5 km distance from CRC as shown in Table 3.10.

BANASKANTHA Human Development Report
58
Table 3.10: Access to School and Mid Day Meal in Banaskantha (2013-14)
Taluka / District
% of schools with distance from CRC Status of Mid Day Meal Provision < 1 KM 1-5 KM 5-10 KM > 10 KM In School Outside
Amirgadh 9.65 43.86 28.95 17.54 100.00 0.00 Bhabhar 9.68 50.81 35.48 4.03 100.00 0.00 Danta 9.24 51.41 29.32 10.04 99.03 0.97 Dantiwada 6.48 52.78 36.11 4.63 98.98 1.02 Deesa 8.58 47.91 40.38 3.14 98.61 1.39 Dhanera 13.02 55.73 29.17 2.08 100.00 0.00 Deodar 7.89 46.05 37.50 8.55 99.20 0.80 Kankrej 8.86 56.46 31.00 3.69 99.23 0.77 Palanpur 13.24 58.89 22.30 5.57 100.00 0.00 Tharad 9.90 48.51 36.30 5.28 96.49 3.51 Vadgam 12.57 59.02 27.87 0.55 100.00 0.00 Vav 9.33 37.82 44.04 8.81 98.95 1.05 Banaskantha 9.95 51.02 33.50 5.54 98.96 1.04
Source: Computed from Gujarat Council of Elementary Education (SSA), Gandhinagar (2014)
Mid-Day Meal Scheme offers children of poor and marginalized families mid-day meals to encourage them to be enrolled in schools. The mid-day meals are given to children studying in Government and aided schools and up to Class VII. The meal is cooked and is nutritious, taking care of the needs of the specific age-groups in the poor and marginalized families as well. The Mid-Day Meal is provided within 98.96% of schools, while it is being provided outside in 1.04 schools. In Amirgadh, Bhabhar, Dhanera, Palanpur and Vadgam all the schools provide Mid-Day Meal within schools, while in Tharad about 3.51% schools provide Mid-Day Meal within schools. However, regardless of the fact that meal is provided within school or outside school, the quality of meal should be continuously monitored.
3.9 Schemes and Programs for Education
The Gujarat Government has initiated various measures to improve literacy rate, enrolment ratio, quality of education and retention rate in the primary schools.
Box 3.5: Schemes and Programs for Education Sector
Schemes / Programs Brief Details of Schemes / Programs Sarva Shiksha Abhiyan To open new schools in the habitations without school facilities.
To strengthen existing school infrastructure. To provide computer education to bridge the digital divide. Special focus on girl's education and children with special needs.
National Programme for Education of Girls at Elementary Level (NPEGEL)
To facilitate education of under privileged/disadvantaged girls from class I to VIII in educationally backward areas where the level of rural female literacy is less than the national average and the gender gap is above the national average.
Vidhya Laxmi Bond Yojna
To increase the education amongst the girl child and ensure that the girls continue education at least till Std. 7th. The villages with women literacy less than 35% are covered. The girls of B.P.L families in urban areas are also covered. The girls enrolled in Class 1 are given Bond worth Rs. 1000/-. When the girl passes out of Class 7th, the amount of the bond along with the interest is distributed to the girls.

BANASKANTHA Human Development Report
59
Schemes / Programs Brief Details of Schemes / Programs Kanya Kelavani Nidhi
The Chief Minister’s Kanya Kelavani Nidhi is formed to reduce the financial burden of female education in state. The finance for Kanya Kelavani Nidhi is raised by selling the gifts received by the Chief Minister on various occasions.
Vidhya Deep Yojna
In case of an unfortunate death of a child studying in the school, the parents or the guardians of the child are offered Rs. 25000/- as an insurance amount. The premium of the Vidhya Deep Yojna is paid by the state government.
Girl Child Education Program
Girl Child Education program is initiated in villages across Gujarat. It covers almost 18,000 villages especially where the literacy rate is below 20% and focus on identified suburbs of the urban areas to enhance the level of female education.
Computer Training at the Primary Educational level
To enhance computer literacy in primary level education. To promote computer aided learning by adopting technology oriented teaching learning approach in Government schools. It aims for education in rural places to set path of development with continuous power supply and broadband connectivity.
Teleconference for Students
With cooperation of BISAG the students of Class 10/12 are provided exam oriented guidance “Studies without Burden”. With cooperation of ISRO the students of Class 8 are guided for Mathematics, Science and English on DD-1 and DD-11 Channel.
Mid Day Meal Scheme
To improve the nutritional/ health standard of growing children. To reduce drop-out rate and to increase attendance and to attract poorer children to come to the school.
School Health Check-Up Under this program school going children are covered for health checkups by the state health department free of cost treatment. Children suffering from various diseases are treated and are referred for special treatment to hospitals, within state or outside state.
Source: Compiled from database of Directorate of Primary Education, Gujarat (2011) State Government provides Vidya Laxmi Bonds to the girls enrolled in Class 1 in rural areas and BPL girls in urban areas. The sharp decline is noticed in 2003-04 and 2006-06 as compared to its previous years, while the continuous decline in the trend of Vidya Laxmi Bonds is noticed since 2007-08. This indicates volatile trend in girls, enrolment in district. The details of Vidya Laxmi Bond Scheme in Banaskantha are shown in Figure 3.18.
Figure 3.18: Achievements of Vidya Laxmi Bond Scheme in Banaskantha
Source: Based on database of Gujarat Council of Elementary Education (SSA), Gandhinagar (2014)

BANASKANTHA Human Development Report
60
Gunotsav is the state education department's program aiming at improving the level of education in the primary schools by finding the drawbacks and rectify it to improve the quality of primary education. Executives spend the entire day in schools and evaluate the school on various criteria including infrastructure, mid-day meal, sanitation, etc besides interacting with the parents. The detail of Gunotsav is presented in Table 3.11.
Table 3.11: Gunotsav Average Marks and Grade of Schools in Banaskantha Taluka/District Average
2009 Grade 2009
Average 2010
Grade 2010
Average 2014
Grade 2014
Amirgadh 4.09 D 4.35 D 6.36 B Bhabhar 4.36 D 4.65 D 6.63 B Danta 4.68 D 5.11 D 6.45 B Dantiwada 5.62 D 5.34 D 7.21 B Deesa 4.90 D 5.52 D 7.00 B Deodar 4.65 D 5.67 D 6.80 B Dhanera 4.77 D 5.20 D 7.11 B Kankrej 5.01 D 5.29 D 7.13 B Palanpur 5.68 D 6.04 C 7.01 B Tharad 5.20 D 5.32 D 6.92 B Vadgam 5.47 D 5.94 D 6.94 B Vav 4.41 D 4.77 D 6.81 B Banaskantha 4.90 D 5.27 D 6.89 B Source: Compiled from database of District Education Office, Banaskantha (2014)
3.10 Success Stories
Box 3.6: Kasturba Gandhi Balika Vidyalaya: Manki Kasturba Gandhi Balika Vidyalaya (KGBV) is a scheme for free of cost residential schools at upper primary level for girls belonging to the SC, ST, OBC and minority communities in educationally backward blocks where the female rural literacy is below the national average and gender gap in literacy is above the national average. In Banaskantha there are 10 KGBV viz. Iqubalgadh in Amirgadh, Bhabhar, Ambaji in Danta, Dantiwada, Manki in Deesa, Thara in Kankraj, Lawana in Deodar, Shergadh in Dhanera, Malpur in Tharad and Dhima in Vav talukas. The KGBV of Manki ranks 1st amongst all the KGBVs in terms of enrolment and facilities in Banaskantha.
Location: Village Manki, Taluka Deesa Established: July 2007 Funding: 75% Central, 25% State Enrolment: 75% (SC,ST,OBC), 25% BPL In take Capacity: 100 students (Type A) Education: Class 3 to 8 Teaching Staff: 1(head)+6(subordinate)=7
Infrastructure: New Building Ready No. of Rooms: 5 Rooms and 1 Kitchen Sanitation: 4 Toilets, 4 Bathrooms, 1 washroom Other Activities: Parents Meeting, Sports, Cultural, Vocational Training, Yoga, cycling Health Care: Medical Check Up every 15 days by PHC Lodging: Provided by Contract
Source: Field Survey, Manki (2011)

BANASKANTHA Human Development Report
61
Table 3.12: School Health Check Up in Banaskantha (2013-14)
Taluka / District School Going Children
Children Covered Under School Health Checkup
Children Served in Health Checkup
Children Provided Referral Service
Amirgadh 46025 43346 4573 90 Bhabhar 45001 40837 2738 50 Danta 85023 79372 3846 77 Dantiwada 35369 33410 2635 68 Deesa 172245 167511 8572 358 Deodar 63081 59839 3168 20 Dhanera 67395 64694 6455 94 Kankrej 84531 82198 6282 100 Palanpur 141320 138722 14246 798 Tharad 112279 107421 7667 335 Vadgam 73968 70814 12110 328 Vav 72934 71398 5611 379 Banaskantha 826926 959562 77903 2697 Source: Compiled from database of Chief District Health Office, Banaskantha (2014)
3.11 Summary Box 3.7: SWOC Analysis for Education in Banaskantha
Strengths Weaknesses • Primary schools are evenly distributed across the
talukas of Banaskantha. • All the schools in Banaskantha have Pacca
buildings. • Majority of schools have its most of the
classrooms in good conditions. • All the schools in Banaskantha are electrified. • Separate girls’ toilet are available in most of the
schools of Banaskantha. • All the schools in Banaskantha have drinking
water facility. • Girls’ enrolment in upper primary has
significantly increased during last decade. • Increase in incentives (books and uniform) to the
students during last decade.
• Wide literacy gap between male and female literacy as well as rural and urban literacy persist across the social groups in Banaskantha
• Higher secondary and private schools are concentrated in urbanised areas.
• Schools in Bhabhar, Danta , Deodar, kankrej, Tharad and Vav taluka are to be provided schools with higher secondary sections.
• More than 10% of classrooms in Danta, Vav and Tharad require major/minor repairs.
• About 50% of schools in Bhabhar, Deodar and Kankrej are to be provided computer facility.
• The gap between boys and girls enrolment is very high in upper primary education.
• In Amirgadh and Danta more than 10% of schools are at more than 10 Km from CRC.
Opportunities Challenges • Tendency for enrolments to rise successively in
the higher classes. • Despite higher fluctuating dropout rate of
students, the dropout rate is successively declining and can be further reduced.
• SCR and PTR in Banaskantha are close to the national norms and can be improved.
• Recruitment of full time (not contractual) teachers in priority talukas facing teachers’ retention problem.
• The coverage of Mid –Day meal scheme is to be combined with monitoring food quality for health care of students.
• Free transport (ST Bus Concession Pass) can be joined with Vidya Laxmi Bond Scheme to ensure the enrolment of girls is not cancelled after receiving the benefit of Vidya Laxmi Bond Scheme.
• Increase the coverage of School health checkups, linking with the performance of school and students.
• Tendency for Class 1 enrolments declines over successive years
• Decline in number of students during transition leads to shrinkage in enrolment every successive year.
• To improve SCR and PTR in schools which have SCR and PTR more than 40.
• Major challenge to retain the teachers employed on contract basis as such teachers are in search of full time jobs.
• The quality of Mid Day Meal has to be improved for attracting and sustaining the enrolment of students.
• Reduce dropout after benefiting from Vidya Laxmi Bond Scheme and to accelerate the growth the Vidya Laxmi Bonds Scheme to sustain Girl student beneficiaries for longer period of time.
• Increase coverage of School health check-ups especially in tribal areas (Amirgadh, Danta) and scattered area (Vav, Dhanera).

BANASKANTHA Human Development Report
62
3.12 Literacy and Education: Taluka Wise Status of by Radars
Male Literacy 2011 Female Literacy 2011
% Schools Managed by Local Bodies 2014 % Schools Managed by Private Bodies 2014
% of Classrooms in Good Condition 2014 % of Classrooms Require Major Repair 2014

BANASKANTHA Human Development Report
63
% of Girls in Total Enrolment 2014 Gap Between Boys & Girls Enrolment 2014
% Schools at distance > 10 KMs from CRC 2014 % Schools with Computer Facility 2014
Students Per Class 2014 Students Per Teacher 2014

BANASKANTHA Human Development Report
64
Chapter 4
HEALTH,
NUTRITION
AND SANITATION

BANASKANTHA Human Development Report
65
Chapter 4
HEALTH, NUTRITION AND SANITATION
4.1 Introduction
World Health Organization (WHO) defined health as “a state of complete physical, mental and social well-being” rather than just an absence of disease or infirmity. Health has intrinsic significance, instrumental importance at personal and social levels and promotes empowerment of people and therefore it is a direct measure of human well-being (Hirway and Mahadevia, 2004). Long and healthy life of people significantly depends on factors like adequate health infrastructure, accessibility of healthcare and ability to spend on healthcare interventions, apart from food habits and availability, economic and occupational factors, environmental and physical conditions. Moreover, health includes sanitation, a clean environment, access to basic amenities, access to adequate and safe drinking water, as well as access to proper and adequate nutrition.
Good nutrition not only gives adequate calories for functioning but also increases the ability to resist diseases and infections. People living below the poverty line lack resources to get adequate calories and live in unhygienic environmental conditions, which increase their vulnerability to infections and diseases. Nutritional deficiency in children, on the other hand, leads to irreversible and long-term disabilities such as blindness, reduction in cognitive functions, mental retardation, etc. Therefore, health and nutrition are closely linked to the livelihood issue since the man days loss due to poor nutrition leading to health problem has an impact on earnings. If the earning member of a family falls critically ill, the family is likely to be vulnerable to various economic problems.
The chapter discusses health care scenario in Banaskantha, health care infrastructure accessibility, human resource availability in health care, health care services offered, prevalence of major diseases, women and child health care, nutrition, drinking water and sanitation, schemes and programs for health care and its performance in Banaskantha, success stories and status of talukas pertaining to health, nutrition and sanitation in Banaskantha.
4.2 Health Care Scenario
Banaskantha district is characterized by scattered habitations, which makes it quite difficult to provide health care services available to the community. There are remote areas where accessibility is also a challenge and therefore, health care is a major concern in this district. Several proximate factors contribute to the health status of a population including nutrition, hygiene, potable drinking water and sanitation apart from maternal and child health, accessibility to health care services, emergency services and health care awareness. Better health status of the people leads to higher life expectancy and reduction in mortality rate, ultimately enabling people to live long and healthy life. The health care profile of Banaskantha district is presented in Figure 4.1.

BANASKANTHA Human Development Report
66
Figure 4.1: Health Care Profile of Banaskantha District
Population Served per Allopathic Institution (In 1000s)
Patients Treated in Govt Medical Institution (In 1,00,000)
Source: Based on database of Commissionerate of Health, Medical Services, Medical Education and Research, Gujarat (2014)
Due to low literacy the traditional common practices to cure diseases prevail in some backward areas and are followed by the lower castes and the tribal people. Jhar- Phunk (exorcism by blowing on the face of the person), Jantra (magic), Tantra (charms), Dora (tying a piece of thread round the wrist), etc. Nevertheless, there has been expansion in health care facilities in Banaskantha during last decade, but it has been observed that population served per allopathic institution is higher in urban areas compared to rural areas, which indicates better health care facilities in urban areas compared to rural areas. Moreover, the outdoor patients are higher than indoor patients, but the indoor patients have consistently increased in last decade.
4.3 Health Care Infrastructure Accessibility
In the public health system, besides district hospital and sub divisional hospital, PHCs and CHCs have a crucial role to play as the secondary level of health care. PHC is a basic unit providing an integrated curative and preventive health services to the rural community with an emphasis on promoting services. A PHC functions as a referral unit for 6 sub-centres. It caters to 30,000 population in general areas and 20,000 population in tribal or desert areas and four to five PHCs are attached to each of the CHCs. The CHCs cater to the health needs of the rural masses by providing first referral curative as well as specialized health care in various areas. Generally one CHC covers about 80,000 population in tribal/hilly areas and 1,20,000 population in plain areas. The availability of various facilities at CHC level including diagnostic services and laboratory testing is very important along with curative and other services to deliver complete health care at the grassroots level. PHC refers out cases to a CHC and higher order public hospitals and sub-district hospitals (PRC, 2009).
Banaskantha is at a disadvantaged position as compared to the state as a whole, both in terms of literacy rate and the extent of urbanisation and therefore, health care awareness and access to health care facilities holds significant position in Banaskantha. The district has 450

BANASKANTHA Human Development Report
67
sub centres and 88 PHCs and 19 CHCs. There are 29 Ayurvedic and 9 Homeopathic institutions. 1548, 528 and 710 beds are available in hospitals, PHCs and CHCs respectively. Moreover, 1 district hospital, 1 sub divisional hospital, 102 State Govt. medical institutions, 7 other medical institutions, 7 first referral units, 5 mobile medical units, 43 AYUSH health facilities and 19 ambulance are available in Banaskantha as shown in Table 4.1.
Table 4.1: Health Infrastructure in Banaskantha District (2014)
Health Infrastructure In Nos. Health Infrastructure In Nos.
Sub Centres 450 District Hospitals 1 Public Health Centres 88 Sub Divisional Hospitals 1 Community Health Centres 19 State Govt. Medical Institutions 102 Ayurvedic Institutions 29 Other Medical Institutions 7 Homeopathic Institutions 9 First Referral Units 7 Beds Available in Hospitals 1548 Mobile Medical Units 5 Beds Available in PHC 528 AYUSH 43 Beds Available in CHC 710 Ambulance (Govt.) 19
Source: Compiled from database of Commissionerate of Health, Medical Services, Medical Education and Research, Gujarat (2014).
Amirgadh and Danta are two tribal talukas in Banaskantha, characterised by low literacy and awareness of health care. The provision of health care facilities has special emphasis in tribal area viz. 2 CHCs, 10 PHCs and 86 sub centres are functional in tribal areas, while 17 CHCs, 78 CHCs and 364 sub centres are operational in non tribal areas as shown in Table 4.2.
Table 4.2: CHCs, PHCs and Sub Centres in Banaskantha (2014)
Taluka / District CHCs PHCs Sub Centers Tribal Others Tribal Others Tribal Others
Amirgadh 1 0 3 2 29 6 Bhabhar 0 1 0 3 0 14 Danta 1 0 7 1 57 3 Dantiwada 0 1 0 3 0 15 Deesa 0 2 0 15 0 56 Deodar 0 1 0 6 0 19 Dhanera 0 1 0 7 0 29 Kankrej 0 2 0 9 0 35 Palanpur 0 1 0 8 0 49 Tharad 0 3 0 10 0 57 Vadgam 0 3 0 7 0 37 Vav 0 2 0 7 0 50 Banaskantha 2 17 10 78 86 364
Source: Compiled from database of Commissionerate of Health, Medical Services, Medical Education and Research, Gujarat (2014)
Banaskantha had 78 medical institutions (including Govt, municipality and grant in aid other than panchayat clinics/hospitals) in 2003, which increased to 107 in 2014 indicating 2.92 % CAGR in number of institutions. Deesa shares highest number of medical institutions, while Bhabhar and Dantiwada shares least number of medical institutions. Highest increase in number of medical institutions is noticed in Tharad, while least increase in number of medical institutions is noticed in Amirgadh and Kankrej, whereas Bhabhar maintained stagnancy in number of medical institutions between 2003 and 2014 as shown in Figure 4.2.

BANASKANTHA Human Development Report
68
Figure 4.2: Taluka wise Medical Institutions and Beds Available in Banaskantha
Source: Based on database of Commissionerate of Health, Medical Services, Medical Education and Research, Gujarat (2014) It is evident from Figure 4.2 that Banaskantha district had 1675 bed facilities (in Govt, municipality and grant in aid other than panchayat hospitals/clinics) in 2003, which has declined to 1548 in 2014 indicating -0.71% CAGR in number of beds. The Taluka wise details of bed facilities show that Palanpur has highest number of beds, while Dantiwada and Bhabhar have least number of beds. Moreover, highest increase in number of beds is noticed in Deesa, while least increase in number of beds is noticed in Kankrej between 2003 and 2014, whereas there has been decline in number of beds between 2003 and 2014 in 3 out of 12 talukas viz. Amirgarh, Bhabhar and Palanpur talukas.
Box 4.1: Health Care Facilities at CHCs in Banaskantha
Facilities at CHCs Amirgadh Memedpur Thara
Taluka Amirgadh Vadgam Kankrej
Population covered 98098 110,000 263,000
Emergency services (24 Hours) Yes Yes Yes
24 - hour delivery services Yes Yes Yes
Emergency Obstetric Care No No Yes
New-born care Yes Yes Yes

BANASKANTHA Human Development Report
69
Family planning services No No Yes
Safe abortion services No No No
Surgeries performed No No General /Gynecologist
Bed Occupancy Rate 55% 40% 60%
Average daily OPD Attendance 160 50 180
No. of beds 30 30 30
Rooms OK Good Good
Toilets OK OK Good
Staff against IPHS Norm of 40 21 17 14
CHC Thara is catering to a much larger population against the prescribed coverage norm for CHC. Emergency Obstetric Care, Family planning services, Safe abortion services are lacking in Amirgadh and Memedpur CHCs. It is noticed that the above CHCs are functioning on 24x7 basis. The problem of vacant posts is noted in case of both medical and paramedical service providers needs to be resolved at all above CHCs for effective service delivery. Thara has a higher bed occupancy rate as compared to Amirgadh and Memedpur CHCs as higher number of patients are admitted at Thara, while the staff at Thara CHC is inadequate compared to Amirgadh and Memedpur CHCs.
Source: Field Survey, Amirgadh, Vadgam, Kankrej (2011)
4.4 Human Resource Availability in Health Care
The human resource dimension (medical officers and other staff) of the public health delivery system at Banaskantha seems to be not so encouraging. The availability of human resources in the district shows that the total number of sanctioned posts for class 1 staff and class 2 staff across medical divisions are 66 and 216 respectively. However, the problem of vacant posts is mainly evident in class 1 staff under certain medical divisions as compared to class 2 staff across medical divisions as evident from Table 4.3.
Table 4.3: Medical Staff (Class 1 & Class 2) Details of Banaskantha (2014)
Medical Division Class 1 Class 2
Sanctioned Filled Vacant Sanctioned Filled Vacant Civil Palanpur 20 14 6 24 15 9 Civil Deesa 19 1 18 9 5 4 CHC 23 3 20 63 42 21 DTO Palanpur 1 1 0 2 2 0 Training Unit 0 0 0 1 1 0 Jail Division 0 0 0 1 0 1 PHC 0 0 0 100 58 42 Mobile Unit 0 0 0 9 1 8 District Panchayat Dispensary 0 0 0 1 0 1 District Panchayat Banaskantha 3 2 1 6 3 3
Source: Compiled from database of Chief District Health Office, Banaskantha (2014)

BANASKANTHA Human Development Report
70
Nonetheless, if the vacant posts in both the categories of staff are filled up on a priority basis, it would reinforce the system to meet the health needs of the masses efficiently and effectively. The adequate and trained human resources significantly contributes to the improvement in the health outcomes at various levels and is directly related to the increase in utilization of health services.
One of the functions of the district hospital is to provide effective, affordable Health care services i.e. curative (including specialist services), preventive and promoting care for a defined population. The key component for effective service provision by district hospital is adequate availability of qualified human resources. IPHS also lays down recommendation for medical and paramedical manpower as per the type of the health institute. It is evident from Table 4.4 that the availability of medical staff at Banaskantha district hospital is not much remarkable. Out of the total 37 sanctioned posts under different categories, 26 posts are filled and about one-third of the positions are vacant. However, the availability of paramedical staff seems to be better than that of the medical staff. About 38 out of the total 147 sanctioned posts are vacant. If these vacant posts are filled up at the earliest, it shall prevent other staff from being overburdened and efficient and effective service delivery can be ensured.
Table 4.4: Medical and Para-Medical Staff at District Hospital, Banaskantha (2014)
Medical Staff Sanctioned Filled Para-Medical Staff Sanctioned Filled
Hospital Superintendent 1 0 Staff Nurse 77 74
Medical Specialist 1 1 Hospital worker 32 19
Surgery Specialist 3 2 Sanitary worker 23 12
Gynaecologist 1 1 Ophthalmic assistant 1 1
Paediatrician 1 1 Social Worker/Counsellor 0 0
Anaesthetist 3 2 Laboratory technician 2 2
General Duty Doctor 20 13 Laboratory attendant 1 0
Pathologists 1 1 ANM 0 0
Psychiatrist 1 1 LHV 0 0
ENT Surgeon 1 1 PHN 0 0
Ophthalmologist 1 1 Pharmacist 8 1
Orthopaedist 2 1 Matron 2 0
Dental Surgeon 1 1 Physiotherapist 1 0
Source: Compiled from database of Commissionerate of Health, Medical Services, Medical Education and Research, Gujarat (2014)

BANASKANTHA Human Development Report
71
Box 4.2: Women Health Care Facilities in Banaskantha
Palanpur Female Hospital is located at Palanpur. Late Nawab of Palanpur, Tale Mohammad Khan donated the land for hospital and the construction work of the building was completed in 1926 and then used for several decades. The hospital managed by a board of Trustees. In 1985 a new building was constructed as a part of the expansion plan. The ‘Jee Parivar’ came forward with a handsome donation in 1994 and the Jee Children Hospital was established in 1998. Jee Parivar offered to construct a new gynaecology hospital in place of the old one and the new hospital building was opened up for public service in 2004. A qualified Gynaecologist, Paediatrician and Obstetrician have been employed to offer advice to mothers on child care and provide treatment.
Ward No. Bed Capacity Ward No. Bed Capacity
VIP AC room 1 1 Semi-Special Room 1 2
Special Room 6 6 General Ward 3 39
In addition to mother and child care, Shri K.D. Parikh Trust offered to establish a Female and Child hospital for general surgeries and the construction has been started for a new 40-bed Female and Child Hospital. Currently treatment offered to both women and children is subsidized. Some deprived patients are even treated free. The hospital has also started free vaccination program women and children to reduce MMR and IMR.
Source: Field Survey, Palanpur (2011)
Banaskantha district had 218 doctors (in Govt, municipality and grant in aid other than panchayat hospitals / clinics) in 2003, which has declined to 198 in 2014 indicating about -0.87% CAGR in number of doctors. The Taluka wise details of doctors show that Palanpur has highest number of doctors, while Bhabhar has least number of doctors. Moreover, highest number of doctors has increased in Deesa between 2003 and 2014, while highest number of doctors has declined in Palanpur between 2003 and 20014, whereas there has been no decline in number of doctors between 2003 and 2014 in 9 out of 12 talukas (i.e. all talukas except Deesa, Dantiwada and Dhanera) as shown in Figure 4.3.

BANASKANTHA Human Development Report
72
Figure 4.3: Taluka wise details of Doctors and Nurses in Banaskantha
Source: Based on database of Commissionerate of Health, Medical Services, Medical Education and Research, Gujarat (2014)
Figure 4.3 depicts that Banaskantha district had 713 nurses (in Govt, municipality and grant in aid other than panchayat hospitals / clinics) in 2003, which has declined to 585 in 2014 indicating nearly -1.78% CAGR in number of nurses. The Taluka wise details of nurses show that number of nurses has declined in all the talukas except Deesa. Palanpur has highest number of nurses, while Bhabhar has least number of nurses. Moreover, highest number of nurses has declined in Palanpur between 2003 and 2014, while least number of nurses has declined in Dantiwada between 2003 and 2014.
Moreover, it is observed that between 2003 and 2014, the number of medical institutions grew at 2.92 % CAGR, while number of beds grew at -0.71 % CAGR, whereas, number of doctors grew at -0.87 % CAGR and number of nurses grew at -1.78 % CAGR. This depicts the lopsided growth in health sector that leads to bottleneck in provision of health care services in Banaskantha.
4.5. Health Care Services Offered
PHC, CHC and district hospital play vital role in provision of public health services especially in the backward region like Banaskantha. Banaskantha shares 88 PHCs out of 1187 PHCs of Gujarat in 2014 which accounts for 7.41% of PHCs of Gujarat. Banaskantha shares 19 CHCs out of 310 CHCs of Gujarat in 2014, which accounts for almost 6.12% of CHCs of Gujarat. As far as PHCs are concerned, Banaskantha shared 81 PHCs out of 1168 PHCs of Gujarat in 2012-13, which accounted for 6.93% of PHCs of Gujarat, while it served 5.45% of outdoor patients, 6.68% of indoor patients and total 4.57% of patients coming to PHCs of Gujarat in 2012-13. As far as CHCs are concerned, Banaskantha shared 20 CHCs out of 318 PHCs of Gujarat in 2012-13, which accounted for 6.28% of CHCs of Gujarat, while it served 5.99% of outdoor patients, 5.28% of indoor patients and total 5.90% of patients coming to CHCs of Gujarat in 2012-13. District and civil hospital in Banaskantha served 2.37% of outdoor patients and 2.63% of indoor patients coming to district and civil hospitals of Gujarat. However, public health facilities (PHCs, CHCs and district/civil hospitals) in Banaskantha served 4.15% of outdoor patients and 3.69% of indoor patients of the total patients served by public health facilities in Gujarat in 2012-13 as evident from Table 4.5.

BANASKANTHA Human Development Report
73
Table 4.5: Indoor and Outdoor Patients Served (2012-13)
PHC CHC Dist.+ Civil Hospital Total Outdoor Indoor Outdoor Indoor Outdoor Indoor Outdoor Indoor
Banaskantha 547085 13924 562939 73099 290608 69638 1400632 156661 Gujarat 12054794 208471 9394585 1383868 12263090 2650666 33712469 4243005 Banaskantha as % of Gujarat
4.54 6.68 5.99 5.28 2.37 2.63 4.15 3.69
Source: Computed from database of Commissionerate of Health, Medical Services, Medical Education and Research, Gujarat (2014)
However, out of total patients of Banaskantha, 36.02% of patients were served by PHCs, while 40.84% of patients were served by CHCs and 23.13% of patients were served by civil and district hospitals in 2012-13, as compared to the fact that out of total patients of Gujarat, 32.30% of patients were served by PHCs, while 28.39% of patients were served by CHCs and 39.29% of patients were served by civil and district hospitals in 2012-13. This indicates that most of the patients utilise PHC and CHC facilities in Banaskantha. It reveals that PHC and CHC play a vital role in Banaskantha and especially in rural areas. The development of required health care facilities at PHC and CHC will enhance the public health services in rural areas.
The flow of patients at various Govt. and Govt. medical institutions in Banaskantha have grown by 23.55% CAGR between 2003 and 2014. The Taluka wise details of patients admitted in Govt. and Govt. aided hospitals show that highest number of patient (men, women and children) were admitted in Palanpur and Deesa in 2003 and in Kankrej, Palanpur and Tharad in 2014. The highest increase in patient (men, women and children) has been noticed in Kankrej, Tharad and Palanpur. Along with Palanpur which is district head quarter with most of the speciality services, the Kankrej and Tharad have also witnessed greater inflow of patients for health care services between 2003 and 2014 as shown in Figure 4.4.
Figure 4.4: Taluka wise Patients Admitted in Govt./Govt. Aided Hospitals in Banaskantha Taluka wise Total Patients Admitted % of Children to Total Patients Admitted
Source: Based on database of Commissionerate of Health, Medical Services, Medical Education and Research, Gujarat (2014)

BANASKANTHA Human Development Report
74
However, on one hand there has been highest growth in number of patients in Kankrej taluka, where the number of patients admitted has grown at 43.14 % CAGR between 2003 and 2014. On the other, the number of hospitals/clinics and beds have grown at 0.96 % and 0.44 % CAGR between 2003 and 2014 and the number of doctors and nurses have declined at -4.03 % and -1.52 % CAGR between 2003 and 2014. Such situations lead to deterioration of health services. Moreover, out of the total patients admitted, about 10.18% were children in 2003, which increased to 17.29% in 2014. Though it seems that proportion of children amongst total patients has increased over the period, it reflects the awareness of child health care amongst parents even in rural Banaskantha. However, Danta, Dantiwada, Deodar, Tharad and Vadgam witnessed decline in CAGR of % of Children to total patients admitted between 2003 and 2014.
4.6. Prevalence of Major Diseases
Major diseases prevailing in Banaskantha are Acute Diarrhoeal Disease, Acute Respiratory Infection, Acute Viral Hepatitis, Measles, Malaria P. Falciparum, Malaria P. Vivax, Bacillary Dysentery, Enteric Fever and Fever of Unknown Origin. The cases suffering from Acute Diarrhoeal Disease, Acute Respiratory Infection and Acute Viral Hepatitis have been highly volatile and has increased over time (except in 2014) in Banaskantha. The cases suffering from Measles have grown at 27.85% CAGR between 2007 and 2014. The cases suffering from Enteric Fever have declined overtime in Banaskantha as shown in Table 4.6.
Table 4.6: Disease wise Cases Reported in Banaskantha
Major Diseases 2007 2008 2009 2010 2011 2012 2013 2014
Acute Diarrhoeal Disease 30421 27904 39490 45290 39760 37616 39645 24956
Acute Respiratory Infection 31651 25866 58467 99998 126014 72116 94846 57259
Acute Viral Hepatitis 138 131 148 528 413 229 316 189
Measles 55 165 174 300 200 29 84 250
Malaria Falciparum 661 144 90 175 243 90 218 31
Malaria Vivax 4111 1413 875 2634 4890 4250 2133 766
Bacillary Dysentery 2130 1820 2086 1783 1540 1135 1140 648
Enteric Fever 969 611 675 629 764 401 582 390
Fever of Unknown Origin 158499 139096 164034 100927 97899 94194 71818 31427 Source: Computed from database of Commissionerate of Health, Medical Services, Medical Education and Research, Gujarat (2014)
However, the cases suffering from Malaria (Falciparum) and the cases suffering from Malaria (Vivax) have also been noticed, but there has been decline in cases of Malaria. Due to mass awareness campaign of district administration pertaining to prevention of Malaria, there has been declining in the cases of malaria over a period of time. The cases suffering from Malaria (Falciparum) and Malaria (Vivax) have declined at -24.08% CAGR and -20.18% CAGR respectively between 2007 and 2014 in Banaskantha. However, the huge number of the cases falls under the category of Fever of Unknown Origin in Banaskantha, but such cases have declined over a period of time in Banaskantha, while the cases suffering from Bacillary Dysentery have also declined in Banaskantha between 2007 and 2014.

BANASKANTHA Human Development Report
75
Nevertheless, further efforts are required for creating mass awareness and to educate the people regarding prevention of diseases. Not only that, but also the routine health, hygiene and cleanliness guidance on large scale will help creating health awareness in rural people.
4.7. Women and Child Health Care
To reduce the rate of maternal mortality, Banaskantha has many constrains like low literacy rate. However, the district has put various activities to reduce maternal death. Encouraging the institutional delivery, the district has tried to reduce the maternal and infant death. During last decade, significant change is noticed in maternal health care in Banaskantha. In 2007-08, nearly 37.34% of deliveries were performed at home, which has decreased to almost 4.90% in 2013-14. The deliveries in private clinics have increased drastically. In 2007-08, about 54.56% of deliveries were performed in private clinics, which have increased to almost 79.79% in 2013-14. However, the deliveries in Govt. institutions have also increased moderately. In 2007-08, about 8.11% of deliveries were performed in Govt. institutions, which increased to about 15.31% in 2013-14. The institutional (Govt. & Private) deliveries which were 62.66% in 2007-08, increased to 95.10 % in 2013-14 as shown in Figure 4.5.
Figure 4.5: Details of Deliveries at Home and Institutional Deliveries
Deliveries at Private/Public Clinics and Home Taluka wise Institutional Deliveries
Source: Based on database of Commissionerate of Health, Medical Services, Medical Education and Research, Gujarat (2014)
The lowest institutional delivery was noticed in Amirgarh, while the highest institutional delivery was noticed in Vadgam in 2007-08. The lowest institutional delivery was noticed in Danta, while the highest institutional delivery was noticed in Deodar, Palanpur and Vadgam in 2013-14. The highest improvement in Institutional deliveries is noticed in Amirgarh and Deodar, while lowest improvement in Institutional deliveries is noticed in Vadgam and Palanpur as it was already improved in 2007-08. Amirgadh being a tribal area with strange socio-culture beliefs, the delivery of ANC is conducted by the father-in-law. This poises the risk of maternal death as well as infant death due to delivery assisted by non skill person.

BANASKANTHA Human Development Report
76
The share of Govt. institutions in provision of maternal health care (especially deliveries) has increased from 8.11% in 2007-08 to 15.31% in 2013-14 as compared to the share of private clinics in provision of maternal health care that increased from 54.56% in 2007-08 to 79.79% in 2013-14. Out of the total deliveries done in Govt. institutions in 2007-08, about 3.01% of deliveries were done in hospitals, nearly 51.29% of deliveries were done at CHCs, 37.88% of deliveries were done at PHCs and 7.83% of deliveries were done at sub centres, while in 2013-14, out of the total deliveries done in Govt. institutions, it is noticed that 6.75% of deliveries are done in hospitals, 51.83% of deliveries are done in CHCs, 25.59% of deliveries are done in PHCs and 15.83% of deliveries are done in sub centres. This indicates that CHCs, PHCs and sub centres has played vital role in deliveries at Govt. institutions. However, the deliveries at hospitals have remained fluctuating in Banaskantha as depicted in Figure 4.6.
Figure 4.6: Classification of Deliveries at Government Institutions and Deliveries at Home
Classification of Deliveries at Govt. Institutions Classification of Deliveries at Home
Source: Based on database of Chief District Health Office, Banaskantha (2011)
On the other hand, it has been observed that the trend in deliveries performed at home has significantly changed during last decade. The deliveries assisted by untrained dais have remarkably gone down from 4.49% in 2007-08 to 0.45% in 2013-14. This indicates that majority of deliveries are assisted by trained dais and ANMs. The deliveries assisted by trained dais have hovered between 57.7% and 59.7% between 2007-08 and 2013-14. However, the deliveries assisted by ANMs increased from 35.79% in 2007-08 to 41.80% in 2013-14. The trend of deliveries in Banaskantha reflects that although the deliveries at home have declined and there has been shift in deliveries in favour of private / public institutions due to increased reproductive and child health care facilities and various schemes, programs and campaigns.

BANASKANTHA Human Development Report
77
Map 4.1: Taluka wise Status of Deliveries in Banaskantha (2013-14)
Institutional Deliveries Home Deliveries
o the scale
Map 4.2: Taluka Wise Status of Nutrition in Anganwadi Children of Banaskantha (2014)
Ok Low Malnutrition High Malnutrition
o the scale

BANASKANTHA Human Development Report
78
4.8 Nutrition
Nutrition is one of the significant indicators of human development. The nutrition care programs can reduce the burden of under-nutrition and deprivation and also play a vital role in living health and long life. Under-nutrition is substantially higher in rural than in urban areas as short birth intervals are associated with higher levels of under-nutrition. The proportion of children who are severely underweight is almost five times higher among children whose mothers have no education than among children whose mothers have 12 or more years of schooling (UNICEF, 2011). Under-nutrition is more common for children of mothers who are malnourished themselves than for children whose mothers are not malnourished. In Banaskantha, prevalence of under nutrition is found in children from scheduled tribe having poor nutritional status as compared to the others.
Figure 4.7: Weight of New Born Children
The proportion of underweight new
born babies is slowly and gradually
decreasing in Banaskantha. In 2007-
08, almost 30.09% of new born babies
were reported to be under weight,
while in 2010-11, nearly 24.85% of
new born babies were reported to be under weight, whereas in 2013-14,
about 10.67% of new born babies
were reported to be under weight in Banaskantha.
Source: Based on database of Commissionerate of Health, Medical Services, Medical Education & Research, Gujarat (2014)
As far as nutrition in Anganwadi going children in Banaskantha is
concerned, almost 45% of children
were reported undernourished suffering from malnutrition in 2013-
14. Highest proportion (55.26%) of
Anganwadi going children were found to be under-nourished in
Deodar, while lowest proportion
(34.85%) of Anganwadi going children were found to be
undernourished in Tharad.
Figure 4.8: Nutrition in Anganwadi Going Children
Source: Based on database of Commissionerate of Health, Medical Services, Medical Education & Research, Gujarat (2014)

BANASKANTHA Human Development Report
79
Integrated Child Development Services (ICDS) primarily aims at improving the nutritional and health status of children in the age-group 0-6 years for proper psychological, physical and social development of the child. It emphasizes on enhancing the capability of the mother to look after the normal health and nutritional needs of the child through proper nutrition and health education. In order to achieve the objectives, ICDS provides package of services comprising supplementary nutrition, health check-ups, referral services, nutrition and health education, etc. Anganwadi plays a vital role in fulfilling the nutrition needs of the target group. The ICDS team comprises the Anganwadi Workers, Anganwadi Helpers, Supervisors, Child Development Project Officers (CDPOs) and District Programme Officers (DPOs). Anganwadi Worker, a lady selected from the local community, is a community based frontline honorary worker of the ICDS. She is also an agent of social change, mobilizing community support for better care of young children, girls and women. Besides, the medical officers, Auxiliary Nurse Midwife (ANM) and Accredited Social Health Activist (ASHA) form a team with the ICDS functionaries to achieve convergence of different services.
ICDS scheme in Banaskantha is operational in all the 12 talukas and has 18 clusters. There are 3334 operational Anganwadi centers in Banaskantha which can be classified by types as SC (8.76%), ST (5.35%), Minority (2.29%) and Others (83.58%). Banaskantha district has targeted construction of 3365 Anganwadi centers and serving 307081 beneficiaries till 2013-14 to fight the problem of malnutrition.
Figure 4.9: Developments under ICDS in Banaskantha
Number of Anganwadis Number of Beneficiaries
Source: Based on database of Commissionerate of Health, Medical Services, Medical Education & Research, Gujarat (2014)
In 2013-14 construction of 3334 Anganwadis was achieved against the target of 3365, i.e. 99.07% achievement as compared to 100% achievement in 2011-12 and nearly 99.73% achievement in 2009-10 and about 99.87% achievement in 2007-08. On the other hand in 279067 beneficiaries were served against the target of 307081 in 2013-14, i.e. 90.87% achievement as compared to 115.8% achievement in 2011-12 and 46.48% achievement in 2009-10 and 91.68% achievement in 2007-08 in Banaskantha as shown in Figure 4.9.

BANASKANTHA Human Development Report
80
With the aim to improve the nutritional and health status of children in the age-group 0-6 years and to reduce the incidence of mortality, morbidity, malnutrition and school dropout, various schemes and project are implemented by ICDS viz. supplementary nutrition, immunization, health check-up, referral services, pre-school non-formal education. The most innovative scheme implemented by ICDS Banaskantha is “Bhagwan No Bhaag” in which milk is provided to the beneficiaries. It has been reported that milk which is a rich nutrition supplement is provided by Anganwadi centres. It is noteworthy that 19437 beneficiaries that were under nourished and provide milk by Anganwadi centres and the total number of under nourished beneficiaries decreased to 12323 indicating 36% decline in the number of under nourished cases. The target and achievement of number of General Scheme and Special Schemes beneficiaries is presented in Figure 4.10.
Figure 4.10: Beneficiaries of Various Schemes under ICDS in Banaskantha
General Beneficiaries Beneficiaries under Special Schemes
Source: Based on database of Commissionerate of Health, Medical Services, Medical Education & Research, Gujarat (2014)
Most of the Anganwadis are located at the outskirts of the village, which obstructs its access. The availability of electricity and safe drinking water are the major problems faced by the Anganwadis. The developmental activities of Anganwadis are highly depended on the attitude of Sarpanchs, Medical Officers and Female Health Workers and therefore the integrated efforts by understanding of concerned demands and supplies play a vital role in activities of Anganwadies. As Anganwadi workers are required to visit the nearby villages for routine activities and the unavailability of state transportation frequencies, the workers avoid visiting the interior villages due to inadequate connectivity and frequencies of transport. Thus local transportation facilities highly influence the activity reach of Anganwadis and introducing circular route frequencies of public transport in interior villages are required.

BANASKANTHA Human Development Report
81
Due to no uniformity in construction of buildings of Anganwadies, in some cases, construction of building is good, but the building is without sanitation facility, while in some cases, sanitation facilities are available, but the planning and construction of buildings is poor, whereas in few cases, if the building and sanitation facilities are available, the compound wall is not constructed. This obstructs optimum utilisation of available resources for Anganwadis. The buildings are constructed by BRGF schemes, ICDS schemes as well as by private organisations, etc and hence the criteria for model Anganwadi differ.
As far as contribution of milk for Anganwadi children is concerned, due to uncertain monsoons, increasing cost of fodder and other socio-economic problems faced by farmers, there has been volatility in the volume of milk contributed for Anganwadi children. However, despite several bottlenecks in operating activities of Anganwadis, several steps can be taken to achieve the goal of Anganwadis. School admissions and rationing cards can be linked with the vaccination of the children, i.e. those students willing to take admission in schools are required to undergo full vaccination (free of cost) before joining the school. This will enhance the health care of children, if school health programs also include vaccination of those students who are required to complete the vaccination.
Moreover, at fair price shops, the allotment of food grains has to be linked with the vaccination of children; this will ensure the health care of infants and children on regular basis. The full vaccination certificate from Anganwadi can be made essential for school admission and purchase of grains from fair price shops. Moreover, the activities of Anganwadis can be expanded by linking it with cottage and micro industrial activities to ensure that the needy women gets exposure and earning opportunities through Anganwadis and in return Anganwadi prosper.
4.9 Drinking Water and Sanitation
Access to safe drinking water, adequate sanitation and proper hygiene education can reduce illness and death from disease, leading to improved health, poverty reduction, and socio-economic development. Drinking water comes from a variety of sources including public water systems, private wells or bottled water. Ensuring safe and healthy drinking water is a matter of major concern for health and hygiene. Sanitation refers to the provision of facilities and services for the safe disposal of human waste and maintenance of hygienic conditions. Unsafe water and the lack of basic sanitation and adequate hygiene is a major cause of disease and improving sanitation is known to have a significant beneficial impact on health both in households and across communities (WHO, 2011).
Most rural water supply schemes in India use a centralized, supply-driven approach, i.e. a government institution designs a project that is built with little community consultation, often requiring no water fees to be paid for its subsequent operation. Rural water supply schemes are being framed, formulated and implemented by state government through Gujarat Water Supply and Sewerage Board (GWSSB), Gujarat Water Infrastructure Limited (GWIL) and Water And Sanitation Management Organization (WASMO). Taluka wise water supply status is exhibited in Table 4.7.

BANASKANTHA Human Development Report
82
Table 4.7: Taluka wise Water Supply Status in Banaskantha
Taluka / District
Habitation Covered With Public Water Supply Schemes
Water Supply in Habitations by Sources Water
Sources Delivery Points
Public & Private Sources Total Ongoing Completed
Amirgadh 83 1 83 249 262 321 Bhabhar 57 11 57 158 164 207 Danta 180 6 179 624 606 606 Dantiwada 77 43 75 193 328 117 Deesa 254 82 247 551 733 498 Dhanera 80 21 80 231 238 171 Deodar 117 1 117 246 252 208 Kankrej 199 8 199 476 619 421 Palanpur 158 38 152 490 629 362 Tharad 147 37 147 346 541 289 Vadgam 163 11 163 475 537 318 Vav 168 39 168 302 461 285 Banaskantha 1683 298 1667 4341 5370 3803
Source: Compiled from database of Commissionerate of Health, Medical Services, Medical Education and Research, Gujarat (2014)
As far as sanitation in Banaskantha is concerned nearly 84.39% of households has sanitation (individual household latrine) facility, while 15.61% of households lack the sanitation facility. The households without individual household sanitation facilities are targeted under total sanitation campaign for providing the sanitation facilities. In Banaskantha 80.52% of target has been achieved in provision of household sanitation facilities. The target achieved for household sanitation facilities and proportion of households with sanitation facilities is shown in Figure 4.11.
Figure 4.11: Taluka wise Sanitation Facility available in Households of Banaskantha
Target Achieved for Household Sanitation % Households with Sanitation Facility
Source: Based on database of National Rural Drinking Water Program, Government of India (2011).
BANASKANTHA Human Development Report
83
On the basis of baseline survey conducted in 1998 under total sanitation campaign of Govt. of India, it was found that 80.15% of households in Banaskantha did not had individual household sanitation facilities and only 19.48% had individual household sanitation facilities. It was therefore targeted to develop the individual household sanitation facilities on priority basis.
Till 2011, 80.52% of target has been achieved and as a result total 84.39% of households had individual household sanitation facilities. Highest target has been achieved in Vadgam taluka, while lowest target has been achieved in Deesa taluka. Palanpur, Tharad, Vadgam and Vav had achieved the target higher than the district average achievement. Moreover, Vadgam has highest proportion of households with sanitation facilities, while Deesa has least proportion of households with sanitation facilities.
4.10. Schemes and Programs for Health Care
Various programs and schemes for health care are being implemented with major focus on target groups. One of the major initiative is Reproductive and Child Healthcare program that deals with effective maternal and child health care, safe management of unwanted pregnancies, access to contraceptives, nutritional services to vulnerable groups, prevention and treatment of RTI/STI, reproductive health services for adolescents, treatment of gynecological problems, screening and treatment of uterine, cervical and breast cancers.
Box 4.3: Major Schemes and Programs for Health Care Schemes / Programs Brief Details of Schemes / Programs
Chiranjivi Yojana To provide maternity services to the BPL mothers at their nursing homes/Hospitals. It is a cashless scheme.
Janani Surksha Yojana To facilitate pregnant women of BPL families and completed 19 years. The benefit is entitled for only two live births. For delivery in Govt. or Private Hospital, pregnant women of rural area is paid Rs. 500/- in cash and Rs. 200/- for transportation. For home delivery pregnant women is paid Rs. 500/- for supplementary nutrition.
Bal Sakha Scheme To provide neonatal care to all babies born to BPL mothers by partnering pediatricians, including care in their Neonatal Intensive Care Unit (level 2 ) at no cost.
Mamta Taruni Abhiyan To provide basic health care and counseling to the adolescents. Kishori Shakti Yojana To enroll and train the adolescent girls for nutrition awareness, personnel
hygiene, health care, self employment, supplementary nutrition and micronutrient benefits.
Mamta Abhiyan To strengthen comprehensive outreach of RCH Services, aims at preventive, promotive & curative services. It includes Mamta Divas (Health/Nutrition Day), Mamta Sandarbh (Referral Services), Mamta Mulakat (Post natal care visit), Mamta Nondh (Recordings)
Immunization for SHAP To achieve universal immunization of children under one year of age against the six vaccine preventable diseases (tuberculosis, diphtheria, pertussis, tetanus, poliomyelitis, and measles) to reduce infant and child morbidity and mortality.
Rogi Kalyan Samiti To help BPL patients with medical care for cardiac illness, neurological problems, nephrological problems, ophthalmological problems and others
108 EMRI Services To ensure efficient delivery of emergency medical care service. The service has revolutionized the response to the people in distress and ensured access and affordability for the benefit of people
Source: Compiled from database of Commissionerate of Health, Medical Services, Medical Education and Research Gujarat (2011)

BANASKANTHA Human Development Report
84
Other health care and nutrition programs are Mobile Health Services, National Tuberculosis Control Program, National Leprosy Eradication Program, National Vector Born Disease Control Program, National AIDS Control Program, National Program for Blindness, Rastriya Swasthya Bima Yojana, Adolescent Anaemia Program Balika Samrudhi Yojana etc.
Vaccination plays vital role in maternal and child health care is the process to make the person resistant to an infectious disease by the administration of a vaccine. It is one of the most cost-effective health investments that make it accessible to even the vulnerable populations. To achieve the goal of reducing the maternal and infant death, it is most important that all the expected mothers and new born children should be cover under various vaccinations. The performance of maternal and child health care activities vaccination in Banaskantha is presented in Figure 4.12.
Figure 4.12: Women and Child Health Care Coverage in Banaskantha
Source: Based on database of Commissionerate of Health, Medical Services, Medical Education and Research, Banaskantha (2014)
It has been observed that BCG coverage ranged from 89.70% to 102.04%, while DTP 3 coverage hovered between 92.49% and 97.31% last decade. DTP booster coverage remained between 83.70% and 90.06%, while OPV booster lingered from 83.09% to 88.68%. Measles vaccination coverage ranged from 92.22% to 94.86% and full immunisation coverage remained between 90.05% and 93.88%. ANC registration remained between 92.61% and 95.89% of the workload while ANC 3 checkups coverage ranged between 68% and 73.46% last decade in Banaskantha. Proper administering at micro level and monitoring the implementation is required, which shall improve the full immunisation coverage in Banaskantha.

BANASKANTHA Human Development Report
85
4.11. Success Stories
Box 4.4: Performance of Banaskantha in Health Care Compared of Gujarat (2012-13)
Scheme Indicator Banaskantha Gujarat
Chiranjeevi Yojana % of Normal Delivery 89.74 86.26 % of LSCS 7.19 7.82 % of Complicated 3.06 5.92
Bal Sakha Yojana % Admitted To NICU-2 10.56 15.05 % Referred To NICU-3 0.00 0.88
National Program for Control of Blindness
% cases served by District Hospital 3.54 3.18 % cases served by Sub-District Hospital 3.50 3.25 % cases served by DMU / CMU 0.00 0.19 % cases served by NGO 24.20 4.70 % cases served by Private 68.74 52.24 % cases served by Others 0.00 1.04
Performance of ANC Registration
% against Workload 68.71 72.97 % of Early Registration to Total ANC 68.71 72.97
BCG Immunization % against Workload 87.11 91.47 % against Live Birth 99.27 103.18
DPT 3rd Dose Immunization % against Workload 92.65 92.04 % against Live Birth 99.19 99.41
Measles Immunization % against Workload 91.94 91.17 % against Live Birth 98.43 98.48
Fully Immunized Children % against Workload 93.03 90.71 % against Live Birth 99.59 97.97
Performance of Sterilization % against Workload 94.6 83.8 % of NSV to total Sterilization 0.0 0.7
Source: Compiled from database of Commissionerate of Health, Medical Services, Medical Education and Research, Gujarat (2013)
Box 4.5: Helping Hands: Jani Suraksha / Chiranjivi Yojana
Bhikhiben Bajaniya, 26 years old illiterate lady from Agthala village was pregnant for the second time. ASHA worker visited Bhikhiben and advised her for medical checkup on Mamta Divas. ASHA worker also registered Bhikhiben and informed FHW. FHW and ASHA worker visited Bhikhiben’s house and examined her and advised for nutrition diet, TT vaccination and ANC service and total rest to Bhikhiben’s husband and mother in law. Under Janani Suraksha Yojana, Bhikhiben was registered as BPL beneficiary and was given ANC service (TT vaccine, Iron/Folic Acid tablets, Blood/Weight Examination, etc). FHW and ASHA worker advised Bhikhiben and her mother in law for institutional delivery and use 108 emergency services. Over a period of time, when Bhikhiben underwent labour pain, it was heavily raining in monsoon. ASHA worker called 108 and referred Bhikhiben at maternity hospital, Palanpur. Bhikhiben was given free of cost treatment under Janani Suraksha Yojana and Chiranjivi Yojna as she delivered male child by normal delivery. Bhikhiben was advised for early breastfeeding, BCG and Polio vaccination. Bhikhiben adopted for family planning operation with the consent of her husband and mother in law after delivering the second child.
Source: Field Survey, Deesa (2011)

BANASKANTHA Human Development Report
86
Box 4.6: Providing Nutrition: Bhagwan No Bhaag and Dudh Sanjivani Schemes
‘Bhagwan No Bhaag’ (God’s Share) is a scheme set to fight against malnutrition among children in the villages of the district. The scheme is initiated by Banas Dairy and state government. The Banas Dairy has issued a circular to all its village level milk societies (milk collection centres) asking them to set aside a portion of their daily milk production voluntarily, which is collected and later on given to the children of the villages. The special milk cans have the symbol of 'Bhagvan no Bhag'. The idea behind this approach is that people voluntarily donate milk daily at the village level and the collected milk is distributed to the children in Anganvadi or Balmandir in the village itself with the rationale to fight against malnutrition among children in Banaskantha district through involving people at village level.
‘Dudh Sanjeevani’ is the scheme to provide flavoured milk to school children in the tribal belt of Gujarat is paying rich dividends, as it has improved the attendance of students in schools. This scheme is jointly sponsored by the state government, Banas Dairy and Ambaji Temple Trust and the project has been gaining momentum among the school-going children. The attendance of children has gone up by 10% to 20% and the number of the absentees has been negligible in some of the schools in tribal areas since the introduction of the scheme.
Source: Field Survey, Deodar, Danta (2011)
Figure 4.13: Beneficiaries of Dudh Sanjivani Yojana in Tribal Banaskantha
No. of Beneficiaries (Schools) No. of Beneficiaries (Students)
Source: Based on database of Integrated Child Development Serves, Banaskantha (2014)
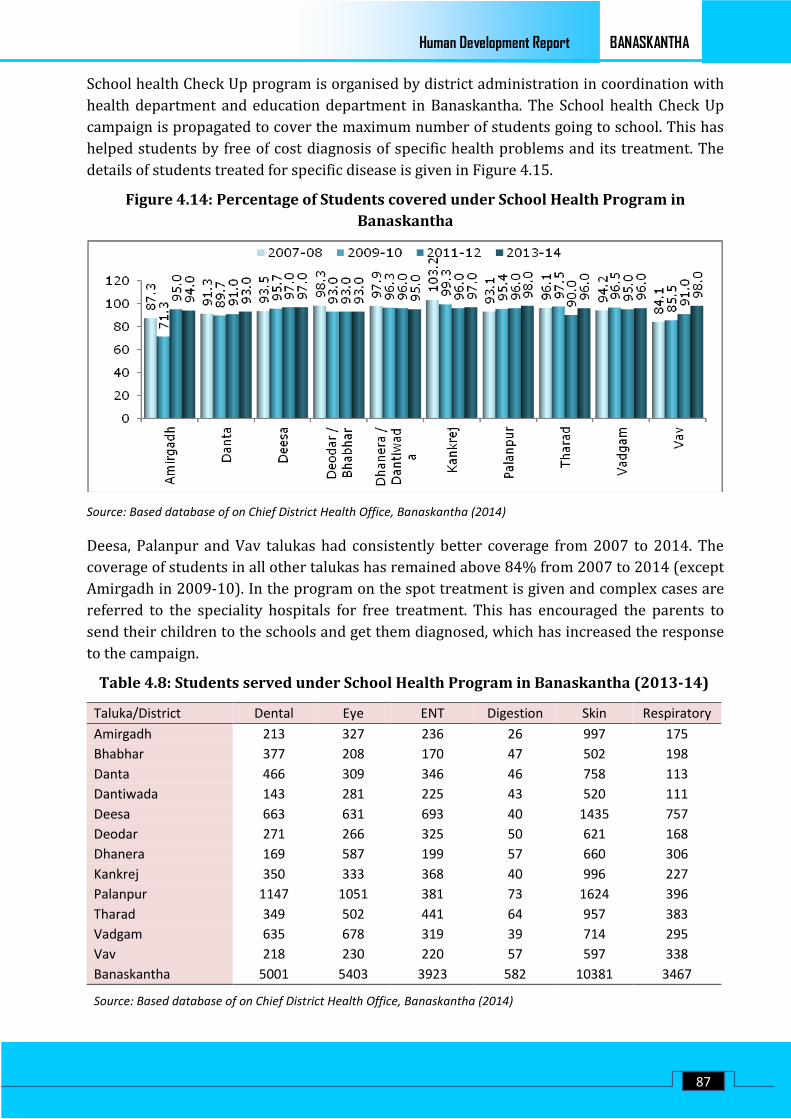
BANASKANTHA Human Development Report
87
School health Check Up program is organised by district administration in coordination with health department and education department in Banaskantha. The School health Check Up campaign is propagated to cover the maximum number of students going to school. This has helped students by free of cost diagnosis of specific health problems and its treatment. The details of students treated for specific disease is given in Figure 4.15.
Figure 4.14: Percentage of Students covered under School Health Program in Banaskantha
Source: Based database of on Chief District Health Office, Banaskantha (2014)
Deesa, Palanpur and Vav talukas had consistently better coverage from 2007 to 2014. The coverage of students in all other talukas has remained above 84% from 2007 to 2014 (except Amirgadh in 2009-10). In the program on the spot treatment is given and complex cases are referred to the speciality hospitals for free treatment. This has encouraged the parents to send their children to the schools and get them diagnosed, which has increased the response to the campaign.
Table 4.8: Students served under School Health Program in Banaskantha (2013-14)
Taluka/District Dental Eye ENT Digestion Skin Respiratory Amirgadh 213 327 236 26 997 175 Bhabhar 377 208 170 47 502 198 Danta 466 309 346 46 758 113 Dantiwada 143 281 225 43 520 111 Deesa 663 631 693 40 1435 757 Deodar 271 266 325 50 621 168 Dhanera 169 587 199 57 660 306 Kankrej 350 333 368 40 996 227 Palanpur 1147 1051 381 73 1624 396 Tharad 349 502 441 64 957 383 Vadgam 635 678 319 39 714 295 Vav 218 230 220 57 597 338 Banaskantha 5001 5403 3923 582 10381 3467
Source: Based database of on Chief District Health Office, Banaskantha (2014)

BANASKANTHA Human Development Report
88
4.12 Summary
Box 4.7: SWOC Analysis for Health, Nutrition and Sanitation in Banaskantha
Strengths Weaknesses
• Existence of 450 Sub Centers, 88 PHCs, 19 CHCs, and 2 Govt Hospitals.
• The trend has shifted from home delivery to institutional deliveries.
• The most of the home deliveries are assisted by trained dais/ANMs.
• For sanitation, 80.52% of target has been achieved and as a result 84.39% of households have individual household sanitation facilities.
• School health checkups and referral services have given good results in Banaskantha.
• Bhagvan No Bhag scheme has played vital role in providing nutrition to the children
• Vast gap between health care infrastructure in Urban and Rural areas.
• Medical and Para Medical staff positions vacant at various levels.
• Public clinics attract less number of patients for maternity care compared to private clinics.
• About 40% of Anganwadi going children in Banaskantha are under nourished.
• Only 65.4% of Anganwadis in Banaskantha have drinking water facilities.
• Increasing CAGR of patients and declining CAGR of Doctors and Nurses create bottlenecks in provision of health care services.
Opportunities Challenges
• Chiranjvi Yojana, Janani Suraksha Yojana has played vital role in women and child health care and can be strengthened further to shower its benefits in deprived areas.
• Vaccination and Immunisation schemes can be more effective provided there are regular follow ups.
• All the Anganwadis can be covered under Bhagvan No Bhag scheme to cover all the under nourished children going to Anganwadis.
• Women and Child health care services in Tribal areas to be strengthened for better results in such areas.
• Spreading health care awareness in remote areas with scattered population and low literacy is a major challenge.
• Lack of basic health care services in backward areas due to non availability of staff.
• BPL families are very scattered, so it is tough to provide service.
• Migration ratio is very fluctuation. So to evaluate the progress of activity is being tough.
• Malaria epidemic prone disease district.
• To increase the vaccination and immunisation in scattered and tribal areas.

BANASKANTHA Human Development Report
89
4.13 Health, Nutrition and Sanitation: Taluka Wise Status of by Radars
Patients Served per Govt. Hospital/Clinic (2014) % of Institutional Deliveries (2014)
% Schools with Drinking Water Facility (2014) % Anganwadis with Drinking Water Facility (2014)
% of Students Covered Under Health Checkup (2014) % of Anganwadi Children Undernourished (2014)

BANASKANTHA Human Development Report
90
Chapter 5
POVERTY,
FOOD SECURITY
AND VULNERABILITY
BANASKANTHA Human Development Report
91
Chapter 5
POVERTY, FOOD SECURITY AND VULNERABILITY
5.1 Introduction
Poverty is a social construct that varies from society to society and from time to time. It has subjective as well as objective dimensions. Perception about one’s own position of being poor or not poor is not invariably related to having certain material possessions and such perception is not always metaphysical. More often than it is not constructed in context with social situation in which one lives and interacts (Shah Ghanshyam, 2004). Generally the poverty is reviewed in the context of socio-economic conditions, availability of resources and the goal that the society has set in to achieve at a given point of time. Moreover, the populations affected by poverty and food insecurity overlap, but they are not identical. However, poor and food insecure people are vulnerable due to deprivation from well being. Not all poor people are food insecure, and the risk of food insecurity also extends to people living above the poverty level. Food security is termed as access by people at all times to enough food for an active and healthy life, while food insecurity is termed as uncertain availability of nutritionally adequate and safe foods or uncertain ability to acquire acceptable foods in socially acceptable ways (John Cook and Frank Deborah Frank, 2008). There has been a conceptual broadening in the notions of well being and deprivation over a period of time and therefore, the notion of well being significantly incorporates the aspects pertaining to extent of vulnerability to assess the status of wellbeing.
In line with the Government of India’s program of poverty eradication, the Commissioner of Rural Development, Government of Gujarat carried out Socio Economic Survey to estimate the BPL families and assess their status in terms of specified indicators. The survey was initiated in Gujarat in 2002-03 and later on add-on list was added in 2008-09. The chapter presents the analytical aspects based on the same. The aspects of poverty (including income level, land holding features, housing conditions, sanitation conditions, literacy aspects, status of household labour force, means of livelihood, condition of children etc has been discussed. The aspects of food security as well as vulnerability are analysed in the chapter. The programs for BPL and vulnerable groups, its performance, success stories and status of talukas on poverty, food security and vulnerability are also presented in the chapter.
5.2 Poverty
In Banaskantha, 483550 families were surveyed of which, almost 235046 (48.61%) families turned out to be poor, with the score of 20 or below. However, 248504 (51.39%) families turned out to be above BPL, with the score above 20. Out of total BPL families in Banaskantha, 55.15% families turned out to be very poor with the score ranging from 0 to 16, while 44.84% of BPL families turned out to be less poor with the score ranging from 17 to 20. The taluka wise status of BPL families is presented in the Figure 5.1.

BANASKANTHA Human Development Report
92
Figure 5.1: BPL List (2013-14) Families in Banaskantha
BPL Families out of Total Families Surveyed % of Very Poor and Poor Families
Source: Based on database of Commissionerate of Rural Development, Gujarat (2014)
Amongst all the talukas of Banaskantha, Bhabhar has highest number of BPL families out of its total families surveyed, while Dhanera has least number of BPL families out of its total families surveyed. In Bhabhar taluka out of total families surveyed, about 74.74% families turned out to be BPL families, while 25.26% families turned out to be APL families. In Dhanera taluka out of total families surveyed, about 39.55% families turned out to be BPL families, while 60.45% families turned out to be APL families. Moreover, amongst all the talukas of Banaskantha, Bhabhar has highest number of very poor families (score 0-16) out of its total BPL families, while Dhanera has least number of very poor families (score 0-16) out of its total BPL surveyed. In Bhabhar taluka out of total BPL families, about 64.74% of families turned out to be very poor families, while 35.26% of families turned out to be poor families. In Dhanera taluka out of total BPL families, about 46.75% of families turned out to be very poor families, while 53.25% of families turned out to be poor families.
5.2.1 Income Level
The income level of the BPL families (score 0-20) in Banaskantha, depicts that 73.44% of families have average monthly income below Rs. 500, while 22.56% of families have average monthly income between Rs. 500 and Rs. 1500, whereas, 4.0% of families have average monthly income above Rs. 1500. However, out of total very poor families (score 0-16) in Banaskantha, 80.68% of families have average monthly income below Rs. 500, while 16.74% of families have average monthly income between Rs. 500 and Rs. 1500, whereas, 2.58% of families have average monthly income above Rs. 1500. The average monthly income of BPL families in talukas of Banaskantha is presented in the Figure 5.2.

BANASKANTHA Human Development Report
93
Figure 5.2: Average Monthly Income of BPL List (2013-14) Families in Banaskantha
Income (In Rs.) of BPL Families (0-20 Score) Income (In Rs.) of BPL Families (0-16 Score)
Source: Based on database of Commissionerate of Rural Development, Gujarat (2014)
In Vadgam almost 86.47% of BPL families (score 0-20) and 95.43% of very poor (score 0-16) families earn average monthly income below Rs. 500. While, in Dantiwada, only 58.09% of BPL families (score 0-20) and 64.12% of very poor (score 0-16) families earn average monthly income below Rs. 500. In Amirgadh nearly 34.13% of BPL families (score 0-20) and in Dantiwada 28.89% of very poor (score 0-16) families earn average monthly income between Rs. 500 and Rs. 1500. While, in Vadgam, only 11.14% of BPL families (score 0-20) and 3.81% of very poor (score 0-16) families earn average monthly income between Rs. 500 and Rs. 1500. Moreover, in Dantiwada as much as 9.06% of BPL families (score 0-20) and 6.99% of very poor (score 0-16) families earn average monthly income above Rs. 1500. While, in Vav, 2.38% of BPL families (score 0-20) and in Vadgam 1.39% of very poor (score 0-16) families earn average monthly income above Rs. 1500.
5.2.2 Land Holding Features
The land holding features of BPL families (score 0-20) in Banaskantha reveals that 61.26% of families do not possess land, while only 38.74% of families possess land. Moreover, out of the total BPL families (score 0-20) who possess land, as much as 80.83% of family have less than 1 hectare of unirrigated and 0.5 hectare of irrigated land. On the other hand, out of total very poor families (score 0-16) in Banaskantha, 71.64% of families do not possess land, while only 28.36% of families possess land. Moreover, out of the total very poor families (score 0-16) who possess land, as much as 86.63% of family have less than 1 hectare of unirrigated and 0.5 hectare of irrigated land. The taluka wise land holding features of BPL families in Banaskantha is presented in the Figure 5.3.

BANASKANTHA Human Development Report
94
Figure 5.3: Land Holding Features of BPL List (2013-14) Families in Banaskantha
Landless BPL Families (0-20 Score) Landless BPL Families (0-16 Score)
Source: Based on database of Commissionerate of Rural Development, Gujarat (2014)
Vadgam taluka possess highest fraction of landless BPL families to its total BPL families and Amirgadh taluka possess lowest fraction of landless BPL families to its total BPL families. In Vadgam taluka, out of total BPL families (score 0-20), as many as 82.31% of families are landless and only 17.69% of families possesses land. On the other hand out of total very poor families (score 0-16) in Vadgam, almost 88.28% of very poor families are landless and 11.72% of very poor families posses land. In Amirgadh, out of total BPL families (score 0-20), about 38.16% of BPL families are landless and nearly 61.84% of families possesses land. On the other hand out of total very poor families (score 0-16) in Amirgadh, nearly 46.31% of very poor families are landless and about 53.69% of very poor families posses land.
5.2.3 Housing Conditions
The housing condition of BPL families (score 0-20) in Banaskantha shows that 22.10% of families do not possess housing facilities, while 61.8% of families possess kachha houses and 16.1% of families have half pakka, pakka and city type houses. However, out of total very poor families (score 0-16) in Banaskantha, 28.8% of families do not possess housing facilities, while 59.7% of families possess kachha houses and 11.5% of families have half pakka, pakka and city type houses. The taluka wise housing condition of BPL families in Banaskantha is shown in the Figure 5.4.
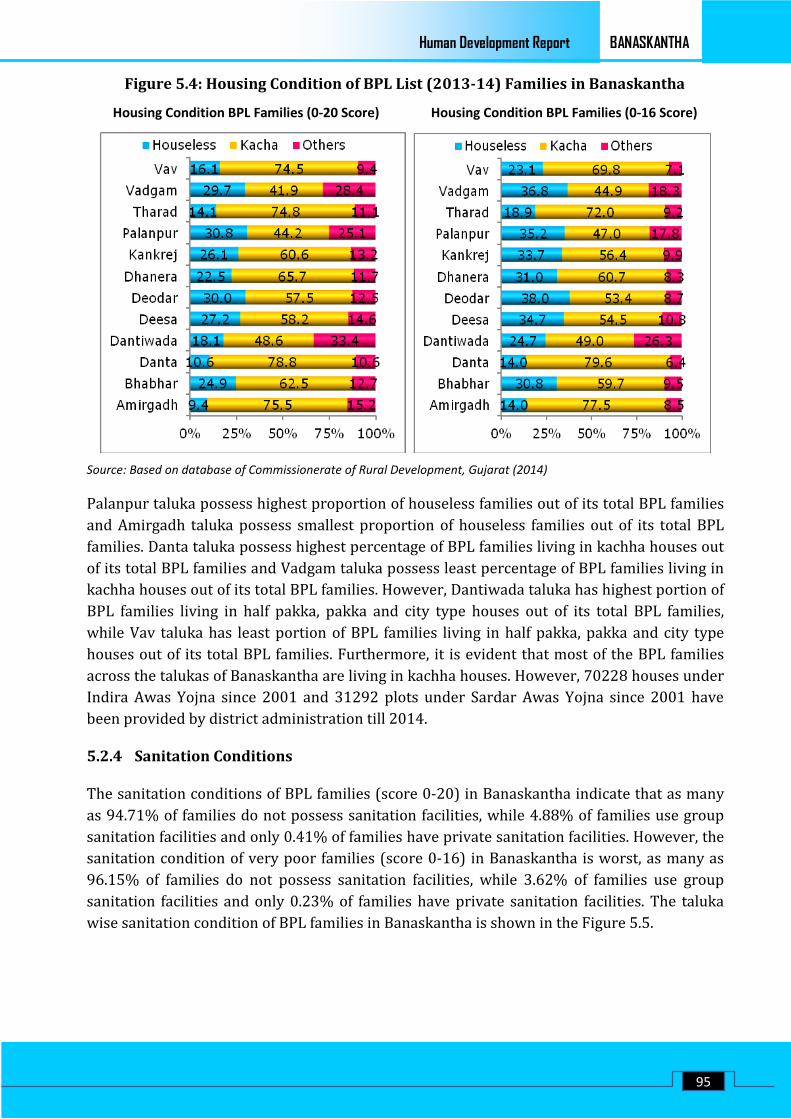
BANASKANTHA Human Development Report
95
Figure 5.4: Housing Condition of BPL List (2013-14) Families in Banaskantha
Housing Condition BPL Families (0-20 Score) Housing Condition BPL Families (0-16 Score)
Source: Based on database of Commissionerate of Rural Development, Gujarat (2014)
Palanpur taluka possess highest proportion of houseless families out of its total BPL families and Amirgadh taluka possess smallest proportion of houseless families out of its total BPL families. Danta taluka possess highest percentage of BPL families living in kachha houses out of its total BPL families and Vadgam taluka possess least percentage of BPL families living in kachha houses out of its total BPL families. However, Dantiwada taluka has highest portion of BPL families living in half pakka, pakka and city type houses out of its total BPL families, while Vav taluka has least portion of BPL families living in half pakka, pakka and city type houses out of its total BPL families. Furthermore, it is evident that most of the BPL families across the talukas of Banaskantha are living in kachha houses. However, 70228 houses under Indira Awas Yojna since 2001 and 31292 plots under Sardar Awas Yojna since 2001 have been provided by district administration till 2014.
5.2.4 Sanitation Conditions
The sanitation conditions of BPL families (score 0-20) in Banaskantha indicate that as many as 94.71% of families do not possess sanitation facilities, while 4.88% of families use group sanitation facilities and only 0.41% of families have private sanitation facilities. However, the sanitation condition of very poor families (score 0-16) in Banaskantha is worst, as many as 96.15% of families do not possess sanitation facilities, while 3.62% of families use group sanitation facilities and only 0.23% of families have private sanitation facilities. The taluka wise sanitation condition of BPL families in Banaskantha is shown in the Figure 5.5.

BANASKANTHA Human Development Report
96
Figure 5.5: Sanitation Conditions of BPL List (2013-14) Families in Banaskantha Sanitation Condition BPL Families (0-20 Score) Sanitation Condition BPL Families (0-16 Score)
Source: Based on database of Commissionerate of Rural Development, Gujarat (2014)
In terms of sanitation condition of BPL families (score 0-20), the scenario is better in Deodar taluka and most unpleasant in Tharad taluka, while in case of sanitation condition of very poor families (score 0-16), the scenario is better in Kankrej taluka and worst in Tharad taluka. Tharad taluka possess highest proportion (99%) of families without sanitation facilities out of its total BPL families (score 0-20) and Deodar taluka possess smallest proportion (91.20%) of families without sanitation facilities out of its total BPL families (score 0-20). On the other hand, as far as very poor families (score 0-16) are concerned, almost 98.95% of families in Tharad taluka do not possess sanitation facilities, while almost 94.34% of families in Kankraj taluka do not possess sanitation facilities. However, 143981 sanitation facilities under Total Sanitation Campaign have been provided to BPL beneficiaries by district administration since 2004-05. 5.2.5 Literacy Aspects
The literacy scenario of BPL families (score 0-20) in Banaskantha indicate that almost 68.45% of families are illiterate, while 31.55% of families are literate. However, the literacy scenario of very poor families (score 0-16) in Banaskantha indicate that almost 46.80% of families are illiterate and 53.20% of families are literate. The taluka wise literacy in BPL families of Banaskantha is exhibited in the Figure 5.6.
Figure 5.6: Literacy Level of BPL List (2013-14) Families in Banaskantha Literacy in BPL Families (0-20 Score) Literacy in BPL Families (0-16 Score)
Source: Based on database of Commissionerate of Rural Development, Gujarat (2014)

BANASKANTHA Human Development Report
97
In terms of literacy in BPL families, the scenario is better in Vadgam taluka and worst in Dantiwada taluka. Dantiwada taluka possess highest proportion (77.81%) of families which are illiterate out of its total BPL families (score 0-20) and Vadgam taluka possess smallest proportion (54.66%) of illiterate families out of its total BPL families (score 0-20). As far as very poor families (score 0-16) are concerned, almost 53.52% of families in Dantiwada taluka are illiterate, while 39.30% of families in Vadgam taluka are illiterate.
Box 5.1: Education Facilities for Poor Girls in Tribal Areas of Banaskantha
There are 2 tribal talukas (Amirgadh and Danta) in Banaskantha, which has 10 and 14 Ashram Schools respectively run by Tribal / Social Welfare Department. In Amirgadh, out of 10 such schools, 3 schools (each in Rampura Khemrajiya Virampur) are Girls’ Schools (Kanya Ashrams), while in Danta, out of 14 such schools, 2 schools (each in Dalpura, Sanali ) are Girls’ Schools. All these schools have primary with upper primary sections. All the schools have most of the classrooms in good conditions and nearly 90% of the sanctioned teaching staff is in position. All the schools are electrified and have drinking water facility, but none of the schools have toilet facilities. The Student : Classroom Ratio ranges from 15 to 26, while Pupil : Teacher Ratio in majority of these schools ranges from 15 to 40 except in Dalpura school which has Pupil : Teacher Ratio if 64. All the students are given textbooks, uniform and stationary free of cost.
Source: Field Survey, Amirgadh, Danta (2011)
5.2.6 Status of Household Labour Force
The household labour force in BPL families (score 0-20) of Banaskantha reveal no prevalence of female and child labour (FCL), 8.36% of adult female and no child labour (AFNCL), 6.85% of adult male labour (AML), 77.68% are other workers, while 7.10% of families do not work. The household labour force in very poor families (score 0-16) of Banaskantha reveal no prevalence of female and child labour, 12.50% of adult female and no child labour, 8.14% of adult male labour, 73.58% are involved in other work, while 5.79% of families do not work. Taluka wise household labour force profile of BPL families in Banaskantha is presented in Table 5.1.
Table 5.1: Household Labour Force in BPL List (2013-14) Families in Banaskantha
Taluka/ District
Household Labour (BPL 0-20 Score) Household Labour (BPL 0-16 Score) FCL AFNCL AML Others No Work FCL AFNCL AML Others No Work
Amirgadh 0.00 6.60 3.84 70.94 18.61 0.00 10.10 5.52 68.67 15.71 Bhabhar 0.00 11.17 3.63 82.36 2.84 0.00 16.35 4.35 76.73 2.57 Danta 0.00 6.65 8.30 78.30 6.74 0.00 10.31 9.06 74.39 6.24 Dantiwada 0.00 11.44 5.22 78.01 5.34 0.00 17.28 5.79 72.44 4.50 Deesa 0.00 7.89 7.75 79.05 5.32 0.00 12.07 9.16 74.39 4.39 Deodar 0.00 10.98 8.45 75.32 5.26 0.00 15.88 8.91 72.13 3.08 Dhanera 0.00 8.30 5.79 78.11 7.80 0.00 11.48 7.20 76.66 4.66 Kankrej 0.00 11.84 6.24 75.11 6.81 0.00 16.51 7.50 69.63 6.36 Palanpur 0.00 8.73 7.46 79.60 4.21 0.00 12.10 8.84 75.49 3.57 Tharad 0.00 8.62 6.48 72.10 12.80 0.00 13.54 7.77 68.03 10.66 Vadgam 0.00 7.43 7.43 82.51 2.63 0.00 11.43 8.58 77.70 2.28 Vav 0.00 3.90 8.08 79.50 8.52 0.00 5.84 10.91 76.60 6.65 Banaskantha 0.00 8.36 6.85 77.68 7.10 0.00 12.50 8.14 73.58 5.79
Source: Computed from database of Commissionerate of Rural Development, Gujarat (2014) Note: FCL: Female & Child Labour, AFNCL: Adult Female & No Child Labour, AML: Adult Male Labour

BANASKANTHA Human Development Report
98
As far as BPL families (score 0-20) are concerned, out of all the talukas of Banaskantha, Kankrej taluka possess highest proportion (11.84%) of families with adult female and no child labour out of its total BPL families, while Deesa taluka possess highest proportion (7.75%) of families with adult male labour out of its total BPL families, whereas, Tharad taluka possess highest proportion (12.80%) of non working families out of its total BPL families. As far as very poor families (score 0-16) are concerned, out of all the talukas of Banaskantha, Dantiwada taluka possess highest proportion (17.28%) of families with adult female and no child labour out of its total very poor families, while Vav taluka possess highest proportion (10.91%) of families with adult male labour out of its total BPL families, whereas, Amirgadh taluka possess highest proportion (15.71%) of non working families out of its total very poor families.
5.2.7 Means of livelihood
The livelihood features of BPL families (score 0-20) of Banaskantha portray that 70.98% of families are casual labourers, while 26.29% of families are subsistence cultivators, whereas, 2.72% of families are salaried, artisan and others. The livelihood features of very poor families (score 0-16) of Banaskantha reveal 83.50% of families are casual labourers, while 15.12% of families are subsistence cultivators, whereas, 1.38% of families are salaried, artisan and others. The taluka wise livelihood features of BPL families in Banaskantha are shown in Figure 5.7.
Figure 5.7: Livelihood Features of BPL List (2013-14) Families in Banaskantha
Livelihood of BPL Families (0-20 Score) Livelihood of BPL Families (0-16 Score)
Source: Based on database of Commissionerate of Rural Development, Gujarat (2014) Note: Casual Lab: Casual Labourers, Sub Cul: Subsistence Cultivators
As far as BPL families (score 0-20) are concerned, out of all the talukas of Banaskantha, Vadgam taluka possess highest proportion (84.27%) of families engaged in casual labour and out of its total BPL families, while Tharad taluka possess highest proportion (36.74%) of families engaged in subsistence cultivation, whereas, Vadgam taluka also possess highest proportion (3.56%) of families which are salaried, artisan and others. As far as very poor families (score 0-16) are concerned, out of all the talukas of Banaskantha, Vadgam taluka

BANASKANTHA Human Development Report
99
possess highest proportion (90.77%) of families engaged in casual labour and out of its total BPL families, while Danta taluka possess highest proportion (21.21%) of families engaged in subsistence cultivation, whereas, Vadgam taluka also possess highest proportion (2.39%) of families which are salaried, artisan and others.
5.2.8 Condition of Children
The conditions of children in BPL families (score 0-20) of Banaskantha depict that in 53.02% of families children are not going to school and working, while in 29.46% of families children are going to school and working, whereas in 17.52% of families children are going to school and not working. The livelihood features of very poor families (score 0-16) of Banaskantha reveal that in 57.81% of families children are not going to school and working, while in 28.31% of families children are going to school and working, whereas in 13.88% of families children are going to school and not working. The taluka wise condition of children in BPL families of Banaskantha is exhibited in Figure 5.8.
Figure 5.8: Condition of Children in BPL List (2013-14) Families in Banaskantha
Children Condition in BPL Families (0-20 Score) Children Condition in BPL Families (0-16 Score)
Source: Based on database of Commissionerate of Rural Development, Gujarat (2014) Note: NGSW: Not Going to School and Working, SGW: School Going and Working, SGNW: School Going & Not Working.
As far as BPL families (score 0-20) are concerned, out of all the talukas of Banaskantha, Tharad taluka possess highest proportion (64.87%) of families with children not going to school and working, while Dantiwada taluka possess highest proportion (45.67%) of families with children which are school going and working, whereas, Palanpur taluka possess highest proportion (32.15%) of families with children which are school going and not working. As far as very poor families (score 0-16) are concerned, out of all the talukas of Banaskantha, Deodar taluka possess highest proportion (68.57%) of families with children not going to school and working, while Dantiwada taluka possess highest proportion (42.36%) of families with children which are school going and working, whereas, Palanpur taluka possess highest proportion (26.14%) of families with children which are school going and not working.

BANASKANTHA Human Development Report
100
5.2.9 Indebtedness Dimension
The indebtedness dimension of BPL families (score 0-20) of Banaskantha illustrate that 62.88% of families out of total BPL families take debt for daily purpose from informal sources, while 19.99% of families out of total BPL families take debt for production and other purpose from informal sources, whereas 8.93% of families out of total BPL families borrow from institutional agencies and 8.20% of families from total BPL families are not under indebtedness. Moreover, the Indebtedness dimension of very poor families (score 0-16) of Banaskantha illustrate that 74.13% of families out of total BPL families take debt for daily purpose from informal sources, while 16.64% of families out of total BPL families take debt for production and other purpose from informal sources, whereas 4.92% of families out of total BPL families borrow from institutional agencies and 4.31% of families from total BPL families are not under indebtedness. The taluka wise indebtedness dimension of BPL families of Banaskantha is demonstrated in Table 5.2.
Table 5.2: Indebtedness Dimension of BPL List (2013-14) Families in Banaskantha
Taluka/ District
% of BPL Families (0-20 Score) % of BPL Families (0-16 Score) DPIS POPIS BIA NIPA DPIS POPIS BIA NIPA
Amirgadh 55.87 33.74 3.99 6.40 65.46 27.21 3.88 3.45 Bhabhar 67.24 17.15 7.39 8.22 74.51 14.35 4.51 6.63 Danta 69.40 18.04 6.48 6.09 78.53 16.18 2.97 2.32 Dantiwada 63.71 15.43 7.75 13.11 74.88 14.24 6.15 4.72 Deesa 61.39 20.74 11.05 6.82 74.69 16.93 5.93 2.45 Deodar 65.98 19.77 5.65 8.60 76.24 16.23 2.83 4.70 Dhanera 52.36 22.36 19.29 5.99 72.37 14.69 10.52 2.42 Kankrej 68.27 19.78 5.00 6.95 77.05 15.87 3.19 3.90 Palanpur 64.82 16.90 6.30 11.98 75.19 14.21 4.12 6.48 Tharad 52.14 18.20 16.42 13.24 64.57 18.82 8.17 8.43 Vadgam 65.10 22.42 5.93 6.54 75.66 18.21 3.39 2.74 Vav 61.88 18.20 13.14 6.78 73.05 15.67 6.95 4.33 Banaskantha 62.88 19.99 8.93 8.20 74.13 16.64 4.92 4.31 Source: Computed from database of Commissionerate of Rural Development, Gujarat (2014) Note: DPIS: Daily Purpose from Informal Sources, POPIS: Production Purpose from Informal Source, BIA: Borrowing only from Institutional Agencies, NIPA: No Indebtedness and Possess Assets.
As far as BPL families (score 0-20) are concerned, out of all the talukas of Banaskantha, in Danta taluka out of total BPL families as many as 69.40% of families take debt for daily purpose from informal sources, while out of very poor families (score 0-16), as many as 78.53% of families take debt for daily purpose from informal sources.
5.2.10 Preference of Assistance
Out of total BPL families (score 0-20) of Banaskantha almost 38.35% of families out of total BPL families prefer assistance in terms of wage employment, while 41.58% of families out of total BPL families prefer assistance for self employment, whereas 20.07% of families out of total BPL families prefer assistance in terms of training, housing and finance. Moreover, out of very poor families (score 0-16) of Banaskantha almost 50.05% of families out of total BPL families prefer assistance in terms of wage employment, while 35.05% of families out of total
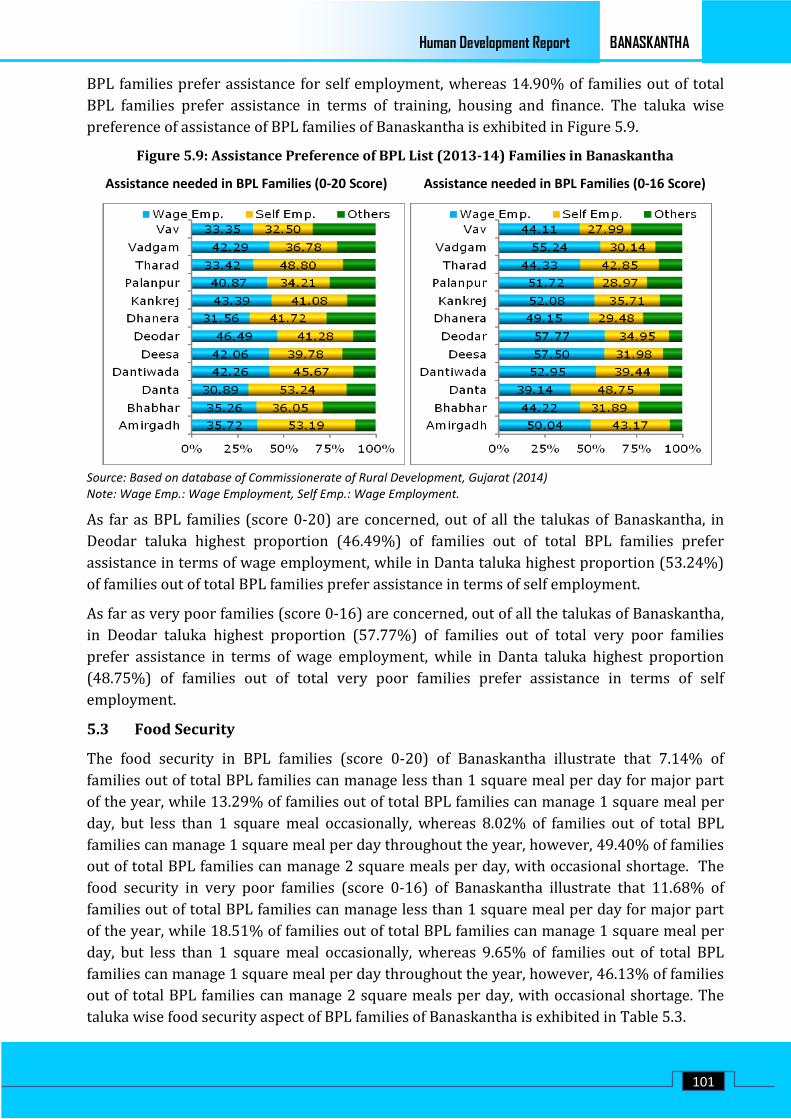
BANASKANTHA Human Development Report
101
BPL families prefer assistance for self employment, whereas 14.90% of families out of total BPL families prefer assistance in terms of training, housing and finance. The taluka wise preference of assistance of BPL families of Banaskantha is exhibited in Figure 5.9.
Figure 5.9: Assistance Preference of BPL List (2013-14) Families in Banaskantha
Assistance needed in BPL Families (0-20 Score) Assistance needed in BPL Families (0-16 Score)
Source: Based on database of Commissionerate of Rural Development, Gujarat (2014) Note: Wage Emp.: Wage Employment, Self Emp.: Wage Employment.
As far as BPL families (score 0-20) are concerned, out of all the talukas of Banaskantha, in Deodar taluka highest proportion (46.49%) of families out of total BPL families prefer assistance in terms of wage employment, while in Danta taluka highest proportion (53.24%) of families out of total BPL families prefer assistance in terms of self employment.
As far as very poor families (score 0-16) are concerned, out of all the talukas of Banaskantha, in Deodar taluka highest proportion (57.77%) of families out of total very poor families prefer assistance in terms of wage employment, while in Danta taluka highest proportion (48.75%) of families out of total very poor families prefer assistance in terms of self employment.
5.3 Food Security
The food security in BPL families (score 0-20) of Banaskantha illustrate that 7.14% of families out of total BPL families can manage less than 1 square meal per day for major part of the year, while 13.29% of families out of total BPL families can manage 1 square meal per day, but less than 1 square meal occasionally, whereas 8.02% of families out of total BPL families can manage 1 square meal per day throughout the year, however, 49.40% of families out of total BPL families can manage 2 square meals per day, with occasional shortage. The food security in very poor families (score 0-16) of Banaskantha illustrate that 11.68% of families out of total BPL families can manage less than 1 square meal per day for major part of the year, while 18.51% of families out of total BPL families can manage 1 square meal per day, but less than 1 square meal occasionally, whereas 9.65% of families out of total BPL families can manage 1 square meal per day throughout the year, however, 46.13% of families out of total BPL families can manage 2 square meals per day, with occasional shortage. The taluka wise food security aspect of BPL families of Banaskantha is exhibited in Table 5.3.

BANASKANTHA Human Development Report
102
Table 5.3: Food Security Status of BPL List (2013-14) Families in Banaskantha
Taluka/ District
% of BOL Families (0-20 Score) % of BOL Families (0-16 Score) <1M/
DY 1M/D<1MO 1M/DY 2M/
DOS EFY <1M/ DY
1M/D<1MO 1M/DY 2M/
DOS EFY
Amirgadh 6.88 12.89 8.56 54.97 16.70 12.86 19.71 11.03 47.53 8.87 Bhabhar 11.67 24.44 12.34 42.96 8.60 16.92 27.76 11.58 38.54 5.21 Danta 2.27 10.23 6.43 71.83 9.23 3.73 14.85 8.27 69.00 4.15 Dantiwada 4.45 16.32 14.42 46.19 18.62 7.13 22.26 16.87 43.45 10.29 Deesa 6.10 7.10 5.35 31.65 49.80 11.33 11.69 8.19 31.98 36.81 Deodar 6.76 19.18 5.85 48.06 20.15 9.93 25.84 6.38 43.22 14.63 Dhanera 4.34 9.37 5.95 43.50 36.84 8.28 12.68 5.90 48.36 24.78 Kankrej 8.01 13.57 9.43 49.06 19.92 11.74 17.30 11.47 45.89 13.61 Palanpur 8.83 15.89 11.04 48.55 15.69 13.15 20.55 11.50 44.67 10.13 Tharad 6.66 12.02 7.41 47.47 26.44 11.78 17.23 9.72 46.88 14.39 Vadgam 10.48 14.42 8.50 47.77 18.83 16.28 19.34 9.95 42.33 12.09 Vav 8.83 12.37 4.90 61.22 12.68 14.56 18.60 5.90 53.12 7.83 Banaskantha 7.14 13.29 8.02 49.40 22.15 11.68 18.51 9.65 46.13 14.03 Source: Computed from database of Commissionerate of Rural Development, Gujarat (2014) Note: <1M/DY: Less than 1 square meal per day for major part of the year, 1M/D<1MO: Normally 1 square meal per day, but less than 1 square meal occasionally, 1M/DY: 1 square meal per day throughout the year, 2M/DOS: 2 square meals per day with occasional shortage, EFY: Enough food throughout the year.
Out of all the talukas of Banaskantha, in Bhabhar taluka almost 11.67% of families out of total BPL families (score 0-20) and as many as 16.92% of families out of total very poor families (score 0-16) have less than 1 square meal per day for major part of the year.
Distribution of fair price shops in Banaskantha reveal that almost 88.17% of fair price shops are managed by private operators, while 11.83% of fair price shops are managed by cooperative societies and self help groups. Amongst all the talukas of Banaskantha, in Kankrej taluka highest proportion of fair price shops out of total fair price shops are managed by cooperative societies and self help groups, while in Deesa taluka highest proportion of fair price shops out of total fair price shops are managed by private operators as exhibited in Table 5.4.
Table 5.4: Fair Price Shops in Banaskantha (2014)
Taluka/ District
Operator Wise Total Shops (%) Category Wise Private Shops (%) Cooperative / SHG Private SC ST OBC Handicap General
Amirgadh 14.29 85.71 0.00 38.89 30.56 0.00 30.56 Bhabhar 13.64 86.36 15.79 0.00 50.00 0.00 34.21 Danta 11.48 88.52 7.41 37.04 31.48 0.00 24.07 Dantiwada 7.50 92.50 18.92 2.70 45.95 2.70 29.73 Deesa 4.76 95.24 18.13 3.75 51.25 3.75 23.13 Deodar 6.67 93.33 8.93 0.00 37.50 3.57 50.00 Dhanera 25.71 74.29 40.38 1.92 32.69 1.92 23.08 Kankrej 26.44 73.56 17.19 0.00 40.63 3.13 39.06 Palanpur 11.84 88.16 28.36 2.99 39.55 3.73 25.37 Tharad 6.19 93.81 16.98 0.94 50.94 3.77 27.36 Vadgam 16.67 83.33 38.57 0.00 38.57 2.86 20.00 Vav 6.45 93.55 21.84 0.00 27.59 6.90 43.68 Banaskantha 11.83 88.17 20.69 5.26 41.16 3.24 29.64 Source: Computed from database of District Supply Office, Banaskantha (2014) Note: SHG: Self Help Groups

BANASKANTHA Human Development Report
103
Moreover, the distribution of fair price shops in Banaskantha reveal that 20.69% of fair price shops are managed by SC operators, 5.26% of fair price shops are managed by ST operators, 41.16% of fair price shops are managed by OBC operators, 3.24% of fair price shops are managed by handicap operators and 29.64% of fair price shops are managed by general operators. Amongst all the talukas of Banaskantha, Dhanera taluka shares highest proportion of fair price shops managed by SC operators out of its total fair price shops, Amirgadh taluka shares highest proportion of fair price shops managed by ST operators out of total fair price shops, Deesa taluka shares highest proportion of fair price shops managed by OBC operators out of total fair price shops, Deodar taluka shares highest proportion of fair price shops managed by general category operators out of total fair price shops and Vav taluka shares highest proportion of fair price shops managed by handicap operators out of total fair price shops as exhibited in Table 5.4.
As far as APL, BPL and Antodaya cards are concerned in Banaskantha, out of total ration card holders in 2008-09, 68.15% of card holders were APL card holders, 24.26% of card holders were BPL card holders and 7.59% of card holders were Antodaya card holders. Whereas, out of total ration card holders in 2013-14, 62.44% of card holders were APL card holders, 27.18% of card holders were BPL card holders and 10.38% of card holders were Antodaya card holders as depicted in Figure 5.10.
Figure 5.10: APL, BPL and Antodaya Cards in Banaskantha
APL, BPL and Antodaya Cards (2008-09) APL, BPL and Antodaya Cards (2013-14)
Source: Based on database of District Supply Office, Banaskantha (2014)
Amongst all the talukas of Banaskantha in 2008-09, Tharad was the taluka with highest proportion (88.48%) of APL cards holders out of its total ration cards holders, Amirgadh was the taluka with highest proportion (38.36%) of BPL cards holders out of its total ration cards holders and Amirgadh was the taluka with highest proportion (12.64%) of Antodaya cards holders out of its total ration cards holders, while in 2013-14, amongst all the talukas of Banaskantha, Tharad remained the taluka with highest proportion (79.32%) of APL cards holders out of its total ration cards holders, Kankrej was the taluka with highest proportion (48.68%) of BPL cards holders out of its total ration cards holders and Kankrej was the taluka with highest proportion (21.72%) of

BANASKANTHA Human Development Report
104
Antodaya cards holders out of its total ration cards holders. Moreover, it has been observed that proportion of BPL card holders has decreased, in Deesa, Deodar and Dhanera, between 2008-09 and 2013-14. However, the proportion of Antodaya card holders has also decreased in Amirgadh and Vadgam between 2008-09 and 2013-14.
Map 5.1: Taluka wise BPL List (2013-14) Households in Banaskantha
6792
Amirgadh
Very Poor Households (Score 0 -16) Poor Households (Score 17 -20)
o the scale
Map 5.2: Taluka wise Food Security in Banaskantha (2013-14)
< 1 Meal / Day in Major Part of Year 1 Meal / Day but < 1 Meal Occasionally1 Meal / Day Throught Year 2 Meal / Day with Occasional ShortageEnough Food For Year
o the scale

BANASKANTHA Human Development Report
105
5.4 Vulnerability
Vulnerability is frequent for the rural poor in the backward region where livelihood uncertainty is a key component of human poverty. The vulnerable and marginalized groups are those which are deprived of the chance to equally participate in and benefit from the socioeconomic developments in the society. The vulnerability can be termed as deprivation from well-being, livelihood resilience, self protection, societal security and availability of resources. The Banaskantha district is mainly vulnerable to water management and desertification. Moreover, the issues related to crime and violence and condition of migrants are also significant as far as livelihood of vulnerable groups is concerned.
5.4.1 Water Management
Geologically the Banaskantha possess varied features and therefore the ground water occurrence and distribution varies widely in space and time throughout the district. The central part of Banaskantha has high potential for groundwater development, while in the eastern part of district due to hard and massive granite formation, recharge is very negligible. There are 3 Major dams in Banaskantha, viz. Dantiwada, Sipu and Mukteshwar and more than 4000 check dams in Banaskantha. Dantiwada dam on river Banas is located near Dantiwada village of Dantiwada district and occupies 46.73 Km2 of area. The command area of Dantiwada dam consists of 19 villages of Palanpur, 3 villages of Dhanera, 31 villages of Deesa and 8 villages of Kankrej talukas of Banaskantha district and 49 villages of Patan district. Sipu dam on river Sipu is located near Atal village of Dantiwada district and occupies 25.68 Km2 of area. The command area of Sipu project consists of 25 villages of Deesa district. Mukteshwar dam on river Saraswati is located near Mukteshwar village of Vadgam district and occupies 5.78 Km2 of area. The command area of Mukteshwar project consists of 21 villages of Vadgam taluka of Banaskantha district and 10 villages of Mehsana district. .
Table 5.5: Water Storage Details (2014)
Irrigation Projects
Designed Storage in MM3 Present Storage in MM3 % Filling Gross Live Dead Gross Live Dead Gross Live
Dantiwada 393.62 387.41 6.21 67.89 61.68 6.21 17.25 15.92 Sipu 161.43 145.37 16.06 17.85 1.79 16.06 11.06 1.23 Mukteshwar 31.46 26.3 5.16 8.87 3.71 5.16 28.19 14.11 Banaskantha 586.51 559.08 27.43 94.61 67.18 27.43 16.13 12.02 North Gujarat 1922.26 1774.77 147.49 1002.7 855.51 147.19 52.16 48.20 Gujarat 21014.94 16100.96 4913.98 15622.34 10736.63 4885.71 74.34 66.68 Source: Computed from Narmada Water Resource, Water Supply and Kalpsar Dept., Gujarat (2014)
The three projects of Banaskantha are located in the eastern part of Banaskantha and its command area extends up to the north eastern Banaskantha and south eastern Banaskantha and mostly serves Dantiwada, Palanpur, Vadgam, and eastern part of Deesa, and Dhanera and Kankrej. Consequently, talukas of Bhabhar, Deodar, Tharad, Vav totally depend on ground water for irrigation and other purposes. Moreover, western part of Kankrej, Dhanera and Deesa talukas also depend on ground water for irrigation and other purposes. The prevailing distribution of irrigation projects depicts that only 107 out of 1244 villages of Banaskantha are under the command area of these projects, which indicates that merely 8.6% of villages fall under the command area of these projects of Banaskantha.

BANASKANTHA Human Development Report
106
The scanty rainfall and excess pumping results in over exploitation of ground water as well as deterioration in quality. The ground water conditions in the north and north-eastern part, where rock encounters at shallow depth, is not feasible for deep tube wells because of less permeable formation. Dhanera is feasible for shallow to deep tube-wells, while central part of Banaskantha is feasible for deep tube wells. Western portion of Banaskantha, where upper aquifers are saline but the quality of ground water improves with depth like in the Deodar, Bhabhar, Tharad and Kankrej talukas. The western Banaskantha talukas are near to Rann of Kutch and are saline and not feasible for development of groundwater sources.
Figure 5.11: Water Quality Profile of Banaskantha
Sources Tested for Water Quality 2008-12 Sources Tested for Water Quality 2008-12
Source: Based on database of National Rural Drinking Water Programme (2013)
As per the water quality profile of Banaskantha district for the years 2008-09 to 2011-12, out of 4044 sources tested, almost 2020 (almost 49.95%) sources turned out to be contaminated. The talukas of eastern Banaskantha like Amirgadh, Danta, Dantiwada, Deesa, Dhanera, Palanpur and Vadgam have witnessed more level of contamination compared to the talukas of western Banaskantha like Bhabhar, Deodar, Kankrej, Tharad and Vav talukas. This depict that the water scarce talukas of western Banaskantha have low level of contamination compared to the eastern talukas of Banaskantha. The highest level of contamination is found in Danta taluka, while the lowest level of contamination is found in Vav taluka. Major contaminants found are fluoride, chloride, nitrate and iron. This supports the fact that contamination at lakes and reservoirs is more severe and persistent than streams and rivers as there is no natural flushing process as in case of streams and rivers.
The problem of the water resources of Banaskantha involves qualitative deterioration as well as quantitative shortages. Banaskantha is a water scarce region and most of the available fresh water is used up. As a result, Banaskantha region has no option but to rely on groundwater that is coming from ground water aquifers. In Banaskantha, one of the major prevalent issues pertaining to water is overexploitation of ground water and its depletion. Out of 12 talukas of Banaskantha almost 5 talukas fall under the category of ‘Over Exploited’ while 2 talukas fall under the category of ‘Critical’ as shown in Map 5.3.

BANASKANTHA Human Development Report
107
Map 5.3: Ground Water Resource Estimation Status of Banaskantha
anta
to the scale
Source: Based on Gujarat Water Resource Development Corporation, Gujarat (2011)
5.4.2 Crime and Violence
As the elevated rate of crime and violence limits the choices of people and life chances, it deteriorates human development. Given the strong relationship between crime, insecurity and human development in the region, it is most appropriate that the problems of crime, violence and insecurity should demand the attention and review how crime and violence have negative impacts on human development. However, the backward regions are faced with high rates of violent crime and non-criminalized forms of social violence typically directed at members of vulnerable groups. Therefore the level of domestic violence, crimes in the community, extent of crime in the society, etc significantly affects the human development of people (UNDP, 2011). In Banaskantha still there exists economic and social inequality and consequently there are people who remain vulnerable to various conditions. The overall extent of crime has increased in Banaskantha as shown in Table 5.6.
Table 5.6: Incidence of Crimes Reported in Banaskantha Crimes 2004-05 2005-06 2006-07 2007-08 2008-09 2009-10 2010-11 Murder 44 38 39 51 33 40 40 Dacoity 13 9 4 7 10 14 9 Burglary 177 176 165 204 185 232 202 Theft 302 317 446 424 419 502 538 Robbery 17 22 29 28 32 50 61 Kidnapping 32 24 47 48 51 103 93 Riots 46 26 60 59 61 53 52 Culpable Homicide 0 1 0 0 2 0 1 Counterfeit Coins 6 11 8 6 9 6 12 Miscellaneous 1522 1461 1524 1700 1731 1872 2006 Total Cognizable Crimes 2159 2085 2322 2527 2533 2872 3014 Source: Compiled from Office of State Crime Records Bureau, Gujarat (2011)

BANASKANTHA Human Development Report
108
The total cognizable crime incidents recorded in Banaskantha grew at 5.72% CAGR between 2004-05 and 2010-11 as compared to total the recorded cognizable crime incidents that declined at -1.66 % CAGR between 2004-05 and 2010-11 in case of Gujarat. The major incidents of burglary, theft, robbery and kidnaping in are noticed in Banaskantha. The incidents of burglary and theft in Banaskantha between 2004-05 and 2010-11 grew at 2.23% CAGR and 10.10% CAGR respectively agaisnt the incidents of burglary and theft in Gujarat that declined at -5.73% CAGR and -2.03% CAGR respectively between 2004-05 and 2010-11. The incidents of kidnaping and robbery in Banaskantha grew at 19.46% CAGR and 23.73% CAGR respectively as compared to the incidents of kidnaping and robbery in Gujarat that has grown at 3.98% CAGR and 4.87% CAGR respectively between 2004-05 and 2010-11.
In many areas of the district people live under the conditions of general insecurity. Banaskantha being one of the most backward regions of Gujarat bounded by illiteracy, ignorance, superstition, inequality, poverty, deprivation, aggression and other characteristics. Thus, violence against women is not a rare crime in this district. The social crimes that victimize women in the society occur in the form of non-cognizable violence against women because of the reasons practiced in the society and community and therefore women also fall prey to cognizable crimes. The crime and violence against women in Banaskantha is depicted in Figure 5.12.
Figure 5.12: Incidences of Crime and Violence against Women Reported in Banaskantha
Source: Based on Office Database of State Crime Records Bureau, Gujarat (2011)
In Banaskantha the incidents reported for crime against women has increased at 14.47% CAGR between 2004 and 2010. In 2004, nearly 224 incidents of crime against women were reported in Banaskantha, while in 2010 the incidents reported of crime against women has increased to 504. This indicates awareness amongst women pertaining to social security and justice in Banaskantha. Out of total cognizable crimes under IPC in 2004, about 6.32% of incidents were reported for crime against women, while in 2010, almost 10.66% of incidents were reported for crime against women. It reflects the wakefulness of women towards dignity and right to live respectful life. It seems that incidents of crime and violence against women have increased in Banaskantha, but as a matter of fact, such incidents of violence against women were not reported in past due to high illiteracy, social bindings and lack of awareness amongst women. But over a period, the increased awareness amongst women has empowered women to fight against domestic violence and consequently, with the help of NGOs, SHGs and religious agencies, women are protesting against such crimes.

BANASKANTHA Human Development Report
109
5.4.3 Condition of Migrants
Between July and September, workers from different regions of Gujarat and Rajasthan migrate to BT cotton fields in Banaskantha. These workers migrate with the reference of contractors or with the help of friends and relatives. In the case of cotton pollination work, there is an established system of recruiting agents / contractors popularly known as mates. Employment of children is usually done through mates, who are local Adivasis (tribal people) in the age range of 30-45 years. The process of employment is based on a system of advances. Owners of cotton fields in Banaskantha and their agents visit tribal villages before the cotton pollination season begins. Children are usually preferred as workers as they can be made to work longer hours than adults. It has been reported that beating and verbal abuse by the mates (who took children to work) is a common phenomenon. It was reported that children work harder and therefore they are in great demand. Child workers are required to wake up at 5:00 am to check if the flowers are ready for crosspollination and start work immediately that continues up to 2:00 pm in the noon. As children are easy to bully and harass, more work can be obtained from them. Children, adolescents and adults live in makeshift accommodation on the farms, which are far away from the villages, which are completely isolated. The major problems arise from sleeping in makeshift arrangements in open making young workers susceptible to insect and snakebite. The risk is also frequent from spray of pesticides/insecticides. Children are more vulnerable to risk as instances of children inhaling dangerous pesticides are not rare. It is noticed that long hours of work in a polluted environment led to sickness (Neera Burra, 2008). While the landlords provided medical facilities, all the costs of treatment and medicines were cut from the wages of the workers. This did not leave them with much of savings. Moreover, it was reported that if a worker died, then the landlord would not take any responsibility or pay any compensation.
Long working hours, lower wages, pathetic living and working conditions, health hazards, harassment and accidents, discrimination, incidence of child labour, verbal abuse, ill-treatment, social insecurity makes life of migrants vulnerable. Effective enforcement of all Labour Laws for protecting the Interests of the migrant labours are must. Only licensed labour contractors should be allowed and legal contract between the land owner and labourers/contractors should be ensured. Good living and working conditions of migrant workers should be ensured along with health insurance.
5.4.4 Desertification
The talukas (Vav, Tharad, Bhabhar, Deodar and Dhanera) of western Banaskantha region form the edge area of the desert of Kutch and because of its arid to semi-arid climate, the area is highly prone to desertification. The climate of these talukas is characterized by general dryness except during the brief monsoon season. In summer maximum temperature ranges between 42o to 45o centigrade and in winter temperature falls between 2o to 5o centigrade. The annual average rainfall is 544 mm with summer and winter being the driest parts of the year. Winds are generally light to moderate with an annual average wind velocity of 11.4 km/hr.

BANASKANTHA Human Development Report
110
Box 5.2: Desertification in Western Banaskantha
The western part of the district constitutes barren, sandy and saline zone. Erosion with salinity is the main characteristic of the western Banaskantha. These saline areas have very poor soil fertility, hence have poor vegetative cover.
Droughts being the common feature, number of villages in western Banaskantha are affected by drinking water problem. The groundwater resources are receding all over the region due to over exploitation and increasingly deficient recharge.
Thus, threshold for sustainability, the carrying capacities of natural resources substantially exceed and a portion of the region comes under the grip of desertification (GEC, 1996). Furthermore, non availability of forest cover and increasing population and livestock also enforce the process of desertification. Vast areas in western Banaskantha have been brought under cultivation often extending to marginal lands. The majority of the rural population in western Banaskantha meet their fuel wood needs from the immediate environment. But, due to acute shortage of fuel wood, the trees and shrubs and even roots are indiscriminately cut and used as fuel. The ever increasing livestock population (in Tharad and Vav) has overstocked the rangelands and has led to overgrazing. Due to it, the ground cover which protects the soil against erosion decreases. The use of modern fertilizers for high yielding varieties crops and excessive extraction of water for production of cash crops have significantly impacted the quality of land in these talukas.
This reveals that desertification is the result of a complex process of maladjustment of interacting forces between the physio-biotic environment and its users. Further, the process of desertification is fiercest not in a desert interior, but in the less arid marginal areas and in these marginal areas dry land farming and cattle rearing are done for short term economic gains and ultimately become susceptible to ecological imbalance leading to desertification.
5.5 Schemes and Programs for Poor and Vulnerable Families
Box 5.3: Major Schemes and Programs for BPL Families
Schemes / Programs Brief Details of Schemes / Programs Swarnajayanti Gram Swarojgar Yojana (SGSY)
Centrally sponsored scheme emphasizing on self-employment. Covers aspect of self-employment like capacity building, subsidy, infrastructure facility, credit, skill upgrading, insurance and marketing. BPL/APL (80:20) of rural area are the target group. For the SHG's having grade-II, SHG can apply for loan.
Mahatma Gandhi National Rural Employment Guarantee Act (MGNREGA)
Provides 100 days of employment in a financial year. Applicable to rural household whose adult members are willing to do unskilled manual work. Water conservation, tree plantation, irrigation works, renovation of traditional water bodies, Flood-control and protection works.
Indira Awas Yojana (IAY) Provision of housing finance to the poor families based on BPL list. Rs. 45,000 in plain areas and Rs. 48,500 in hilly areas for new construction and Rs. 20,000 credit under DRI at 4% RoI per annum. Provision on the basis of 75:25 ratio to housing shortage & SC/ST. Sanctions in the name of women or jointly, 60% funds for SC/ST and 15% for minorities, 3% for physically handicapped.

BANASKANTHA Human Development Report
111
Sardar Patel Awas Yojana (SPAY)
Provision of free plots to landless (farmers & artisans) rural poor families and financial assistance for housing based on BPL list.
Out of unit price of Rs. 43,000, financial assistance of Rs. 36,000 is given by Govt. og Gujarat and Rs. 7,000 by beneficiaries.
Integrated Watershed Management Program (IWMP)
Aims to restore the ecological balance by harnessing, conserving and developing degraded natural resources such as soil, vegetative cover and water. This enables multi-cropping and the introduction of diverse agro-based activities, which help to provide sustainable livelihoods to the people residing in the watershed area.
Gokul Gram Yojana (GGY) Provide basic amenities, Increase employment opportunities, Integrate various development schemes, Integrate people participation with the development process.
Backward Region Grant Fund (BRGF)
To redress regional imbalance in development by providing fund to supplement existing developmental inflows into identified districts.
Bridge gaps in local infrastructure and development requirement that are not being adequately met through existing inflows.
Total Sanitation Campaign (TSC)
TSC aims to cover both BPL and APL families. But BPL families are eligible for subsidies (incentives), which are available for low cost basic unit and shared between Govt. of India, State Govt. and beneficiaries. There is no subsidy for APL families.
TSC also covers school and anganwadi toilet constructions.
Sakhi Mandal Yojana (SMY)
Enable poor women in rural areas to access resources and strengthen livelihoods and quality of life. Formation of women self help groups based on thrift and credit principles and tracking and credit linkage of SM Groups through ICDS (85%) and NGOs (15%).
Antyodaya Anna Yojana This is centrally sponsored scheme. The scheme is intended for the poorest of poor. The beneficiary families are entitled for 25 to 35 Kg. of Rice per month at a highly subsidized rate.
Source: District Rural Development Agency, Banaskantha (2011).
5.5.1 Developments in Backward Areas
The Backward Regions Grant Fund (BRGF) is designed to redress regional imbalances in development. The fund provides financial resources for supplementing and converging existing developmental inflows into identified districts to bridge gaps in local infrastructure and other development requirements that are not being adequately met through existing inflows. The existing Rashtriya Sam Vikas Yojana (RSVY) has been subsumed into the BRGF Program. In Banaskantha, work pertaining to erosion prone road patches, public well, mini water works, hand pumps, panchayat building, drainage line, school rooms, compound wall, anganwadi buildings, pipelines, animal husbandry, shed in crematorium, street solar light, under ground water tank, school bus for SC/ST, milk collection/chilling centre, veterinary dispensary, gober gas, etc are undertaken under BRGF. The progress made under BRGF in Banaskantha is presented in Figure 5.13.

BANASKANTHA Human Development Report
112
Figure 5.13: Progress made under BRGF Plan in Banaskantha (2013-14)
Source: Based on database of District Development Office, Banaskantha (2014)
In the year 2013-14, Banaskantha has achieved 96.92% of physical target and 82.15% of financial target under the BRGF program. Amongst all the talukas in Banaskantha highest proportion (100%) of physical target as well as financial target has been achieved in Dhanera taluka. On the other hand, highest proportion (100%) of physical target has been achieved in Amirgadh, Bhabhar and Tharad talukas against utilisation of just 97.02%, 99.75% and 96.78% of allocated funds. However, nearly 25% of allocated funds remained unutilised in Danta, Kankrej, Palanpur, and Vav talukas. However, Danta achieved 92.65% of physical target by utilising just 65.64% of the available funds.
5.5.2 Provision of Employment, Housing and Sanitation
Under schemes like SGRY, IAY, Sakhi Mandal, TSC and SPAY, various developmental activities have been undertaken in Banaskantha. Under SGSY, since 2001-02, about 21348 self employments has been provided, while under IAY, since 2001, 70228 houses have been constructed and under SPAY, since 2001-02, 31292 free plots have been given. Moreover, Under Sakhi Mangal Yojana (Mission Mangalam), since 2007-08, the total cash credit benefits have been given to 8765 Sakhi Mandals, while under TSC, since 2004-05, 143981 BPL households have been assisted for developing sanitation facilities as shown in Table 5.7.
Table 5.7: Progress under Various Schemes and Programs in Banaskantha (2013-14)
Taluka / District
SGRY Since 2001-02
MNREGA 2010-11
IAY Since 2001
Sakhi Mandal Since 2007-08
TSC Since 2004-05
SPAY Since 2001-02
Self Employment
Wage Employment Houses Beneficiaries
(Cash Credit) BPL
Beneficiaries Free Plots
Amirgadh 1630 6977 5907 432 9757 221 Bhabhar 955 1130 4161 546 13785 335 Danta 1861 4726 6300 477 11656 1751 Dantiwada 1190 1674 6764 355 10187 1436 Deesa 2595 6821 8175 1587 12853 4551 Deodar 1511 551 3002 666 11472 2319 Dhanera 1242 3757 4415 420 10056 5172 Kankrej 1425 2585 4724 895 14003 652 Palanpur 2581 2375 7268 927 12870 6108 Tharad 1542 2698 4224 749 11677 1597 Vadgam 2625 8199 6327 770 13505 5818 Vav 2191 6020 8961 932 12160 1332 Banaskantha 21348 47513 70228 8756 143981 31292 Source: Compiled from database of District Rural Development Agency, Banaskantha (2014)

BANASKANTHA Human Development Report
113
Taluka wise progress reveal that highest self employment has been generated in Vadgam, and lowest self employment has been generated in Bhabhar under SGRY, while highest wage employment has been generated in Vadgam, and lowest self employment has been generated in Deodar under MNREGA, whereas, maximum number of houses have been constructed in Vav and least number of housed have been constructed in Deodar under IAY, whereas, maximum number of plots have been allocated in Palanpur and least number of plots have been allocated in Amirgadh under SPAY. Under Sakhi Mandal Program, Deesa share highest number of Sakhi Mandal benefited by cash credit and Dhanera share least number of Sakhi Mandal benefited by cash credit. Under TSC, Kankrej share highest number of BPL households benefited for sanitation development and Amirgadh share least number of BPL households benefited for sanitation development.
Figure 5.14: Preference and Provision of Assistance to BPL Families in Banaskantha
Preference for Wage Employment (BPL List) Provision of Wage Employment (MNREGA)
Preference for Self Employment (BPL List) Provision of Self Employment (SGRY)

BANASKANTHA Human Development Report
114
Preference for Housing (BPL List) Provision of Housing (IAY)
Source: Based on (1) Commissionerate of Rural Devt, Gujarat (2014), (2) DRDA, Banaskantha (2014)
5.5.3 Water Resource Developments
Reforms in the rural drinking water supply sector were adopted in 1999 in the country. The reform process started as a pilot project in 67 districts of the country, including three in Gujarat. The basic concepts of the reforms include community participation in the planning, implementation, operation and maintenance of the schemes of its choice. At present 13 districts (including Banaskantha) of Gujarat are parts of the national Swajaldhara program. The institutional framework comprises the National Swajaldhara Monitoring Committee (NSMC), which is the national level monitoring agency. At the state level, Water and Sanitation Management Organization (WASMO) is the State Water and Sanitation Mission (SWSM) for Gujarat. WASMO coordinates the activities of the district level District Water and Sanitation Committees (DWSC) and the village level Village Water and Sanitation Committees (VWSC) or Pani Samitis (PS).The details of Swajaldhara program in Banaskantha are given in Table 5.8.
Table 5.8: Swajaldhara / Sector Reform Scheme in Banaskantha
Taluka / District
Total Villages
Pani Samitis Formed
VAP Approved by VWSC
Schemes Approved by DWSC
Schemes Completed
Schemes Under
Progress
Water Quality Teams
Formed Amirgadh 69 69 14 14 7 7 69 Bhabhar 53 53 15 15 10 5 21 Danta 184 180 44 44 29 15 155 Dantiwada 54 55 23 23 18 5 54 Deesa 150 150 43 43 29 14 150 Deodar 71 71 14 14 10 4 46 Dhanera 80 80 51 51 33 18 25 Kankrej 106 106 27 27 18 9 107 Palanpur 118 118 63 63 53 10 95 Tharad 134 134 25 25 19 6 135 Vadgam 110 110 43 43 27 16 89 Vav 121 121 31 31 18 13 122 Banaskantha 1250 1247 393 393 271 122 1068 Source: Compiled from database of Water & Sanitation Management Organization, Gujarat (2011) Note: VAP: Village Action Plan

BANASKANTHA Human Development Report
115
The Swajaldhara scheme has facilitated empowerment of the rural community/ women to participate in the planning, implementation and operation of water management programs. It is helping the project village to achieve the target of getting at least 40 litres per capita per day of safe drinking water. The scheme has encouraged establishment of water harvesting structures and revival of traditional drinking water sources in Banaskantha. 5.6. Success Stories
Box 5.4: Providing Shelter: Indira Awas Yojana in Banaskantha Housing is one of the basic requirements for human survival. As the type of house is an important indicator of the household’s economic status, for any household, owning a house provides significant socio-economic security and status in society. In this context, Indira Awas Yojana aims to help construction/upgradation of dwelling units of members of SCs/STs, freed bonded labourers and other BPL rural households by providing them a lump sum financial assistance.
Name: Kamboya Shardaben Bhagvanbhai Village: Salempura Taluka: Palanpur BPL No.: 2976837 BPL Score: 14 Total Benefit: Rs. 43,500/-
Name: Chauhan Bhikhiben Dalabhai Village: Vadgam Taluka: Vadgam BPL No.: 2893210 BPL Score: 05 Total Benefit: Rs. 43,500/-
The availability of housing facility through Indira Awas Yojana has improved the facilities like kitchen, sanitation, drinking water, toilet facilities, etc along with social security, health and hygiene of the needy households. Source: Field Survey, Palanpur, Vadgam (2011)
Box 5.5: Multiple Benefits to BPL Families in Banaskantha Meta village of Vadgam taluka in Banaskantha has set an example of optimum utilization of resources that provides multiple benefits to BPL families. Meta village is located at a distance of 16 km from Palanpur, it has 193 BPL families and 290 APL families and 370 ST people reside in the village. Indira Nagar (under IAY) of 150 houses for BPL families is located in one of the corner of the village. All the IAY houses are connected by drainage system. The experiment of Solid and Liquid Waste Management was implemented in the area. The work was implemented through MNREGA. The pipeline was put in the nearby wasteland along with the development of water harvesting structure and septic tank. The water after treatment is used for cultivation.
The Gram Panchayat has allotted the certain area of wasteland on rent to the BPL families in which seasonal vegetables are cultivated. This has added sources of income to BPL families, as well as solved the problem of discharge contaminated water in the village. Source: Field Survey, Vadgam (2011)

BANASKANTHA Human Development Report
116
Box 5.6: Taking on New Roles: Operation and Maintenance by Women
After the death of her husband who served as an operator, Manguben of Thana village in Danta taluka of Banaskantha got his job. Responsibilities of a pump operator did not come easy, but Manguben used to accompany her husband at times and was therefore aware of the basics. Due to erratic supply of electricity, Manguben carries out the pumping and distribution of water at night (when continuous supply of electricity is available), so that the community gets water in the morning. She takes care of operation of the system and minor maintenance works. Realizing the need for chlorination, she has increased its frequency and she also cleans the water tank once every month. It was Manguben, who with the help of the Sarpanch and Pani Samiti members, explained the importance of having chlorinated water and convinced the people for it. Village Sarpanch says, "Manguben is exceptional in her work and does everything with dedication. She keeps the water tank clean and does chlorination regularly." The job of operator was a blessing for Manguben, and it helped her overcome the difficulties of raising a family. In return Manguben says, "I will always ensure that the people of my village who have helped me in difficult times are never put to risk." Source: WASMO, Field Survey, Danta (2011)
Box 5.7: Livelihood Alternatives by Banaskantha DWCRA Mahila SEWA Association
Banaskantha being one of the backward districts of Gujarat, major challenges faced by vulnerable groups are droughts, poverty and sustainable source of income. In order to cope up with these challenges, the women in the rural areas of Banaskantha district have formed 62 DWCRA groups, 160 savings and credit groups and 8 watershed development collectives. The association was formed in 1992, in response to the fact that individual DWCRA (producers) groups were too isolated and vulnerable to reach markets easily and to obtain the raw materials and credit they required on their own. SEWA has undertaken the task of promoting new groups, helping them to build their capacities and link with government. However, it was felt that there should be a self-managed organisation to undertake all these functions to act as promoter, supporter and advocate for the DWCRA groups. Through the efforts of this association and support of SEWA, various economic activities have been undertaken. These are based on local resources and women’s own traditional skills and their leadership. As a result, majority of the families who once migrated from rural Banaskantha in search of work and income security has drastically declined. In 1996, rural women mangers took over the running of their own association.
Source: SEWA, Field Survey, Tharad (2011)
Box 5.8: BanasCraft: Transforming Traditional Technique to Trade
In Gujarat, the BanasCraft Program aims to empower the craftswomen of Banaskantha by allowing them to earn a livelihood by making handicrafts. The program is designed to help them work for their collective benefit, to improve the socio-economic position of artisans and their families. The project started with the formation of groups of local women into the Banaskantha DWCRA Mahila SEWA Association, on the basis of traditional craft specialization. Different castes and tribal groups in specific villages in the various talukas (like Deodar, Tharad, Kanakrej) produce particular types of textile related crafts, including embroidery, mirror work, patch work, weaving, and beadwork. BanasCraft provides a broad, integrated range of overlapping business development services. BanasCraft helps craftswomen market their products both locally and in urban markets in India and abroad, through retail and wholesale channels. The crafts are marketed through the BanasCraft stores and also sold through bazaars and exhibitions. Craftswomen show their wares at festivals and trade shows, as well as exhibitions all over India. BanasCraft program covers more than 10,000 artisans and is composed of 300 local groups. Source: Isabelle Guerin and Jane Palier (2005), Field Survey, Tharad (2011)

BANASKANTHA Human Development Report
117
5.7 Poverty and Food Security: Taluka Wise Status of by Radars
% of BPL Families % of Very Poor Families
% of Landless BPL Families % of Houseless BPL Families
% of BPL Families not working % of BPL Families with Children Not
Going School & Working
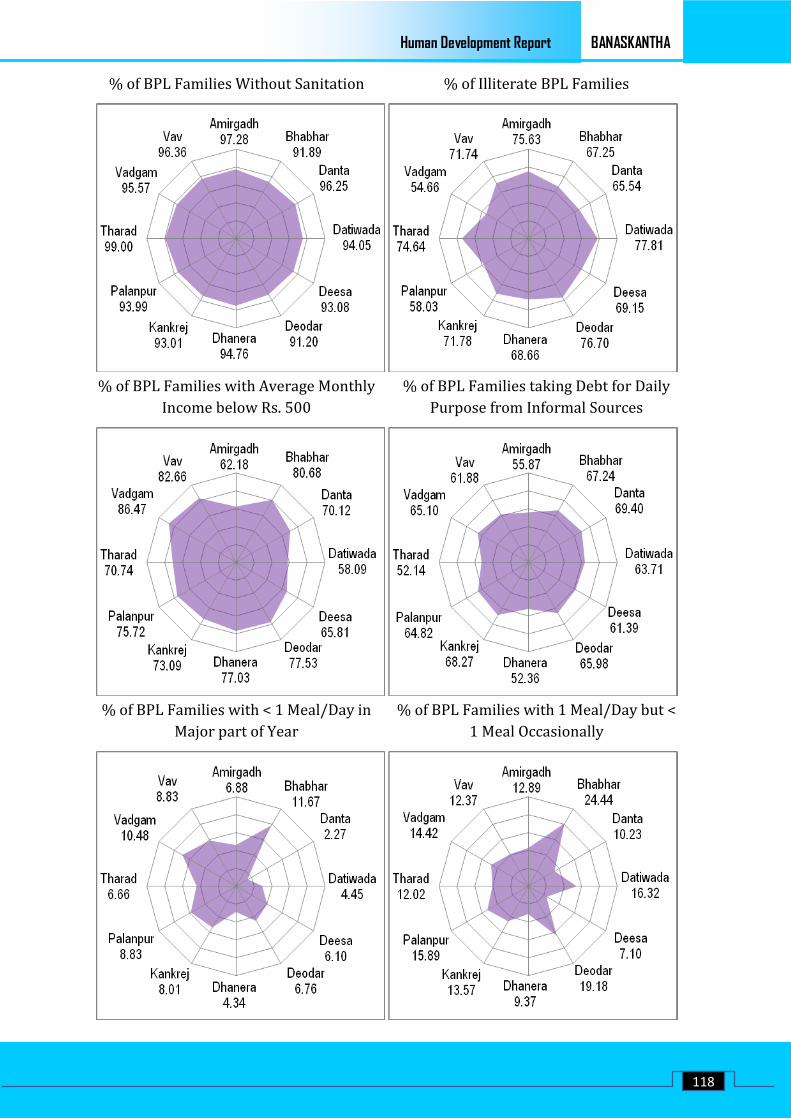
BANASKANTHA Human Development Report
118
% of BPL Families Without Sanitation % of Illiterate BPL Families
% of BPL Families with Average Monthly Income below Rs. 500
% of BPL Families taking Debt for Daily Purpose from Informal Sources
% of BPL Families with < 1 Meal/Day in Major part of Year
% of BPL Families with 1 Meal/Day but < 1 Meal Occasionally

BANASKANTHA Human Development Report
119
% of Water Sources Contaminated % of Swajaldhara Schemes Completed
Self Employment Provided under SRGY (Since 2001 to 2014)
Houses Provided under IAY (Since 2001 to 2014)
Sakhi Mandals Provided Cash Credit Benefit
(Since 2007 to 2014) Sanitation Provided to BPL Families under
TSC (Since 2004 to 2014)

BANASKANTHA Human Development Report
120
Chapter 6
THE
WAY
AHEAD

BANASKANTHA Human Development Report
121
Chapter 6
THE WAY AHEAD
6.1 Introduction
According to the Gujarat State Human Development Report (2004), out of 25 districts of Gujarat, Banaskantha district was ranked 25th with reference to Human Development Measures-1 (HDM-1), 25th with reference to Gender Development Measures-1 (GDM-1), 25th with reference to Gender Equality Index (GEI), 18th with reference to Human Development Measures-2 (HDM-2) and 25th with reference to overall Human Development Index (HDI) amongst all the 25 districts of Gujarat in 1991. While after a decade, out of 25 districts of Gujarat, Banaskantha district ranked 24th with reference to Human Development Measures-1 (HDM-1), 24th with reference to Gender Development Measures-1 (GDM-1), 25th with reference to Gender Equality Index (GEI), 21st with reference to Human Development Measures-2 (HDM-2) and 24th with reference to overall Human Development Index (HDI) amongst all the 25 districts of Gujarat in 2001.
Banaskantha district has made notable progress in certain sectors of human development in past. But there is still a long way to match with the (human) developments in other districts of Gujarat as well as districts of other states of India. The vision of Banaskantha district should be realized and help achieving the desired level in human development. This necessitates strategic involvement of public, private and community entities in various areas related to human development. The all-inclusive human development is a long term process and consequently requires both short term and long term approaches.
Based on the findings and observations, the Banaskantha district requires evolving a strategic action plan and corresponding policy practices to enhance the status of human development. To achieve these goals adequate resources are to be provided with appropriate monitoring of the programs, schemes and activities under implementation. With suitable planning and the participation of local authorities and communities, sustainable human development is possible in the district in the near future.
6.2 Issues in Agriculture, Animal Husbandry and Livelihood
On one hand the proportion of net cropped area (70% to 71%) out of the total reported area in Banaskantha has remained stagnant during last decade and on other hand there has been severe fluctuation in area under production of food crops and area under production of non food crops. The cropping intensity has decreased in Bhabhar, Danta, Deesa, Dhanera, Tharad and Vadgam talukas, while Bhabhar, Danta, Kankrej, Tharad and Vav has more than half of its cropped area that is unirrigated. It has been observed that in the talukas of western Banaskantha, due to scarcity of water, multiple cropping is not possible and therefore farmers have only one season chance to earn during the year. Adequate irrigation facilities in these areas would enhance multiple cropping as well as increase in cultivation of crops. Bhabhar, Deodar, Kankrej, Tharad and Vav talukas have enough area under cultivation but merely less than 3% of its cultivated area under drip/sprinkle irrigation. The extension of drip/sprinkle irrigation in these talukas would provide the opportunity for multiple cropping and increased earnings to the farmers in these regions.
BANASKANTHA Human Development Report
122
Vav and Tharad talukas share almost 29.3% of reported area of the district. With almost one third area of district, these areas face the problem of salinity. The basic problem that concerns water is that due to saline intrusion the sweet water of fresh water aquifers is turned into saline water in the plain areas. This phenomenon causes reduction in drinking and irrigation water supplies of usable quality. The main reasons responsible for salinity ingress of ground water aquifers are excessive and heavy withdrawals of ground water, relatively less recharge and poor land and water management. Recharging measures and other salinity control measures are put into practice for improving water availability and water quality, but the results has been less alarming against the deteriorating quality of land and water. Moreover, due to recharging practices, the rising water table has adversely affected by increasing the problem of salinity over the period. Instead, alternative of green house projects for fruits, vegetables and other suitable crops needs to be promoted and propagated as the salinity of soil would least affect such projects and scarce and fresh water can be utilized through drip and sprinkle irrigation would increase the productivity and earning opportunities in these areas.
Furthermore, the main grains crops cultivated in Banaskantha are bajra and wheat which are grown over an area of almost 27% of net cropped area and nearly 20% of total cropped area. It has been noticed that during last decade the productivity (production/hectare) of main food crops (Bajra and Wheat) has been volatile in 2006 and 2011. Also the cropping intensity in Banaskantha has declined from 143.45 to 138.90 over the years in last decade. The soil fertility is required to be restored through rationalized integrated nutrient management practices. This soil fertility management practices can be linked with Soil Health Card where the nature of soil, suitable crops and corresponding manure/fertilizer usage is clarified to the farmers. The time table of cropping to harvesting for categories of crops can be adopted, which indicates the cultivation process (including which crop should be cultivated in what kind of soil and supplemented by which fertilizer, when to give water, when to give fertilizer and other farm care tips). This model can be incorporated with existing facilities offered by e-Gram schemes. The farmer can register him under the scheme and whenever he requires cropping tips, the details of his soil health card can be entered in the software and output can be obtained which indicates various tips for suitable crops based on nature of soil. This will enhance the capacity of farmers to produce and earn.
6.3 Challenges in Literacy and Education
The Millennium Development Goal emphasize on Universal Primary Education. To meet the goal great efforts are made through Sarva Shiksha Abhiyan (SSA), with priority of education to girl child. However, the overall literacy has increased in Banaskantha, but the female literacy in 2011 was reported just 51.75 in Banaskantha and the the gap between male and female literacy was reported to be 26.40 in 2011 despite the efforts of providing primary education. Moreover, as per the census 2011, the wide gap across the gender, across the social groups and across the region (rural/urban) was observed in Banaskantha. Specific efforts for providing primary education to social groups (especially SC and ST) and women in backward talukas should be given greater importance along with the measures to reduce the literacy gap between male and female in Banaskantha.

BANASKANTHA Human Development Report
123
The Gross Enrolment Ratio (GER) at primary level for Banaskantha has improved from 121.8 in 2005-06 to 157.91 in 2009-10 and deteriorated to 99.38 in 2013-14, while GER at upper primary level has declined from 95.3 in 2005-06 to 68.56 in 2009-10 and increased to 99.28 in 2013-14. The gap between boys and girls enrolment at primary as well as upper primary level in Banaskantha needs to be reduced. Class-wise enrolment in the elementary education in Banaskantha from 2005-06 to 2013-14 shows tendency for Class 1 enrolments to decline over successive years and the enrolments to rise successively thereafter in the higher classes. Also the steep decline between Class 1 and Class 2 enrolments occurs every year and thus Class 2 enrolments hover around between 75% and 90% of the students enrolled in Class 1 in the previous year. This simply indicates that students join the education system but do not continue further. It reveals shrinkage in enrolment every successive year during the transition at every stage of higher classes. However, the dropout rate is reported to be declining, but still during transition large number of students initially enrolled drops out of school. Such scenario replicates that special efforts should be made not only to enroll the students but to retain them and provide higher education. Though the provision of drinking water facilities at schools in Banaskantha and provision of separate girls’ toilet in schools of Banaskantha has improved, the functionality, maintenance and hygiene aspects should be emphasized so that school going children can really benefit out of it rather than just facilitating by provision of infrastructure. Drinking water and sanitation being the matter of prime concern in education, availability of such facilities should be ensured by linking it with grants (school development funds) for strict implementation. However, the SCR in Banaskantha is close to the national norms specified in Model school criteria of 40:1, but as far as PTR is concerned, Banaskantha faces major challenge to achieve Model school criteria of 25:1. Future efforts have to be such that the PTR and SCR in Banaskantha are progressively brought further down and the difference has to be narrowed down uniformly everywhere. Although most of the schools possess essential facilities, there are still a few schools without adequate essential facilities. Despite considerable developments in school amenities, a good number of schools are to be provided with minimum essential physical, ancillary and teaching-learning facilities. It is expected that provisions made available under the SSA should be optimally utilized, as it has gained significance in view of the RTE provisions. 6.4 Problems in Health, Nutrition and Sanitation Despite the expansion in health care facilities in Banaskantha during last decade, still due to low literacy, the traditional practices to cure diseases prevail in some backward areas and are followed by the lower castes and the tribal people. The prevailing misconceptions and ignorance of health care hamper the betterment in health and hygiene conditions of people in backward areas of Banaskantha. Mass awareness for health care facilities and its accessibilities should be prioritised to create the responsiveness in the backward areas. The health care system includes public as well as private health care institutions, but as far as availability of database of health sector at district level is concerned, most of the existing database covers the details of public health care institutions only; consequently, it becomes impractical to analyse and portray the health care scenario of the district. While analysing, planning and executing the health care services at district level, the existing data gap leads to lopsided efforts to fix and achieve the targets of health care at district level.

BANASKANTHA Human Development Report
124
As far as manpower in health care sector is concerned in Banaskantha, it is observed that few of the key positions (especially doctors and nurses) are vacant and the substantial staff is on contractual basis. This has lead to increased burden of workload on the existing staff. Prompt efforts are needed to fill up the key positions at various levels across the talukas of district to ensure the quality of health care services offered by the medical institutions. Moreover, appropriate measures are required to be adopted so that after the specified years of contractual service, such positions be regularised to ensure the job satisfaction of staff that largely impacts the quality of services offered at health care institutions.
Although, the cases of Malaria are reported to be declining over the years in Banaskanth, but there has been drastic increase in cases suffering from Acute Respiratory Infection. Apart from it, cases of Acute Viral Hepatitis and Enteric Fever, Diarrhoeal Disease and Measles have also persisted in Banaskantha. This indicates that the district is highly vulnerable to number of diseases and therefore regular campaigning of prevention of diseases, health care tips and hygiene instructions along with drinking water and sanitation guidelines are required to create the awareness amongst the people of Banaskantha. This can be linked with existing work of PHCs and CHCs so as to ensure the large scale coverage.
The proportion of institutional (Govt. and private) deliveries out of total (institutional and home) deliveries has increased overtime in last few years in Banaskantha. But, still in tribal areas with strange socio-culture beliefs, the delivery of ANC is conducted by the father-in-law. This poises the risk of maternal death as well as infant death due to delivery assisted by non skill person. Considerable efforts are required through community groups, NGOs, religious institutions and other suitable agencies to handle such socio-cultural practices and opt for better health care.
Most of the Anganwadis are located at the outskirts of the village, which obstructs its access. The availability of electricity, safe drinking water and sanitation facilities are the major problems faced by the Anganwadis. Due to no uniformity in construction of buildings of Anganwadis, in some cases, construction of building is good, but the building is without sanitation facility, while in some cases, sanitation facilities are available, but the planning and construction of buildings is poor, whereas in few cases, if the building and sanitation facilities are available, the compound wall is not constructed. This obstructs optimum utilisation of available resources for Anganwadis. Specific criterions are required to be followed in construction of Anganwadis (including location, drinking water and sanitation facilities). The Anganwadi model has to be thought and implemented for optimum utilisation of the resources and accessibility of services offered by Anganwadis.
Despite several bottlenecks in operating activities of Anganwadis, several steps can be taken to achieve the goal of Anganwadis. School admissions and rationing cards can be linked with the vaccination of the children, i.e. those students willing to take admission in schools are required to undergo full vaccination (free of cost) before joining the school. This will enhance the health care of children, if school health programs also include vaccination of those students who are required to complete the vaccination. Moreover, at fair price shops, the allotment of food grains has to be linked with the vaccination of children; this will ensure the health care of infants and children on regular basis. The full vaccination certificate from Anganwadi can be made essential for school admission and purchase of grains from fair price shops.

BANASKANTHA Human Development Report
125
6.5 Concerns in Poverty, Food Security and Vulnerability In Banaskantha, almost 73.74% of BPL families have average monthly income below Rs. 500; while 61.26% of BPL families do not possess land; whereas, 22.10% of BPL families do not possess housing facilities. Furthermore, 94.71% of BPL families do not possess sanitation facilities; while 53.02% of BPL families children are not going to school and working; whereas almost 62.88% of BPL families opt to take debt for daily purpose from informal sources. Despite various schemes for BPL families, huge poor mass is still to be facilitated with various kinds of incentives to live the life in a better condition. Schemes are required to be framed and executed on the basis of demand and supply scenario to realise the optimum allocation of resources. Comparing the preference of BPL families across talukas and provision of incentives in various schemes in talukas revealed certain disproportion. Out of total BPL families in Banaskantha which preferred wage employment, highest BPL families were from Deesa and Kankrej, while out of total wage employment provided by MNREGA in Banaskantha, highest employees were benefited in Vadgam and Amirgadh talukas. Such imbalances lead to exhaustion of available resources which deviated from the allocation priorities. Therefore, appropriate measures are to be framed considering the demand and supply scenario in the district for provision of incentives to the BPL families. The food security in BPL families of Banaskantha reveal that 7.14% of BPL families can manage less than 1 square meal per day for major part of the year, while 13.29% of BPL families can manage 1 square meal per day, but less than 1 square meal occasionally, whereas 8.02% of BPL families can manage 1 square meal per day throughout the year and 49.40% of BPL families can manage 2 square meals per day, with occasional shortage. This illustrate that only 22.15% of BPL families can manage enough food for livelihood and many of the households in the district live in hunger despite the efforts by food security schemes. There are many households which do not benefit from support schemes. Many families in the district do not have any safety- net in terms of past savings and during emergency; they opt for debt usually from informal sources to meet their daily needs. Therefore, it is evident that in order to cope with the challenge of food security, along with government schemes, adequate production of food grains is to be ensured, food grains at affordable prices are to be made available and purchasing power of the people is to be raised by integrated efforts that enhance the livelihood of BPL families. Banaskantha is one of the districts most vulnerable to water related problems. The eastern part of district the recharge is very negligible due to hard and massive granite formation and western part of district is saline. The major irrigation projects of Banaskantha are located in the eastern part of Banaskantha due to its feasibility and the present distribution of irrigation projects depicts that only 8.6% of villages of Banaskantha fall under its command area. Consequently, talukas of Bhabhar, Deodar, Tharad, Vav totally depend on ground water for irrigation and other purposes. The scanty rainfall and excess pumping in most of the talukas has resulted to over exploitation of ground water as well as deterioration in quality. As per the water quality profile of Banaskantha district for the years 2008-09 to 2011-12, almost 49.95% sources turned out to be contaminated. The talukas of eastern Banaskantha has witnessed high level of contamination compared to the talukas of western Banaskantha which indicates that contamination at lakes and reservoirs is more severe and persistent than streams and rivers. Given the geological and hydrological features of Banaskantha, the continuous efforts with suitable technology and schemes are required besides existing schemes to constantly improve the water related crises in Banaskantha.

BANASKANTHA Human Development Report
126
In Banaskantha still there exists economic and social inequality and consequently there are people who remain vulnerable to various conditions. The overall extent of crime is reported to be increased in Banaskantha. The total cognizable crimes such as burglary, theft, robbery and kidnaping seems to have grown in Banaskantha. In Banaskantha the reporting of incidents pertaining to crime against women has increased between 2004 and 2010. Out of the total incidents of crime and violence against women in reported in Banaskantha, the incidents reported against cruelty by husband and relatives have been drastically noticed greater than before. It reflects the wakefulness of women and society towards women dignity and right to live respectful life. In context of the initiatives being taken by victim women, it becomes essential to assist such vulnerable sections so as to promote better human development by implementing proper law and order. Given the strong relationship between crime, insecurity and human development in the region, it demands great attention to control such evils that have negative impacts on human development.
The living and working conditions of migrant labours are reported to be very discouraging in Banaskantha. Long working hours, lower wages, health hazards, accidents, discrimination, incidence of child labour, verbal abuse, ill-treatment, social insecurity makes life of migrants vulnerable. Effective enforcement of all Labour Laws for protecting the Interests of the migrant labours are must. Only licensed labour contractors should be allowed and legal contract between the land owner and labourers/contractors should be ensured. Good living and working conditions of migrant workers should be ensured along with health insurance.
The western Banaskantha region forms the edge area of the desert of Kutch and because of its arid to semi-arid climate; the area is highly prone to desertification. The western part of the district constitutes barren, sandy and saline zone characterised by erosion and poor soil fertility with poor vegetative cover. The resultant desertification is due to a complex process of maladjustment of interacting forces between the physio-biotic environment and its users. Further, the process of desertification is fiercest not in a desert interior, but in the less arid marginal areas which are susceptible to ecological imbalance leading to desertification. Effective prevention of desertification requires both local management and macro policy approaches that promote sustainability of ecosystem services. It is advisable to focus on prevention, because attempts to rehabilitate desertified areas are costly and tend to deliver limited results. Land and water management to protect erosion, salinity, and other forms of degradation are required to be integrated. Vegetative cover should be conserved as it is instrumental for soil conservation against wind and water erosion. Integrated traditional practices with locally acceptable land use technologies should be implemented.
As far as planning for human development is concerned, the crucial aspect is to collect reliable data of the existing situation and prepare the action plan accordingly. Given the reliability of data at village, taluka and district level, proper monitoring to prepare accurate database is essentially required to form development strategies. Moreover, to provide the developmental services at the grass root level, the Gram Panchayats are the crucial points and thus the enhancement in governance for effective and efficient delivery of services play a vital role. The major challenges faced by the Gram Panchayats in this context are allocation of resources, absence of community interest and competence to govern. Therefore, unless Gram Panchayats are empowered in terms of finance and functions, the participatory good governance cannot be ensured, which has serious implications for delivery of essential services and ultimately for human development in the Banaskantha.

BANASKANTHA Human Development Report
127
Bibliography Census of India (2001), District Census Handbook: Banaskantha, Series 25 Gujarat, Directorate of Census Operations, Gujarat.
Census of India (2011), Provisional Population Totals: Gujarat, Series 25 Gujarat, Directorate of Census Operations, Gujarat.
Chief District Health Office (2014), Health Statistics: Banaskantha 2009-14, District Panchayat Banaskantha, Palanpur.
Commissionerate of Health, Medical Services, Medical Education and Research (2011), Health Statistics: Gujarat 2009-10, Government of Gujarat.
Commissionerate of Health, Medical Services, Medical Education and Research (2013), Health Statistics: Gujarat 2012-13, Government of Gujarat.
Commissionerate of Rural Development (2011), Proposed Add-On List of BPL Families 2008-09, Socio-Economic Survey 2002-03, Government of Gujarat
Commissionerate of Rural Development (2014), Proposed Add-On List of BPL Families 2013-14, Socio-Economic Survey 2002-03, Government of Gujarat
Commissionerate of Rural Development (2011), Proposed of BPL Families, Socio-Economic Survey 2002-03, Government of Gujarat
Commissionerate of Schools and Mid Day Meal (2011), Education Statistics: Gujarat 2005-2010, Government of Gujarat.
Directorate of Agriculture (2006), Agriculture Statistics: Gujarat 2005-06, Government of Gujarat.
Directorate of Agriculture (2011), Agriculture Statistics: Gujarat 2010-11, Government of Gujarat.
Directorate of Agriculture (2011), Documents on Schemes and Programs, Government of Gujarat.
Directorate of Animal Husbandry (2011), 27th Survey Report on Estimates of Major Livestock Products for the year 2009-2010, Gujarat, Government of Gujarat.
Directorate of Animal Husbandry (2011), Documents on Schemes and Programs, Government of Gujarat.
Directorate of Horticulture (2006), Horticulture Statistics: Gujarat 2005-06, Government of Gujarat.
Directorate of Horticulture (2011), Horticulture Statistics: Gujarat 2010-11, Government of Gujarat.
Directorate of Primary Education (2011), Documents on Schemes and Programs, Government of Gujarat.
Directorate of Primary Education (2011), Education Statistics: Gujarat 2005-2010, Government of Gujarat.
District Agriculture Office (2011), Documents on Schemes and Programs, District Panchayat Banaskantha, Palanpur.
District Animal Husbandry Office (2011), Animal Husbandry Statistics: Banaskantha 2010, District Panchayat Banaskantha, Palanpur.
BANASKANTHA Human Development Report
128
District Collector Office (2011), Golden Goals of Banaskantha District Administration, Collector Office Banaskantha, Palanpur.
District Development Office (2011), Progress under Schemes and Programs, District Panchayat Banaskantha, Palanpur.
District Education Office (2007), Education Statistics: Banaskantha 2005-06, District Panchayat Banaskantha, Palanpur.
District Education Office (2010), Education Statistics: Banaskantha 2008-09, District Panchayat Banaskantha, Palanpur.
District Education Office (2011), Education Statistics: Banaskantha 2009-10, District Panchayat Banaskantha, Palanpur.
District Information System for Education (2011), Database on District Report Cards 2005-10, National University of Educational Planning and Administration, New Delhi.
District Information System for Education (2011), Database on School Report Cards 2005-10, National University of Educational Planning and Administration, New Delhi.
District Program Management Unit (2007), District Health Action Plan 2008-09, National Rural Health Mission (NHRM), District Panchayat Banaskantha, Palanpur.
District Rural Development Agency (2011), Documents on Schemes and Programs, District Panchayat Banaskantha, Palanpur.
District Statistics Office (2004), Statistical Outline of Banaskantha District 2003-04, District Panchayat Banaskantha, Palanpur.
District Statistics Office (2005), Statistical Outline of Banaskantha District 2004-05, District Panchayat Banaskantha, Palanpur.
District Statistics Office (2006), Statistical Outline of Banaskantha District 2005-06, District Panchayat Banaskantha, Palanpur.
District Statistics Office (2007), Statistical Outline of Banaskantha District 2006-07, District Panchayat Banaskantha, Palanpur.
District Statistics Office (2009), Statistical Outline of Banaskantha District 2008-09, District Panchayat Banaskantha, Palanpur.
District Statistics Office (2011), Statistical Outline of Banaskantha District 2010-11, District Panchayat Banaskantha, Palanpur.
District Supply Office (2011), Supply Statistics: Banaskantha 2010, District Panchayat Banaskantha, Palanpur.
Gujarat Council of Elementary Education (2014), Education Statistics 2013-14, Sarva Siksha Abhiyan, Gandhinagar.
Government of Gujarat (1971), Hathi Committee Report on Balanced Development, General Administration Department (Planning), Gandhinagar.
Government of Gujarat (1984), I G Patel Committee Report for the Development of Backward Areas, General Administration Department (Planning), Gandhinagar.

BANASKANTHA Human Development Report
129
Government of Gujarat (2005), Report of the Committee to Study Backwardness of Talukas of Gujarat, General Administration Department (Planning), Gandhinagar.
Gujarat Ecology Commission (1996), Process of Desertification in Kachchh and Banaskantha Districts of Gujarat, India, Prepared by Gujarat Institute of Desert Ecology, Bhuj for Gujarat Ecology Commission, Vadodara.
Gujarat Water Resource Development Corporation (2011), Gujarat Water Resource Estimation Maps: Banaskantha District, Government of Gujarat
Hirway and Mahadevia (2004), Gujarat Human Development Report 2004, Mahatma Gandhi Labour Institute, Ahmedabad.
Integrated Child Development Services (2011), Nutrition Statistics: Banaskantha 2010-11, District Panchayat Banaskantha, Palanpur.
John Cook and Deborah Frank (2008), “Food Security, Poverty, and Human Development in the United States”, Annals of the New York Academy of Sciences, Vol. 1136, 193-209.
Narmada, Water Resource, Water Supply and Kalpsar Department (2012), Statistical Abstracts 2011, Reservoir Operation, Water Supply Division, Government of Gujarat
National Rural Drinking Water Program (2011), Block Wise Household Sanitation Database, Ministry of Drinking Water and Sanitation, Government of India
National Rural Drinking Water Program (2014), Blockwise Drinking Water Facility in Schools and Anganwadis, Block Wise Database, Ministry of Drinking Water and Sanitation, Government of India
Neera Burra (2008), “Children migrating for work from Dungarpur district, Rajasthan, to Gujarat”, A Report prepared for National Commission for the Protection of Child Rights (NCPCR), New Delhi.
Population Research Center (2009). Rapid Appraisal of National Rural Health Mission (NHRM) Implementation: Banaskantha District of Gujarat, Department of Statistics, The M. S. University of Baroda, Baroda.
Shah Ghanshyam (2004), “Growth, Poverty and Human Development in India”, Conference Paper, 18th European Conference on Modern South Asian Studies, , Sweden, 6-9 July, 1-27.
State Crime Records Bureau (2011), Crime Statistics: Gujarat 2005-2010, Government of Gujarat
UNDP (2011), Caribbean Human Development Report on Citizen Security, Press Release, September 5, Port of Spain.
UNICEF (2011), ‘Nutrition’, Fast Facts, available online http://www.unicef.org/india/ nutrition.html (accessed on 5-11-2011)
Water and Sanitation Management Organization (2011), Taluka wise Progress Statistics 2011, Swajaldhara / Sector Reform Scheme Program, Government of Gujarat
WHO (2011), ‘Sanitation’, Health Topics, available online http://www.who.int/topics/ sanitation/en/ (accessed on 5-11-2011)

BANASKANTHA Human Development Report
130
Gujarat Social Infrastructure Development Society (GSIDS)
General Administration Department (Planning)
Government of Gujarat
----------- Government Central Press, Gandhinagar.