Gujarat CM Enabling government machinery for Dashboard ...
6
In Focus informatics.nic.in April 2020 22 Enabling government machinery for strengthening good governance I am happy to see the wide interest evoked nationally by this system of ours, a product which has evolved due to the hard work and diligent efforts put in by the team in CMO ably supported by NIC with its technical capabilities. Such a tool goes a long way in efficient, transparent and responsive administrative interventions in improving the lives of our citizens. Shri Vijay Rupani Hon’ble Chief Minister, Gujarat Gujarat CM Dashboard Administrative Command & Control System
Transcript of Gujarat CM Enabling government machinery for Dashboard ...

In Focus
informatics.nic.in April 202022
Enabling government machinery for strengthening good governance
I am happy to see the wide interest evoked nationally by this system of ours, a product which has evolved due to the hard work and diligent efforts put in by the team in CMO ably supported by NIC with its technical capabilities. Such a tool goes a long way in efficient, transparent and responsive administrative interventions in improving the lives of our citizens.
Shri Vijay RupaniHon’ble Chief Minister, Gujarat
Gujarat CM Dashboard
Administrative Command & Control System
In Focus
informatics.nic.inApril 2020 23
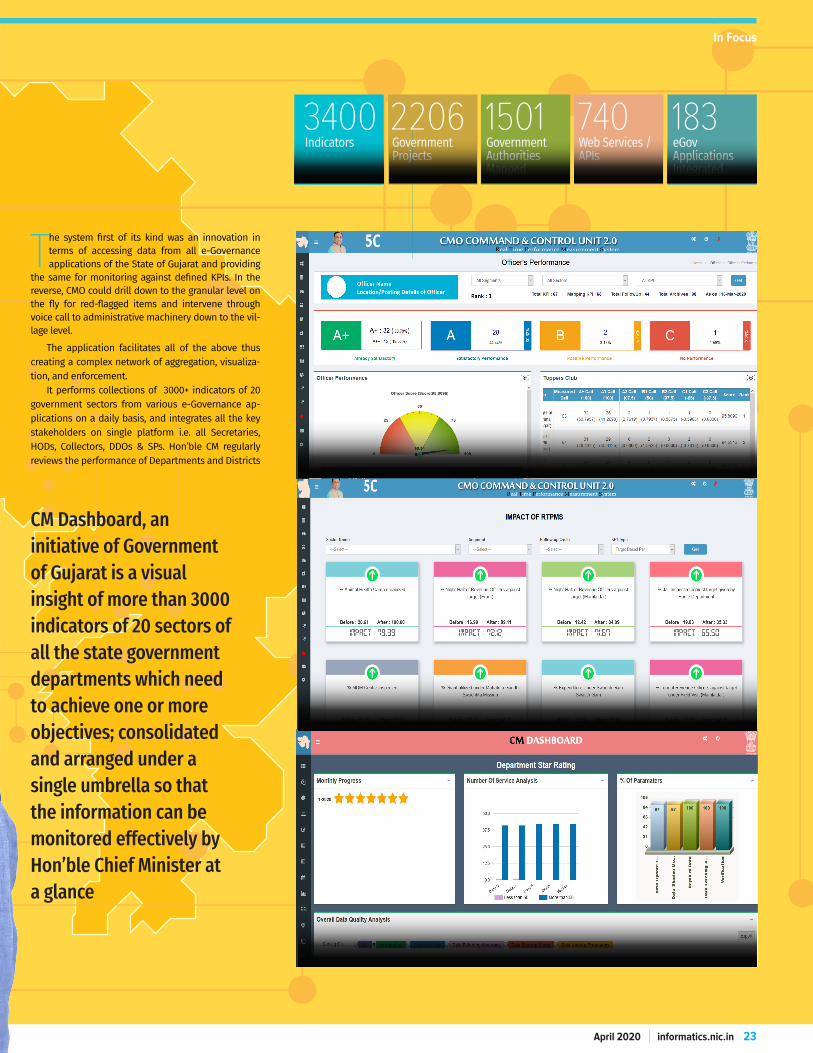
CM Dashboard, an initiative of Government of Gujarat is a visual insight of more than 3000 indicators of 20 sectors of all the state government departments which need to achieve one or more objectives; consolidated and arranged under a single umbrella so that the information can be monitored effectively by Hon’ble Chief Minister at a glance
Key Implementation Statistics
The system first of its kind was an innovation in terms of accessing data from all e-Governance applications of the State of Gujarat and providing
the same for monitoring against defined KPIs. In the reverse, CMO could drill down to the granular level on the fly for red-flagged items and intervene through voice call to administrative machinery down to the vil-lage level.
The application facilitates all of the above thus creating a complex network of aggregation, visualiza-tion, and enforcement.
It performs collections of 3000+ indicators of 20 government sectors from various e-Governance ap-plications on a daily basis, and integrates all the key stakeholders on single platform i.e. all Secretaries, HODs, Collectors, DDOs & SPs. Hon’ble CM regularly reviews the performance of Departments and Districts
1501 183
74022063400Indicators Government
ProjectsGovernment Authorities Mapped
Web Services / APIs
eGov Applications Integrated
In Focus
informatics.nic.in April 202024
through the system established at the Command and Con-trol Unit. The project consists of several modules such as Executive Dashboard, Sectoral Dashboard, District Dash-board, Corporation Dashboard, GIS Dashboard, Department Star Rating, PRAGATI-G (Project Monitoring), Aspiration Dis-trict, CCU Dashboard, Jan-Samvad Feedback Mechanism).
The Dashboard monitors departments and services and identifies areas for improvement, thereby promoting trans-parency and accountability within the Government. Also, the implementation of the system assists in enforcing digi-tal applications in functional areas yet to be computerized.
The Hon’ble Chief Minister takes a review of the activi-ties and guide directly to the concerned authority for taking appropriate steps. Each indicator is analyzed graphically by time series analysis (Daily, Monthly Quarterly and Yearly) and location (Region, District, Block, Schemes, Heads, etc.) wise. The main feature of CM Dashboard is real-time per-formance measurement with dynamic benchmarking and target setting, Performance Index up to Zone, District and Taluka level, Grading system, Toppers, and Laggers Club etc. This makes the Government more productive by achieving good, efficient and transparent governance.
Objectives• To provide data aggregation, visualization and enforce-
ment • To integrate all the key stake holders on Single platform• To identify demographic issues and areas requiring im-
provement• To promote transparency • To enforce accountability within the Government• To ensure digital systems in functional areas yet to be
computerized• To enhance the productivity of Government officials• To centralize monitoring and help in policy level deci-
sions• To provide effective service delivery and measurable pa-
rameters
We are proud that the Dashboard with its vast monitoring coverage has proved to be an efficient tool in improving the systems of the State. I see a large potential for replication of the System in different administrative domains of Governance in the country by adopting the methodology of the system at the conceptual level.
Anil Mukim, IASChief SecretaryGovernment of Gujarat
• To sensitize concerned authorities by measurement of performance and ranking
Features• Different types of dashboards for visualization• PRAGATI-G module for monitoring of physical, financial
and timely progress of various projects and its follow-up • Real time performance measurement with dynamic
benchmarking, target setting• Performance upto each hierarchical level such as Zone,
District and Taluka, KPI Gradation, follow-up and mea-surement of performance by scoring and ranking of con-cerned authorities on daily basis, Toppers and Laggers Club etc.
• Mobile application to monitor performance of the con-cerned authorities
• Feedback mechanism (Jan-Samvad) has been incorporat-ed in the system which collects all the feedback data of respective sectors.
• SMS facility has been incorporated in such a way that the system generates SMS to Nodal Officers, when the timely data is not received, follow-up reminder, ranking, etc.
• Admin module to manage entry of indicators, sector, sub-sector, department, user access rights, system gen-erate reports, etc.
• Data Synchronization module to capture data automati-cally and manually by web service API from various MIS and online system
• Data Verification module to verify data of sector and sub-sector by concerning nodal officers on monthly ba-sis.
• Upload Excel facility to upload data from excel sheet for certain indicators where MIS system is not available
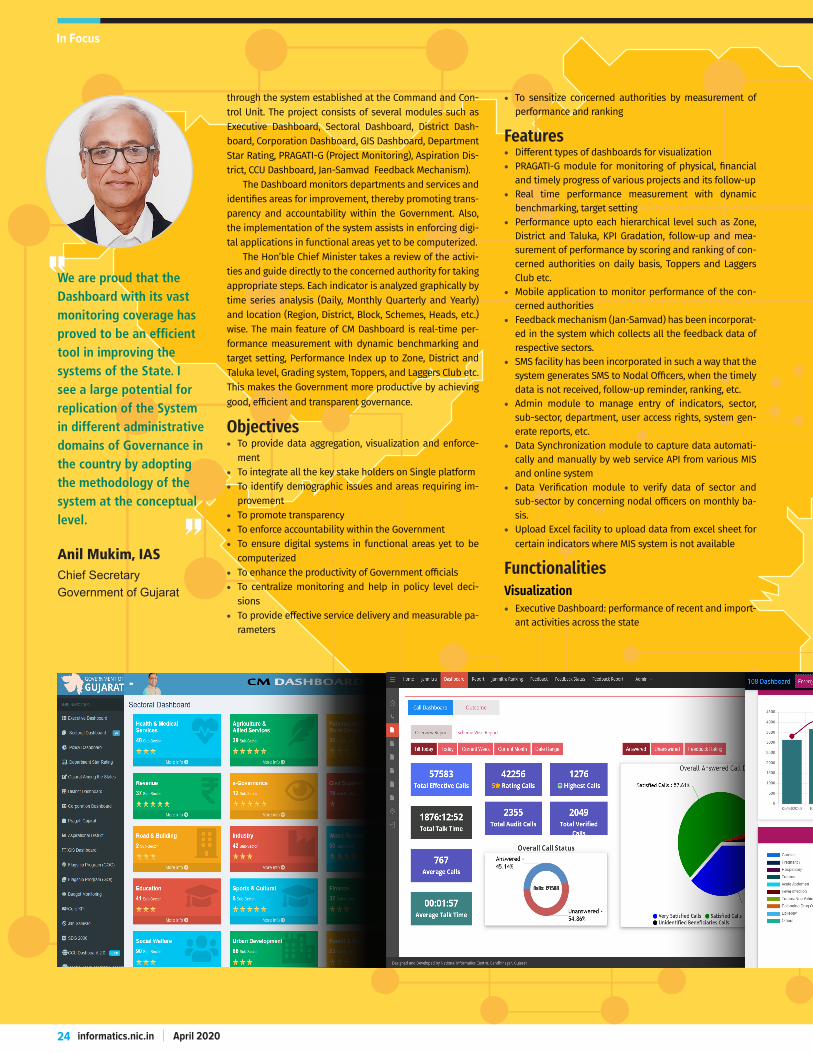
Functionalities Visualization• Executive Dashboard: performance of recent and import-
ant activities across the state
In FocusIn Focus
informatics.nic.inApril 2020 25
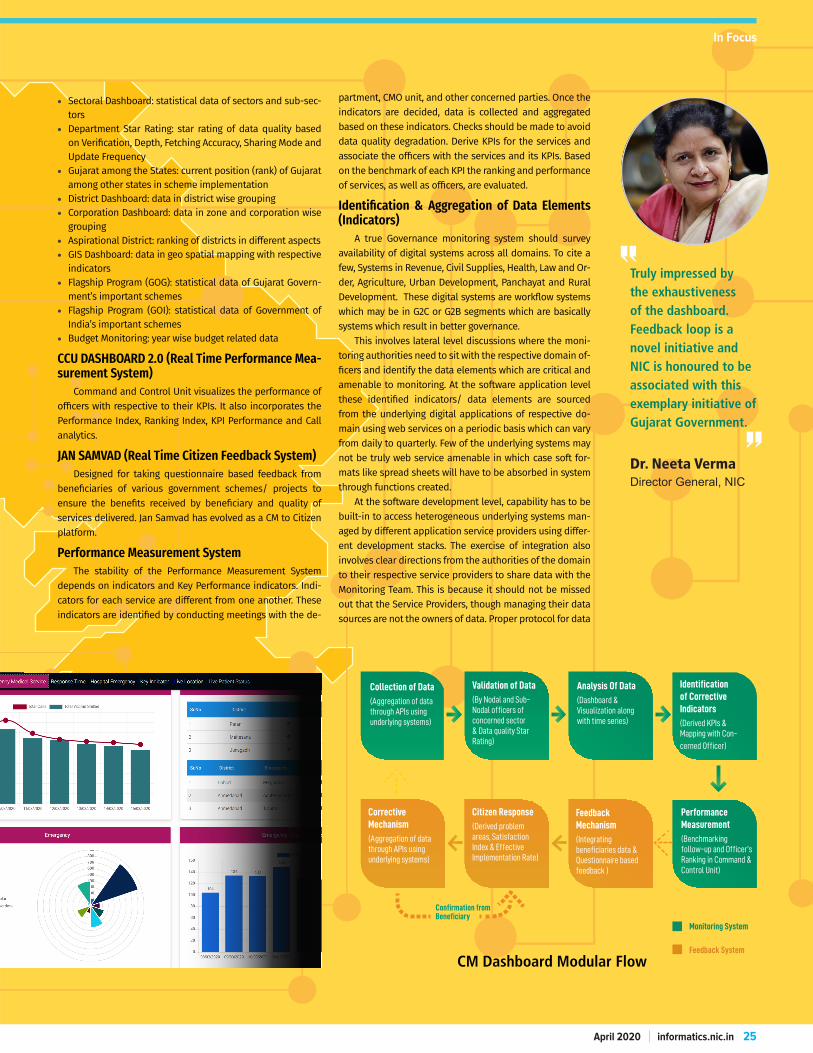
CM Dashboard Modular Flow
Confirmation from Beneficiary
Collection of Data(Aggregation of data through APIs using underlying systems)
Analysis Of Data(Dashboard & Visualization along with time series)
Identification of Corrective Indicators(Derived KPIs & Mapping with Con-
cerned Officer)
Performance Measurement(Benchmarking follow-up and Officer’s Ranking in Command & Control Unit)
Feedback Mechanism(Integrating beneficiaries data & Questionnaire based feedback )
CorrectiveMechanism(Aggregation of data through APIs using underlying systems)
Citizen Response(Derived problem areas, Satisfaction Index & Effective Implementation Rate)
Validation of Data(By Nodal and Sub- Nodal officers of concerned sector & Data quality Star Rating)
Monitoring System
Feedback System
Truly impressed by the exhaustiveness of the dashboard. Feedback loop is a novel initiative and NIC is honoured to be associated with this exemplary initiative of Gujarat Government.
Dr. Neeta VermaDirector General, NIC
• Sectoral Dashboard: statistical data of sectors and sub-sec-tors
• Department Star Rating: star rating of data quality based on Verification, Depth, Fetching Accuracy, Sharing Mode and Update Frequency
• Gujarat among the States: current position (rank) of Gujarat among other states in scheme implementation
• District Dashboard: data in district wise grouping • Corporation Dashboard: data in zone and corporation wise
grouping • Aspirational District: ranking of districts in different aspects• GIS Dashboard: data in geo spatial mapping with respective
indicators• Flagship Program (GOG): statistical data of Gujarat Govern-
ment’s important schemes• Flagship Program (GOI): statistical data of Government of
India’s important schemes• Budget Monitoring: year wise budget related data
CCU DASHBOARD 2.0 (Real Time Performance Mea-surement System)
Command and Control Unit visualizes the performance of officers with respective to their KPIs. It also incorporates the Performance Index, Ranking Index, KPI Performance and Call analytics.
JAN SAMVAD (Real Time Citizen Feedback System)Designed for taking questionnaire based feedback from
beneficiaries of various government schemes/ projects to ensure the benefits received by beneficiary and quality of services delivered. Jan Samvad has evolved as a CM to Citizen platform.
Performance Measurement SystemThe stability of the Performance Measurement System
depends on indicators and Key Performance indicators. Indi-cators for each service are different from one another. These indicators are identified by conducting meetings with the de-
partment, CMO unit, and other concerned parties. Once the indicators are decided, data is collected and aggregated based on these indicators. Checks should be made to avoid data quality degradation. Derive KPIs for the services and associate the officers with the services and its KPIs. Based on the benchmark of each KPI the ranking and performance of services, as well as officers, are evaluated.
Identification & Aggregation of Data Elements (Indicators)
A true Governance monitoring system should survey availability of digital systems across all domains. To cite a few, Systems in Revenue, Civil Supplies, Health, Law and Or-der, Agriculture, Urban Development, Panchayat and Rural Development. These digital systems are workflow systems which may be in G2C or G2B segments which are basically systems which result in better governance.
This involves lateral level discussions where the moni-toring authorities need to sit with the respective domain of-ficers and identify the data elements which are critical and amenable to monitoring. At the software application level these identified indicators/ data elements are sourced from the underlying digital applications of respective do-main using web services on a periodic basis which can vary from daily to quarterly. Few of the underlying systems may not be truly web service amenable in which case soft for-mats like spread sheets will have to be absorbed in system through functions created.
At the software development level, capability has to be built-in to access heterogeneous underlying systems man-aged by different application service providers using differ-ent development stacks. The exercise of integration also involves clear directions from the authorities of the domain to their respective service providers to share data with the Monitoring Team. This is because it should not be missed out that the Service Providers, though managing their data sources are not the owners of data. Proper protocol for data
In Focus
informatics.nic.in April 202026
sharing should be in place to avoid any issues in time.
Visualisation LayerThis is a software application specific activi-
ty where all types of display formats e.g graphs, time series charts are used. The activity is initiated through joint discussions between monitoring agen-cy and NIC development team to identify the data elements, their units, frequency etc. for each visu-alisation instance. Ranges of data, classification of data clusters are also part of the finalisation pro-cess. Comparative charts which are year-on-year, quarter-on-quarter, month-on-month became part of this exercise.
Though the manual processes may be limited under visualisation activity, the development work will require proper use of tools in terms of through-puts and responses of the system.
Data Quality Measurement and Improve-ment Loop
The visualisation process will throw up aberra-tions in data which helps in initiating an exercise with the domain officials to cross check data con-tent and take remedial action regarding the supplied data from their systems. The nodal, sub-nodal offi-cers are given windows to the visualisation module to check the data and certify quality of the data.
Additionally the application system will also have validation routines against data elements i.e range checks of the values and thus flag the faulty data arising in the incoming services. These are con-veyed to the nodal officers using SMS or email for immediate corrective actions.
Derivation of Key Performance Indicators (KPIs)/ Performance Monitoring
This is the key of the Monitoring System where the execution level officials under each domain spe-cific application are mapped to set of KPIs so that these KPI benchmarks are used to evaluate perfor-mance, ranking of these officials. Examples of such officials are the Collectors, District Development of-ficers in the State. Intensive follow ups to motivate improvement of performance of the nodal officers are executed.
The ratings for each KPI is classified as A+ for Al-ready satisfactory, A – Satisfactory performance, B – Positive performance, C – Negative Performance. The performance matrix including Officers-Districts is kept upto date. The classification also providers for Toppers, Laggards classification. Also start rankings are provided based on different attributes.
Beneficiary Feedback SystemBased on the same data collection methods
used in the Performance Measurement System, the beneficiary feedbacks of the corresponding services are collected. For that call centre executives are employed to generate feedback using the question-naires defined for the services. Analyse the data gen-erated and identify the sentiment (positive or nega-tive) of the feedback. Poor feedback are forwarded to the higher authority and subsequently, the action taken report, as well as a confirmation call, are re-corded till beneficiary gets the benefit. From this data ‘satisfaction index’ and ‘effective implementa-tion rates’ are derived.
Creation of Questionnaire for FeedbackThe KPI performance values which are flagged
for feedback by the Monitoring Cell are accordingly marked in the system and the stored questionnaire against the KPI is made visible to the Call Centre
team for telephonically using with the beneficiary.
Beneficiary Details extractionBased on the identified KPIs for feedback and
the filter applied to extract a subset of the benefi-ciary list, the underlying application system is mined for the granular data giving the beneficiary personal information including contact details.
Call Centre Operations The Call Centre will initiate telephonic querying
of the beneficiary based on the questionnaire. The objective answers and final feedback is recorded
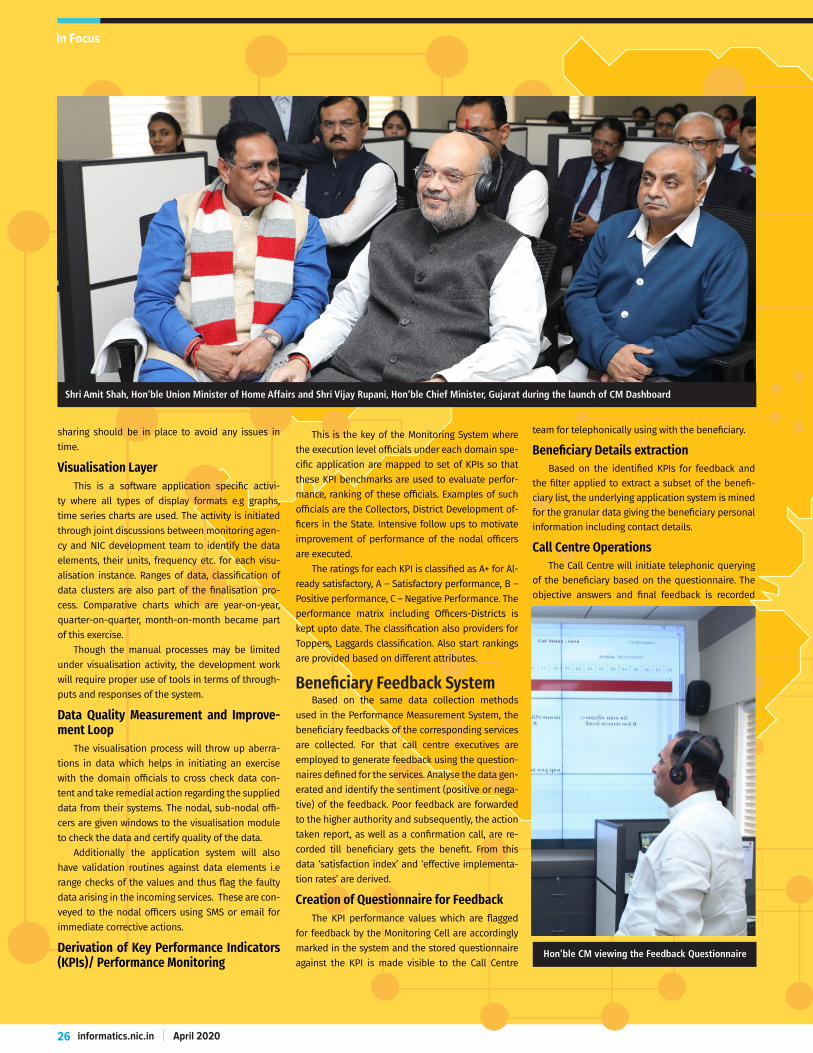
Shri Amit Shah, Hon’ble Union Minister of Home Affairs and Shri Vijay Rupani, Hon’ble Chief Minister, Gujarat during the launch of CM Dashboard
Hon’ble CM viewing the Feedback Questionnaire

In Focus
informatics.nic.inApril 2020 27
Mohan Krishnan P VDy. Director General & [email protected]
Anand Indulal ShahSr. Technical Director [email protected]
Khanesha Shailesh KScientist-C [email protected]
Prenoy KumarScientist-B [email protected]
For further information, please contact:
State Informatics OfficerNational Informatics CentreBlock 13, 2nd FloorSardar BhawanGandhi NagarGUJARAT - 382010 Email: [email protected] Phone: 079-23252972
into the system. Everything is done through online integration including the telephony integration through Telecom Service Pro-vider.
Beneficiary Feedback FollowupThe feedback is displayed online for the CCU team to view,
analyze and flag for escalation to the concerned nodal officers for the KPI related to originating district.
Action Taken Reporting (ATR)The nodal officers to whom such feedback (which are poor
or negative) is flagged are supposed to manually intervene for resolution and revert through documentary proof of resolution of the case. The online system facilitates such data collection. In ad-dition to nodal officers, the Secretaries and HODs are also flagged in the online communication.
Confirmation processThe ATR triggers a confirmation feedback call with the bene-
ficiary to close the feedback loop through the Call Centre.
Stakeholders • Chief Minister Office• All State Government Departments (Secretary, HODs, Nodal/
Sub-Nodal Officers)• District Authorities (Collector, DDO, SPs, etc.)
Services To StakeholdersCMO• Monitor all the statistical data drilled down to the last level for
all the services, sectors and overall• Evaluate performance of all the officers involved in the system• Defining target and benchmarking for performance measure-
ment of concerned authorities• Getting and monitoring feedbacks from beneficiary of various
government schemes
All State Government Departments (Secretary, HODs, Nodal/ Sub-Nodal Officers)• Monitor department level performance of concerned indicators• Access and verify data that they are responsible for• Action taken against poor feedbacks
District Authorities (Collector, DDO, SPs)• View their performance statistics of concerned Key Performance
Indicators• View their performance compared to the same officers groups
Use CasesKPI monitoring, follow up with officials to speed up procedures.• Income certificate: The number of pending applications for
Income certificate (Panchayat) through e-Gram before the im-plementation was several thousands. This KPI is categorized as short term which implies that it should be improved in short time limit. In this case the KPI is mapped with district level au-thority which is a DDO (District Development Officer) of district panchayat. According to the set benchmark and time limit by CMO, the call has been generated to convey this KPI to the DDO. It drastically decreased to hundreds after the implementation.
• Grant utilization: The KPI, ‘Percentage of Grant utilized under Mahatma Gandhi Swachhta Mission’ is mapped with DDO of the
district. It was categorized as medium term. This resulted in an increase which was almost three times of the previous value.
• Inspection of police station: The KPI, ‘Percentage of Police sta-tions inspected against target given by Home Department’ is mapped with District Magistrate. In this case the improvement was more than its double after adding the KPI into the Perfor-mance Measurement System.
• Land Records- Auto Mutation Pending: The KPI number of auto mutation pending for more than 90 Days in Land Records is mapped to District Magistrate, which is an immediate term KPI that has to be taken care urgently. As the monitoring system started taking into account of the KPI, pendency of the applica-tion decreased drastically.
• 108 service: The KPI based 108 service of medical emergency is geographically mapped for real time monitoring of ambulance calling up hospital to confirm arrival. Response time of 108 ser-vice and peak hour emergency call is being monitored as part of the KPI. Also feedback from the patient is taken into the loop.
Outcome of the citizen feedback mech-anism• Mukhyamantri Bhagyalakshmi Bond: From the citizen feedback
of ‘Mukhyamantri Bhagyalakshmi Bond’, cases have been found such as the beneficiary did not receive the benefit amount as mentioned in the bond. This is a scheme of State government to provide financial benefit to the daughters of labor workers for their education or marriage. The case has been escalated to the concerned Head of Department/ Secretary, they have taken an action to deliver benefit and submit the report back to the system. CMO has made confirmation call to beneficiary and en-sured the delivery of benefit.
• Public Distribution System (PDS): Randomly select beneficia-ries and generates feedback as well as the confirmation from them. Poor feedbacks are forwarded to officials for corrective measures.
Way Forward• Include more sectors and corresponding services to achieve
100% data coverage.• Data analytics interface is to be developed so that AI, Machine
learning models can be applied on the collected data for pre-dictive and prescriptive analysis.
SummaryGujarat Chief Minister Dashboard is the first of its kind system
in terms of accessing data from all e-Governance applications of the State of Gujarat and providing the same for monitoring against defined KPIs. This enables the CMO to analyse the perfor-mance of departments, services and even officers which in turn helps in identifying problems of services. In all hierarchical levels such as zones, districts, talukas the flagged performance can be monitored. It additionally gives an insight into the effective im-plementation of schemes.