
Guidelines on Progress Monitoring and...
105
Guidelines on Progress Monitoring and Benchmarking REC, March 2007 THE WORLD BANK
Transcript of Guidelines on Progress Monitoring and...

Guidelines on Progress Monitoring and Benchmarking
REC, March 2007
THE WORLD BANK


Guidelines on Progress Monitoringand Benchmarking
Prepared byThe Regional Environmental Center for Central and Eastern Europe
March 2007

About the REC
The Regional Environmental Center for Central and Eastern Europe (REC) is a non-partisan, non-advocacy, not-for-profitinternational organisation with a mission to assist in solving environmental problems in Central and Eastern Europe (CEE).
The center fulfils this mission by promoting cooperation among non-governmental organisations, governments, businessesand other environmental stakeholders, and by supporting the free exchange of information and public participation in
environmental decision making.
The REC was established in 1990 by the United States, the European Commission and Hungary. Today, the REC is legallybased on a charter signed by the governments of 28 countries and the European Commission, and on an international
agreement with the government of Hungary. The REC has its head office in Szentendre, Hungary, and country offices andfield offices in 17 beneficiary countries, which are: Albania, Bosnia and Herzegovina, Bulgaria, Croatia, the Czech Republic,
Estonia, Hungary, Latvia, Lithuania, the former Yugoslav Republic of Macedonia, Montenegro, Poland, Romania, Serbia,Slovakia, Slovenia and Turkey.
Recent donors are the European Commission and the governments of Austria, Belgium, Bosnia and Herzegovina, Bulgaria,the Czech Republic, Croatia, Denmark, Estonia, Finland, Germany, Hungary, Italy, Japan, Latvia, Lithuania, the Netherlands,Norway, Poland, Slovakia, Slovenia, Sweden, Switzerland, the United Kingdom, and the United States, as well as other inter-
governmental and private institutions.
The entire contents of this publication are copyright©2007 The Regional Environmental Center for Central and Eastern Europe
No part of this publication may be sold in any form or reproduced for salewithout prior written permission of the copyright holder
ISBN: 978-963-9638-14-3
Published by:The Regional Environmental Center for Central and Eastern Europe
Ady Endre ut 9-11, 2000 Szentendre, HungaryTel: (36-26) 504-000, Fax: (36-26) 311-294, E-mail: [email protected], Website: <www.rec.org>
Printed in Hungary by TypoNova
This and all REC publications are printed on recycled paper or paper produced without the use of chlorine or chlorine-based chemicals

C O N T E N T S
G U I D E L I N E S O N P R O G R E S S M O N I T O R I N G A N D B E N C H M A R K I N G 3
Contents 3
Abbreviations and Acronyms 6
Foreword from the World Bank 7
Foreword from the Regional Environmental Center 8
Acknowledgements 9
Introduction 11
Part I: Benchmarking: Key Concepts and Definitions 13
Part II: Environmental Compliance and Enforcement Indicators: Key Concepts and Definitions 22
Part III: Getting Started: Benchmarking and Environmental Compliance and Enforcement Indicators 27
Part IV: Regional Experience in Environmental Compliance and Enforcement Indicators,Progresss Monitoring and Benchmarking 53
Part V: International Experience in Environmental Compliance and Enforcement Indicators, Progress Monitoring and Benchmarking 63
Part VI: Assessment Tools and Methods for Progress Monitoring and Benchmarking 69
Annexes 77Annex I: Further Classification of Benchmarking 79
Annex II: When to Use Certain Types of Benchmarking 81
Annex III: Definitions of Key Terms 82
Annex IV: Inspection Indicators 83
Annex V: Enforcement and Compliance Networks 86
Annex VI: Major Tools and Methods for Assessment of the Environmental Capacity Used in the EU Accession Process 89
Annex VII: OECD Environmental Indicators 92
Annex VIII: The European Benchmarking Code of Conduct 96

G U I D E L I N E S O N P R O G R E S S M O N I T O R I N G A N D B E N C H M A R K I N G 4
C O N T E N T S
Endnotes 99
Bibliography 100
TablesTable 1: Benchmarking is not 15
Table 2: Logic model for environmental compliance and enforcement indicators 24
Table 3: Defining the scope of an indicators programme 34
Table 4: Worksheet for identifying and selecting environmental compliance and enforcement indicators 35
Table 5: Country IPPC and RMCEI implementation policy rating: criteria and goalposts 40
Table 6: Country environmental policy rating 50
Table 7: Indicators, actions and improvement 58
Table 8: Number of inspections and value of applied penalties per inspector in 2004 62
Table 9: Ranking of counties according to three different criteria 62
Table 10: Logical framework (logframe) 73
Table 11: Different benchmarking types 80
Table 12: Types of benchmarking in different situations 81
Table 13: Major tools and methods for assessment of the environmental capacity used in the EU accession process 89
Table 14: Structure of OECD indicators core set by environmental issue 92
Table 15: OECD set of key environmental indicators 93
Table 16: Framework of OECD set of sectoral indicators 94
FiguresFigure 1: Types of benchmarking 17
Figure 2: Steps in process/performance benchmarking 18
Figure 3: Inspection and control objectives, outputs and indicators 25
Figure 4: Three-stage model for identifying, designing, and using indicators 33
Figure 5: SO2 emissions in Croatia by years 57
Figure 6: Number of inspections per inspector in Romania 60
Figure 7: Number of penalties per inspector in Romania 60
Figure 8: Amount of penalties per inspector in Romania 60
Figure 9: Number of complaints per inspector in Romania 61
Figure 10: Control of Pollution Act in Scotland: licence compliance 66

G U I D E L I N E S O N P R O G R E S S M O N I T O R I N G A N D B E N C H M A R K I N G 5
C O N T E N T S
Figures 11: Satisfactory operator performance: integrated pollution control 66
Figure 12: Benchmarking role of networks 67
BoxesBox 1: About ECENA 11
Box 2: What is benchmarking: making comparisons 15
Box 3: What is benchmarking: measuring products 15
Box 4: What is benchmarking: someone else is better 16
Box 5: What is benchmarking: performance measurement tool 16
Box 6: Paradigm blindness 17
Box 7: Definition of performance benchmarking 17
Box 8: Definition of process benchmarking 17
Box 9: Issues subject to strategic benchmarking 18
Box 10: Characteristics of the chosen process in process benchmarking 19
Box 11: Examples of a voluntary approach at the Brussels Inspectorate 30
Box 12: Finding criteria for analysing one’s own process of prioritisation of inspections in view of making external process benchmarking 31
Box 13: Inspection indicators in Albania 56
Box 14: Inspection indicators in the former Yugoslav Republic of Macedonia 58
Box 15: Inspection indicators in Serbia 59
Box 16: Recommendation for development of interpretative guidelines for indicators 61
Box 17: Other inspection indicators in Romania 61
Box 18: USEPA guidelines for monitoring design procedure 71
Box 19: Formal surveys 72
Box 20: Periodic reviews 74
Box 21: Approximation progress monitoring in Lithuania 74
Box 22: Scoring system for monitoring progress in transposition 75
Box 23: Benchmarking partners 79

AC IMPEL IMPEL for Accession CountriesAECEN Asian Enforcement and
Compliance NetworkAPQC American Product and Quality CenterBAT Best Available TechniquesBa-Wu Baden WurtembergBERCEN Balkan Environmental Regulatory
Compliance and Enforcement NetworkBiH Bosnia and HerzegovinaBREF Best Available Techniques ReferenceCARDS Community Assistance for Reconstruction,
Development and StabilisationCEE Central and Eastern EuropeCEI Core Environmental IndicatorsCSF Critical Success FactorsDEI Decoupling Environmental IndicatorsEAP Environmental Action ProgrammeECE Environmental Compliance and
EnforcementECENA Enforcement and Compliance Network
for AccessionEEA European Environmental AgencyEECCA Eastern Europe, the Caucasus and
Central AsiaEMAS Eco-management and Audit SchemeEPA Environmental Protection AgencyEPRs (OECD) Environmental Performance
ReviewsEU European UnionFARN Fundacion Ambiente y Recursos NaturalesGDP Gross Domestic ProductGO Government OrderGPRA Government Performance and Results ActIBGE-BIM The Brussels InspectorateINECE International Network for Environmental
Compliance and EnforcementIMPEL (EU Network for) Implementation and
Enforcement of Environmental LawIPPC Integrated Pollution Prevention
and ControlISO International Standard Organisation
KEI Key Environmental IndicatorsLIFE (European Union) Financial Instrument
for the EnvironmentLF Logical FrameworkLFA Logical Framework ApproachMoEFWM Albanian Ministry of Environment,
Forestry and Water ManagementMEPPPC Croatian Ministry of Environmental
Protection, Physical Planningand Construction
MO Ministerial OrderMoV Means of VerificationNEAP National Environmental Action PlanNGO Non-Governmental OrganisationODS Ozone Depleting SubstancesOECD Organisation for Economic Cooperation
and DevelopmentOEE Irish Office of Environmental EnforcementOVI Objectively Identifiable IndicatorsPEEP Project of Environmental Enforcement
PracticesREC Regional Environmental Center for
Central and Eastern EuropeRMCEI Recommendations for Minimum Criteria
for Environmental InspectionsSAP Stabilisation and Association ProcessSEE South Eastern EuropeSEI Sectoral Environmental IndicatorsSEI Former Yugoslav Republic of Macedonia
State Environmental InspectorateSEPA Scottish Environmental Protection AgencyTAIEX Technical Assistance Information
Exchange UnitUNECE United Nations Economic Commission
for EuropeUSEPA United States Environment Protection
AgencyWPEP Working Party on Environmental
Performance
6 G U I D E L I N E S O N P R O G R E S S M O N I T O R I N G A N D B E N C H M A R K I N G
A B B R E V I AT I O N S A N D A C R O N Y M S

Environment institutions in the West Balkans are ina process of adjusting to a changing legal frameworkdriven by the European Union acquis, with significantimplications for the future scope and organization oftheir work. Their change is part of a government-wideadjustment process which calls for an expanded rolefor environmental protection than the past. With this,comes a need for greater accountability and bettercommunication on outputs and objectives of environ-ment programmes and investments.
Internationally there is a growing trend to profes-sionalise environment management approachesthrough performance based self-improvement monitor-ing and benchmarking of performance with partners.Convergence under a common legal framework offerssignificant opportunities for the West Balkans to learnfrom others who made similar changes earlier, andoffers a new possibility to benchmark or compare performance on common goals and objectives withinternational peers.
Grant support has been provided by the WorldBank -Netherlands Partnership Program to the Environ-mental Compliance and Enforcement Network for
Accession (ECENA) network to help consolidate inter-national practices through a global review, integratebenchmarking discussions in early “mock” peerreviews, and provide training support to promote andadvance individual country efforts. This report docu-ments progress made and lessons learned over the pasttwo-year period, and serves as a future resource guidefor countries who strive to continue these efforts. TheWorld Bank support to these efforts acknowledges ourbelief that environment is a core part of development,and the strength and performance of institutionsdepends on a willingness to be open to self-learningand new ideas through work with others.
Marjory Anne Bromhead, World Bank Environment Sector Manager
Europe and Central Asia RegionMarch 2007
Foreword from the World Bank
7G U I D E L I N E S O N P R O G R E S S M O N I T O R I N G A N D B E N C H M A R K I N G

8 G U I D E L I N E S O N P R O G R E S S M O N I T O R I N G A N D B E N C H M A R K I N G
The transposition of the complex EU environmentallegislation is a great challenge for each candidate andpre-candidate country. However the implementationand enforcement of the EU acquis is a much more diffi-cult task as it requires reforms in the environmentalinstitutions and policy and upgraded capacity of therespective staff and bodies.
Over the past seven years, the REC has been contin-uously helping the countries in South Eastern Europeto address the current challenges in improving thecapacity of their environmental agencies and inspec-torates. The work programme of the EnvironmentalCompliance and Enforcement Network for Accession(ECENA) provided the necessary platform for regionaland national capacity building for the environmentalenforcement bodies as well as for exchange of experi-ence and best practices.
The guidelines found in this book have been devel-oped as a tool for improvement of environmental man-agement performance. They present the added value of
the benchmarking concept and its added value, andsummarise the international experience and the bene-fits from using this tool. I very much hope that theGuidelines on Progress Monitoring and Benchmarkingwill help our colleagues, partners and friends in SouthEastern Europe to take another important step inimproving their environmental performance.
I would like to thank the World Bank for their ini-tiative and support in producing the Guidelines. I alsowould like to extend my thanks to the colleagues fromSouth Eastern Europe, members of ECENA, internation-al organisations and networks as well as the REC staffwho contributed to the development of the Guidelines.
Marta Szigeti BonifertExecutive Director
Regional Environmental Center for Central and Eastern Europe
Foreword from the Regional Environmental Center

The idea to prepare this publication was put for-ward by the World Bank and commissioned to the RECas a secretariat of the Enforcement and ComplianceNetwork for Accession (ECENA). The text was writtenby Ruslan Zhechkov and Mihail Dimovski, senior pro-ject managers at the REC. Special gratitude is extendedto Ken Markowitz and Meredith Reeves from the INECESecretariat, who developed the “theory and the gettingstarted part” of Environmental Compliance andEnforcement indicators and the International Networkfor Environmental Compliance and Enforcement(INECE) Executive Planning Committee members forproviding valuable insight.
All ECENA member countries — Albania, Bulgaria,Croatia, the former Yugoslav Republic of Macedonia,Montenegro, Serbia and Kosovo (as defined by the UNSCR 1244), Romania and Turkey — contributed to thispublication by providing information on current prac-
tices on progress monitoring and benchmarking inenvironmental enforcement and compliance. We alsothank all colleagues and government officials fromECENA member countries who took part in peerreview discussions on the topic.
We would also like to thank Angela Bularga fromthe Regulatory Environmental Programme Implementa-tion Network (REPIN) led by the Organisation for Eco-nomic Co-opeartion and Development (OECD) forproviding information and advice on the ratingmethodology.
Thanks to our colleagues from the Asian Enforce-ment and Compliance Network (AECEN) for giving usa different and precious regional perspective.
We extend our gratitude to the participants in theproject Benchmarking on Quality Parameters for Envi-ronmental Inspectorates, led by Gudmund Nielsenfrom the Danish EPA.
Acknowledgements
9G U I D E L I N E S O N P R O G R E S S M O N I T O R I N G A N D B E N C H M A R K I N G

10 G U I D E L I N E S O N P R O G R E S S M O N I T O R I N G A N D B E N C H M A R K I N G

This publication is intended to provide guidelineson progress monitoring, benchmarking and use ofenvironmental compliance and enforcement (ECE)indicators. The guidelines are mostly targeted atinspectorates from South Eastern Europe (SEE), butthey can be used by other environmental institutionsin other regions as well.
The publication follows the assumption that envi-ronmental institutions and inspectorates would bene-fit from a theoretical and practical strengthening oftheir capacities to carry out benchmarking andprogress monitoring and to use ECE indicators for thispurpose. Countries in the SEE region already usethese management tools sporadically. However, theauthors and contributors believe that benchmarking,progress monitoring and use of ECE indicators have amuch bigger potential to help countries and institu-tions to align their practices and performance withthose of the best environmental organisations.
The publication starts with a theoretical overviewof benchmarking and indicators. Definitions andmethodologies from business organisations are alsoincluded. We believe that business practices can beuseful in this respect because of the constant need ofbusinesses to improve in order to survive. Environ-mental institutions also need to improve constantly inorder to answer to the challenges of the heavy pres-sure on the environment by growing economies.Countries in SEE and even in the region of EasternEurope, the Caucuses and Central Asia (EECCA) alsoface the challenge of adopting and implementing thesignificant and complicated body of EU environmen-tal legislation. Consequently, inspectorates will berequested to ensure compliance with this legislation.
The next logical part of the publication is how toperform benchmarking in practice and how to devel-op ECE indicators to support benchmarking. The authors have attempted to start from concretehypothetical situations. Naturally, it is not possible togive examples with all types of benchmarking or toadvise on indicators for all types of organisations and situations.
This part also contains a practical tool for ratingcountry performance in regard to their reform inenforcement and compliance systems; transposition
and implementation of the IPPC Directive; and imple-mentation of the Recommendations for Minimum Cri-teria for Environmental Inspections (RMCEI). This rat-ing methodology was developed by the EAP TaskForce within OECD and kindly shared with theECENA Secretariat. However, the authors have adapt-ed the rating methodology to the needs and prioritiesof the SEE region. The assumption is that the IPPCDirective and the RMCEI principles are the two majorbenchmarks for reform of environmental permittingand enforcement systems. Therefore it would beworthwhile for countries to measure their progressusing these two benchmarks.
The following part is a regional overview ofprogress monitoring and benchmarking practices inSEE. The information in this part has been taken fromthe ECENA Peer Reviews conducted in 2005-2006, butalso from discussions and publications during otherECENA events such as ECENA exchange programmes,
Introduction
11G U I D E L I N E S O N P R O G R E S S M O N I T O R I N G A N D B E N C H M A R K I N G
BOX 1
ECENA is an informal network of environmentalauthorities from the pre-candidate and candidatecountries. Members of ECENA are the following coun-tries: Albania, Bosnia and Herzegovina, Croatia, theformer Yugoslav Republic of Macedonia, Republic ofSerbia, Republic of Montenegro, Turkey and Kosovoas defined by the United Nations Security Council Res-olution 1244 of June 10, 1999. The European Commis-sion is also a member of ECENA.
The ECENA mission is to protect the environment inits member countries through effective transposition,implementation and enforcement of EU environmen-tal legislation by increasing the effectiveness ofinspectorate bodies and promoting compliance withenvironmental requirements.
ECENA facilitates, assists and promotes the enforcementof regulations by disseminating information, finding com-mon denominators for cooperation and developing pro-jects of common interest with the countries participatingin the network. The members of ECENA work togetherto advance the application and implementation of envi-ronmental legislation and to increase the effectiveness ofenforcement agencies and inspectorates.

G U I D E L I N E S O N P R O G R E S S M O N I T O R I N G A N D B E N C H M A R K I N G 12
trainings and study tours. This chapter shows thatenvironmental institutions in the region are aware ofthe opportunities those tools present. However, it isclear from the overview that progress monitoring,benchmarking and indicator development practicesshould be strengthened further.
In Part V we have presented international exam-ples of benchmarking, progress monitoring and indi-cator use in order to bring closer the concept ofprogress monitoring and benchmarking to countriesin the region. Several examples are from non-EUdeveloping countries where practices do not differsignificantly from the SEE region. They provide aglobal perspective on the issue. Other examples arefrom leading Western European countries, wheresuch practices and tools are traditionally more devel-oped than in the SEE region.
Several major enforcement and compliance net-works have been mentioned as successful examplesof benchmarking in a network. We believe that net-works are major tools for ongoing benchmarking byproviding resources and a mechanism for exchangeof good practices.
The last part is dedicated to progress monitoring.The authors overview some theoretical issues andconcrete practices. Progress monitoring and evalua-tion tools used in the EU enlargement process and theOECD are emphasised. Some of the findings of thischapter are fed from the research done under othercomponents of the current World Bank-funded pro-ject on strengthening environmental institutions.
12 G U I D E L I N E S O N P R O G R E S S M O N I T O R I N G A N D B E N C H M A R K I N G

Part IBenchmarking: Key
Concepts and Definitions
G U I D E L I N E S O N P R O G R E S S M O N I T O R I N G A N D B E N C H M A R K I N G 1313G U I D E L I N E S O N P R O G R E S S M O N I T O R I N G A N D B E N C H M A R K I N G

G U I D E L I N E S O N P R O G R E S S M O N I T O R I N G A N D B E N C H M A R K I N G 14
G U I D E L I N E S O N P R O G R E S S M O N I T O R I N G A N D B E N C H M A R K I N G 15
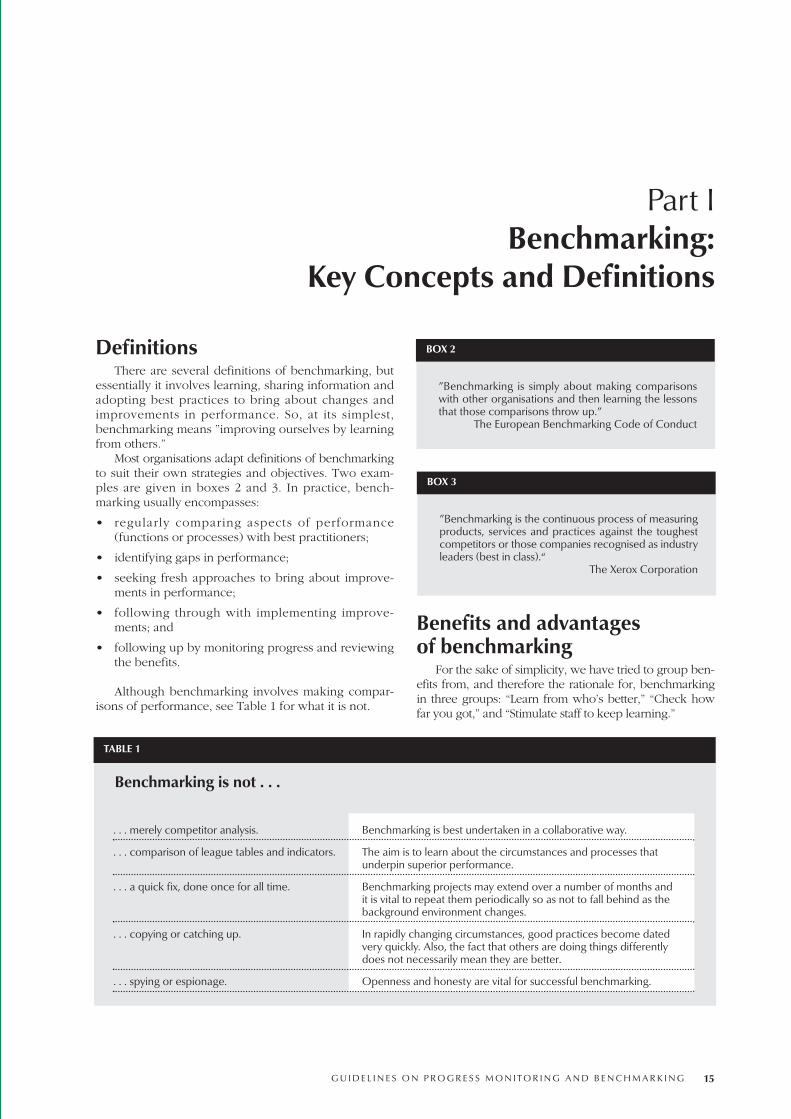
DefinitionsThere are several definitions of benchmarking, but
essentially it involves learning, sharing information andadopting best practices to bring about changes andimprovements in performance. So, at its simplest,benchmarking means ”improving ourselves by learningfrom others.”
Most organisations adapt definitions of benchmarkingto suit their own strategies and objectives. Two exam-ples are given in boxes 2 and 3. In practice, bench-marking usually encompasses:
• regularly comparing aspects of performance (functions or processes) with best practitioners;
• identifying gaps in performance;
• seeking fresh approaches to bring about improve-ments in performance;
• following through with implementing improve-ments; and
• following up by monitoring progress and reviewingthe benefits.
Although benchmarking involves making compar-isons of performance, see Table 1 for what it is not.
Benefits and advantages of benchmarking
For the sake of simplicity, we have tried to group ben-efits from, and therefore the rationale for, benchmarkingin three groups: “Learn from who’s better,” “Check howfar you got,” and “Stimulate staff to keep learning.”
Part IBenchmarking:
Key Concepts and Definitions
TABLE 1
. . . merely competitor analysis. Benchmarking is best undertaken in a collaborative way.
. . . comparison of league tables and indicators. The aim is to learn about the circumstances and processes that underpin superior performance.
. . . a quick fix, done once for all time. Benchmarking projects may extend over a number of months and it is vital to repeat them periodically so as not to fall behind as the background environment changes.
. . . copying or catching up. In rapidly changing circumstances, good practices become dated very quickly. Also, the fact that others are doing things differently does not necessarily mean they are better.
. . . spying or espionage. Openness and honesty are vital for successful benchmarking.
BOX 2
”Benchmarking is simply about making comparisonswith other organisations and then learning the lessonsthat those comparisons throw up.”
The European Benchmarking Code of Conduct
BOX 3
”Benchmarking is the continuous process of measuringproducts, services and practices against the toughestcompetitors or those companies recognised as industryleaders (best in class).“
The Xerox Corporation
Benchmarking is not . . .

’ PA R T I : K E Y C O N C E P T S A N D D E F I N I T I O N
Learn from who’s better Benchmarking will help you:
• identify examples of good practice from organisa-tions in the public and private sectors nationallyand internationally;
• learn from those who have achieved excellence insimilar fields;
• acquire greater confidence in developing and apply-ing new approaches;
• increase collaboration and understanding of the inter-actions within and between organisations;
• share knowledge and insight between organisationsabout overcoming common problems; and
• improve quality and productivity.1
Check how far you got Benchmarking will help you:
• improve how you measure performance;
• set appropriate performance measures and developrealistic targets for improvement;
• monitor progress in making improvements againstcutting edge organisations;
• bring about continuous improvements in policymaking and service delivery; and
• understand the big picture better and gain abroader perspective of the interplay of factors (orenablers) that facilitate the implementation ofgood practice.
Stimulate staff to keep learning Benchmarking will help you:
• encourage individual and organisational learning;
• develop a culture of continuous improvement and awillingness to learn from other organisations;
• introduce new ways of working and innovativesolutions;
• achieve greater involvement and motivation of staffin change programmes;
• increase willingness to share solutions to commonproblems and build consensus about what is neededto accommodate changes;
• introduce collaborative approaches that give rise tobetter outcomes;
• raise awareness of the relative strengths and weak-nesses of performance and greater openness; and
• stimulate competition between different units ofone organisation (in the case of internal perfor-mance benchmarking).
Types of benchmarkingBenchmarking is a versatile tool that can be
applied in a variety of ways to meet a range of require-ments for improvement.
Different terms are used to distinguish the variousways of applying benchmarking. The first word ineach term relates to either the type of partner or thepurpose for benchmarking. At the outset of bench-marking projects, it is vital to be clear on exactly whatis to be achieved through its use and apply an appro-priate methodology.
Benchmarking can be classified in many differentways depending on the following criteria:
• within or outside the organisation;
• within or outside the country;
• by whom it is initiated; and
• the scope of the benchmarking exercise.
The example given in Figure 1 describes bench-marking in terms of five dimensions. A typical bench-marking project should combine all those dimen-sions. These dimensions are not mutually exclusive;rather they link and overlap with one another.
Here we have tried to single out the most impor-tant types of benchmarking. You can find other clas-sifications of benchmarking in Annex 1.
BOX 4
“Benchmarking is the practice of being humbleenough to admit that someone else is better at some-thing and wise enough to try to learn how to match,and even surpass, them at it.”
American Productivity and Quality Center (APQC)
BOX 5
”Benchmarking is a performance measurement toolused in conjunction with improvement initiatives tomeasure comparative operating performance andidentify Best Practice.”
The Benchmarking Network
16 G U I D E L I N E S O N P R O G R E S S M O N I T O R I N G A N D B E N C H M A R K I N G

Strategic benchmarking is used when organisations seek to improve per-
formance by analysing the long-term strategies andapproaches that have enabled high-performers tosucceed. It involves considering high-level aspectssuch as core competencies, developing new services,changing the balance of activities, and improvingcapabilities for dealing with changes in the back-ground environment. The changes resulting from thistype of benchmarking may be difficult to implementand the benefits are likely to take a long time tomaterialise. Strategic benchmarking tries to answerfundamental questions for the organisation, its vision,policies, attitudes, relations, etc.
Performance benchmarking (also result-oriented) is used when organisations
consider their positions in relation to performancecharacteristics of key products and services. Bench-marking partners are selected from the same sector.
Process benchmarking is used when the focus is on improving specific crit-
ical processes and operations. Benchmarking partnersare sought from best practice organisations that per-form similar work or deliver similar services. Processbenchmarking invariably involves producing processmaps to facilitate comparison and analysis. This type ofbenchmarking can result in benefits in the short term.
In Annex 2 you can find some considerations asto when to use a certain type of benchmarking.
Benchmarking methodologyBenchmarking is a series of steps that the bench-
marking organisation should take. The goal is toselect a clear and concrete process, to find a suitablebenchmarking partner and to come up with bestpractice results which will be taken into considera-tion by the management.
There are certain differences between themethodology for process benchmarking and perfor-mance benchmarking, but they remain similar. Wewill describe them all at once for the sake of brevity.2
Select the process to be benchmarkedProcess benchmarking is most efficient when it
focuses on one process at a time. The chosen focusshould have significant potential for improvementand should be of high importance for the organisa-tion. An EEA report on environmental benchmarking
PA R T I : K E Y C O N C E P T S A N D D E F I N I T I O N
BOX 6
Benchmarking is a powerful management toolbecause it overcomes “paradigm blindness.” Paradigmblindness can be summed up as the mode of thinking,“The way we do it is the best because this is the waywe’ve always done it.” Benchmarking opens organisa-tions to new methods, ideas and tools to improve theireffectiveness. It helps crack through resistance tochange by demonstrating other methods of solvingproblems than the one currently employed, anddemonstrating that they work, because they are beingused by others.
FIGURE 1
Types of benchmarking
Micro-orientedbenchmarking
Macro-orientedbenchmarking
Benchmarkingaimed at
continuousimprovements
Evaluationbenchmarking
Internationalbenchmarking
Nationalbenchmarking
Top-downbenchmarking
Bottom-upbenchmarking
Result-orientedbenchmarking
Process-orientedbenchmarking
Source: The Danish Ministry of Finance (2000). Benchmarkingiden offentlige sector (Benchmarking in the public sector)
17G U I D E L I N E S O N P R O G R E S S M O N I T O R I N G A N D B E N C H M A R K I N G
BOX 7
Performance benchmarking is the collection of (gener-ally numerical) performance information and makingcomparisons with other compatible organisations.
BOX 8
Process benchmarking is the comparison of prac-tices, procedures and performance, with speciallyselected benchmarking partners, studying one busi-ness process at a time.

PA R T I : K E Y C O N C E P T S A N D D E F I N I T I O N
for local authorities suggests that the process shouldbe selected:
according to the impact of the process on thecompany’s critical success factors (CSF), on theimportance of the process for the main functionsof the company, and according to whether theprocess represents or impacts on obvious prob-lem areas in the organisation.
Form the benchmarking teamPartners are chosen only after undertaking a thor-
ough analysis of their own processes and/or perfor-mance. The process should be understood in terms ofparticipants, input, output, steps, etc. A detailed chartof the process should be drafted. The team shouldconsist of the most relevant person for a process(process owner) and one person close to the man-agement who will be able to take the final outcomesand recommendations to the managers and influencetheir implementation.
Establish performance measures for the process
Performance measures are needed to evaluatepresent levels of performance and compare them tobenchmarking partners. In environment this meanschoosing the right type and number of indicators.
Search benchmarking partnersBefore searching a suitable partner an organisa-
tion should develop a list of criteria. These caninclude location, business, structure, country of ori-gin and ensuing policy consequences, as well asorganisational culture. The benchmarking partnershould be objectively better at performing the chosenprocess to be benchmarked. Benchmarking partnerscan be sought within existing networks, professional contacts, etc.
When searching a benchmarking partner thewhole effort should be to find a best practice for the-selected process. According to the EEA:
The issue of choosing the right benchmarking part-ner can be crucial. Issues of comparability andadaptability have to be taken into considerationthoroughly when setting up the criteria for choos-ing a benchmarking partner(s).3
For example, some members of the ECENA net-work can be benchmarking partners to others. The
ECENA network also involves experts from IMPELcountries who often represent similar organisations inthe EU. These organisations can also become bench-marking partners.
Collect dataThe goal of this phase is to study the process/perfor-mance of the selected benchmarking partner. Thebenchmarking team can actually visit the partners’places of business. The analysis should include theassessment of all factors impacting the given process,both measurable and unquantifiable. For this phase,tools for collecting information should be selected.These can be interviews, questionnaires, or directobservations.
FIGURE 2
Steps in process/performance benchmarking
Choose process Form team
Establishperformance
measures
Selectpartner
Collectdata
Compareprocesses/
performances
Plan forchange
Managechange Repeat
Source: The Danish Ministry of Finance (2000). Benchmarkingiden offentlige sector (Benchmarking in the public sector)
18 G U I D E L I N E S O N P R O G R E S S M O N I T O R I N G A N D B E N C H M A R K I N G
BOX 9
The following aspects of the management of an environ-mental inspectorate (or any other environmental institu-tion) could be subject to strategic benchmarking:
• mission;
• vision;
• values;
• ways of preparing a strategy;
• prioritisation; and
• overall plans and action plans.

Compare process/performance byanalysing data
After the information is collected and processed acomparison should be made between the benchmark-ing partner and one’s own organisation. As a result,gaps should be identified in the performance level ofone’s own and partner’s process. Then, the teamshould analyse the causes of the gaps or methods andpractices that make it possible for the partners toachieve high performance levels.
Plan for change/manage change The findings of the analysis should be fed into the
management system of the organisation. They shouldbe understood and accepted by the management. Oth-erwise no impact will be achieved. Managementshould incorporate relevant recommendations andadapt them to the organisation’s own conditions.Improvement targets have to be set and their imple-mentation should be closely monitored.
BOX 10
The benchmarking process should:
• be meaningful and should have a high impact onthe clients;
• be highly visible;
• be resource-intensive;
• have a history of problems;
• have the opportunity to improve: it needs to havethe flexibility to be changed and not be significantlyconstrained by regulations, statutes, laws, and soforth; and
• support the mission, vision, and strategic directionof the organisation.
* Environmental Benchmarking for Local Authorities: From Concept toPractice, EEA, 2001
19G U I D E L I N E S O N P R O G R E S S M O N I T O R I N G A N D B E N C H M A R K I N G
PA R T I : K E Y C O N C E P T S A N D D E F I N I T I O N

G U I D E L I N E S O N P R O G R E S S M O N I T O R I N G A N D B E N C H M A R K I N G 20 G U I D E L I N E S O N P R O G R E S S M O N I T O R I N G A N D B E N C H M A R K I N G 20

Part IIEnvironmental Compliance
and Enforcement Indicators: Key Concepts and Definitions
“Not everything that is important can be measured . . .Not everything that can be measured is important.”
Albert Einstein
G U I D E L I N E S O N P R O G R E S S M O N I T O R I N G A N D B E N C H M A R K I N G 21G U I D E L I N E S O N P R O G R E S S M O N I T O R I N G A N D B E N C H M A R K I N G 21

G U I D E L I N E S O N P R O G R E S S M O N I T O R I N G A N D B E N C H M A R K I N G 22

G U I D E L I N E S O N P R O G R E S S M O N I T O R I N G A N D B E N C H M A R K I N G 23
IntroductionPublic officials, scientists, and analysts have effec-
tively used indicators to assess and report on pressuresto and the state of the environment. However, a clearneed has emerged for indicators of policy and regulato-ry responses to environmental problems, and in partic-ular those related to compliance assurance andenforcement.
Responding to this need, the International Net-work for Environmental Compliance and Enforcement(INECE) initiated a project to develop EnvironmentalCompliance and Enforcement Indicators at the WorldSummit on Sustainable Development in 2002 and sub-sequently formed an Expert Working Group on Envi-ronmental Compliance and Enforcement Indicators tocollaboratively identify and facilitate activities thatINECE could undertake to promote best practices fordeveloping and implementing programmes to mea-sure and manage the impacts of environmentalenforcement activities.
Since the launch of the project, INECE has workedwith partners — including the US Environmental Pro-tection Agency, Organisation for Economic Co-opera-tion and Development (OECD), the World Bank Insti-tute, the United Nations Environment Programme(UNEP), Costa Rica, Asia Environmental Complianceand Enforcement Network (AECEN), Argentinean NGOFundacion Ambiente y Recursos Naturales (FARN),Kenyan Wildlife Service, and Environment Canada —to derive best practices from country experiences indeveloping and implementing environmental compli-ance and enforcement indicators.
Based on this input, INECE and its Expert WorkingGroup developed a three-stage methodology andcapacity-building programmes on the process.Through the methodology, INECE is assisting coun-tries to better measure and manage its complianceand enforcement activities to more efficiently achievesustainable development goals through improvedenvironmental governance on national, regional andglobal scales.
Key conceptsIntroduction to environmental complianceand enforcement indicators
The word “indicator” is rooted in the Latin verbindicare, which means to indicate, make known, orpoint out. Most common definitions of “indicator”describe it as a person, thing, or device that mea-sures, records, or declares something. Indicators canbe thought of as pieces of information that provideevidence on matters of broader concern. Environ-mental compliance and enforcement indicators (alsoreferred to as ECE indicators) are instruments thatmeasure resources, activities and results achieved byenvironmental compliance and enforcement pro-grammes. This information helps decision makers toapply resources in a manner that maximises theeffectiveness and efficiency of those programmeswithin their reality of budgetary constraints.
Benefits of indicatorsBy identifying, designing, and using performance
indicators, senior officials can better evaluate andcommunicate how effectively environmental compli-ance and enforcement programmes respond to priori-ty environmental problems. Indicators can improve:
• control of programme operations;
• ability to set goals and adjust strategies;
• decision making for resource allocation;
• identification and correction of performanceissues;
• ability to motivate employees;
• accountability to legislative bodies, senior man-agement and the public;
• communications with the public; and
• efficiency and effectiveness of programmes.
Part IIEnvironmental Compliance and
Enforcement Indicators:Key Concepts and Definitions

Categories of indicatorsThere are four principal categories of indicators that
can be used in environmental compliance and enforce-ment programme assessment. The first two — input andoutput — describe an agency’s resources and activities.The second two — intermediate outcome and final out-come — describe the impacts of those efforts.
• Input indicators reflect the resources that governmentagencies contribute to a programme, including: time,staff, funding, and equipment.
• Output indicators reflect the agencies’ activities andwork products, including: number of inspections per-formed, number of compliance assistance workshopsprovided, and number of enforcement cases pursued.
• Intermediate outcome indicators reflect progresstoward a final outcome, such as a change in behav-iour or knowledge in the regulated community.
• Final outcome indicators measure the ultimate resultthe programme is designed to achieve, such as animprovement in ambient air quality or reduction inloss of biodiversity.
These types of indicators are often organised in alogic model, such as the one seen in Table 2, to graphi-cally depict the relationships between resources invested,activities undertaken, and the results of those activities.
Ideally, a logic model demonstrates a results chain,although even models that do not yield a perfect logi-cal chain can still highlight relationships. It is importantto note that for programme planning purposes, thelogic chain can be used from left to right — startingwith the available resources and measuring the impactthe applications of those resources have on achieving
environmental results — or from right to left — begin-ning with the ultimate environmental protection resulta programme is trying to achieve, and then trying todetermine the resources and activities necessary toachieve those results.
Classification according to function For more practical purposes, parameters can be
further characterised according to their function inthe relevant context, for example:
• budget parameters — e.g. time and money available;
• parameters characterising the inspection workload —e.g. number of sites that the inspectorate is obliged toinspect;
• inspection and inspection efficiency parameters —e.g. number of sites inspected;
• resource account parameters — e.g. resources spenton inspection work;
• qualification parameters — e.g. qualifications andcompetences available;
• inspection system parameters — e.g. internal routinesand mechanisms in the inspectorate;
• permitting or permitting efficiency parameters — e.g.number of permits issued, time utilised for permitting;
• decision parameters — e.g. number of decisionsappealed against or corrected;
• service parameters — e.g. handling time for prepar-ing a permit, stakeholders’ satisfaction; and
• inspection outcome parameters — in general, mea-surable environmental results to inspectorate work.4
TABLE 2
Logic model for environmental compliance and enforcement indicators
InputsResources
Number of staff (e.g. inspectors)Budget for salaries, contracts, computers, etc.Number of vehicles forinspectionTraining courses
OutputsActivities of the regulatingbody
Number of inspectionsconductedNumber of notices of violations issuedFines assessed and collectedNumber of training programmes conductedNumber of people trained
Intermediate outcomeBehavioural change in theregulated community
Pounds of pollutionreducedGreater understanding ofhow to complyImproved environmentalmanagement practicesIncreased levels of compliance
Final outcomeEnvironmental Impact
Improved ambient waterqualityReduced contaminantburden in wildlifeReduction levels of respiratory disease in a defined area
Source: Performance Measurement Guidance for Compliance and Enforcement Practitioners
24 G U I D E L I N E S O N P R O G R E S S M O N I T O R I N G A N D B E N C H M A R K I N G
PA R T I I : K E Y C O N C E P T S A N D D E F I N I T I O N S

FIGURE 3
ACCEPPTABLE*STATE OF
ENVIRONMENT
ACCEPPTABLEINDUSTRIAL
ENVIRONMENTALPERFORMANCE
INDUSTRY PURSUESPREVENTION/
CLEANER PRODUCTION
INDUSTRY IN COMPLIANCE WITH
LEGISLATION AND PERMITS
Environmental impactEmissions compared with
permits and legislationRisk assessment
Assessment of use of BAT
Water quality in streamAir quality, etc.
Low number of noncompliance incidents
detected; Industrial emissions within regional/
national limits
Preventive actionsplanned in enterprisesMoney set aside for
prevention
Prioritiesof inspectionaccording
to environmentalimpact and risk
High rate of identified
violations brought to compliance
Inspectionsaccording toinspectionmanual
Registering enterprises
Plans and frequencyrelated
to registration
Industryaware of CPpossibilities
BATAccounts
Inspectorsinform
efficientlyabout CP
Registering enterprises
Plans and frequencyrelated
to registration
Number of staff trained
Inspectors’ actual performance
Active and effective
enforcement
Adopted from the report Benchmarking on Quality Parameters for EnvironmentalInspectorates from an IMPEL Workshop in Copenhagen, September 2005.
Inspection and control objectives, outputs and indicatorsExample of a hierarchical structure where layers of goals and the associated parameters are connected to the next layersinto a total structure of goals and parameters
25G U I D E L I N E S O N P R O G R E S S M O N I T O R I N G A N D B E N C H M A R K I N G
PA R T I I : K E Y C O N C E P T S A N D D E F I N I T I O N S

G U I D E L I N E S O N P R O G R E S S M O N I T O R I N G A N D B E N C H M A R K I N G 26

Part IIIGetting Started: Benchmarkingand Environmental Compliance
and Enforcement Indicators
G U I D E L I N E S O N P R O G R E S S M O N I T O R I N G A N D B E N C H M A R K I N G 27

G U I D E L I N E S O N P R O G R E S S M O N I T O R I N G A N D B E N C H M A R K I N G 28

G U I D E L I N E S O N P R O G R E S S M O N I T O R I N G A N D B E N C H M A R K I N G 29
Benchmarking exercise: getting started
In this subchapter we will assume that an inspec-torate that is located in one of the ECENA countries isconvinced of the benefits of benchmarking andwould like to carry out different types of benchmark-ing exercises. As it is not possible to recreate theprocess of making all different kinds of benchmark-ing, we will only consider two major types: externalprocess benchmarking, and external performancebenchmarking. In this example we will speak of aninspectorate in an ECENA country in order to makethe examples concrete. However, the benchmarkingexercises are applicable to the same extent to themembers of other important enforcement and com-pliance networks — IMPEL, REPIN, and AECEN. Theyare also applicable to other environmental institu-tions apart from the inspectorates.
External process benchmarkingLet us imagine that an inspectorate from the
ECENA network is willing to compare its processeswith a good inspectorate from Western Europe.There are several conditions which, if complied with,increase the chances for a successful benchmarkingexercise:
• Support of senior management is needed toobtain the necessary resources, to guarantee otherstaff support and to ensure implementation of therecommendations.
• Clear objectives are needed to be very specific onwhat needs to be achieved and exactly whichprocess or aspect of work needs to be improved.
• Sufficient resources must be available to completethe project within the required timescale.
• Staff and other involved participants need to bekept informed about the goal of the benchmark-ing and its progress.
Provided that these conditions are in place, theinspectorate would have to take the following steps:
1) Define those parts of its processes thatneed to be compared. For example, thesecan be:
• the approach to inspections, philosophy, mis-sion/inspection strategy;
• the role of the inspection body;
• the drafting of an inspection plan; or
• the quality of the inspectors.
2) Select a responsible person
One person could be nominated within theinspectorate to be responsible for the benchmarkingexercise during a part of her/his time. This person’stime is one of the costs of the benchmarking. In thecurrent set-up of the ECENA member inspectorates, itwould be best to nominate a person from the centrallevel in the inspection department of the ministry ofenvironment. Such a person is best positioned to takethe findings of the benchmarking to the highest pos-sible management level, which increases the chancesof recommendations being implemented in practice.A person at the central level also has better access toall relevant information in all inspectorate unitsaround the country.
3) Analyse one’s own processes
Before starting an external benchmarking exer-cise, an organisation needs to analyse its ownprocesses to be compared with those of anotherinspectorate. From a practical point of view, it wouldbe highly relevant to use the Management ReferenceBook for Environmental Inspectorates for this pur-pose, which was developed in the framework of theIMPEL Network.
Part IIIGetting Started:
Benchmarking, ECE Indicators

Analysing one’s own work includes:
• finding all regulatory bases for a certain process(e.g. the inspection strategy would be a documentcontaining information about the inspectoratemission and the vision for its work);
• finding all internal formal and informal docu-ments defining how to do a certain process;
• interviewing people on a central level and headsof local inspectorates to see how a certain processis carried out in practice;
• developing flow-charts of processes and carryingout cause-and-effect analyses; and
• identifying gaps in the process that can be filledin or aspects of the process that can be improved.
4) Find an external partner
Finding an external partner is an important part ofthe benchmarking process for the obvious reasonthat the organisation’s own processes will be com-pared with the partner’s and eventually modifiedaccording to the results. The partner should be a sim-ilar organisation, i.e. an inspectorate with outstandingperformance and good processes.
Communication with the selected partner shouldtake place at a high level, as the partner will be askedto provide a large amount of information, which maybe of confidential nature at times. It is important toabide by rules of confidentiality laid down at the onset.In the case of the ECENA Network, there are represen-tatives from EU country inspectorates that are regularcontributors at ECENA events and who are familiarwith the problems of the inspectorates in the ECENAcountries. For the sake of our example, we will choosethe Brussels Inspectorate as the partner in the bench-marking exercise. Finally, the head of the inspectorateshould give his/her consent to the benchmarkingprocess and a contact person should be nominated.
5) Visit to the partner (optional)
Depending on the budget available for the proce-dure, a visit to the partner inspectorate can be organ-ised. This should be done after the partner’s processeshave been thoroughly analysed. A visit lends a firsthand impression of the working atmosphere at thepartner’s premises, but it is not obligatory.
6) Comparison of processes/aspects of work
Once a given process is analysed both at one’sown and the partner’s inspectorate, it is time to com-pare the processes.
Let us take as an example the process of compli-ance promotion, which is a common weakness ofinspectorates from South Eastern Europe. Analysis ofown practices may show that compliance promotionhappens rarely in the everyday work of the inspectors.It may reveal that compliance promotion is not includ-ed in any guiding document of the inspectorate, andwhere it does occur, it is often entirely due to theirgood will and personality. The analysis would alsoshow that there is a general tendency on the EU levelto increase the role and the profile of compliance pro-motion in the work of the inspectors.
On the other hand, the analysis of compliance pro-motion in the partner organisation may show that thispractice is highly respected; that it is included in theguidance for inspections; that it is a part of all trainings undergone by the inspectors; and, most importantly, that this is fundamental to inspec-tion work.
7) Draft a plan for change
Comparing a given process within two organisa-tions will lead to certain recommendations for theorganisation initiating the process benchmarking. Areport should be drafted that provides a series of rec-ommendations and related measures, either by anexternal consultant (if the budget allows) or by theperson in charge. In this particular case the recom-mendations may be of the following types:
1) Compliance promotion should be included in theguiding documents of the inspectorate. This prin-ciple should improve inspectors’ attitude towardscompanies and make them treat companies morelike partners rather than potential wrong-doers.
2) Whenever possible, trainings for inspectors shouldinclude a component on compliance promotion.
3) Whenever a new and complicated legislationenters into force, compliance promotion shouldbe made an obligatory part of inspectors’ visit.
BOX 11
“Since a voluntary approach can at times be just aseffective as binding measures, IBGE-BIM (The BrusselsInspectorate), in cooperation with other administra-tions and trade associations, created the voluntaryEco-dynamic company label. Its aim is to encouragecompanies and Brussels bodies to make a voluntarycommitment to improve gradually their environmentalperformance and to set up, also gradually, an environ-mental management system.”
Brussels Inspectorate website
30 G U I D E L I N E S O N P R O G R E S S M O N I T O R I N G A N D B E N C H M A R K I N G
PA R T I I I : B E N C H M A R K I N G , E C E I N D I C AT O R S

PA R T I I I : B E N C H M A R K I N G , E C E I N D I C AT O R S
4) Compliance promotion should be measured bythe number of mutually agreeable schedules andapproaches for achieving compliance.
8) Implement the measures
Once there is a set of recommendations comingfrom the comparison of the process, the goal of theresponsible person and the management of the inspec-torate should be to guarantee the implementation ofthe measures. For this person a decision should first bemade as to which of the recommended measures willbe implemented. As the situation in each country is dif-ferent and there are all kinds of limitations, it is notnecessary to implement all recommended measures.After the appropriate measures are selected, manage-ment should assign a responsible person, earmark thebudget if necessary and set deadlines.
External performance benchmarkingLet us assume that an inspectorate from the ECENA
network is willing to compare parts of its performancewith a very good inspectorate in an EU country or inanother part of the world. The inspectorate would haveto go through the following steps:
1) Select a number of performanceindicators.
To take the Danish example these can be:
• distribution of inspection efforts between enter-prise categories;
• resources used per complete inspection, distrib-uted among categories;
• education and training per inspectors;
• share of announced and unannounced inspectionvisits, per category; and
• enforcement actions per complete inspection, perman-year and for the three categories.
It is advisable to select several performance indica-tors that are thought to reflect to the highest extent pos-sible the quality and intensity of the inspectorate’swork. The selected indicators should have been mea-sured consistently for several years in the inspectoratewhich is to initiate the benchmarking. This is neededbecause the interpretation of a value of an indicator isnever as straightforward as one may want it to be. Bymeasuring and interpreting an indicator for severalyears an inspectorate develops a skill for “reading” theindicators in the right way.
31G U I D E L I N E S O N P R O G R E S S M O N I T O R I N G A N D B E N C H M A R K I N G
BOX 12
Finding criteria for analysing one’s own process of prioritisation of inspections inview of making external process benchmarking
What should an inspectorate analyse before starting the prioritisation of inspections?
• Current state of the environment (air quality, waste generation, fuel quality, water, etc.). A possible source would bethe annual state of the environment report.
• List of installations against which complaints have been filed in the previous year;
• List of installations with incidents/accidents;
• List of installations with environmental management systems (EMS);
• Data from previous inspections (recommendations from previous reports);
• Results from self monitoring;
• National objectives in policies;
• Location of installations;
• Legislative targets.
How should it be done?
• By including several stakeholders: the policy department within the ministry, other relevant ministries, regional andlocal level institutions, NGOs;
• Assure synchronisation with the budget planning process.
Example from the working group at the Benchmarking Workshop in Szentendre March 29-30, 2007

2) Select a responsible person
A person should be nominated within the inspec-torate to be responsible for the benchmarking exer-cise during a part of her/his time.
3) Self-analysis
Before starting an external benchmarking exer-cise, it is obligatory to analyse properly the organisa-tion’s own performance, which will be comparedwith another inspectorate.
Self-analysis should include:
• summarising the values and the interpretation ofthe selected indicators for the past several years;
• interviewing people on the central level andheads of local inspectorates to see how they inter-pret these specific indicators; and
• identifying performance areas where progress canbe achieved, based on practice and understandingof the selected indicators.
4) Find an external partner
Finding an external partner is an important part of thebenchmarking process because performance will becompared with the performance of the selected partner.The partner should be a similar organisation, that is, aninspectorate with outstanding performance, good refer-ences and excellent practical results.
The selected partner needs to have measured theindicators proposed for comparison for several yearsand to have developed an interpretative mechanismfor these indicators.
5) Comparison of performance
Once the given performance indicators have beenanalysed at both organisations, they have to be com-pared. Comparing indicators is a tricky task, as each inspectorate functions under specific conditionswhich are never identical. This is even the case within thesame country, making it important to select a suitableexternal partner operating in similar circumstances.
However, each comparison should be made whilethinking extensively about all hidden factors thatimpact the value of an indicator. If these factors aretaken into consideration, excessively high values maybe discounted and made more realistic, or excessivelylow values may be revaluated and made more reliable.
For example, if the indicator “number of inspec-tions per inspector” is compared, one should clearlypay attention to the quality of the inspections com-pared, the size of the installations inspected, theexperience of the inspectors, the number of installa-
tions of a given size in the region, etc. It is definitelynot true that the bigger the value of this indicator, thebetter the performance of a given inspectorate.
6) Draft a plan for change
Comparing the performance of two organisationswill lead to certain recommendations to the organisa-tion initiating the external performance benchmark-ing. A report should be drafted either by an externalconsultant (if the budget allows) or by the person incharge of listing the series of recommendations andrelated measures.
7) Implement the measures
In the case of external performance, benchmark-ing similar considerations is valid, as in the case ofexternal process benchmarking.
ECE indicators:getting started
Identifying, developing and using ECE indicatorsare skills needed to carry out performance bench-marking. The subchapter presents a step-by-steptutorial for the identification, design, and use of per-formance measurement indicators and concludes byprofiling selected recent country experiences. Thechapter is based on INECE’s Performance Measure-ment Guidance for Compliance and EnforcementPractitioners,5 Chapter 11 of Making Law Work: Envi-ronmental Compliance & Sustainable Development,6
and Michael Stahl’s article, “Using Indicators to LeadEnvironmental Compliance and Enforcement Pro-grams.”7 Additional resources, including a glossary,are provided in the annexes.
INECE’s Performance Measurement Guidance forCompliance and Enforcement Practitioners outlinesthree steps in developing an indicators programme:identification, design and use (see Figure 4). Howev-er, before starting a programme the project leadermust possess the necessary technical capacity andreceive a commitment from both management andstaff on the success of the programme. Often, organi-sations utilise consultants to assist in the develop-ment of a performance measurement programme.
Identifying indicatorsThe first step in developing a performance mea-
surement programme is to define clearly the scope ofpurpose of the effort. In the next step, the indicators
32 G U I D E L I N E S O N P R O G R E S S M O N I T O R I N G A N D B E N C H M A R K I N G
PA R T I I I : B E N C H M A R K I N G , E C E I N D I C AT O R S

team will generate a list of potential indicators beforediscussing the potential indicators with relevantstakeholders, applying agreed upon criteria, such asrelevance, feasibility, and functionality, and furtherrefine the list to meet the reporting requirements anddata constraints of the programme.
The practices discussed below are adapted fromINECE’s Performance Measurement Guidance forCompliance and Enforcement Practitioners. Asnoted in that document, it is important that thesepractices are recommended based on the experiencesof national environmental enforcement and compli-
33G U I D E L I N E S O N P R O G R E S S M O N I T O R I N G A N D B E N C H M A R K I N G
PA R T I I I : B E N C H M A R K I N G , E C E I N D I C AT O R S
FIGURE 4
Three-stage model for identifying, designing, and using indicators
STAGE 1IDENTIFYING
POTENTIAL INDICATORS
STAGE 2DESIGNINGINDICATORS
STAGE 3USING
INDICATORS
Best practices Best practices Best practices
Determine scope
Consult withstakeholders and staff
Apply logic model
Develop guidingprinciples
Develop common definitionsfor key terms
Select criteria forevaluating indicators
Inventory existing datasources
Look beyond existingdata
Select appropriatecombination of indicators
Use internal teams todetermine how to design
Conduct pilot projects
Developin phases
Consultwith experts
Monitor designand testing
Create and distributedevelopment plan
Ensure timely andaccurate reporting
Monitor performancewith regular reports
Analyse performance oforganisational units
Review effectivenessof specific programmes
Report to externalaudiences
Analyse behindthe numbers
Assess and adaptindicators
Source: Performance Measurement Guidance for Compliance and Enforcement Practitioners

ance programmes from around the world. However,they may need to be adapted or used selectivelydepending on the specific situation of the pro-gramme under development.
Define the scope of the indicators programme
A fundamental issue that needs to be resolved atthe beginning of any effort to develop indicators is toclearly define the scope of the effort. Two questionsneed to be answered to determine the scope (alsosee Table 3):
• Will the indicators be comprehensive (that is,will they cover all the legal and regulatory frame-works and programmes for which the agency isresponsible) or focused (covering only a specificlaw or requirement, industry sector, or non-com-pliance pattern)?
• Will the indicators be national (that is, covering thenational compliance and enforcement programme)or sub-national (covering a programme at theregional/district, state or local/ municipal level)?
Establish definitions for types of indicators
The importance of having a clear set of definitionsat the beginning of any effort to develop indicatorscannot be overstated. Defining key terms that will beused in discussions with stakeholders provides aframework for organising ideas, and allows agency
managers and external stakeholders to see howpotential indicators might be used to improve man-agement of the programme. Definitions may need tobe developed, particularly to specifically define theterms to describe the theme and/or geographic scopeof the project.
Conduct meetings with externalstakeholders and internal staff
Because the target audience for ECE indicators isdiverse and comprises a multitude of perspectives, con-sultation with numerous stakeholder groups is key tosuccess in identifying, designing, and using indicators.Early engagement with the users — both internal to theorganisation as well as external groups — will provideinvaluable information to help define the scope of mea-sures and priority information needs.
Create a “map” of activities and results,perhaps using a logic model
A logic model can be a useful tool for identifyingcompliance and enforcement indicators. Logic mod-els graphically depict the relationships betweenresources invested, activities undertaken and theresults of those activities. It should clearly demon-strate a chain of results from activities to outcomes,and serve as a “road map” of how the programmewill achieve its goals.
34 G U I D E L I N E S O N P R O G R E S S M O N I T O R I N G A N D B E N C H M A R K I N G
PA R T I I I : B E N C H M A R K I N G , E C E I N D I C AT O R S
TABLE 3
Defining the scope of an indicators programme
Adapted from Stahl, Performance Indicators for Environmental Compliance and Enforcement Programmes, Prsentation to AECEN, June 2006
National
Subnational
Comprehensive
Use: Assess effectiveness, improve managementof overall national programme
Example: System of output and outcome indica-tors to describe performance of a whole nationalprogramme
Use: Assess effectiveness, improve managementof a overall regional, provincial/state orlocal/municipal programme
Example: System of output and outcome indica-tors to describe performance of provincial com-pliance and enforcement programme
Focused
Use: Assess effectiveness, improve manage-ment of a national initiative focused on a spe-cific problem
Example: Set of indicators showing whethercompliance has improved in a national industrysector (e.g. petroleum refining)
Use: Assess effectiveness, improve manage-ment of an initiative focused on a specificproblem at the regional, provincial/state, orlocal/municipal level
Example: Set of indicators showing whethercompliance has improved in a provincial indus-try sector (e.g. building construction)

Inventory existing data sourcesA key step for identifying environmental compliance
and enforcement indicators is to assess the existing dataavailable to support indicators. Table 4 provides a tem-plate for describing each indicator and creating a recordof what types of data could be used to support it andwhether that data is currently available.
Agree upon selection criteriaOnce a list of potential indicators has been identified,
the project team selects the indicators for further devel-opment in accordance with selection criteria agreedupon in advance. The following are some suggestedselection criteria the project may like to consider:
• Relevance — Is it relevant to the goals, objectives,and priorities of the agency and to the needs ofexternal stakeholders?
• Transparency — Does it promote under-standing and enlighten users about programme performance?
• Credibility — Is it based on data that is completeand accurate?
• Functionality — Does it encourage programmesand personnel to engage in effective and con-structive behaviour and activities?
• Feasibility — Does the cost of implementing andmaintaining a measure outweigh its value to theprogramme?
• Comprehensiveness — Does it addresses all ofthe important operational aspects of programmeperformance?
TABLE 4
Worksheet for identifying and selecting environmental compliance and enforcement indicators
*scale of 1-3, where 1 is adequate
Name
Name of indicator
Type
e.g. input,output
Category/subcategory
If appropriate to illustratehow the indicator fits into specific project’s hierarchy
Currently measured
Yes/no
Data availability
Rank on scale of 1-3,where 1 is adequate
A. Indicator summary
B. Indicator descriptionBriefly present an objective description of what the indicator is and how the data should be collected.
C. Reason for selection Discuss what the indicator might show and the basis for this assumption.
D. LimitationsExplain any limitations to measuring this indicator.
E. Data sourcesList necessary information and note whether data is currently available.
F. ReferencesList any references that may be useful when measuring this indicator, including examples from other countries, researchdocuments, etc.
G. Selection criteria *
Relevant Transparent Credible Fuctional Feasible Comprehensive
35G U I D E L I N E S O N P R O G R E S S M O N I T O R I N G A N D B E N C H M A R K I N G
PA R T I I I : B E N C H M A R K I N G , E C E I N D I C AT O R S
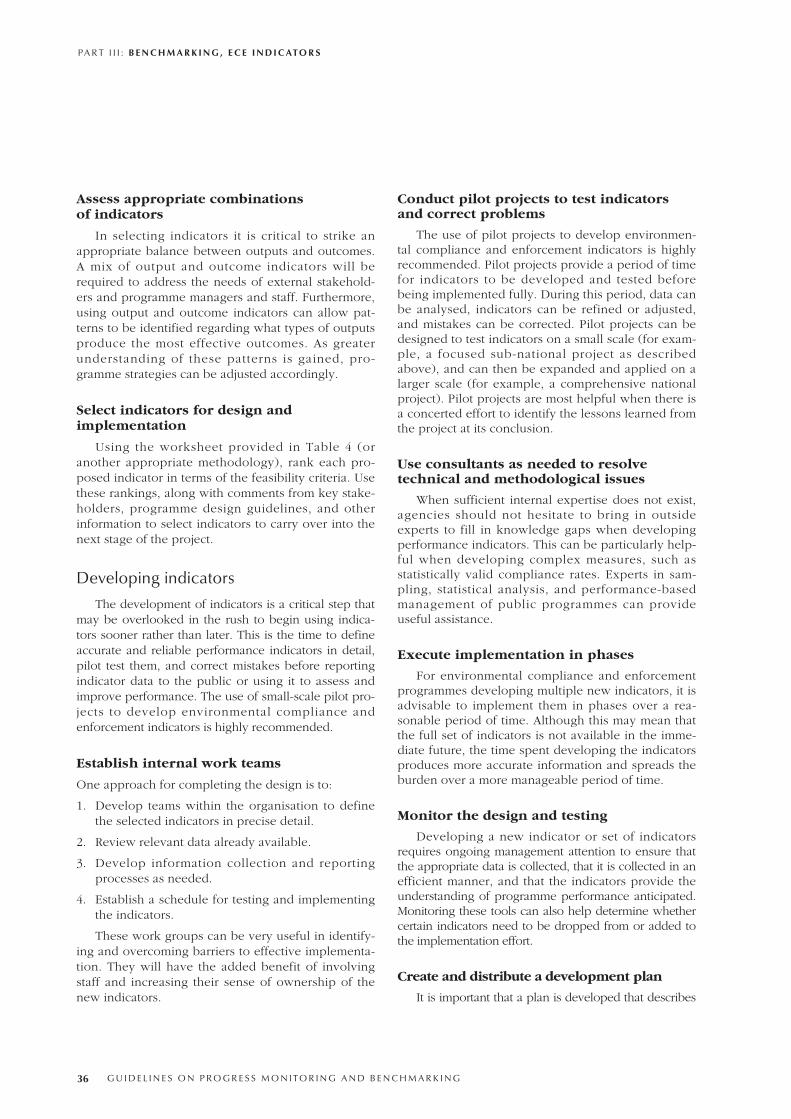
Assess appropriate combinations of indicators
In selecting indicators it is critical to strike anappropriate balance between outputs and outcomes.A mix of output and outcome indicators will berequired to address the needs of external stakehold-ers and programme managers and staff. Furthermore,using output and outcome indicators can allow pat-terns to be identified regarding what types of outputsproduce the most effective outcomes. As greaterunderstanding of these patterns is gained, pro-gramme strategies can be adjusted accordingly.
Select indicators for design andimplementation
Using the worksheet provided in Table 4 (oranother appropriate methodology), rank each pro-posed indicator in terms of the feasibility criteria. Usethese rankings, along with comments from key stake-holders, programme design guidelines, and otherinformation to select indicators to carry over into thenext stage of the project.
Developing indicatorsThe development of indicators is a critical step that
may be overlooked in the rush to begin using indica-tors sooner rather than later. This is the time to defineaccurate and reliable performance indicators in detail,pilot test them, and correct mistakes before reportingindicator data to the public or using it to assess andimprove performance. The use of small-scale pilot pro-jects to develop environmental compliance andenforcement indicators is highly recommended.
Establish internal work teams
One approach for completing the design is to:
1. Develop teams within the organisation to definethe selected indicators in precise detail.
2. Review relevant data already available.
3. Develop information collection and reportingprocesses as needed.
4. Establish a schedule for testing and implementingthe indicators.
These work groups can be very useful in identify-ing and overcoming barriers to effective implementa-tion. They will have the added benefit of involvingstaff and increasing their sense of ownership of thenew indicators.
Conduct pilot projects to test indicatorsand correct problems
The use of pilot projects to develop environmen-tal compliance and enforcement indicators is highlyrecommended. Pilot projects provide a period of timefor indicators to be developed and tested beforebeing implemented fully. During this period, data canbe analysed, indicators can be refined or adjusted,and mistakes can be corrected. Pilot projects can bedesigned to test indicators on a small scale (for exam-ple, a focused sub-national project as describedabove), and can then be expanded and applied on alarger scale (for example, a comprehensive nationalproject). Pilot projects are most helpful when there isa concerted effort to identify the lessons learned fromthe project at its conclusion.
Use consultants as needed to resolvetechnical and methodological issues
When sufficient internal expertise does not exist,agencies should not hesitate to bring in outsideexperts to fill in knowledge gaps when developingperformance indicators. This can be particularly help-ful when developing complex measures, such as statistically valid compliance rates. Experts in sam-pling, statistical analysis, and performance-basedmanagement of public programmes can provide useful assistance.
Execute implementation in phases
For environmental compliance and enforcementprogrammes developing multiple new indicators, it isadvisable to implement them in phases over a rea-sonable period of time. Although this may mean thatthe full set of indicators is not available in the imme-diate future, the time spent developing the indicatorsproduces more accurate information and spreads theburden over a more manageable period of time.
Monitor the design and testing
Developing a new indicator or set of indicatorsrequires ongoing management attention to ensure thatthe appropriate data is collected, that it is collected in anefficient manner, and that the indicators provide theunderstanding of programme performance anticipated.Monitoring these tools can also help determine whethercertain indicators need to be dropped from or added tothe implementation effort.
Create and distribute a development plan
It is important that a plan is developed that describes
36 G U I D E L I N E S O N P R O G R E S S M O N I T O R I N G A N D B E N C H M A R K I N G
PA R T I I I : B E N C H M A R K I N G , E C E I N D I C AT O R S

the tasks to be completed to implement new indicators,and provides a schedule of deadlines for completion ofthe tasks. The plan should also clearly spell out the usesfor the new indicators. The plan should be disseminatedto programme managers and staff, and to external stake-holders as appropriate.
Ensure timely and accurate reporting
Reporting of data, especially data to support newindicators, by internal or external parties will need to bereinforced through multiple communication mecha-nisms on an ongoing basis. Steps will also need to betaken to ensure the quality of the data (e.g. random dataaudits, sampling and verification of specific data fields)through a continuous programme of quality control.One of the most effective ways of ensuring timely andaccurate reporting is for senior managers to demon-strate that they are using indicators to make decisionsabout programme strategy and resource allocation.
Using indicatorsIndicators may be used for many purposes to
improve the effectiveness of compliance and enforce-ment programmes. Uses may relate to improved man-agement and allocation of resources, while othersrelate to enhanced communication with the public, leg-islative bodies, and other institutions. Guidance onusing indicators is provided in this section.
Monitor performance through regular reports
A monthly or quarterly report on performanceindicators can be provided to programme managersand staff. These reports can provide a current accountof performance in producing key outputs and out-comes. Such reports can be organised to break outdata for a programme as a whole, or for various pro-gramme components. In addition to data about per-formance indicators for the current year, the reportsshould also provide data about performance in thepreviously completed fiscal/calendar year to providea benchmark.
Review performance of organisational units
Data from indicators can be organised to provide acurrent report of performance by a particular organisa-tional unit, such as a regional or provincial office of anational agency. These reports could contain dataabout performance in the current fiscal/calendar year,three-year trends on key outputs and outcomes, andcomparisons to performance of other regional offices.Such reports can lead to identification of specific pro-
gramme management and performance issues thatmight need to be addressed by managers of the organi-sational unit.
Evaluate effectiveness of specific programmes
Data from indicators can be used to review the effec-tiveness of particular programmes (e.g. compliance withclean water laws or requirements). Studies of the effec-tiveness of specific programmes could be organisedaround six performance-based questions that provide aframework for analysis. The six questions are:
1. Is the programme contributing to the goal of protect-ing human health and the environment through itsactions and strategies?
2. Is the programme changing the behaviour of the reg-ulated community in ways that lead to improvedenvironmental performance?
3. Is the programme achieving appropriate levels ofcompliance in key populations?
4. Are we achieving the appropriate levels of enforce-ment activity in the regulated community?
5. Is the programme providing appropriate assistance toour state, provincial, and local partners to supportthem in contributing to improving environmental per-formance?
6. Are resources being used efficiently to achieve opti-mal results?
Analyse behind the numbers
When using indicators to improve performance,programme managers and staff should understand thatdata from indicators has inherent limitations. A numberthat provides the amount of an output or outcome pro-duced does not tell programme personnel all they needto know about that output or outcome. Such numbersneed a context (e.g. a time period, a benchmark orstandard for comparison, etc.) to realise their full valueas a management tool. In many instances, data fromindicators provide a kind of warning light that signals aneed for deeper analysis or further investigation tounderstand the forces and influences that shape pro-gramme performance.
Report to external audiences
Many environmental agencies provide reports to thepublic in response to laws or policies requiring suchreports. For environmental compliance and enforcementprogrammes, performance indicators can provide valu-able information to the public, legislative overseers, regu-lated industries, and environmental organisations. Such
37G U I D E L I N E S O N P R O G R E S S M O N I T O R I N G A N D B E N C H M A R K I N G
PA R T I I I : B E N C H M A R K I N G , E C E I N D I C AT O R S

programmes can be well served by providing an annualreport to external audiences. By describing accomplish-ments in terms that emphasise results — kilograms ofpollution reduced through enforcement actions,improved practices at facilities from compliance assis-tance, improved rates of compliance in an industry sector— an account of performance is provided that is mean-ingful to multiple audiences.
Assess and adapt indicators
After indicators have been implemented and arebeing used, programme managers and staff should beprepared to solicit, compile, and act on feedback aboutthe indicators. This can be done immediately afterimplementation and on a continuous basis, or as astructured review after a suitable period (perhaps oneto three years) of actually using the indicators. Theassessment of indicators should involve stakeholderswho can comment on the indicators as a device forexplaining programme activities and results to the pub-lic; policy makers who may influence the level of bud-getary resources for the agency; and programme man-agers and staff who have actually used the indicators asa management tool for directing and improving theperformance of a programme.
Country permitting system,IPPC transposition andimplementation, RMCEIimplementation: a ratingmethodology
The rating methodology was developed by the EAPTask Force at the Organisation for Economic Co-opera-tion and Development (OECD) for the use of the mem-bers of the Regulatory Environmental Programme Imple-mentation Network (REPIN). The methodology has beenadapted by the REC to the needs of the ECENA countriesusing the European Commission’s IPPC Directive andRMCEI as benchmarks. The transposition and imple-mentation of the IPPC Directive and RMCEI are currentlythe most important and challenging goals of the transfor-mation of the national permitting and inspection sys-tems. Significant capacity building support has been pro-vided to the ECENA member countries within the frame-work of the ECENA Multi-annual Work Programmes. Inour understanding, it is of extreme significance to thecountries to measure their progress in IPPC and RMCEItransposition and implementation.
Aim and scope of the rating exercise
All ECENA member countries have embarked onreforming their enforcement and compliance systems.This includes mainly the adoption of integrating per-mitting through the transposition of the IPPC Directiveas well as incorporating the RMCEI into relevantnational regulations or guidance documents. Thisshould be accompanied by relevant institutional andhuman resource strengthening of inspectorates.
Inspired by the EAP Task Force rating methodolo-gy for EECCA countries, the ECENA Secretariat devel-oped a simple and easy-to-implement progress evalu-ation system that allows practitioners, policy makersand inspection managers to evaluate progress and settargets. The IPPC Directive and RMCEI stand out asthe most important and relevant benchmarks forinspectorates.
The assessment criteria are grouped to reflect thethree main elements of reforming the ECENA mem-ber states’ enforcement and compliance systems:
• country permitting system in general (13 criteria);
• IPPC Transposition and Implementation (seven crite-ria); and
• RMCEI implementation (14 criteria).
Benefits
According to the EAP Task Force experts, the rat-ing scheme offers the benefits of having a numericaland visual presentation of otherwise largely descrip-tive information. The ratings represent the attainmentof specific milestones that can, over time, showtrends in progress. As any rating scheme, it contains adegree of subjectivity which can be softened if theassessment involves as many experts and stakehold-ers as possible. The rating can even be beneficial if itis carried out as an honest assessment of achieve-ments by one institution.
Description of the rating scheme
The rating scheme uses 31 individual and threecomposite criteria (see Table 5). The overall perfor-mance may reach a rating of up to 170, which isobtained by summing up the ratings for all individualqualitative criteria. There are 13 individual criteria forcountry permitting system status, seven for IPPC Direc-tive transposition and implementation, and 14 forRMCEI implementation. Each criterion can be attributeda rating on a scale of 0 to 5 points, where 0 representsthe failure to meet the lowest goalpost, and 5 representsthe highest possible performance under a concrete cri-terion. Each composite criterion is an arithmetical
38 G U I D E L I N E S O N P R O G R E S S M O N I T O R I N G A N D B E N C H M A R K I N G
PA R T I I I : B E N C H M A R K I N G , E C E I N D I C AT O R S

PA R T I I I : B E N C H M A R K I N G , E C E I N D I C AT O R S
G U I D E L I N E S O N P R O G R E S S M O N I T O R I N G A N D B E N C H M A R K I N G 39
average of ratings (on the scale of 0 to 5) for individualcriteria under a given category. Wherever the perfor-mance under a specific criterion cannot be brokendown in five separate levels, fewer levels are available.
Rating results
Table 5 presents the results of the rating exercisethat was conducted by the EAP Task Force Secretariat.These results are reflected graphically in Part 1 of themain report, showing regional averages for some com-posite criteria and giving the rating of each country forthe three main dimensions of the rating exercise.
Using the rating methodology: next steps.
The potential use of the rating methodology wasdiscussed with ECENA Countries at the workshop onbenchmarking which took place in Szentendre onMarch 29-30, 2007. Countries expressed their willing-ness to use the methodology and perform an annual rat-ing exercise facilitated by the ECENA Secretariat. It hasbeen agreed that the most logical forum to present theresults would be the annual ECENA plenary meetings.
Suggestions were also made to include severaladditional criteria. Calibration of the criteria bench-marks will be done in the future. It is up to the coun-tries to involve or not other stakeholders in the ratingexercise. There are criteria where it would be suitableto involve the regulated community in assessing theprogress of the inspectorate.
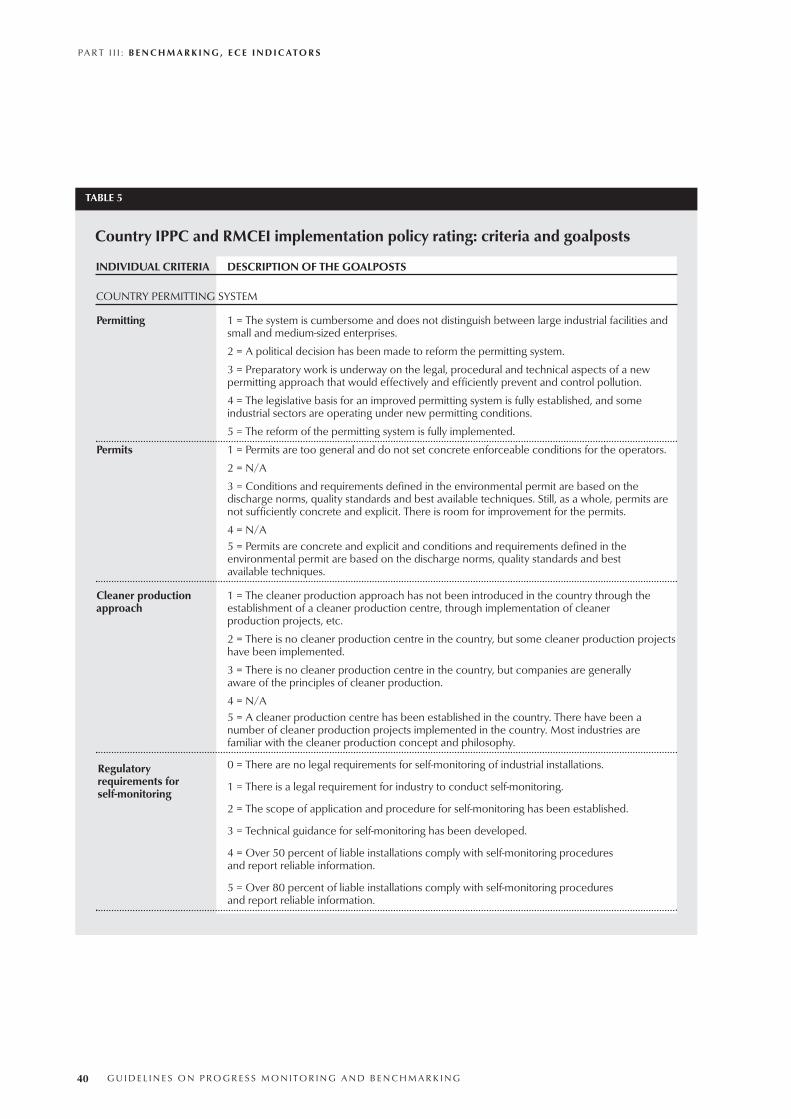
PA R T I I I : B E N C H M A R K I N G , E C E I N D I C AT O R S
G U I D E L I N E S O N P R O G R E S S M O N I T O R I N G A N D B E N C H M A R K I N G 40
TABLE 5
INDIVIDUAL CRITERIA DESCRIPTION OF THE GOALPOSTS
COUNTRY PERMITTING SYSTEM
Permitting 1 = The system is cumbersome and does not distinguish between large industrial facilities and small and medium-sized enterprises.
2 = A political decision has been made to reform the permitting system.
3 = Preparatory work is underway on the legal, procedural and technical aspects of a new permitting approach that would effectively and efficiently prevent and control pollution.
4 = The legislative basis for an improved permitting system is fully established, and some industrial sectors are operating under new permitting conditions.
5 = The reform of the permitting system is fully implemented.
Permits 1 = Permits are too general and do not set concrete enforceable conditions for the operators.
2 = N/A
3 = Conditions and requirements defined in the environmental permit are based on the discharge norms, quality standards and best available techniques. Still, as a whole, permits are not sufficiently concrete and explicit. There is room for improvement for the permits.
4 = N/A5 = Permits are concrete and explicit and conditions and requirements defined in the environmental permit are based on the discharge norms, quality standards and best available techniques.
Cleaner production 1 = The cleaner production approach has not been introduced in the country through the approach establishment of a cleaner production centre, through implementation of cleaner
production projects, etc.
2 = There is no cleaner production centre in the country, but some cleaner production projectshave been implemented.
3 = There is no cleaner production centre in the country, but companies are generally aware of the principles of cleaner production.
4 = N/A5 = A cleaner production centre has been established in the country. There have been a number of cleaner production projects implemented in the country. Most industries are familiar with the cleaner production concept and philosophy.
0 = There are no legal requirements for self-monitoring of industrial installations.
1 = There is a legal requirement for industry to conduct self-monitoring.
2 = The scope of application and procedure for self-monitoring has been established.
3 = Technical guidance for self-monitoring has been developed.
4 = Over 50 percent of liable installations comply with self-monitoring procedures and report reliable information.
5 = Over 80 percent of liable installations comply with self-monitoring procedures and report reliable information.
Country IPPC and RMCEI implementation policy rating: criteria and goalposts
Regulatoryrequirements for self-monitoring

PA R T I I I : B E N C H M A R K I N G , E C E I N D I C AT O R S
G U I D E L I N E S O N P R O G R E S S M O N I T O R I N G A N D B E N C H M A R K I N G 41
TABLE 5 (continued)
INDIVIDUAL CRITERIA DESCRIPTION OF THE GOALPOSTS
COUNTRY PERMITTING SYSTEM
1 = There are only sharp inspection tools, such as possibilities for inspectors to close a plant or immediately punish the industries by imposing fines. Fines are not proportionate or dissuasive.
2 = There are only sharp inspection tools, such as possibilities for inspectors to close a plant or immediately punish the industries by imposing fines. Fines are proportionate and dissuasive.
3 = There are possibilities for the inspectors to prescribe specified measure or actions to be taken by an operator before imposing fines. Fines are proportionate and dissuasive.
4 = N/A5 = There is a possibility for dialogue between the operator and the authorities on how and when a problem could be solved. Economic and technical factors can be taken into consideration. The inspectors have an explicit legal possibility to request additional informationor a reasonable plan from an operator, before taking a decision on what is needed to stop a violation of permit conditions. When there is a need to impose fines they are proportionate and dissuasive.
1 = Environmental legislation is widely available through public sources.
2 = Some basic compliance assistance is provided by environmental authorities directly or by sub-contracted agencies.
3 = Regular compliance assistance programmes (training, dissemination of good practices, education through mass media, etc.) exist.
4 = Compliance assistance is tailored to different groups of the regulated community.5 = Information-based instruments (compliance rating schemes, pollution release and transfer registers, eco-labels, etc.) are used to promote compliance.
0 = There is no register of polluting installations whatsoever.
1 = N/A
2 = There are plans and projects to make a register of polluting installations.
3 = There is an imprecise and incomplete register of polluting installations.
4 = N/A5 = There is a good, complete and regularly updated register of polluting installations.
1 = A hierarchy of sanctions for environmental violations (covering all media) is stipulated in the legislation.
2 = Sanctioning policies are well articulated, clear, proportionate, fair, consistent and transparent.
3 = Courts have sufficient capacity to deal with environmental cases.
4 = Sanctions are enforced in a timely manner.
5 = Sanctions are effective in serving as a deterrent against repeated violations and violations by others in the regulated community.
Country IPPC and RMCEI implementation policy rating (continued)
Register of pollutioninstallations
Non-complianceresponse
Relations betweeninspectors andregulatedinstallations
Complianceassistance andpromotion

PA R T I I I : B E N C H M A R K I N G , E C E I N D I C AT O R S
G U I D E L I N E S O N P R O G R E S S M O N I T O R I N G A N D B E N C H M A R K I N G 42
TABLE 5 (continued)
INDIVIDUAL CRITERIA DESCRIPTION OF THE GOALPOSTS
COUNTRY PERMITTING SYSTEM
Cooperation 1 = There is coordination of actions among all departments of the environmental authorities arrangements and proper internal communication, horizontally and vertically.
2 = A mechanism for sharing information with other relevant organisations exists.
3 = Arrangements exist to avoid duplication and overlap of functions, including formal agreements of cooperation.
4 =Actions are coordinated where more than one organisation is involved in environmental policy development and implementation.5 = Actions are executed jointly with other authorities.
Human resources 1 = Human resource capacities are not proportionate to the tasks. Efficiency is low. There is no strategy for the development and improvement of human resources. There are no minimum requirements for qualifications. There are no open competitions.
2 = Human resource capacities are not proportionate to the tasks. However, a strategy has been drafted for the development and improvement of human resources starting from the central level and going to the local level.
3 = Human resource capacities are high on the central level. There is much room for improvement on the local level. There is a strategy for how to bridge the gap that is being carried out.
4 = Human resources are mostly commensurate with the tasks and efficiency is high. There is a clear strategy for human resource management and development. There are minimum educational and experience criteria for employees. However, employees are relatively low paid and there are incentives for work migration to higher paid jobs.5 = Human resources are commensurate with the tasks and efficiency is high. There is a clear strategy for human resource management and development. There are minimum educational and experience criteria for employees. Employees are well remunerated and there is no immediate motivation for work migration.
Equipment 1 = Inspectors are poorly equipped with PC, cars, monitoring equipment, etc. They are rarely connected to Internet. The lack of equipment is a serious hurdle to implementing inspectors’obligations.
2 = Equipment is of good quality only on the central level, while regional inspectorates are poorly equipped in general. New needs and equipment updates are not properly reflected in the budget or the budgeting process.
3 = Inspectors have an average level of equipment at their disposal, which allows them to perform their tasks. However, many improvements are possible.
4 = N/A
5 = Both central and regional level are properly equipped with PC, cars, and monitoring equipment allowing them to perform their tasks properly. Replacing and updating of equipment is done on a regular basis, and the budget provides for that.
Country IPPC and RMCEI implementation policy rating (continued)

PA R T I I I : B E N C H M A R K I N G , E C E I N D I C AT O R S
G U I D E L I N E S O N P R O G R E S S M O N I T O R I N G A N D B E N C H M A R K I N G 43
TABLE 5 (continued)
INDIVIDUAL CRITERIA DESCRIPTION OF THE GOALPOSTS
COUNTRY PERMITTING SYSTEM
Communication 1 = The institution does not have a communication strategy. Communication is poor both strategies internally, within the inspectorate and externally — towards the other stakeholders and the public.
2 = Formally there is a communication strategy, but in reality internal and external communication remains poor.
3 = There is a communication strategy. Internal communication is sufficiently good but external communication is still poor.
4 = N/A
5 = There is a communication strategy that is implemented and updated. There are internal communication processes and channels and they are functioning satisfactorily. External communication is good towards major stakeholders, the press and the regulated communities.Processes channels exist for bilateral communication.
Budget planning 1 = Budget planning is poor and available funds do not correspond to the actual needs of the inspectorate.
2 = N/A
3 = There is a process of budget planning and all needs and tasks are incorporated in it. However, the actual budget is insufficient and does not fully correspond to the actual needs and tasks.
4 = N/A
5 = Budget planning is a sufficiently good and timely process that takes into consideration all upcoming needs, tasks and obligations. Funds are allocated properly.
IPPC TRANSPOSITION AND IMPLEMENTATION
IPPC transposition 1 = IPPC law has not been adopted and there are no plans or strategy for switching to integrated permitting or drafting an IPPC law.
2 = IPPC law has not been adopted, but there is a timetable for drafting the law and the bylaws and starting the implementation.
3 = IPPC law has been adopted, but bylaws are delayed and implementation has not started yet.
4 = IPPC law and bylaws have been adopted but laws and bylaws have serious deficiencies which may obstruct proper implementation.
5 = IPPC law has been adopted and is being implemented smoothly.
Country IPPC and RMCEI implementation policy rating (continued)
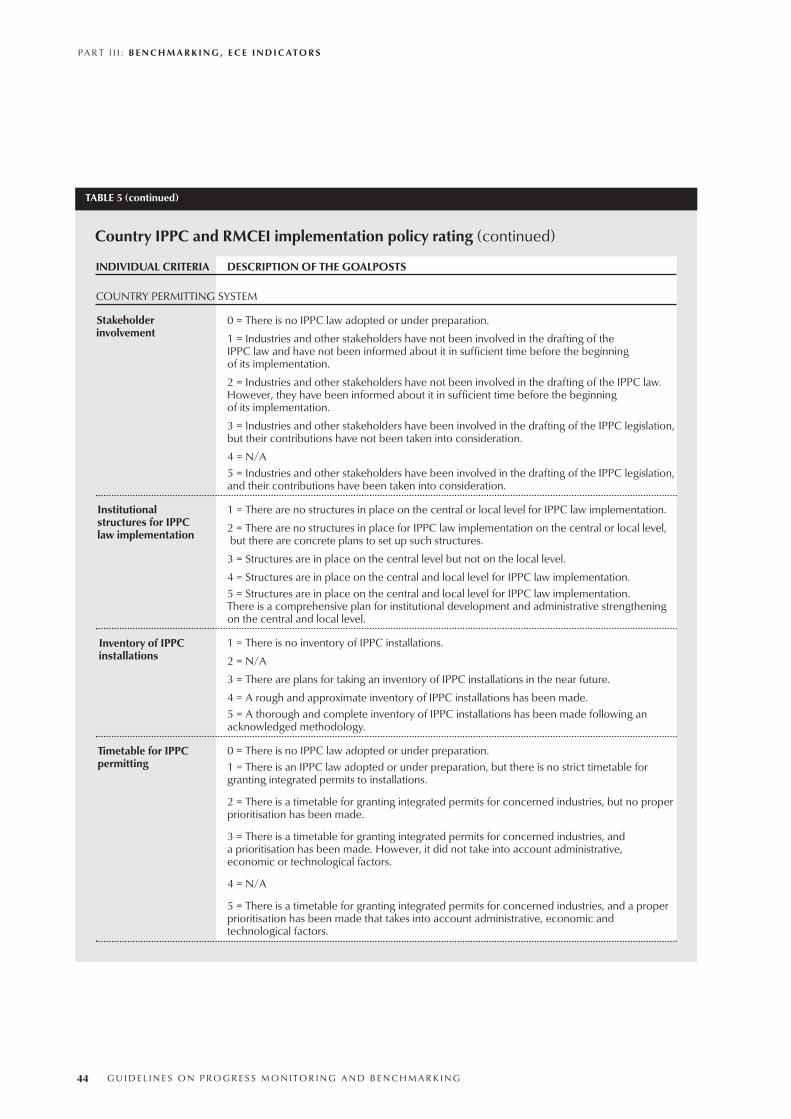
PA R T I I I : B E N C H M A R K I N G , E C E I N D I C AT O R S
G U I D E L I N E S O N P R O G R E S S M O N I T O R I N G A N D B E N C H M A R K I N G 44
TABLE 5 (continued)
INDIVIDUAL CRITERIA DESCRIPTION OF THE GOALPOSTS
COUNTRY PERMITTING SYSTEM
0 = There is no IPPC law adopted or under preparation.
1 = Industries and other stakeholders have not been involved in the drafting of the IPPC law and have not been informed about it in sufficient time before the beginning of its implementation.
2 = Industries and other stakeholders have not been involved in the drafting of the IPPC law. However, they have been informed about it in sufficient time before the beginning of its implementation.
3 = Industries and other stakeholders have been involved in the drafting of the IPPC legislation,but their contributions have not been taken into consideration.
4 = N/A5 = Industries and other stakeholders have been involved in the drafting of the IPPC legislation,and their contributions have been taken into consideration.
1 = There are no structures in place on the central or local level for IPPC law implementation.
2 = There are no structures in place for IPPC law implementation on the central or local level,but there are concrete plans to set up such structures.
3 = Structures are in place on the central level but not on the local level.
4 = Structures are in place on the central and local level for IPPC law implementation.5 = Structures are in place on the central and local level for IPPC law implementation. There is a comprehensive plan for institutional development and administrative strengthening on the central and local level.
1 = There is no inventory of IPPC installations.
2 = N/A
3 = There are plans for taking an inventory of IPPC installations in the near future.
4 = A rough and approximate inventory of IPPC installations has been made.5 = A thorough and complete inventory of IPPC installations has been made following an acknowledged methodology.
0 = There is no IPPC law adopted or under preparation.1 = There is an IPPC law adopted or under preparation, but there is no strict timetable for granting integrated permits to installations.
2 = There is a timetable for granting integrated permits for concerned industries, but no properprioritisation has been made.
3 = There is a timetable for granting integrated permits for concerned industries, and a prioritisation has been made. However, it did not take into account administrative, economic or technological factors.
4 = N/A
5 = There is a timetable for granting integrated permits for concerned industries, and a proper prioritisation has been made that takes into account administrative, economic and technological factors.
Country IPPC and RMCEI implementation policy rating (continued)
Institutionalstructures for IPPClaw implementation
Inventory of IPPCinstallations
Timetable for IPPCpermitting
Stakeholderinvolvement

PA R T I I I : B E N C H M A R K I N G , E C E I N D I C AT O R S
G U I D E L I N E S O N P R O G R E S S M O N I T O R I N G A N D B E N C H M A R K I N G 45
TABLE 5 (continued)
INDIVIDUAL CRITERIA DESCRIPTION OF THE GOALPOSTS
COUNTRY PERMITTING SYSTEM
1 = There are neither tools nor a strategy for following the developments of BAT.
2 = N/A
3 = Best available techniques references (BREFs) have been translated into the national language or guidance documents based on the BREFs have been drafted.
4 = National experts participate in BREF development. There is a strategy and tools for following and implementing BAT. BREFs have been translated, or guidance documents based on the BREFs have been drafted. Operators are not fully aware of BAT translations and/or guidance documents.5 = National experts participate in BREF development. There are a strategy and tools for following and implementing BAT. BREFs have been translated, or guidance documents based on the BREFs have been drafted. Operators are fully aware of BAT translations and/or guidance documents.
1 = There are no or limited competences and skills for issuing integrated permits in the whole country.2 = Plans are being prepared to improve the skills needed for issuing integrated permits.
3 = There are skills for issuing integrated permits only on the central level and very limited skills on the local level. There is no clear strategy for capacity building on the local level.
4 = There are skills for issuing integrated permits only on the central level. There is a clear strategy for capacity building on the local level.
5 = There are good skills for issuing integrated permits on the central and local levels.
RECOMMENDATIONS FOR MINIMUM CRITERIA FOR ENVIRONMENTAL INSPECTIONS
GENERAL
1 = RMCEI has not been adopted as national legislation and is not taken into consideration.2 = Certain parts of RMCEI are included in guidance documents for inspectorates.
3 = The whole RMCEI is included in guidance documents for inspectorates.
4 = RMCEI has been adopted as a piece of national legislation and/or is included in guidance documents, but not everything is implemented in practice.
5 = RMCEI has been adopted as a piece of national legislation and all recommendations are taken into consideration.
1 = Generally, inspectors are not aware of the requirements of the RMCEI.2 = Only a few inspectors on the central level are aware of RMCEI requirements.
3 = There are plans, projects and ideas on how to improve inspectors’ awareness about RMCEI.
4 = The requirements of RMCEI are included in trainings for inspectors and/or projects are being implemented and/or there are plans on how to do it.
5 = Inspectors are fully aware of the RMCEI requirements, and they implement them in their daily work.
Country IPPC and RMCEI implementation policy rating (continued)
Best available techniques
Competencies andskills for issuingintegrated permits
Regulatoryframework
Awareness aboutRMCEI amonginspectors

PA R T I I I : B E N C H M A R K I N G , E C E I N D I C AT O R S
G U I D E L I N E S O N P R O G R E S S M O N I T O R I N G A N D B E N C H M A R K I N G 46
TABLE 5 (continued)
INDIVIDUAL CRITERIA DESCRIPTION OF THE GOALPOSTS
1 = The permitting and inspection system is designed in such a way as to take into account the division of responsibilities between authorisation and inspection services.
2 = N/A
3 = N/A
4 = There is a division of responsibilities between permitting and inspection services, but communication between permit writers and inspectors is not good, and the quality of permits suffers because of that.5 = There is a division of responsibilities between permitting and inspection services, and at thesame time communication between permit writers and inspectors is sufficient, which has a positiveimpact on the quality of permits.
1 = There is absolutely no coordination of inspections with the neighbouring countries with regard to installations and activities, which might have significant transboundary impact.2 = N/A
3 = There is rarely coordination of inspections with the neighbouring countries. This took placeonly in cases of political pressure or accidents.
4 = There is good coordination of inspections with the neighbouring countries with regard to installations and activities, which might have significant transboundary impact. However, there is room for improvement, and plans and projects are being prepared for that purpose.
5 = There is excellent coordination of inspections with the neighbouring countries with regardto installations and activities, which might have significant transboundary impact. Inspectors are in constant contact, data is exchanged, common site visits are organised, etc.
PLANS FOR ENVIRONMENTAL INSPECTIONS
1 = Plans are not available, and inspection is carried out on an ad-hoc basis.2 = Plans are available at a certain level, but they are incomplete. They are not the result of a serious prioritisation work.
3 = Plans are available on all levels covering the entire territory of the country and all controlled installations. Plans are not necessarily the result of prioritisation work within the inspectorate. Compliance with plans is not monitored.
4 = N/A
5 = Plans are available on national, regional and local levels covering the whole territory ofthe country and all controlled installations. Plans are a result of prioritisation work within the inspectorate. Compliance with plans is monitored.
Country IPPC and RMCEI implementation policy rating (continued)
Division of responsibilitiesbetween authorisation andinspection services
Transboundarycooperation
Availability of plans

PA R T I I I : B E N C H M A R K I N G , E C E I N D I C AT O R S
G U I D E L I N E S O N P R O G R E S S M O N I T O R I N G A N D B E N C H M A R K I N G 47
TABLE 5 (continued)
INDIVIDUAL CRITERIA DESCRIPTION OF THE GOALPOSTS
PLANS FOR ENVIRONMENTAL INSPECTIONS
0 = Inspection plans are not available.
1 = Plans are available, but they contain a strong political element and do not take into consideration all important factors like: EC (or other international) legal requirements; a register of controlled installations within the plan area; a general assessment of major environmental issues within the plan area and a general appraisal of the state of compliance by the controlled installations with EC legal requirements; or data on and from previous inspection activities, if any.
2 = N/A
3 = Plans are available, but they only take into consideration one or two of the following factors: EC (or other international) legal requirements; a register of controlled installations within the plan area; a general assessment of major environmental issues within the plan area and a general appraisal of the state of compliance by the controlled installations with EC legal requirements; data on and from previous inspection activities, if any.
4 = N/A
5 = Plans are drafted on the basis of EC (or other international) legal requirements to be complied with; a register of controlled installations within the planned area; a general assessment of major environmental issues within the plan area and a general appraisal of the state of compliance by the controlled installations with EC legal requirements; and data on and from previous inspection activities, if any.
0 = Inspection plans are not available.
1 = Plans contain very basic information and are not good guiding tools.
2 = N/A
3 = Plans contain up to five of the following elements: geographical area; period; specific provisions for its revision; identification of the specific sites or types of controlled installations covered; a prescription of the frequency of environmental inspections taking into account environmental risk; description of the frequency of inspections in different kinds of installations;provision for and outline of the procedures for non-routine environmental inspections; and provision for coordination between the different inspecting authorities.
4 = Plans contain five to seven of these elements.
5 = Plans include all eight elements.
SITE VISITS
1 = No checklists are available during the site visit.
2 = N/A
3 = Checklists are available, but they only partially cover the scope of applicable legislation to be enforced.
4 = N/A
5 = Checklists are available during the site visit covering the whole scope of applicable legislation.
Country IPPC and RMCEI implementation policy rating (continued)
Basis for plans
Contents of plans
Checklists

PA R T I I I : B E N C H M A R K I N G , E C E I N D I C AT O R S
G U I D E L I N E S O N P R O G R E S S M O N I T O R I N G A N D B E N C H M A R K I N G 48
TABLE 5 (continued)
INDIVIDUAL CRITERIA DESCRIPTION OF THE GOALPOSTS
1 = There is no information exchange between different institutions responsible for carrying out inspections.
2 = N/A
3 = There is a good exchange of information between different concerned authorities carryingout inspections in a certain type of installations. However, the site visits and the inspection approach are not well coordinated in general.
4 = N/A5 = There is a constant exchange of information between different concerned authorities carrying out inspections in a certain type of installations. The site visits and inspection approach are well coordinated in general.
1 = Site visits are not recorded at all.
2 = Only few findings from the site visit are recorded. A common template is not available. Records are not easily accessible and are rarely consulted upon every consequent visit.
3 = N/A
4 = All site visits are properly recorded, but a common template is not followed. They are readily accessible for all potential institutions/inspectors visiting the installation. Records are consulted at every following site visit to a given installation.5 = All site visits are properly recorded following a common template. They are readily accessible for all potential institutions/inspectors who would visit the installation. Records are consulted at every following site visit to a given installation.
1 = Inspectors do not have right of access to the installations.
2 = Inspectors have right of access to installations but for a very limited number of times in a given period.
3 = Inspectors have right of access to installations but only after prior notification.
4 = N/A5 = Inspectors have legal right of access to installations at any time, for any number of visits and without prior notification.
1 = There are no or only a few non-routine site visits per year.
2 = There is no minimum number of non-routine inspections, and they are only a small part of all inspections.
3 = Non-routine inspections are carried out in only one or two of the listed cases in point 5.
4 = N/A
5 = There are non-routine site visits in the following cases: serious environmental complaints; serious environmental accidents or occurrences of non-compliance; issuing of first permit; before the reissue, renewal or modification of permits; clarification of responsibilities and the liabilities of an event; mitigating the impact of an event through determining the appropriate actions.
Country IPPC and RMCEI implementation policy rating (continued)
Coordination betweeninstitutions
Recording of site visits
Access to installation
Non-routine sitevisits

PA R T I I I : B E N C H M A R K I N G , E C E I N D I C AT O R S
G U I D E L I N E S O N P R O G R E S S M O N I T O R I N G A N D B E N C H M A R K I N G 49
TABLE 5 (continued)
INDIVIDUAL CRITERIA DESCRIPTION OF THE GOALPOSTS
REPORTS AND CONCLUSIONS FOLLOWING SITE VISITS
1 = After the site visit, reports are not processed. They are not properly stored in an identifiableform and in data files. They do not contain the following elements: findings on compliance; action to follow, if any such as enforcement proceedings, sanctions, fines, follow-upinspection activities.
2 = N/A
3 = After the site visit, reports are processed. They are properly stored in identifiable form and in data files. However, they are poor in content and can hardly be used as a reference before subsequent visits.
4 = After the site visit reports are processed. They are properly stored in identifiable form and in data files. They contain some of the elements listed in point 5, but there is room for improvement. 5 = After the site visit, reports are processed. They are properly stored in identifiable form and in data files. They contain the following elements: findings on compliance and actions to follow, if any, such as enforcement proceedings, sanctions, fines, and follow-up inspection activities.
INVESTIGATIONS OF SERIOUS ACCIDENTS, INCIDENTS AND OCCURRENCES OF NON-COMPLIANCE
0 = Accidents, incidents and occurrences of non-compliance are not investigated.
1 = Accidents are investigated in order to clarify the causes of the event and the impact on the environment.
2 = N/A
3 = Accidents are investigated to clarify the causes of the event and to mitigate its impact through determining appropriate actions.
4 = N/A
5 = Accidents are investigated to clarify the causes of the event, to determine appropriate remedy actions and other actions to prevent further accidents.
Country IPPC and RMCEI implementation policy rating (continued)
Reports from sitevisits
Accidents, incidentsand non-compliance

PA R T I I I : B E N C H M A R K I N G , E C E I N D I C AT O R S
G U I D E L I N E S O N P R O G R E S S M O N I T O R I N G A N D B E N C H M A R K I N G 50
TABLE 6
Country environmental policy rating
1. Reform in permitting
2. Permits
3. Cleaner production approach
4. Regulatory requirement for self-monitoring
5. Relations between inspectors and regulated installations
6. Compliance assistance and promotion
7. Register of polluting installations
8. Non-compliance response
9. Cooperation arrangements
10. Human resources
11. Human resources
12. Human resources
13. Human resources
Average points
1. IPPC transposition
2. Stakeholder involvement
3. Institutional structures for IPPC law implementation
4. Inventory of IPPC installations
5. Timetable for IPPC permitting
6. BAT
7. Competences and skills for issuing integrated permits
ALB
AN
IA
BOSN
IA A
ND
HER
ZEG
OV
INA
CRO
ATIA
FORM
ER Y
UG
SOLA
VRE
PUBL
IC O
FM
ACED
ON
IA
MO
NTE
NEG
RO
SERB
IA
TURK
EY
KOSO
VO, T
ERRI
TORY
UN
DER
UN
AD
MIN
ISTR
ATIO
N
CRITERIA

PA R T I I I : B E N C H M A R K I N G , E C E I N D I C AT O R S
G U I D E L I N E S O N P R O G R E S S M O N I T O R I N G A N D B E N C H M A R K I N G 51
ALB
AN
IA
BOSN
IA A
ND
HER
ZEG
OV
INA
CRO
ATIA
FORM
ER Y
UG
SOLA
VRE
PUBL
IC O
FM
ACED
ON
IA
MO
NTE
NEG
RO
SERB
IA
TURK
EY
KOSO
VO, T
ERRI
TORY
UN
DER
UN
AD
MIN
ISTR
ATIO
N
TABLE 6 (continued)
Country environmental policy rating (continued)
Average score
1. Regulatory framework
2. Awareness of RMCEI among inspectors
3. Division of responsibilities betweenpermitting and inspection
4. Transboundary cooperation
5. Availability of plans
6. Basis for plans
7. Contents of plans
8. Checklist
9. Coordination between institutions
10. Recording of site visits
11. Access to installations
12. Non-routine site visits
13. Reports from site visits
14. Accidents, incidents and non-compliance
Average score
Total rating
CRITERIA

G U I D E L I N E S O N P R O G R E S S M O N I T O R I N G A N D B E N C H M A R K I N G 52

G U I D E L I N E S O N P R O G R E S S M O N I T O R I N G A N D B E N C H M A R K I N G 53
Part IV Regional Experience in
Environmental Compliance and Enforcement Indicators,
Progress Monitoring and Benchmarking

G U I D E L I N E S O N P R O G R E S S M O N I T O R I N G A N D B E N C H M A R K I N G 54

G U I D E L I N E S O N P R O G R E S S M O N I T O R I N G A N D B E N C H M A R K I N G 55
This chapter provides an overview of the experienceof several South Eastern European countries in using ECEindicators, progress monitoring and benchmarking. Mostof the information is based on the peer review findings inselected ECENA member countries. The peer reviewswere carried out in 2005 and 2006.
The need to improve the capacity in using bench-marking and progress monitoring tools became very evi-dent as the SEE countries are progressing towards thepossible EU membership. The accession processrequirements to set targets, measure the progress, com-pare with the others and regularly report on the achieve-ments led the countries to seek tools and methods toimprove performance. Initially, the overall concept onthe use of benchmarking and progress monitoring tools,particularly in environmental enforcement and compli-ance, was discussed at the ECENA Exchange Program,hosted by Romania in October 2005. The ECENA coun-tries’ presentations on the current use of benchmarking,progress monitoring as well as use of quantitative indica-tors showed that the use of those tools is in the initialphase. The presentations from the IMPEL network coun-tries, particularly experience from Denmark and Bel-gium in using indicators for measuring the efficiency andthe effectiveness of inspections and procedures for qual-ity assurance/quality assurance systems provided aclearer picture of the benefits of using those tools.
The ECENA plenary meeting held in Croatia in Janu-ary 2006 concluded that the ECENA multi-annual workprogramme should be updated with capacity buildingactivities on benchmarking and progress monitoring. Theplenary endorsed the project aimed to improve the coun-tries’ capacity on benchmarking and progress monitoringsupported by the World Bank.
The peer review reports further confirmed that noneof the SEE country members of the ECENA network areaware of the benefits of using benchmarking andprogress monitoring as a tool to improve performance.They have neither future plans nor the know-how tointroduce the concept in their future plans.
The initial ECENA exchange programme, the peer
review and discussions among the network haveresulted in a much clearer understanding of the bench-marking work.
Country experiences in benchmarking, ECE indica-tors and progress monitoring have been presented dur-ing the Benchmarking Workshop which took place onMarch 29-30, 2007 in Szentendre.
In general, all of the countries use a simple set ofindicators. However, regular measuring and analysingthe indicators is still problematic and progress can bemade. Analysis of measured indicators informs themanagement process to a very small extent. Almost nobenchmarking is carried out, be it internal or external.General targets are set in almost all countries, but thisprocess is driven by the EU integration.
The ECENA workshop concluded that significantprogress has been made since the peer reviews wereconducted. The countries presentations showed that:
• Most of the countries developed sets of qualitativeand quantitative environmental compliance andenforcement (ECE) indicators needed for thebenchmarking work.
• Croatia plans to start internally with its central unitand branches, and begin benchmarking withexternal institutions.
• The former Yugoslav Republic of Macedonia identi-fied the needed resources for benchmarking and hasmade future plans for benchmarking and developingECE indicators. In addition a Twining Programme onECE Indicators is planned.
• Albania performed analysis of the indicators it hasused over the past three years, but there is no firmcommitment to further strengthening the use ofbenchmarking;
• Bosnia and Herzegovina has a set of developedECE indicators that can be used for benchmarking.
• Kosovo (as defined by UN SCR 1244) presentedindicators uses for measuring the efficiency ofinspections.
Part IVRegional Experience in Environmental
Compliance and Enforcement Indicators,Progress Monitoring and Benchmarking

PA R T I V : R E G I O N A L E X P E R I E N C E
G U I D E L I N E S O N P R O G R E S S M O N I T O R I N G A N D B E N C H M A R K I N G 56
There is a general acknowledgement of the impor-tance of proper use of indicators, benchmarking andprogress monitoring. There is also a willingness to dedi-cate efforts and resources to develop a viable set of indi-cators and set up proper systems of measuring, analysingand incorporating analysis into the management systems.
Albania Progress monitoring
Regarding the transposition and implementation ofthe acquis, the government has adopted an Action Planthat defines the dynamics for transposing EU legislation.The plan comprises deadlines but foresees neitherrequirements for progress monitoring nor methodologyfor measuring the progress of the plan’s implementation.However, it has been acknowledged that Albania willhave to report on the plan’s implementation.
Albania reports to the European EnvironmentalAgency (EEA) and the United Nations using a set of indi-cators. It intends to use these indicators for internal pur-poses in the future. The indicators include percentage ofrecycled waste and percentage of landfill waste.
The Albanian Ministry of Environment, Forestry andWater Management (MoEFWM) has been reporting tothe EU using several indicators for inspectors, as listedin Box 13. There is no formalised format for reporting.
There is no system for measuring the level of com-petence of inspectors, nor is there a database on organ-ised training programmes. However, questionnaires aresent to all regional inspectorates for the sake of report-ing. A record is kept of the number of organised work-shops that take place.8
Environmental compliance andenforcement indicators
Some analyses of the ECE indicators have beenundertaken over the years. For example, the penaltiespaid in 2006 represent 6 percent of all penalties, while for2005 the figure is 20 percent.
The performance of civil servants is evaluated everyyear. In theory performance is linked to remuneration,although this is not the case in practice. The evaluationhas only a short-term impact. Targets are fixed at threelevels: ministerial, departmental and individual.
The Environmental Inspectorate does not use indica-tors to assess the efficiency of environmental enforce-ment. Possible indicators taken into consideration by theinspectorates are the investments made in installations tocomply with BAT and the percentage of GDP spent onthe environment.
Benchmarking and standard settingThe MoEFWM and the Environmental Inspectorate
use neither benchmarking nor standard setting in envi-ronmental compliance and enforcement polices. Experi-ence from other countries is taken into consideration butnot used for comparing the standards.
Performance of the inspection work is rarely comparedwith similar performance in other countries, and there areno defined parameters for benchmarking in environmentalcompliance and enforcement. The MoEFWM does not col-lect data that would help to promote best practices. TheMoEFWM does not use generic key indicators such asglobal warming contributions, ozone depleting contribu-tions, total water use or total waste disposal.
The MoEFWM regularly prepares reports for theEuropean Commission, in which a number of indicatorsare used on an ad hoc basis.
Croatia The Croatian Environmental Inspectorate is widely
using the following input and output indicators.9
Input indicators:
• Number of inspectors;
• Number of sectorally specialised inspectors;
• Number of working days per year per inspector;
• Number of working days per month per inspector;
• Number of on site visits per installation (pre-notified,non-notified);
• Number of administrative sanctions;
• Number of reports to prosecutor;
• Number of prosecutions per cases taken;
• Available technical equipment (e.g. cars, cameras,general packet radio service, personal computers);
BOX 13
Progress of Albanian inspections:
• Number of annual inspections since 2001;
• Number of penalties;
• Number of closures;
• Fines collected;
• Value of collected fines;
• Number of applications for an environmental permit;
• Number of consents and authorisations;
• Number of adopted laws and regulations.

PA R T I V : R E G I O N A L E X P E R I E N C E
G U I D E L I N E S O N P R O G R E S S M O N I T O R I N G A N D B E N C H M A R K I N G 57
• Resources (money) used per year;
• Training courses, study tours, work in different pro-jects related to inspection (ECENA, IMPEL, INECE,MAP etc.);
• Work in pre-accession projects (CARDS, PHARE).
Outcomes:
• Increased number of data in the Cadastre;
• Identification of gaps in relevant legislation;
• Identification and notification of problems in industri-al sectors and activities and recommendations forimprovement;
• Identification of needs for better education and sec-toral specialisation of inspectors;
• Identification of needs for improvement of coopera-tion between different competent line inspections.
Each inspection body has its own set of qualityprocedures and a set of suitable quality and quantityparameters including different indicators. The Inspec-tion Division within the Croatian Ministry of Environ-mental Protection Physical Planning and Construction(MEPPPC) is constantly making efforts to establishmeasurable indicators related to environmentalinspection, following up on the RMCEI and the SixthEnvironmental Action Programme.10
Benchmarking is also carried out through theEnvironmental Protection Strategy and Action Plan. Itincludes short-, mid- and long-term measures forachieving the goals. Benchmarking is based onactions taken and monitoring data versus set goals.
Future plans to use benchmarking andprogress monitoring
There is also a type of internal process and perfor-mance benchmarking between the 20 units of the inspec-torate. Good practices and results are compared and dis-seminated. A process of external benchmarking has alsostarted through analysing good practices in inspectoratesin Scotland, the Netherlands, Belgium, and other coun-tries. Analysis is undertaken if a certain practice is applic-able or not in Croatian conditions. However, this processof benchmarking is not systematic, yet and there is spacefor improvement.
Progress monitoring in Croatia is carried out in several ways.
Inspectors’ reports:
• Personal monthly/annual reports;
• Reports related to thematic on-site visits (differentindustry sectors and activities);
• Reports related to accidents/incidents.
Inspection Directorate’s reports
• Summary and analytical thematic reports;
• Annual report to Croatian Government (adopted bythe minister);
• Reports related to different EU accession activities(screening, progress reports, questionnaires, pre-accession projects);
• Reports related to activities in different internationalenvironmental networks (e.g. ECENA, IMPEL,INECE, MAP)
As of March 2007, the Croatian EnvironmentalAgency (CEA) has been setting indicators for progressmonitoring.
Sulphur dioxide emissions
The goal is to reduce SO2 by 61 percent in compari-son with 1990 by 2010, with a mid-term target of areduction by 22 percent in comparison with 1998.
Former Yugoslav Republic of Macedonia
In the former Yugoslav Republic of Macedonia, thepractice of progress monitoring and benchmarking is stillin the development stage. The relevant system andorganisation are in the set-up phase, and environmentalenforcement and compliance indicators are used onlyto a limited extent. With respect to benchmarking
FIGURE 5
SO2 emissions in Croatia by years
0
t/year
25,00050,00075,000
100,000125,000150,000175,000200,000
1990
1992
1994
1996
1998
2000
2002

PA R T I V : R E G I O N A L E X P E R I E N C E
G U I D E L I N E S O N P R O G R E S S M O N I T O R I N G A N D B E N C H M A R K I N G 58
(national and/or international) the situation is similar, aconsequence of the absence of monitoring informationon enforcement and compliance. However, a bench-marking pilot project involving municipalities is underway, and one of the elements of this project focuses onthe environment.
The State Inspectorate of Environment (SIE) usesmostly numerical environmental compliance andenforcement indicators, as shown in Box 14. The SIEdoes not use indicators to assess the efficiency of theenvironmental enforcement activities.
Performance of the inspection work is not systemati-cally compared with the performance of other inspec-torates in the regions. In addition, the SIE does not collectdata or identify parameters that can be used to promotethe practice.
Regarding the transposition and implementation ofthe acquis, the government has adopted a National Strat-egy and Action Plan that is coordinated by the Office(Sector) of European Integrations placed with the gov-ernmental structure. The relevant ministries need toreport on the plan’s implementation on a regular basis.However, the strategy does not foresee requirements forprogress monitoring.11
Future plans to use benchmarking andprogress monitoring
Serious work has been carried out in regard to indica-tors and their analysis. The State Environmental Inspec-torate has proposed development of benchmarking strat-egy within the Strategic Plan of the MOEPP for the period2006-2008. The SIE has clear vision on introducing
benchmarking as a tool for improving performance. According to the SIE the ministry needs to do the fol-
lowing before and after benchmarking:
• metric identification;
• data collection;
• compare and contrast;
• focused action;
• sustained improvement.
Table 7 illustrates to some extent the direction ofthe efforts.
Serbia Progress monitoring
Regarding the transposition and implementationof the acquis, the government adopted an ActionPlan that defines the dynamics for transposing EUlegislation. The Action Plan contains deadlines, but it
TABLE 7
Indicators, actions and improvements
Analysing of indicators Action Improvement
Routine/non-routine inspection
Planned/not-completed inspection
Compliance/enforcement action/installations/sectors
1. Correction of the plan of inspection
2. Frequency of inspection
3. Correction of permit conditions
1. Assessment of time spent for inspection
2. Technical recourse available
3. Budget of inspectorate
1. Revision of frequency of inspection in“risk” sectors.
2. Revision of permits
1. Planning of inspection
2. Efficiency of inspection
3. Planning of budget for inspection
1. Planning of inspection2. Technical equipment (vehicles, PCs, etc.)
1. Better compliance
2. Permitting system
BOX 14
Macedonian inspection indicators
• Number of inspections and site visits;
• Number of reports and court cases;
• Number of penalties imposed.

PA R T I V : R E G I O N A L E X P E R I E N C E
G U I D E L I N E S O N P R O G R E S S M O N I T O R I N G A N D B E N C H M A R K I N G 59
foresees neither requirements for progress monitor-ing nor a methodology for measuring the progress ofthe plan implementation.
The inspectorate prepares a report to the ministryand the government containing the work plan for acertain period. The ministry prepares a study andanalysis of the institutional capacity of the ministry andits agencies, indicating the assistance needs. The minis-ter also reports whether the work has been done inaccordance to the plan but without indicators for mea-suring the progress. There is no set of methodologiesused for regular progress monitoring. However, theregular reports to the minister include indicators suchas the number of inspections done or the number ofinstallations visited.
The main policy planning is expected to be throughthe National Environmental Action Plan (NEAP). TheNEAP sets targets and defines the priority activities inthe short and long term. The ministry is of the opinionthat they need a separate strategy related to the trans-position of EU environmental legislation.12
Environmental compliance andenforcement indicators
The inspectorate is preparing an internal progressreport to the minister. The inspectorate uses environ-mental compliance and enforcement indicators only inreporting to the minister or to the government. Thecontent of the report and the indicators used are notdefined in subsidiary legislation or in internal ministeri-al regulation. The indicators most frequently used inthe report are listed in Box 15.
The inspectorate also considers using the numberof prevention controls as a good enforcement andcompliance indicator. However, the inspectorate isquite aware that it would be difficult to assess whetherthe prevention control was successful.
The inspectorate is not using indicators to assessthe efficiency of the environmental enforcement. Possi-ble indicators taken into consideration by the inspec-torates are the investments made in installations tocomply with the BAT and the percentage of GDP spenton the environment.
Benchmarking and standard settingThe Ministry of Environment and the Environmental
Inspectorate use neither benchmarking nor standard set-ting in environmental compliance and enforcementpolices. In the process of drafting legislation, however,the working group and experts perform comparativeanalysis of the legislation with the relevant EU directives.Experience from other countries is taken into considera-tion but not used for comparing the standards.
Performance of the inspection work is not com-pared with similar ones in other counties, and thereare no defined parameters for benchmarking in envi-ronmental compliance and enforcement. The ministrydoes not collect data that will help to learn from bestpractices. However, the Serbian inspectorate usessome data on the experience from other agencies inthe neighbouring countries. Issues that are used forcomparison generally are: number of inspection deci-sions and their implementation, number of inspectionvisits and the number of complaints. The ministry doesnot use generic key indicators such as global warmingcontributions, ozone depleting contributions, totalwater use or total waste disposed.
The ministry regularly prepares reports for UNECE,particularly the country environmental performancereport, where a number of indicators are used on anad hoc basis.
The ministry and the inspectorate do not preparebriefing documents to request funds from the Ministry ofFinance. Instead, a document requesting equipment,vehicles, salaries, training, consultants for performingmeasurements and funding for incidental situations, e.g.accidents, is prepared. Request documents contain theactivity and justification for the funds demanded.
Future plans to use benchmarking andprogress monitoring
Serbia plans to initially introduce benchmarkingwithin the inspectorate. In addition, Serbia plans touse benchmarking with neighbouring countries par-ticularly on the implementation of the RMCEI.
Romania — case studyInternal performance benchmarking
The Romanian inspectorate performs part of theprocess of internal performance benchmarking by com-paring the value of the abovementioned parametersamong different units.13
An effort is made to use those indicators that canillustrate the activity of one inspectorate in comparison
BOX 15
Inspection indicators in Serbia:
• Total number of workdays per inspector;
• Total number of inspections made for certain period;
• Number of orders or denunciations;
• Number of penalties.

PA R T I V : R E G I O N A L E X P E R I E N C E
G U I D E L I N E S O N P R O G R E S S M O N I T O R I N G A N D B E N C H M A R K I N G 60
with the other five. This is why there is an understand-ing that they have to work with the average activity perinspector in situations where the number of inspectorsvaries among the inspectorates. Of course, no singleindicator can define precisely the whole activity of onespecific inspectorate, taking into account the varietyregarding the number and size of significant industrialand agricultural activities, the inspector’s qualifications,their experience or rank, etc. Still, if one county finish-es last in all indicators (as happened to Salaj County in2005), there is reason to call for thorough analysis of itsactivity and overall performance.
The most analysed indicator in Cluj RegionalInspectorate is the number of inspections per inspec-tor. Knowing well the situation in each inspectorateand looking at the table for the first six months of2006, it can be concluded that some abnormal situa-tions are present. For example, Bihor County isranked fifth by this indicator, even if the qualitativeanalyses of its activity prove that the situation is quitegood. After analysing this situation it was concludedthat this inspectorate hired a number of new inspec-tors in 2006, and that this new personnel could notperform at the same level as their predecessors. It wasconcluded that new intensive and specific trainingcourses were needed.
The 2006 table also shows that the Bistrita inspec-torate is first in the same indicator — number ofinspections per inspector — even though they wereleft with a small number of inspectors after four leftthe institution. Analysis was made on how this is pos-sible. The conclusion was that many inspections wereincomplete: they focused on only a few issues andsome of them were of inadequate quality. The conclu-sion is that poor results, as well as the best ones,require realistic analysis and understanding, becausethe numbers offered by the indicators may presentbiased information.
The Cluj Regional Inspectorate is of the opinionthat presenting the indicators (at least yearly) in frontof all inspectors represents a good motivation for bet-ter performance in the future. The whole activity of aninspectorate is based on many other factors, includingqualitative aspects.
According to these indicators, inspectorates whichranked last in 2005 have since improved, and theresults of a fraction (which constitutes an indicator)are in many cases very close among the inspectorates(difference of less than 0.5). The Regional Inspec-torate considers the analysis a success, as is the strat-egy developed and implemented inside the inspec-torates, having as a starting point the informationgiven by the indicators.14
Choosing the right value for the indicator “number ofinspections per inspector” is a complicated task consider-
FIGURE 6
Number of inspections per inspectorin Romania
0
20
40
60
80
100
Arg
es
Buch
ares
t
Clu
j
Gal
ati
Sibi
u
Suce
ava
Timis
Valc
ea
FIGURE 8
Amount of penalties per inspector in Romania
0
20
40
60
80
Arg
es
Buch
ares
t
Clu
j
Gal
ati
Sibi
u
Suce
ava
Timis
Valc
ea
FIGURE 7
Number of penalties per inspector in Romania
0
5
10
15
20
Arg
es
Buch
ares
t
Clu
j
Gal
ati
Sibi
u
Suce
ava
Timis
Valc
ea

PA R T I V : R E G I O N A L E X P E R I E N C E
G U I D E L I N E S O N P R O G R E S S M O N I T O R I N G A N D B E N C H M A R K I N G 61
ing the possible differences in quality of inspections; thepossibility that in this particular year there have beenmore unplanned inspections in a particular region, whichincreases the total number of inspections; and other fac-tors. Therefore, a target value should only have anindicative nature. Comparison between the numbers ofinspections can only be effective if all inspections are of acomparative quality. (See Box 16)
For example, the average of 150 inspections perinspector can be taken as an indicative figure. Thiswould be a clear management sign that those unitsthat have fewer inspections per inspector shouldintensify their work. On the other hand, those unitsthat have more inspections than the target figureshould not strive to increase the value of this indica-tor but should try instead to improve the quality ofeach individual inspection.
Based on these indicators, the management of theinspectorate can carry out internal performancebenchmarking among the different units of theinspectorate. However, similar to the aforementionedexample, choosing the right level of indicator shouldbe done extremely carefully and should be accompa-nied by interpretative guidance.
FIGURE 9
Number of complaints per inspectorin Romania
0
10
20
Arg
es
Buch
ares
t
Clu
j
Gal
ati
Sibi
u
Suce
ava
Timis
Valc
ea
BOX 16
Management should not only look at the value of thegiven indicators. They should develop sets of interpre-tative guidelines for each indicator that also take intoaccount factors of local and qualitative character.
BOX 17
Other inspection indicators in Romania
• Value of investments made by enterprises;
• Number of trainings attended by inspectors;
• Number of inspectors speaking a foreign language;
• Number of cases of accidental pollution;
• Number of environmental regulatedenterprises/number of existent enterprises;
• Number of complaints per inspector;
• Number of press release per inspector;
• Number of fulfilled measures stipulated in negotiated process/number of unfulfilled measures;
• Cost per inspection.

PA R T I V : R E G I O N A L E X P E R I E N C E
G U I D E L I N E S O N P R O G R E S S M O N I T O R I N G A N D B E N C H M A R K I N G 62
TABLE 9
Ranking of counties according to three different criteria
County
Rank according to number of penalties/inspector
Rank according toamount of penalties/inspector
Rank accordingto number ofinspections/inspector
Cluj 1 1 4Bihor 2 2 3Bistrica Nasaud 3 4 1Maramures 4 3 5Satu Mare 5 5 2Salaj 6 6 6
TABLE 8
Number of inspections and value of applied penalties/inspector in 2004
Cluj 9 1054 117.1 92.8 26.3 167.8 693.1 212.1
Bihor 6 792 132.0 104.6 26.2 166.8 530.7 162.4
Bistrica 5 948 189.6 150.2 13.0 82.9 194.6 59.5
Maramures 9 899 99.9 79.1 12.4 79.3 211.8 64.8
Satu Mare 7 1060 151.4 120.0 9.6 61.0 120.1 36.8
Salaj 6 548 91.3 72.4 3.5 22.3 97.5 29.8
Average for Regional 126.2 15.7 326.8Commissariate Cluj
NU
MBE
R O
F IN
SPEC
TORS
TOTA
L N
UM
BER
OF
INSP
ECTI
ON
S
NU
MBE
R O
F IN
SPEC
TIO
NS
(PLA
NN
ED A
ND
NO
NPL
AN
NED
) PER
INSP
ECTO
R
PERC
ENT
OF
TOTA
LIN
SPEC
TIO
NS
INC
OM
PARI
SON
WIT
HRE
GIO
NA
L AV
ERAG
E
NU
MBE
R O
F PE
NA
LTIE
S/IN
SPEC
TOR
PERC
ENT
OF
PEN
ALT
IES
INC
OM
PARI
SON
WIT
HRE
GIO
NA
L AV
ERAG
E
AM
OU
NT
OF
PEN
ALT
IES/
CO
MM
ISSA
R (I
N M
ILLI
ON
SO
F O
LD L
EI)
PERC
ENT
OF
PEN
ALT
IES
AM
OU
NT
IN C
OM
PARI
SON
WIT
H R
EGIO
NA
L AV
ERAG
E
COUNTY

G U I D E L I N E S O N P R O G R E S S M O N I T O R I N G A N D B E N C H M A R K I N G 63
Part VInternational Experience in
Environmental Compliance andEnforcement Indicators,
Progress Monitoring and Benchmarking

G U I D E L I N E S O N P R O G R E S S M O N I T O R I N G A N D B E N C H M A R K I N G 64

G U I D E L I N E S O N P R O G R E S S M O N I T O R I N G A N D B E N C H M A R K I N G 65
Examples of pilot projects onenvironmental compliance andenforcement indicators
A number of countries have undertaken small-scaleprojects to test the concept of indicators, based onINECE’s indicators development methodology andother experience. Examples of country experience inworking towards practical implementation of perfor-mance assessment are discussed below.15
United StatesThe United States Environmental Protection
Agency’s Enforcement and Compliance Assurance Pro-gram is focused on producing measurable results thatfurther the agency’s mission of protecting humanhealth and the environment.16 The programme contin-ues to expand its use of outcome measures, such aspounds of pollution reduced through enforcementactions and behaviour change (e.g. improvements toenvironmental management practices) that result fromcompliance assurance activities.
Programme activities (i.e. outputs) such as inspec-tions, compliance assistance delivered, and use ofincentive policies are also measured. Programme man-agers use these output measures as short-term indica-tors of programme performance, and in longer termtrend analyses.
Costa RicaCosta Rica sought to assess the impact of its Envi-
ronmental Prosecutor’s activities designed to curtailillegal logging in the country. The following types ofindicators were designed, developed, and implement-ed as part of a pilot project to aid the Costa Rican gov-ernment in their assessment:
• Inputs: Financial resources, human resources,information to monitor illegal activity (e.g. numberof complaints received from citizens);
• Outputs: Number of enforcement actions (e.g.number of accusations, number of inspections)relating to relevant cases undertaken by the Prose-cutor’s Office;
• Intermediate outcomes: Number of cases resultingin convictions and settlements; who is participatingin illegal logging activities; how serious the viola-tions were;
• Final outcomes: Total forest area lost to illegalactivity.
European Union examples ofenvironmental compliance andenforcement indicators andbenchmarking17
DenmarkIn the understanding of the Danish Inspectorate:
“the aim of benchmarking of inspectorates is to ensurea transparent, harmonised and efficient inspectionmethodology all over the country.”
Measuring pointsWhen dealing with benchmarking, the biggest
challenge is to decide on measuring points that are rel-evant, meaningful for stakeholders, tangible and easilyunderstandable. The points should be:
• few;
• unambiguous;
• comparable; and
• easy to compile.
Part VInternational Experience
in Environmental Compliance and Enforcement Indicators,
Progress Monitoring and Benchmarking

PA R T V : I N T E R N AT I O N A L E X P E R I E N C E
G U I D E L I N E S O N P R O G R E S S M O N I T O R I N G A N D B E N C H M A R K I N G 66
Relevant, but difficult, measuring points as “staffqualifications” and “environmental outcome” havebeen left out.
ECE benchmarking points, new Danish (pilot-) system
• The distribution of low, medium and highly envi-ronmentally friendly installations classifiedaccording to a nationwide categorisation scheme;
• Resources used per “total inspection” for similarinstallations, but distributed according to thethree mentioned categorisation groups;
• Number of announced an unannounced site vis-its, distributed in the three categorisation groups;
• Authority enforcement actions of different kindsper total inspection and distributed according to thethree categorisation groups;
• Time used for preparing a permit from the momentthat the necessary information from the applicantis available;
• Resources used for preparing a permit;
• Resources available for training inspectors;
• Quality assurance of inspectorates, e.g. ISO 9001;
• Stakeholder’s satisfaction.
Idea for a benchmarking systemThe pilot project group recommended that the
Danish EPA should develop a web-based system forcomparing data from the Danish inspectorates basedon the mentioned parameters, and possibly more. Thesingle inspectorate should be able to select from thesystem both which inspectorates and which parame-ters it wants to be compared to. Furthermore, the sys-tem should be open to everybody, including the state,business community and the public.
Germany Input
Sufficiently qualified and motivated inspectors:education level and variety of inspector’s education;salary of inspectors; f luctuation of inspectors;resources for further training; results of questioninginspectors; rate of number of inspectors to number ofcompanies (for different levels of complexity);Baden-Wurttemberg (Ba-Wu): e.g. questioning ofinspectors; different complexity levels.
Sufficient equipment: quality and quantity ofoffice equipment; quality and quantity of technicalequipment (e.g. measurement devices); financialresources per inspector.
Independence of the inspectors: type of employmentcontracts.
Optimised administration structure and optimisedorganisation in the inspectorate:
Results of internal and external reviews of the organi-sation and workflow (e.g. ISO standards); number ofexperts for one complex company; number of contactpersons for a company; existence of a supporting com-petence centre; Ba-Wu: e.g. external reviews by consul-tants and EMAS; new organisation of the administration.
Supervision: number of working programmes andresults; methods of supervising instructors by superiorsand prefixed administration levels.
OutputFast plus technical and legal decisions: time to
FIGURE 10
Control of Pollution Act in Scotland:licence compliance
0
20
40
60
80
100
1998
/99
1999
/00
2000
/01
2001
/02
2002
/03
2003
/04
2004
/05
2005
/06
2006
/07
%
GO
AL
Year Target Actual
FIGURE 11
Satisfactory operator performance:integrated pollution control
0
20
40
60
80
100
1998
/99
1999
/00
2000
/01
2001
/02
2002
/03
2003
/04
2004
/05
2005
/06
2006
/07
%
GO
AL
Year Target Actual

PA R T V : I N T E R N AT I O N A L E X P E R I E N C E
G U I D E L I N E S O N P R O G R E S S M O N I T O R I N G A N D B E N C H M A R K I N G 67
grant a permit after all necessary application docu-ments are submitted; number of spot tests of permitsby prefixed administrations; number of successfuloppositions to decisions; Ba-Wu: e.g. Instructions forfast permit procedures.
Sufficing surveillance: number and time extent ofinspections (by one or several inspectors) for a defi-nite type of installation; number of founded failings;number of writings on failings; number of orders;number of accidents; number of no compliance ofemission limits; real situation of the environment asproduct of the work; Ba-Wu: e.g. work results of theenvironmental inspectorates are published in form ofreports and statistics in a yearly booklet; press releas-es; extensive environment data.
Public information: rate of permits with and with-out participation of public; number of insights intoofficial files (citizens or attorneys at law); quality andquantity of public relation (print media, websites etc.);Ba-Wu e.g. yearly booklet; websites; press releases.
Companies and citizens contentment: amount ofopposition to inspectorate decisions; number of courtprocedures; number of complaints against inspectors;results of questionnaires from companies (may beanonymous); results of questioning citizens; Ba-Wu:e.g. questioning companies; yearly booklet.
Scotland The examples in figures 10 and 11 are of target set-
ting, against which performance is measured. Thisexample does not fit exactly to the definitions ofbenchmarking as described above. Target setting is akind of race with oneself and is a significant internaldrive for performance improvement. Targets are setbased on analysis of one’s own performance or basedon analysis of another’s performance. It is of utmostimportance to set realistic targets which are not toolow and therefore stifling the organisation’s ambitionand capacity to improve. On the other hand, targetsshould not be too high or entail too strong a criticismwhen they are not met.
Figure 10 shows licence compliance in Scotland.SEPA sets two levels of standards in its licenses,against which it measures performance, namely arolling 12-month compliance standard and an instanta-neous one.
Figure 11 shows rates of successful operator per-formance in Scotland. A target for 2007/08 is notincluded as, by then, the Integrated Pollution Controlregime will have been completely replaced by the Pol-lution Prevention and Control (Part A) regime. Targetsfor the new regime have still to be developed.18
Networks as a tool for benchmarking
Networks of environmental bodies and organisa-tions are tools for process and performance bench-marking. Networks are major forums for externalprocess and performance benchmarking. They identifybest practices in some members and disseminate themto other members of the network. Naturally, differentmembers of a network are on different levels ofprocess development and performance. The networkitself is a broker of best practices and lessons learned.Better organisations effectively pull weaker ones alongby serving as examples.
A short description of the major enforcement andcompliance networks (INECE, IMPEL, ECENA, REPIN,AECEN, Irish Enforcement Network) can be found inAnnex 5.
FIGURE 12
Benchmarking role of networks
InspectorateE
InspectorateD
InspectorateB
InspectorateA
InspectorateF
InspectorateC
Leve
l of p
erfo
rman
ce
Role of networks

G U I D E L I N E S O N P R O G R E S S M O N I T O R I N G A N D B E N C H M A R K I N G 68

Part VIAssessment Tools and Methods for Progress
Monitoring and Benchmarking
G U I D E L I N E S O N P R O G R E S S M O N I T O R I N G A N D B E N C H M A R K I N G 69

G U I D E L I N E S O N P R O G R E S S M O N I T O R I N G A N D B E N C H M A R K I N G 70

G U I D E L I N E S O N P R O G R E S S M O N I T O R I N G A N D B E N C H M A R K I N G 71
Part VIAssessment Tools and Methods for
Progress Monitoring and Benchmarking
Monitoring and evaluation Monitoring is defined as a process that systemati-
cally and critically observes events connected to aproject/programme/policy, which enables decisionmakers to adapt policies and/or activities to givenconditions. Monitoring aims to:
• detect as soon as possible any significant devia-tion from expected levels of input, activities andoutputs; and
• assess trends of programme outcomes and impactindicators.
According to the OECD, monitoring can bedefined as:
a continuing function that uses systematic collec-tion of data on specified indictors to provide man-agement and the main stakeholders of an ongoingdevelopment interventions with indicators of theextent of progress and achievement of objectivesto use of allocated funds.
In order to achieve progress monitoring, it is nec-essary to evaluate the project/programme or policy.According to the World Bank, evaluation can bedefined as:
the process of determining the worth or signifi-cance of a development activity, policy or pro-
gram to determine the relevance of objectives, theefficacy of design and implementation, the effi-ciency or resource use, and the sustainability ofresults. An evaluation should enable the incorpo-ration of lessons learned into the decision-makingprocess of both partner and donor.
Evaluation of the progress involves three interre-lated dimensions:
• an in-depth analysis of gaps between programmetargeted inputs, activit ies and outputs, andachieved levels;
• understanding the underlying causes behind theobserved trends, or outcome/impact indicators; and
• analysing the impact of the project/programme orpolicy designed to achieve certain goals.
There are great synergies between the monitoringand evaluation. Monitoring information is a basis forconducting evaluation. In addition, monitoring infor-mation can be collected and used for ongoing man-agement purposes. Evaluation is a more detailed, time-consuming and generally costly activity. Monitoringinformation can provide input in order to identifypotential problem issues. However, more detailed datais needed to conduct an evaluation.
BOX 18
The US EPA recommends the following monitoring design procedure comprised of the following elements:
• Define the objectives — The overall objective of the design process is stated in a succinct manner.
• Establish information needs — Information requirements to meet the objective are established.
• Establish the objectives — The objectives of all possible monitoring is established.
• Individual programme components — Programme components and performance criteria are established.
• Evaluation of trade-offs — The combination of monitoring components that best meet the overall objectives has been selected.
• Feedback to initial design step — Modifications to the system’s design are made to improve the product’s performance.
EPA guidelines

PA R T V I : A S S E S M E N T T O O L S
G U I D E L I N E S O N P R O G R E S S M O N I T O R I N G A N D B E N C H M A R K I N G 72
General tools and methods for progress monitoring and evaluation
There are a number of different tools and methodsfor monitoring and evaluation. They can be dividedaccording to their purpose and use, advantages, associ-ated costs, skills required and time investment.
The experience of a number of counties suggeststhat a generic monitoring and evaluation system shouldinclude three core components:
• monitoring trends of outcome/impact indictorsrelated to programmes of policy targets and trendanalysis;
• monitoring the implementation of programmes thatcontribute towards implementation of the set tar-gets and explaining the gaps; and
• assessing the impact of programmes and policieson selected targets.
Frequently used methods and tools for progressmonitoring and evaluation are:
• the logical framework approach;
• formal surveys;
• theory based evaluation;
• rapid appraisal methods;
• impact evaluation; and
• peer reviews.
Logical framework approachThe logical framework approach (LFA) is a man-
agement tool mainly used in the design, monitoring
and evaluation of development projects. LFA is wide-ly used by bilateral and multilateral donor organisa-tions, governments and NGOs, as it helps to clarifyobjectives of projects, programmes and policies. LFAhelps to identify the links in the programme logicand leads to the identification of performance indica-tors at each stage of the programme.
It is useful to distinguish between the two terms:the logical framework approach (LFA) and logicalframework (LF or logframe) because the terms aresometimes confused. The logframe is a documentwhile LFA is a project design methodology.
The logical framework takes the form of a projecttable with four rows and four columns. The four rowsare used to describe four different types of events thattake place as a project is implemented: the projectactivities, outputs, purpose and goal. The fourcolumns provide different types of information aboutthe events in each row. The first column is used toprovide a narrative description of the event. The sec-ond column lists one or more objectively verifiableindicators (OVIs) of these events. The third columndescribes the means of verification (MoV) where infor-mation will be available on the OVIs, and the fourthcolumn lists the assumptions.
Assumptions are external factors that could poten-tially influence (positively or negatively) the eventsdescribed in the narrative column. The list of assump-tions should include those factors that potentiallyimpact on the success of the project, but which can-not be directly controlled by the project or pro-gramme managers. In some cases these may includewhat could be “killer” assumptions, which, if provedwrong, will have major negative consequences for theproject. A good project design should be able to sub-stantiate its assumptions, especially those with a highpotential for negative impact.
BOX 19
Surveys are used to collect comparable information from relatively large number of sources and groups. According to theWorld Bank, the formal surveys can be used for:
• providing data for assessing the performance of strategy, programme or policy;
• comparing actual conditions with the targets established;
• providing a key input to a formal evaluation of the impact of the programme or project; and
• assessing the current situation as a basis for the preparation of strategies.
Rapid appraisals methods are quick and low-cost mechanisms to gather data in respon to the decision makers need forinformation. Rapid appraisal methods provide quick information for management decision making, especially at the programme or project level.
Formal surveys and rapid appraisal methods

PA R T V I : A S S E S M E N T T O O L S
G U I D E L I N E S O N P R O G R E S S M O N I T O R I N G A N D B E N C H M A R K I N G 73
EU tools and methods forassessing environmentalcapacity and progressmonitoring
Environment is considered a sector that will poseparticular problems for the candidate countriesbecause of the extent of the EU environmental require-ments and the need for significant investment in envi-ronmental infrastructure in order to achieve compli-ance. The regular progress reporting related to thelevel of transposition and implementation of key EUlegislation is part of the EU accession obligations of thecandidate and pre-candidate countries.
There is a challenge ahead for the candidate andpre-candidate countries to develop mechanisms totrack progress in adopting and implementing the envi-ronmental acquis. In addition, it is of great importancethat the countries establish systems for communicationand progress reporting. There is a number of tools andmethods that are particularly used to assess the envi-ronmental capacity of the countries, enable exchangeof experience and benchmarking and provide recom-mendations for improvement.
In order to establish proper progress monitoring ofapproximation, ministries of environment will need tofollow a systematic approach. At least two types ofinformation will be important:
• objective assessment of the current state of transpo-sition and implementation; and
• information on changes in that status over time, aslegislative and implementation programmes progress.
Environmental ministries might also track theprogress being made by other ministries with the com-petence of various acquis.
Other information related to approximation mayalso need to be monitored, e.g. legislative develop-ments taking place in Brussels with regard to the envi-ronmental acquis, and any EU or bilateral assistanceprojects related to approximation.
Monitoring of progress in approximation needs tobegin with a detailed provision-by-provision assess-ment of the correspondence between national lawand each EU act. Assessment of the status of imple-mentation likewise needs to be carried out provi-sion–by-provision, in case there is information on thereal picture.
Within the framework of the EC project ProgressMonitoring, methodologies have been developed formonitoring progress in transposition and implementa-tion. Progress monitoring forms have also been pre-pared for each of the relevant directives and regulations.
The Guide to the Approximation of EuropeanUnion Environmental Legislation suggests the use of aprovision-by-provision table of concordance for report-ing on transposition of directives. Tables of concor-dance enable the relevant provisions in national legis-lation to be set down parallel to the relevant legalobligations or a directive, so that provison-by-provisoncomparison of EU requirements with national law canbe carried out. Each obligation in a directive is scoredindividually on a scale ranging from 0 to 5, depending
TABLE 10
Logical framework (Logframe)
Narrative summary
Development objective
Immediate objective
Outputs (results)
1.
2.
Activities
1.
2.
3.
Objectively verifiableindicators – OVIs
Inputs
1.1
1.2
1.3
Means of verification– MOVs
External factors (assumptions)

PA R T V I : A S S E S M E N T T O O L S
G U I D E L I N E S O N P R O G R E S S M O N I T O R I N G A N D B E N C H M A R K I N G 74
on whether transposition has not yet started, legislativedrafting is in process, and on through the variousstages in a country’s legislative procedure, until trans-position is complete.
For example, a directive with 22 different legalobligations receives a score of 55 if only half of theobligations have been transposed up to that date (11x 5). A legislative draft aimed at transposing theremaining provisions will add an additional 11 points(11 x 1). As the draft goes through the process ofadoption, additional points are accrued until thescore reaches 110 (22 x 5), indicating that transposi-tion is complete.
The table in Annex 6 presents the major tools andmethods for assessing the environmental capacityused in the EU accession process.
OECD tools and methods for assessing environmentalcapacity and progressmonitoringOECD Environmental PerformanceReviews19
The OECD’s environmental performance reviews(EPRs) provide a systematic overview of the efforts ofmember countries to reach their environmental goalsand country-specific recommendations to improveperformance. They assess progress in reducing pollu-t ion, in improving the management of naturalresources, in implementing economically efficient
BOX 20
According to the EC, using a system for periodically reviewing progress in approximation can be of benefit for the min-istries of environment to:
• Use resources more effectively. Regular review of programmes for transposition and implementation will facilitate earlyidentification of potential problems and help ministries to allocate limited human and financial resources to priority issues.
• Increase the level of cooperation within the ministry. The process of EU approximation requires substantial involve-ment from technical experts within ministries of environment. Progress monitoring can help these technical expertsdevelop a better understanding of EU requirements and of the scope of approximation.
• Build greater stakeholder support. Information collected by the monitoring system could be used to inform relevantstakeholders and the public, and to solicit their support. This increased support would boost public awareness andhelp the government to build political support from a wide range of stakeholders for carrying out implementationactions.
• Prepare for responsibilities of membership. All member states are expected to report to the European Commissionwithin given intervals on the status of transposition and implementation of EU environmental acts. Establishing a regu-lar progress monitoring system during the accession period could lay down the foundations for meeting this reportingobligation once the applicant country becomes a member state.
BOX 21
In developing its approximation strategy, the Lithuanian Ministry of Environment devised a simple way of tracking theprogress of various approximation-related activities, based on a matrix format. The first column of the matrix lists the 70+clusters of EU environmental legislation listed in the Guide for Approximation. The next few columns indicate which min-istry has competence and which ME official is responsible for coordinating approximation for each directive. Anothergroup of columns is used to track the status of translations of EU legislation, i.e. if translation has been ordered, checkedfor technical accuracy, checked for legal accuracy, checked by a linguist, and received official approval.
The matrix also has columns for tracking whether gap assessments have been carried out, and for noting the status of anydraft legislation to transpose the requirements under way. It is only four pages long and can be updated by hand or PC.During a particularly busy work period, it is updated as frequently as every two weeks. It has proved to be a means ofquickly checking at any give time the progress in a particular area.
Periodic reviews
Approximation progress monitoring in Lithuania

PA R T V I : A S S E S M E N T T O O L S
G U I D E L I N E S O N P R O G R E S S M O N I T O R I N G A N D B E N C H M A R K I N G 75
and environmentally effective policies, and instrengthening international cooperation.
The process uses the methodology of peer review— the report is prepared by the OECD Secretariat, andthen is discussed in depth in the Working Party onEnvironmental Performance (WPEP), with representa-tives of all member countries. The first cycle of perfor-mance reviews for all OECD countries was completedin 2000, and a second cycle is now underway.
In order to stimulate greater environmentalaccountability, the second cycle places more emphasison the use of indicators to measure performance; theintegration of environmental, economic, and socialpolicies to achieve sustainable development; andreviewing progress with respect to international com-mitments, including OECD decisions and recommen-dations. Review recommendations are presented at apress conference, usually given by the environmentminister of the reviewed country, and subsequentlyformal government responses are made public. Select-ed non-member countries are also reviewed.
OECD’s principle aim in performing environmen-tal performance reviews is to help member countriesimprove their individual and collective performancesin environmental management including:
• to help individual governments assess progress;
• to promote a continuous policy dialogue amongmember countries, through a peer review process;and
• to stimulate greater accountability from membercountries’ governments towards their public opin-ion, within developed countries and beyond.
Environmental performance is assessed with regardto the degree of achievement of domestic objectivesand international commitments. Such objectives andcommitments may be broad aims, specific qualitativegoals, precise quantitative targets or a commitment toa set of measures to be taken. Assessment of environ-mental performance is also placed within the contextof historical environmental records, the present stateof the environment, the physical endowment of thecountry in natural resources, its economic conditionsand demographic trends.
In Annex 7 you can find description of core, keyand sectoral environmental indicators.
BOX 22
Scoring system for monitoringprogress in transposition
Legislation act (L):0= No steps taken to date1= Draft in process2= Ministry approves3= Government approves4= After first reading in parliament5= Fully transposed and published
Government order (GO):0= No steps taken to date1= Draft in process3= Ministry approves4=Other relevant ministries approve5= Government approves and published
Ministerial order (MO):0= No steps taken to date1= Draft in process3= Draft in consultation

G U I D E L I N E S O N P R O G R E S S M O N I T O R I N G A N D B E N C H M A R K I N G 76

Annexes
77G U I D E L I N E S O N P R O G R E S S M O N I T O R I N G A N D B E N C H M A R K I N G

G U I D E L I N E S O N P R O G R E S S M O N I T O R I N G A N D B E N C H M A R K I N G 78

G U I D E L I N E S O N P R O G R E S S M O N I T O R I N G A N D B E N C H M A R K I N G 79
International/nationalbenchmarking
International benchmarking is used where partnersare sought from other countries because best practi-tioners are located elsewhere in the world and/or thereare too few benchmarking partners within the samecountry to produce valid results. Globalisation andadvances in information technology are increasingopportunities for international projects. However, thesecan take more time and resources to set up and imple-ment, and the results may need careful analysis due tonational differences.
Top-down benchmarkingThe top-down/bottom-up benchmarking dimen-
sion refers to the position of the initiator of benchmark-ing. A government’s benchmarking of its institutionsperformance levels would be a typical example of atop-down benchmarking. Eventually, top-down bench-marking project can face a risk of reluctant cooperationor even resistance of the project. However, a top-downapproach is often useful if the aim is to set up a systemwhich can aid similar units in comparing their perfor-mance. In order for the top-down benchmarkingmodel to be successful, it has to be accepted as usefulby all units taking part in the project.
Bottom-up benchmarking Bottom-up benchmarking is based on horizontal
cooperation at the local level. Unlike top-down bench-marking, bottom-up initiated benchmarking networksoften benchmark fewer units. However, it can providebetter settings for deeper benchmarking procedures. Inprinciple, with fewer participants in the process, itbecomes more feasible to collect a wider array of data.The exchange of experience and cooperation betweenthe benchmarking partners enhances mutual trust andconfidence, which can further facilitate benchmarking.
Micro-/macro-benchmarkingThe micro/macro benchmarking dimension refers to
the scope of the benchmarking project. A micro-bench-marking project may focus on one institution, whilemacro oriented project may cover an entire sector.
Continuous vs. evaluation benchmarking
This dimension of benchmarking is related to howbenchmarking is applied throughout the lifetime of aproject, an organisation or institution. Continuousbenchmarking aims to enable continuous improvementwhile the evaluation approach assesses the perfor-mance of a given time.
Functional benchmarking or generic benchmarking
is used when organisations look to benchmark withpartners drawn from different business sectors or areasof activity to find ways of improving similar functionsor work processes. This sort of benchmarking can leadto innovation and dramatic improvements.
Internal benchmarking involves seeking partners from within the same
organisation, for example from units located in differ-ent areas. The main advantages of internal benchmark-ing are that access to sensitive data and information is
Annex I:Further Classification of Benchmarking
BOX 23
Ministries of Environment can benchmark processesand performances with other national ministries.Inspectorates can benchmark processes and perfor-mances between different regional units.

TABLE 11
A N N E X I
G U I D E L I N E S O N P R O G R E S S M O N I T O R I N G A N D B E N C H M A R K I N G 80
Different benchmarking types
Black – High relevance/value; Dark grey – medium relevance/value; Light grey – Low relevance/value
easier; standardised data is often readily available; and,usually less time and resources are needed. There maybe fewer barriers to implementation as practices maybe relatively easy to transfer across the same organisa-tion. However, real innovation may be lacking andbest in class performance is more likely to be foundthrough external benchmarking.
External benchmarking involves seeking outside organisations that are
known to be best in class. External benchmarking pro-vides opportunities to learn from those who are at thecutting edge, although it must be remembered that notevery best practice solution can be transferred to oth-ers. In addition, this type of benchmarking may takeup more time and resources to ensure the comparabili-ty of data and information, the credibility of the find-ings and the development of sound recommendations.External learning is also often slower because of the“not invented here” syndrome.
Generic benchmarking
Low comparabilityin pure figures dueto differences inprocesses and products
Best way for findingbreakthrough ideasand achieving fundamentalimprovement
Not too usefulbecause of differ-ences in businessidea
Performancebenchmarking
Process benchmarking
Strategic benchmarking
Internal benchmarking
Important and necessary process,but doesn’t showwhat performance isreally possible
Good place to startand learn aboutbenchmarking, butno breakthroughideas can be expected
Difficult to find clueson better strategiesinternally
Competitor benchmarking
Gives external reference points;Good comparabilityof performanceindicators
Would be very useful but legal andethical limitations to sharing processinformation
Competitors arebest partners to getideas about strategies and planning
Functional benchmarking
Useful for certainaspects but comparability is notalways given
Good way for finding new ideas,and less ethical andlegal limitations than competitorbenchmarking
Not too usefulbecause of differ-ences in businessidea
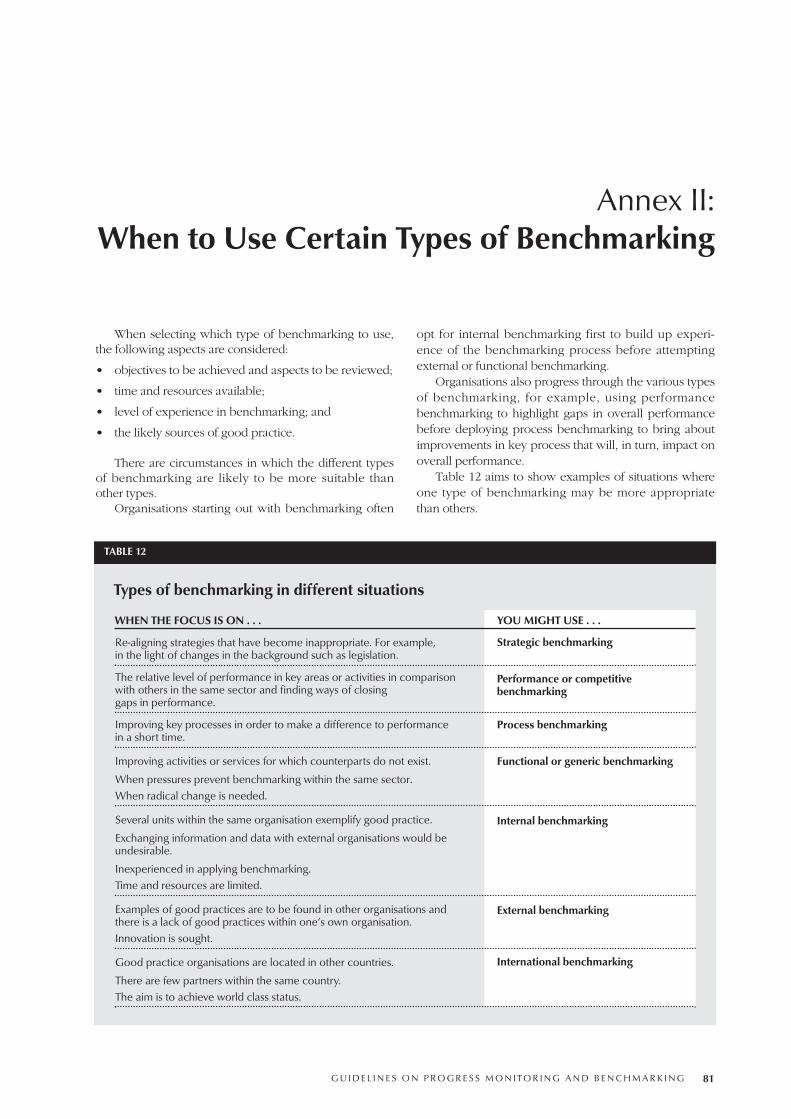
G U I D E L I N E S O N P R O G R E S S M O N I T O R I N G A N D B E N C H M A R K I N G 81
Annex II:When to Use Certain Types of Benchmarking
TABLE 12
WHEN THE FOCUS IS ON . . . YOU MIGHT USE . . .
Re-aligning strategies that have become inappropriate. For example, in the light of changes in the background such as legislation.
The relative level of performance in key areas or activities in comparison with others in the same sector and finding ways of closing gaps in performance.
Improving key processes in order to make a difference to performance in a short time.
Improving activities or services for which counterparts do not exist.
When pressures prevent benchmarking within the same sector.When radical change is needed.
Several units within the same organisation exemplify good practice.
Exchanging information and data with external organisations would be undesirable.
Inexperienced in applying benchmarking.Time and resources are limited.
Examples of good practices are to be found in other organisations and there is a lack of good practices within one’s own organisation.Innovation is sought.
Good practice organisations are located in other countries.
There are few partners within the same country.The aim is to achieve world class status.
Types of benchmarking in different situations
Strategic benchmarking
Performance or competitive benchmarking
Process benchmarking
Functional or generic benchmarking
Internal benchmarking
External benchmarking
International benchmarking
When selecting which type of benchmarking to use,the following aspects are considered:
• objectives to be achieved and aspects to be reviewed;
• time and resources available;
• level of experience in benchmarking; and
• the likely sources of good practice.
There are circumstances in which the different typesof benchmarking are likely to be more suitable thanother types.
Organisations starting out with benchmarking often
opt for internal benchmarking first to build up experi-ence of the benchmarking process before attemptingexternal or functional benchmarking.
Organisations also progress through the various typesof benchmarking, for example, using performancebenchmarking to highlight gaps in overall performancebefore deploying process benchmarking to bring aboutimprovements in key process that will, in turn, impact onoverall performance.
Table 12 aims to show examples of situations whereone type of benchmarking may be more appropriatethan others.
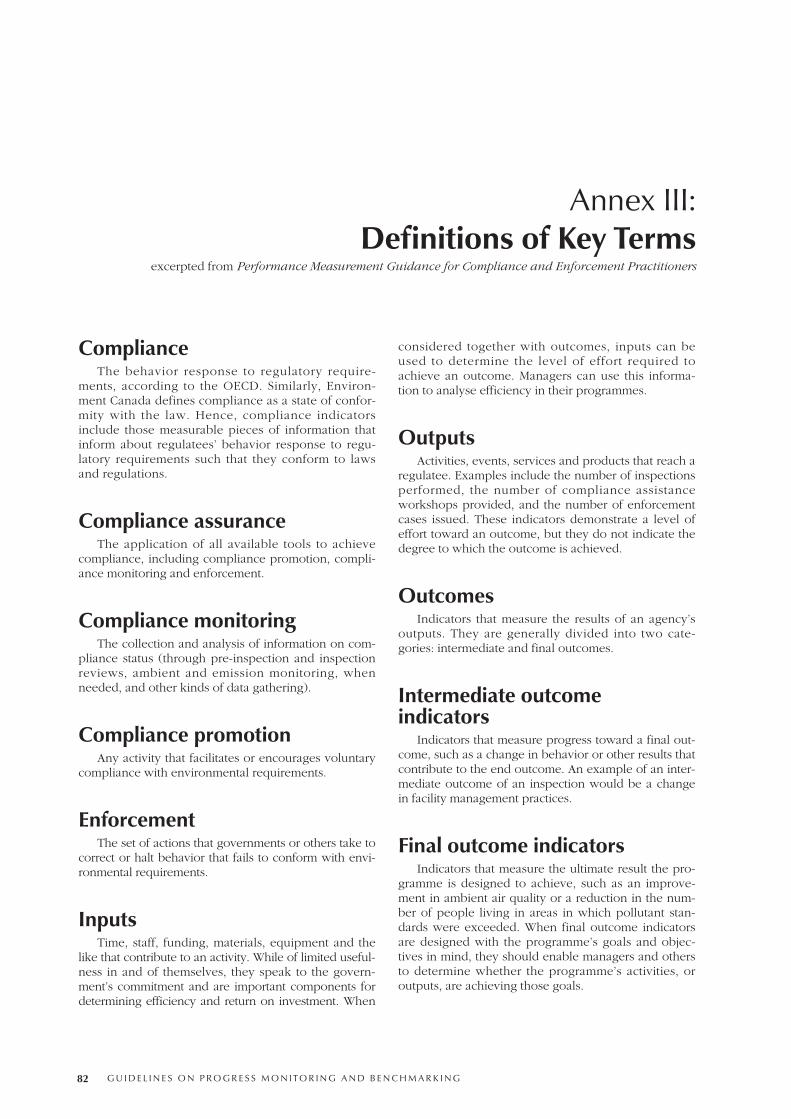
G U I D E L I N E S O N P R O G R E S S M O N I T O R I N G A N D B E N C H M A R K I N G 82
Annex III:Definitions of Key Terms
excerpted from Performance Measurement Guidance for Compliance and Enforcement Practitioners
Compliance The behavior response to regulatory require-
ments, according to the OECD. Similarly, Environ-ment Canada defines compliance as a state of confor-mity with the law. Hence, compliance indicatorsinclude those measurable pieces of information thatinform about regulatees’ behavior response to regu-latory requirements such that they conform to lawsand regulations.
Compliance assuranceThe application of all available tools to achieve
compliance, including compliance promotion, compli-ance monitoring and enforcement.
Compliance monitoring The collection and analysis of information on com-
pliance status (through pre-inspection and inspectionreviews, ambient and emission monitoring, whenneeded, and other kinds of data gathering).
Compliance promotion Any activity that facilitates or encourages voluntary
compliance with environmental requirements.
Enforcement The set of actions that governments or others take to
correct or halt behavior that fails to conform with envi-ronmental requirements.
Inputs Time, staff, funding, materials, equipment and the
like that contribute to an activity. While of limited useful-ness in and of themselves, they speak to the govern-ment’s commitment and are important components fordetermining efficiency and return on investment. When
considered together with outcomes, inputs can beused to determine the level of effort required toachieve an outcome. Managers can use this informa-tion to analyse efficiency in their programmes.
OutputsActivities, events, services and products that reach a
regulatee. Examples include the number of inspectionsperformed, the number of compliance assistanceworkshops provided, and the number of enforcementcases issued. These indicators demonstrate a level ofeffort toward an outcome, but they do not indicate thedegree to which the outcome is achieved.
OutcomesIndicators that measure the results of an agency’s
outputs. They are generally divided into two cate-gories: intermediate and final outcomes.
Intermediate outcomeindicators
Indicators that measure progress toward a final out-come, such as a change in behavior or other results thatcontribute to the end outcome. An example of an inter-mediate outcome of an inspection would be a changein facility management practices.
Final outcome indicatorsIndicators that measure the ultimate result the pro-
gramme is designed to achieve, such as an improve-ment in ambient air quality or a reduction in the num-ber of people living in areas in which pollutant stan-dards were exceeded. When final outcome indicatorsare designed with the programme’s goals and objec-tives in mind, they should enable managers and othersto determine whether the programme’s activities, oroutputs, are achieving those goals.

G U I D E L I N E S O N P R O G R E S S M O N I T O R I N G A N D B E N C H M A R K I N G 83
Annex IV:Inspection Indicators
highlighted in the IMPEL report on Benchmarking Quality Parametres for Environmental Inspections
The parameters are arranged under headings reflect-ing their main or logical function. It should be noted thatsome parameters could easily belong to several of theproposed functional groups. Furthermore the groups arenot intended to be exhaustive; further groups as well assubgroups can be defined as necessary.
Budget parameters• Total time and money available to the organisation;
• Time allocated per installation for: permitting,inspection and compliance monitoring, assessmentof reports from facilities — IPPC / others;
• Costs allocated per installation for: permitting,inspection and compliance monitoring, assessmentof reports from facilities — IPPC / others;
• Resources allocated for training of inspectors — perinspector and total for the whole staff;
• The amount of time and money allocated to devel-op ways of defining and/or monitoring the amountof pollution prevented;
• The amount of time and money allocated for theinspectorate’s research and development work.
Inspection burden andprioritising parameters• Number of IPPC facilities for inspection — broken
down into sector, size, complexity, risk, etc.;
• Number of Seveso facilities — broken down intocomplexity, etc.’
• Number of other facilities for inspection — brokendown into sector, size, complexity, risk, etc.;
• Distribution of more or less environmentally friend-ly installations categorised according to a categori-sation scheme;
• Number of facilities with major, medium and minorlack of compliance;
• Number of infringements detected;
• Number of infringements in each field: air emis-sions, water, wastewater, solid waste, noise, safety,etc.;
• Number of accidents;
• Number of cases registered for appeals or com-plaints;
• Number of complaints per inspector filed againstinspectors.
Inspection and inspectionefficiency parameters• Number and length of routine inspections per spec-
ified type of installation — per inspector and/or pergroup of inspectors;
• Number of inspections conducted per year — on-site, desk study, total, occasioned by complaints,etc.;
• Number of inspections conducted (simple, complexand very complex);
• Deviation from planned frequencies of inspectionwithin different risk categories (i.e. high, medium,low) measured over a certain period of time;
• Number of “evidence-based” inspections (transgres-sion of limit values, accidents) per installation(fewer the better);
• Number of announced or unannounced site visits,broken down by low, medium and highly environ-mentally friendly installations;
• Quality of inspection reports;
• Number of samples collected, measurements madeand similar monitoring work;
• Authority enforcement actions of different kinds per“total inspection” and broken down by low, mediumand highly environmentally friendly installations;
• Number of warnings to facilities;
• Number of prohibition notices/orders issued;

A N N E X I V : I N S P E C T I O N I N D I C AT O R S
G U I D E L I N E S O N P R O G R E S S M O N I T O R I N G A N D B E N C H M A R K I N G 84
• Number of warrants issued (mandatory notifica-tions in dangerous situations);
• Number of orders;
• Number of cases reported to prosecution;
• Number of complaints from citizens successfullydealt with, relative to total complaints sent to theinspectorate.
Resource account parameters• Resources used per “total inspection” for similar
installations, but broken down by low, mediumand highly environmentally friendly installations;
• Average time used for each site visit (includingplanning, carrying out, reporting and following-up)for enterprises in different risk categories;
• Time saved by efficient coordination of the admin-istrative processes cutting the time between inspec-tion, inspection report and possibly prohibitionnotice, contravention processes and the applicationof fines;
• Total amount of fines received.
Qualification parameters• Inspectors’ level of education;
• Variety of professional qualifications found in theinspectorate;
• Percentage of the inspectors formally accreditedenvironmental auditors;
• Core competency of inspectors;
• Salary of the inspectors (highly influential on per-sonnel’s qualifications);
• Kind of employment contracts — including assur-ing inspectors’ independence;
• Resources for in-service training (also a budgetparameter);
• Turnover of inspectors in the inspectorate;
• Number of experts for one complex company;
• Number of contact persons for a company;
• Auditing of inspections (internal and external);
• Existence of a supporting competence centre;
• Number of working programmes and results;
• Methods of supervising the instructors by superiorsand prefixed administration levels;
• Quality and quantity of the office equipment;
• Quality and quantity of the technical equipment(for monitoring, etc.);
• Number of justified complaints against inspectors;
• Availability of quality standards or manuals.
Inspection system parameters• Simple, common risk-classification system for enter-
prises with discharge license;
• The Environmental Protection Operator and Pollu-tion Risk Appraisal (EA OPRA, by the EnvironmentAgency for England and Wales);
• Environmental risk screening. An adapted version ofEA OPRA used to classify the sites according to risk.The following attributes are considered: complexity,localisation, emissions to water, air and soil, environ-mental management and compliance;
• Assessment of inspectorate’s performance by numberof disturbance reports as a function of the level oflimit values — when there are “soft” limit values inconditions there should be as low a number ofreports as possible, but when there are “stringent”limit values in conditions a low number of reportsmay not be good;
• Independency of inspectorate and inspectors;
• Confidentiality of inspectorate and inspectors;
• Inspectorates’ establishment of performance indica-tors based on type and size of facilities in addition tothe type and number of inspections/audits undertak-en by individual regulators;
• Mechanisms of coordination with other central andregional environmental authorities in order toachieve know-how sharing;
• Multi-agency enforcement actions;
• Inspection “calibration” exercises, e.g. regular ses-sions where environmental inspectorates from Euro-pean countries are invited to describe how theywould handle and follow up different situations andfindings on site visits in a relevant business sector.The exercise should be followed by a workshopwhere the inspectors who participated discuss theanswers and try to reach a mutual understanding ofthe best way to handle the situations and findingsthat were put before them in the exercise.

A N N E X I V : I N S P E C T I O N I N D I C AT O R S
G U I D E L I N E S O N P R O G R E S S M O N I T O R I N G A N D B E N C H M A R K I N G 85
Permitting or efficientparameters• Number of facilities for permitting — IPPC/others;
• Number of permits — IPPC/others — prepared peryear per inspector or inspectorate;
• Time to grant a permit — IPPC/others — after allnecessary application documents are submitted;
• Total cost of preparing a permit — IPPC/others;
• Instructions for fast permit procedures;
• Number of spot tests of permits by predeterminedadministrations.
Decision parameters• Number of appeals against inspectorates’ decisions
— permits, licenses, orders etc.;
• Number of court procedures;
• Number of appeals rejected and heard by adminis-trative courts;
• Number and rate of corrections to inspectoratedecisions
Service parameters• Processing time (e.g. no. of days) from receiving an
application to signing a decision — e.g. a license;
• Meetings with stakeholders;
• Time taken to respond to correspondence/assessreports;
• Proportion of permits with and without participa-tion of public;
• Number of inspections of official files (citizens orlawyers);
• Quality and quantity of public relations (printmedia, websites, etc.);
• Results of queries from companies;
• Results of queries from citizens.
Inspection outcome parameters• The amount of pollution prevented as a result
of inspections;
• The amount of actual pollution prevented in relation to planned pollution prevented;
• The fact that prevention of pollution is planned andmonitored;
• The numbers of fields of inspection for which prevention of pollution is planned and monitored;
• Real state of the environment (water, air, soil, wasteetc.) as a result of the inspectorate’s work — andwith environment data published in annual reports with statistics, press releases etc.;
• Periodical national or regional reports with data onstate of the environment, including what is gettingbetter and what is getting worse, and outliningwhat the inspectorate plans to do, as well as whatothers in the surrounding society need to do.
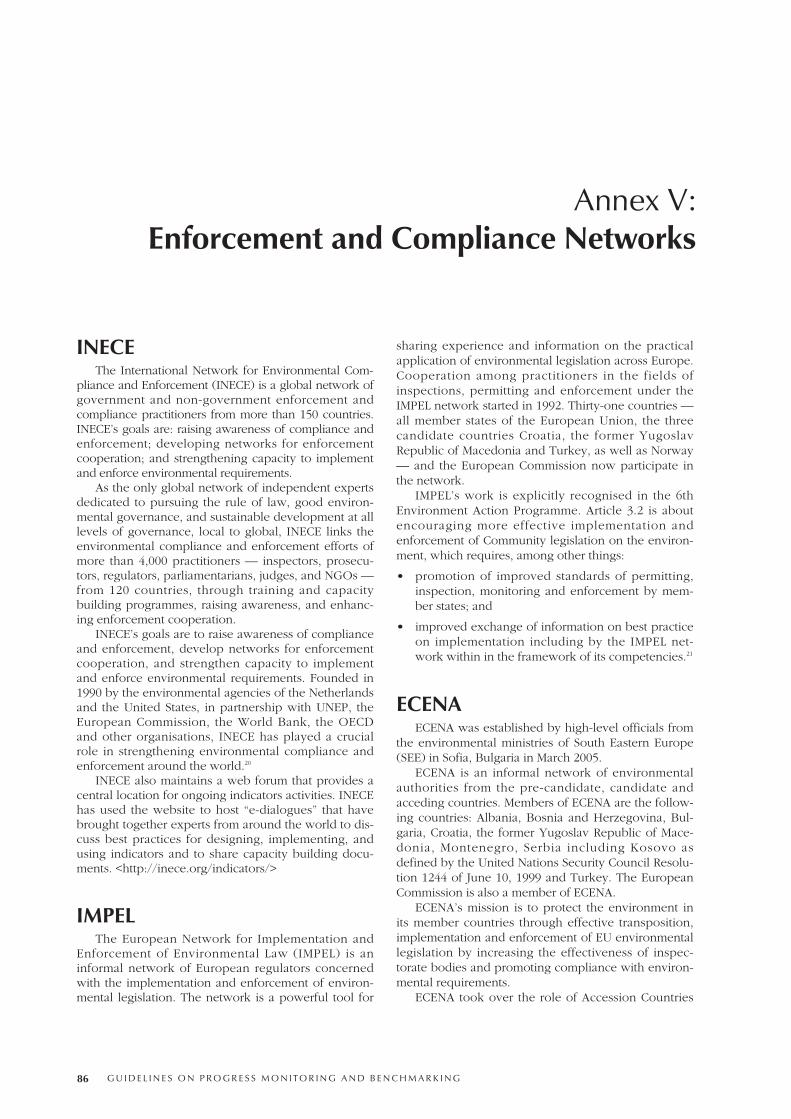
G U I D E L I N E S O N P R O G R E S S M O N I T O R I N G A N D B E N C H M A R K I N G 86
Annex V:Enforcement and Compliance Networks
INECEThe International Network for Environmental Com-
pliance and Enforcement (INECE) is a global network ofgovernment and non-government enforcement andcompliance practitioners from more than 150 countries.INECE’s goals are: raising awareness of compliance andenforcement; developing networks for enforcementcooperation; and strengthening capacity to implementand enforce environmental requirements.
As the only global network of independent expertsdedicated to pursuing the rule of law, good environ-mental governance, and sustainable development at alllevels of governance, local to global, INECE links theenvironmental compliance and enforcement efforts ofmore than 4,000 practitioners — inspectors, prosecu-tors, regulators, parliamentarians, judges, and NGOs —from 120 countries, through training and capacitybuilding programmes, raising awareness, and enhanc-ing enforcement cooperation.
INECE’s goals are to raise awareness of complianceand enforcement, develop networks for enforcementcooperation, and strengthen capacity to implementand enforce environmental requirements. Founded in1990 by the environmental agencies of the Netherlandsand the United States, in partnership with UNEP, theEuropean Commission, the World Bank, the OECDand other organisations, INECE has played a crucialrole in strengthening environmental compliance andenforcement around the world.20
INECE also maintains a web forum that provides acentral location for ongoing indicators activities. INECEhas used the website to host “e-dialogues” that havebrought together experts from around the world to dis-cuss best practices for designing, implementing, andusing indicators and to share capacity building docu-ments. <http://inece.org/indicators/>
IMPELThe European Network for Implementation and
Enforcement of Environmental Law (IMPEL) is aninformal network of European regulators concernedwith the implementation and enforcement of environ-mental legislation. The network is a powerful tool for
sharing experience and information on the practicalapplication of environmental legislation across Europe.Cooperation among practitioners in the fields ofinspections, permitting and enforcement under theIMPEL network started in 1992. Thirty-one countries —all member states of the European Union, the threecandidate countries Croatia, the former YugoslavRepublic of Macedonia and Turkey, as well as Norway— and the European Commission now participate inthe network.
IMPEL’s work is explicitly recognised in the 6thEnvironment Action Programme. Article 3.2 is aboutencouraging more effective implementation andenforcement of Community legislation on the environ-ment, which requires, among other things:
• promotion of improved standards of permitting,inspection, monitoring and enforcement by mem-ber states; and
• improved exchange of information on best practiceon implementation including by the IMPEL net-work within in the framework of its competencies.21
ECENAECENA was established by high-level officials from
the environmental ministries of South Eastern Europe(SEE) in Sofia, Bulgaria in March 2005.
ECENA is an informal network of environmentalauthorities from the pre-candidate, candidate andacceding countries. Members of ECENA are the follow-ing countries: Albania, Bosnia and Herzegovina, Bul-garia, Croatia, the former Yugoslav Republic of Mace-donia, Montenegro, Serbia including Kosovo asdefined by the United Nations Security Council Resolu-tion 1244 of June 10, 1999 and Turkey. The EuropeanCommission is also a member of ECENA.
ECENA’s mission is to protect the environment inits member countries through effective transposition,implementation and enforcement of EU environmentallegislation by increasing the effectiveness of inspec-torate bodies and promoting compliance with environ-mental requirements.
ECENA took over the role of Accession Countries

A N N E X V : E N F O R C E M E N T A N D C O M P L I A N C E N E T W O R K S
G U I D E L I N E S O N P R O G R E S S M O N I T O R I N G A N D B E N C H M A R K I N G 87
IMPEL (AC IMPEL). It is a logical continuation of thework of BERCEN.
ECENA operates under the framework of the stabili-sation and association process, the European Union’sstrategy for creating the conditions needed to integratethe countries of the region into European structures.
A cornerstone of this approach is the stabilisationand association agreement, which is a contractualagreement adapted to the specific context of eachcountry. This agreement offers a country the prospectof integration into the EU’s structures while settingthe political and economic conditions that must bemet. Environment is included as a key area for coop-eration. The SAP also sets political and economicconditions for the countries, as well as the need forregional cooperation.
ECENA facilitates, assists and promotes theenforcement of regulations throughout SEE by dissem-inating information, finding common denominators forcooperation and developing projects of common inter-est with the countries participating in the network.
REPINThe Regulatory Environmental Programme Imple-
mentation Network (REPIN) provides environmentalpolicy makers and practitioners from Eastern Europe,the Caucasus, and Central Asia (EECCA) with a plat-form for direct communication and partnership devel-opment with their counterparts from member states ofthe OECD, Central Europe, as well as with representa-tives of NGOs and the private sector. The approachtaken by REPIN aims to strike a balance betweeninter-governmental policy dialogue based on solidanalysis and supporting the achievement of practicalresults “on the ground.”
REPIN helps EECCA countries to adopt good prac-tices in such domains as design and use of environ-mental policy instruments, development of strategiesto ensure regulatory environmental compliance, andinstitutional capacity building. It supports the achieve-ment of qualitative targets (benchmarks) under Objec-tive No. 1 of the EECCA Environment PartnershipsStrategy. As requested by EECCA countries, the con-vergence of their regulatory systems with the princi-ples of the environmental acquis communautaire ofthe European Union is facilitated as well.
REPIN works under the umbrella of the Environ-mental Action Programme (EAP) Task Force, which inan inter-governmental body established in 1993 byEnvironment Ministers at the conference in Lucerne,Switzerland. Its members comprise the governments ofWestern, Central and Eastern Europe, North America,the Caucasus and Central Asia, international organisa-tions and financial institutions, business, and NGOs.
The Task Force secretariat is located at the OECD. TheTask Force works in conjunction with the ProjectPreparation Committee, a network of InternationalFinancial Institutions and donors that aims to accelerateenvironmental investments.22
AECENThe Asian Environmental Compliance and Enforce-
ment Network (AECEN) is a regional practitioner net-work of national and sub-national agencies from Asiancountries committed to improving environmental com-pliance and enforcement in Asia. AECEN’s mission is topromote improved compliance with environmentallegal requirements in Asia through regional exchangeof innovative policies and practices.
Network objectives are to: (1) promote the devel-opment and implementation of improved environmen-tal policies, laws, regulations, and institutional arrange-ments; (2) strengthen practitioner capacity throughspecialised training and skills development; and (3)facilitate regional sharing of best practices and informa-tion on strengthening compliance and enforcement.23
Irish Enforcement NetworkThe Office of Environmental Enforcement (OEE) in
conjunction with other public bodies with environmen-tal regulatory authority established an enforcement net-work in 2004. The participants include all local and pub-lic authorities, state agencies and government depart-ments with responsibilities for the implementation andenforcement of environmental legislation in Ireland.
The network’s objective is to foster cooperationbetween the various bodies involved in the enforce-ment of environmental legislation so that a higher andmore consistent standard of enforcement is achievedthroughout the country.
The Irish Enforcement Network:
• promotes the exchange of information and experi-ence and the development of greater consistency ofapproach in the implementation, application andenforcement of environmental legislation in Ireland; and
• provides a framework for policy makers, environ-mental inspectors and enforcement officers toexchange ideas, and encourages the developmentof enforcement structures and best practices.
The network considers issues on a priority basisand the initial tasks that it is focusing on include:
• developing effective communication channelsbetween all enforcement agencies;

A N N E X V : E N F O R C E M E N T A N D C O M P L I A N C E N E T W O R K S
G U I D E L I N E S O N P R O G R E S S M O N I T O R I N G A N D B E N C H M A R K I N G 88
• dealing with illegal dumping and unauthorisedwaste movement;
• improving the standard and consistency of enforce-ment of transfrontier shipment of waste and wastemovement within Ireland;
• implementation of the Recommendation of theEuropean Parliament and of the Council providingfor minimum criteria for environmental inspectionsin Member States (RMCEI);
• identifying training requirements (for enforcementstaff) and development of a Training Programme;
• prompt resolution of environmental complaints (EUand national);
• coordination of enforcement actions and on-goingidentification of priorities; and
• assistance with priority studies being undertakenby the Office of Environmental Enforcement.24

G U I D E L I N E S O N P R O G R E S S M O N I T O R I N G A N D B E N C H M A R K I N G 89
Annex VI:Major Tools and Methods for Assessment
of the Environmental Capacity Usedin the EU Accession Process
TABLE 13
TOOL/METHOD SHORT DESCRIPTION
Pre-accession Screening is the term used for “looking through” the Acquis Communautaire and comparing itscreening with the legislation in a candidate country undertaken by the European Commission jointly
with the candidate country. At the same time, it involves the identification of legal norms that are in compliance with the Acquis Communautaire, norms that need to be amended, and norms that need to be created. Screening helps to specify areas in which transition periods or exemptions will be necessary.
Progress monitoring — The regular progress reports are the main instrument for monitoring the progress process regular progress during the pre-accession period. The European Commission progress reports are prepared reports every year by the European Commission for each candidate country and they contain a
detailed analysis of the progress made by the candidate countries. The purpose of this exercisewas to identify issues to be discussed in more detail in the negotiations. In addition to the regular reports, the Commission prepares comprehensive monitoring reports once negotiations on accession are finalised.The additional reporting and assessing tool are progress monitoring reports, which areprepared within the progress monitoring project by the consultant annually as well on the basis of tables of concordance and implementation questionnaires provided by the candidate countries to the consultant.
EU peer reviews The overall objective of the peer review programme is to ascertain whether adequate administrative infrastructure and capacity are in place in order to ensure effectiveimplementation of the Acquis Communautaire (also in the area of environment). Peer reviews serve to assist acceding countries by pinpointing areas that require further strengthening of the administration; by making recommendations on how such strengthening could be achieved, helping to target the use of subsequent technical assistance; and, as an additional information input to the Commission’s on-going monitoring exercises.
Peer reviews coordinated and implemented by TAIEX involved the full participation of the concerned countries’ administrations, Commission Services and experts from member states. Peer reviews are also benchmarking exercise since recommendations are proposed based on reviewer’s practical experience with the issues and to great extent by comparing the systems.
Twinning Twinning is an initiative of the European Commission that was launched in 1998 in the context arrangements – of the preparation for enlargement of the European Union as the principal tool of pre-accession pre-accession assistance for institution building. It was an instrument for targeted administrativeassistance cooperation to assist candidate countries to strengthen their administrative and judicial for institution building capacity to implement Community legislation as future member states of the European Union.
Twinning provides the framework for administrations and semi-public organisations in the newmember states or candidate countries to work with their counterparts in member states. They jointly develop and implement a project that targets the transposition, enforcement and implementation of a specific part of the Acquis Communautaire. Twinning projects also involve benchmarking and comparing of the current situations in the candidate country with more advanced one. Benchmarking is very much needed particularly during the visits, study tours and working groups.
Major tools and methods for assessment of the environmental capacity used in the EU accession process
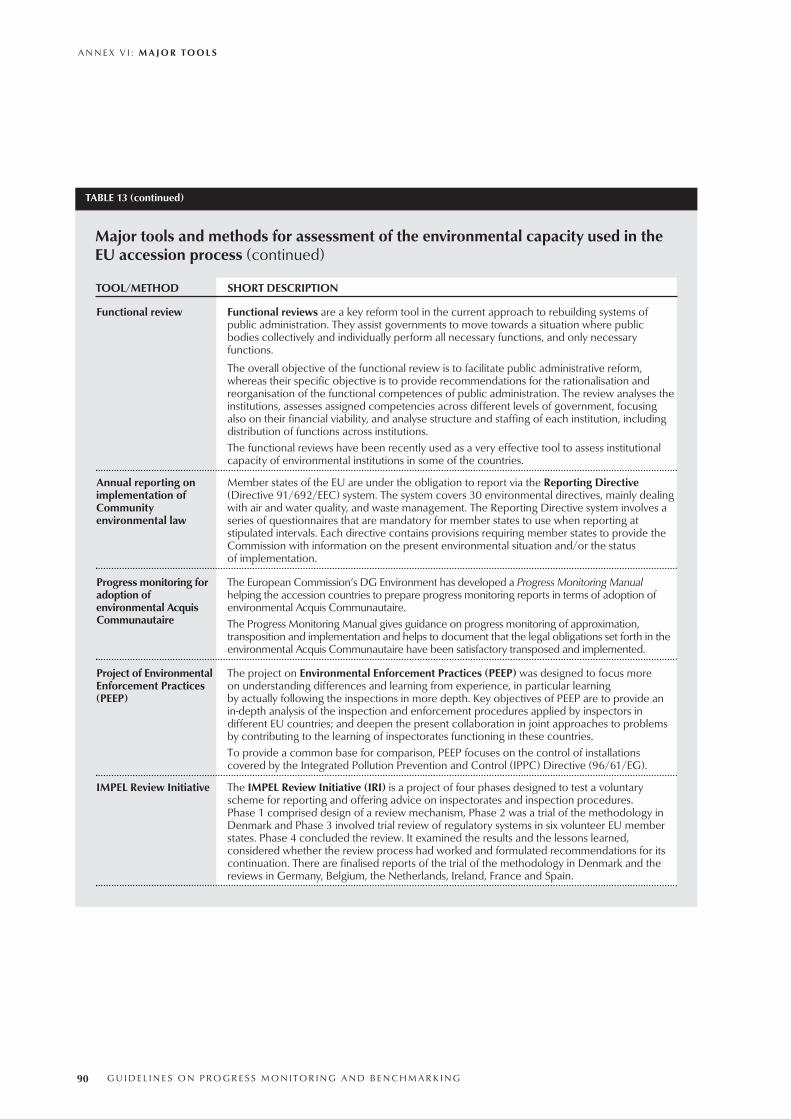
A N N E X V I : M A J O R T O O L S
G U I D E L I N E S O N P R O G R E S S M O N I T O R I N G A N D B E N C H M A R K I N G 90
TABLE 13 (continued)
TOOL/METHOD SHORT DESCRIPTION
Functional review Functional reviews are a key reform tool in the current approach to rebuilding systems of public administration. They assist governments to move towards a situation where public bodies collectively and individually perform all necessary functions, and only necessaryfunctions.
The overall objective of the functional review is to facilitate public administrative reform,whereas their specific objective is to provide recommendations for the rationalisation and reorganisation of the functional competences of public administration. The review analyses theinstitutions, assesses assigned competencies across different levels of government, focusing also on their financial viability, and analyse structure and staffing of each institution, including distribution of functions across institutions.The functional reviews have been recently used as a very effective tool to assess institutional capacity of environmental institutions in some of the countries.
Annual reporting on Member states of the EU are under the obligation to report via the Reporting Directiveimplementation of (Directive 91/692/EEC) system. The system covers 30 environmental directives, mainly dealingCommunity with air and water quality, and waste management. The Reporting Directive system involves aenvironmental law series of questionnaires that are mandatory for member states to use when reporting at
stipulated intervals. Each directive contains provisions requiring member states to provide the Commission with information on the present environmental situation and/or the statusof implementation.
Progress monitoring for The European Commission’s DG Environment has developed a Progress Monitoring Manual adoption of helping the accession countries to prepare progress monitoring reports in terms of adoption of environmental Acquis environmental Acquis Communautaire. Communautaire The Progress Monitoring Manual gives guidance on progress monitoring of approximation,
transposition and implementation and helps to document that the legal obligations set forth in theenvironmental Acquis Communautaire have been satisfactory transposed and implemented.
Project of Environmental The project on Environmental Enforcement Practices (PEEP) was designed to focus more Enforcement Practices on understanding differences and learning from experience, in particular learning (PEEP) by actually following the inspections in more depth. Key objectives of PEEP are to provide an
in-depth analysis of the inspection and enforcement procedures applied by inspectors in different EU countries; and deepen the present collaboration in joint approaches to problems by contributing to the learning of inspectorates functioning in these countries.To provide a common base for comparison, PEEP focuses on the control of installations covered by the Integrated Pollution Prevention and Control (IPPC) Directive (96/61/EG).
IMPEL Review Initiative The IMPEL Review Initiative (IRI) is a project of four phases designed to test a voluntary scheme for reporting and offering advice on inspectorates and inspection procedures. Phase 1 comprised design of a review mechanism, Phase 2 was a trial of the methodology in Denmark and Phase 3 involved trial review of regulatory systems in six volunteer EU member states. Phase 4 concluded the review. It examined the results and the lessons learned, considered whether the review process had worked and formulated recommendations for its continuation. There are finalised reports of the trial of the methodology in Denmark and the reviews in Germany, Belgium, the Netherlands, Ireland, France and Spain.
Major tools and methods for assessment of the environmental capacity used in theEU accession process (continued)

A N N E X V I : M A J O R T O O L S
G U I D E L I N E S O N P R O G R E S S M O N I T O R I N G A N D B E N C H M A R K I N G 91
TABLE 13 (continued)
TOOL/METHOD SHORT DESCRIPTION
IMPEL reports on These voluntary reports are required by the European Parliament and Council minimum criteria on Recommendation 2001/331/EC providing for minimum criteria for environmental inspections.environmental Member states report to the Commission on their experience of the operation of this inspections in EU recommendation using, to the extent possible, any data available from regional and local member states inspecting authorities. Member states inform the Commission of the implementation of this
recommendation together with details of environmental inspection mechanisms already existing or foreseen.IMPEL supports the principle and implementation of this recommendation on minimum inspection criteria for environmental inspections, the purpose of which is to ensure that environmental inspection tasks are carried out in member states according to minimum criteria, thereby strengthening compliance with Community environmental law and contributing to a more consistent implementation and enforcement of that law.
BERCEN/ECENA Exchange programmes are tools that enables exchange of experience on practical issues exchange programmes related to implementation of environmental legislation. The exercise also enables practical
comparison of countries enforcement systems with other countries seeing improvement in performance.
EEA core set of The European Environmental Agency developed a core set of indicators (37 indicators) as the indicators key information provider on environmental issues at the European level. The goals of indicators
are the following:
• provide a manageable and stable basis for indicator reporting by the EEA on the web and in its indicators-based reports;
• prioritise improvements in the quality and geographical coverage of data flows, especially priority data flows of the European environment information and observation network (Eionet);
• streamline EEA/Eionet contributions to other European and global indicator initiatives, e.g. structural indicators and sustainable development indicators.Indicators measure developments in selected issues, including progress towards agreed targets.They are based on ready available and routinely collected data for EEA countries within aspecified timescale (to be determined country by country) at reasonable cost-benefit ratios. The indicators are consistent in space coverage and cover all or most of EEA countries. They are primarily national in scale and representative for countries (countries benchmarking).
Other EU tools Short-term technical assistance of TAIEX,
Special studies – e.g. Study on Administrative Capacity for Implementation and Enforcement of EU Environmental Policy in the 13 Candidate Countries (2000, ECOTEC) prepared for DG Environment, and the Report on Environmental Policy Integration in Europe: Administrative Culture and practices (2005, EEA);
Informal contacts and meetings: Informal Meeting of Environment Ministers from Candidate Countries to discuss sustainable development with Commission and Presidency on July 12, 2002.LIFE Third Countries 2004: The EC funds environment projects in third countries – LIFE Third Countries is part of the LIFE programme. Established in 1992, LIFE is the EU’s financial instrument supporting environmental and nature conservation projects throughout the EU, in candidate countries and in some neighbouring regions. The general objective of LIFE is to contribute to the development and implementation of EU environmental policy by financing specific actions. The objective of the LIFE Third Countries programme is to help establish capacity and administrative structures, and to assist in the development of environmental policies and action programmes in third countries bordering on the Mediterranean and the Baltic Sea (other than the countries of Central and Eastern Europe which have concluded Association Agreements with the European Community).
Major tools and methods for assessment of the environmental capacity used in the EU accession process (continued)

G U I D E L I N E S O N P R O G R E S S M O N I T O R I N G A N D B E N C H M A R K I N G 92
Core environmental indicators The OECD pressure–state–response framework
helps decision makers understand the interconnectionof environmental, economic, and social indicators. TheOECD regularly publishes core environmental indica-tors which cover both environmental and socio-eco-nomic issues — for example, sectoral trends in trans-
port and energy consumption, agricultural activity, cli-mate change, waste prevention, and biodiversity, orspending by OECD countries to achieve such environ-mental goals as improved water and wastewater infra-structure. OECD environment ministers approved aheadline set of key environmental indicators in 2001.
The OECD core set of environmental indicators is acommonly agreed upon minimum set of indicators for
Annex VII:OECD Environmental Indicators
TABLE 14
Structure of OECD indicators core set by environmental issue
1. Climate change
2. Ozone layer depletion
3. Eutrophication
4. Acidification
5. Toxic contamination
6. Urban environmental quality
7. Biodiversity
8. Cultural landscapes
9. Waste
10. Water resources
11. Forest resources
12. Fish resources
13. Soil degradation
14. Material resources
15. Socio-economic, sectoral and general indicators
PRESSUREIndicators ofenvironmental pressures
STATEIndicators ofenvironmentalconditions
RESPONSEIndicators of societalresponsesMAJOR ISSUES
Key Environmental Indicators (KEI)

A N N E X V I I : O E C D E N V I R O N M E N TA L I N D I C AT O R S
G U I D E L I N E S O N P R O G R E S S M O N I T O R I N G A N D B E N C H M A R K I N G 93
OECD countries and for international use, publishedregularly. It is a first step in tracking environmentalprogress and the factors involved in it, and it is a majortool for analysing environmental policies and measur-ing environmental performance. Characteristics of thecore set are that:
• It is of limited size: around 40 to 50 core indicatorscommon to a majority of OECD countries and com-mon to different sets of indicators serving differentpurposes.
• It covers a broad range of environmental issues.
• It reflects an approach common to a majority ofOECD countries.
It thus provides a base of comparable informationthat is useful to respond to common policy goals andto which countries can add to suit their circumstances.Most core indicators can be calculated on the basis ofenvironmental data collected regularly by the OECDSecretariat from national authorities through the ques-tionnaire on the state of the environment and fromother OECD and international sources. These data are
processed, harmonised and their quality checked with countries.
To respond to the increasing interest by membercountries in a reduced number of indicators selectedfrom existing larger sets to capture key trends anddraw public attention to key issues of common con-cern, a small set of key environmental indicators hasbeen selected from the OECD core set. In May 2001,this set has been endorsed by environment ministers ofOECD countries for systematic use in the OECD’s com-munication and policy work.
These key indicators have been very useful incharting environmental progress and their selectionhas benefited from experience gained in using envi-ronmental indicators in the OECD’s country environ-mental performance reviews. Like other indicator lists,the list of key indicators is neither final, nor exhaustive;it has to be seen together with other indicators fromthe OECD core set, and will evolve as knowledge anddata availability improve.
Ultimately, the set is expected to also include keyindicators for issues such as toxic contamination, landand soil resources, and urban environmental quality.
TABLE 15
OECD set of key environmental indicators
Climate change
Ozone layer
Air quality
Waste generation
Freshwater quality
Natural resources and assets
Freshwater resources
Forest resources
Fish resources
Energy resources
Biodiversity
CO2 emission intensities
Indices of apparent consumption ofozone depleting substances (ODS)
SOx and NOx emission intensities
Municipal waste generation intensities
Wastewater treatment connection rates
Intensity of use of water resources
Intensity of use of forest resources
Intensity of use of fish resources
Intensity of energy use
Threatened species
Index of greenhouse gas emissions
Same, plus aggregation into one index of apparent consumption of ODS
Population exposure to air pollution
Total waste generation intensities
Pollution loads to water bodies
Same plus sub-national breakdown
Same
Same plus closer link to available resources
Energy efficiency index
Species and habitat or ecosystems
AVAILABLE INDICATORSPOLLUTION ISSUES MEDIUM TERM INDICATORS

A N N E X V I I : O E C D E N V I R O N M E N TA L I N D I C AT O R S
G U I D E L I N E S O N P R O G R E S S M O N I T O R I N G A N D B E N C H M A R K I N G 94
Sectoral environmentalindicators (SEI)
The OECD has been developing sets of sectoralindicators to better integrate environmental concernsinto sectoral policies. The objective is to develop a“tool kit” for sectoral decision makers, which shouldfacilitate the integration of environmental concerns insectoral policy making. While limited to a specific sec-tor and its interactions with the environment, theseindicators are typically developed in larger numbersthan the core set.
Based on experience to date, a small number ofcore indicators are being included in the OECD coreset of environmental indicators.
Sectoral indicator sets are not restricted to “environ-mental indicators” per se, but also concern linkagesbetween the environment and the economy, placed ina context of sustainable development. They mayinclude environmental indicators (e.g. pollutant emis-sions), economic indicators (e.g. sectoral output, pricesand taxes, subsidies) and selected social indicators.
Indicators to measuredecoupling of environmentalpressures from economicgrowth (DEI)
Indicators to measure decoupling of environmentalpressures from economic growth are regularlyreleased, and are being further developed. New workbegan in 2004 on methodology and data collection on
material flows in OECD countries, following a 2003request from G8 heads of state and government andthe adoption of an OECD Council Recommendation onthe issue.
Decoupling indicators measure the decoupling ofenvironmental pressure from economic growth over agiven period. In conjunction with other indicators usedin OECD policy analysis and country reviews. They arevaluable tools for determining whether countries areon track towards sustainable development. They fur-ther support the evaluation of environmental perfor-mance and monitor the implementation of the OECDEnvironmental Strategy for the first decade of the 21stcentury.
Many of the variables that feature in decouplingindicators also appear in the concepts of resource effi-ciency, resource intensity, and resource productivity.For example, resource efficiency and resource intensi-ty are calculated as ratios of resource use to economicvalue-added, while resource productivity is theinverse ratio.
Decoupling is usually conceived as an elasticityfocusing on changes in volumes, whereas efficiencyand intensity are more concerned with the actual val-ues of these ratios. Which usage is chosen dependson the context and, often, on the audience beingaddressed.
Most DEIs are derived from other indicator sets,mainly sectoral and core environmental indicators, andfrom environmental accounts, and further brokendown to reflect underlying drivers and structuralchanges. Work so far has sought to establish an analyti-cal basis to facilitate consensus by member countrieson a list of indicators to be used in OECD peer reviews.
TABLE 16
Framework of OECD set of sectoral indicators
Indirect pressures anddriving forces
Sector related:
• Resource use
• Pollutant and waste generation
• Risk and safety issues
• Related effects and resulting environmental conditions
• Selected direct responses
Sector related:
• Environmental damage
• Environmental expenditure
• Taxation and subsidies
• Price structures
• Trade aspects
• Regulatory and social instruments
INTERACTIONS WITH THEENVIRONMENT
SECTORAL TRENDS ANDPATTERNSOF ENVIRONMENTALSIGNIFICANCE
ECONOMIC AND POLICY ASPECTS

A N N E X V I I : O E C D E N V I R O N M E N TA L I N D I C AT O R S
G U I D E L I N E S O N P R O G R E S S M O N I T O R I N G A N D B E N C H M A R K I N G 95
It has also identified gaps in the statistical and scientificdata needing to be filled.
Two major groups of decoupling indicators cover-ing various environmental issues have been explored:
• macro-level decoupling indicators that relate to thedecoupling of environmental pressures from totaleconomic activity with a focus on climate change,air pollution, water quality, waste disposal, materialand natural resource use; and
• sector specific decoupling indicators that focus onproduction and use in specific sectors: such asenergy, transport, agriculture and manufacturing.
In order to better understand how environmentaland economic forces and trends interact, an economy-based vision of the environment to 2020 was devel-oped through the first OECD Environmental Outlook,released in 2001.

G U I D E L I N E S O N P R O G R E S S M O N I T O R I N G A N D B E N C H M A R K I N G 96
IntroductionBenchmarking — the process of identifying and
learning from best practices in other organisations — isa powerful tool in the quest for continuous improve-ment and performance breakthroughs. The authors andsponsors have produced this European Code of Con-duct to guide benchmarking encounters and toadvance the professionalism and effectiveness ofbenchmarking in Europe. It is closely based on thewidely used APQC/SPI Code of Conduct promoted bythe International Benchmarking Clearinghouse, and theauthors gratefully acknowledge this source. The word-ing has been modified to take into account the rules ofEuropean Union competition law. The layout and pre-sentation have been modified to provide a more posi-tive chronological approach.
Adherence to this Code will contribute to efficient,effective and ethical benchmarking.
1. Principle of Preparation1.1. Demonstrate commitment to the efficiency and
effectiveness of benchmarking by being preparedprior to making an initial benchmarking contact.
1.2. Make the most of your benchmarking partner’stime by being fully prepared for each exchange.
1.3. Help your benchmarking partners prepare by pro-viding them with a questionnaire and agendaprior to benchmarking visits.
1.4. Before any benchmarking contact, especially thesending of questionnaires, take legal advice.
2. Principle of Contact2.1. Respect the corporate culture of partner organi-
sations and work within mutually agreed procedures.
2.2. Use benchmarking contacts designated by the partner organisation if that is its preferred procedure.
2.3. Agree with the designated benchmarking contacthow communication or responsibility is to bedelegated in the course of the benchmarkingexercise. Check mutual understanding.
2.4. Obtain an individual’s permission before provid-ing their name in response to a contact request.
2.5. Avoid communicating a contact’s name in openforum without the contact’s prior permission.
3. Principle of Exchange3.1. Be willing to provide the same type and level of
information that you request from your bench-marking partner, provided that the principle oflegality is observed.
3.2. Communicate fully and early in the relationship toclarify expectations, avoid mis-understanding, andestablish mutual interest in the benchmarkingexchange.
3.3. Be honest and complete.
4. Principle of Confidentiality4.1. Treat benchmarking findings as confidential to the
individuals and organisations involved. Suchinformation must not be communicated to thirdparties without the prior consent of the bench-marking partner who shared the information.When seeking prior consent, make sure that youspecify clearly what information is to be shared,and with whom.
4.2. An organisation’s participation in a study is confi-dential and should not be communicated external-ly without their prior permission.
5. Principle of Use5.1. Use information obtained through benchmarking
only for purposes stated to and agreed with thebenchmarking partner.
5.2. The use or communication of a benchmarkingpartner’s name with the data obtained or the prac-tices observed requires the prior permission ofthat partner.
5.3. Contact lists or other contact information providedby benchmarking networks in any form may notbe used for purposes other than benchmarking.
Annex VIII:The European Benchmarking
Code of Conduct

A N N E X V I I I : T H E E U R O P E A N B E N C H M A R K I N G
G U I D E L I N E S O N P R O G R E S S M O N I T O R I N G A N D B E N C H M A R K I N G 97
6. Principle of Legality6.1. If there is any potential question on the legality
of an activity, you should take legal advice.6.2. Avoid discussions or actions that could lead to
or imply an interest in restraint of trade, marketand / or customer allocation schemes, price fix-ing, bid rigging, bribery, or any other anti-com-petitive practices. Don’t discuss your pricing pol-icy with competitors.
6.3. Refrain from the acquisition of information byany means that could be interpreted as improperincluding the breach, or inducement of a breach,of any duty to maintain confidentiality.
6.4. Do not disclose or use any confidential informa-tion that may have been obtained throughimproper means, or that was disclosed by anoth-er in violation of a duty of confidentiality.
6.5. Do not, as a consultant, client or otherwise passon benchmarking findings to another organisa-tion without first getting the permission of yourbenchmarking partner and without first ensuringthat the data is appropriately “blinded” andanonymous so that the participants’ identities areprotected.
7. Principle of Completion7.1. Follow through each commitment made to your
benchmarking partner in a timely manner.7.2. Endeavour to complete each benchmarking
study to the satisfaction of all benchmarkingpartners as mutually agreed.
8. Principle of Understanding andAgreement8.1. Understand how your benchmarking partner
would like to be treated, and treat them in that way.
8.2. Agree how your partner expects you to use theinformation provided, and do not use it in anyway that would break that agreement.
OriginsThis Code of Conduct is the result of a consulta-
tion and development process co-ordinated by ThePerformance Improvement Group with the help ofThe Eurocode Working Group. The Eurocode Work-ing Group comprises senior Benchmarking managersand legal representatives from the following organi-sations: BT, Department of Trade and Industry (UK),European Foundation for Quality Management, IFSInternational, KPMG Peat Marwick (USA), Shell Inter-
national, Siemens, The Benchmark Network, ThePost Office.
Contributions were also gratefully received fromthe following: American Productivity and QualityCenter, British Quality Foundation, Prudential Assur-ance, Swedish Institute of Quality, Strategic PlanningInstitute, The Benchmarking Centre UK, The Bench-marking Club Italy, The Law Society, The QualityNetwork.
Important NoticeThis Code of Conduct is not a legally binding doc-
ument. Though all due care has been taken in itspreparation, the authors and sponsors will not beheld responsible for any legal or other action result-ing directly or indirectly from adherence to this Codeof Conduct. It is for guidance only and does notimply protection or immunity from the law.
Benchmarking ProtocolBenchmarkers:
• Know and abide by the European BenchmarkingCode of Conduct.
• Have basic knowledge of benchmarking and fol-low a benchmarking process.
Should have:
• Determined what to benchmark.
• Identified key performance variables to study.
• Recognised superior performing organisations.
• Completed a rigorous internal analysis of theprocess to be benchmarked before initiating con-tact with potential benchmarking partners.
• Prepare a questionnaire and interview guide, andshare these in advance if requested.
• Possess the authority to share and are willing toshare information with benchmarking partners.
• Work through a specified contact and mutuallyagreed arrangements.
When the benchmarking process proceeds to aface-to-face site visit, the following behaviours areencouraged:
• Provide meeting agenda in advance.
• Be professional, honest, courteous and prompt.
• Introduce all attendees and explain why they arepresent.

A N N E X V I I I : T H E E U R O P E A N B E N C H M A R K I N G
G U I D E L I N E S O N P R O G R E S S M O N I T O R I N G A N D B E N C H M A R K I N G 98
• Adhere to the agenda.
• Use language that is universal, not one’s own jargon.
• Be sure that neither party is sharing proprietary orconfidential information unless prior approval hasbeen obtained by both parties, from the properauthority.
• Share information about your own process, and, if asked, consider sharing study results.
• Offer to facilitate a future reciprocal visit.
• Conclude meetings and visits on schedule.
• Thank your benchmarking partner for sharing theirprocess.
Benchmarking with CompetitorsThe following guidelines apply to both partners in
a benchmarking encounter with competitors or poten-tial competitors:
• In benchmarking with competitors, ensure compli-ance with competition law.
• Always take legal advice before benchmarking withcompetitors. (Note: When cost is closely linked toprice, sharing cost data can be considered to be thesame as price sharing).
• Do not ask competitors for sensitive data or causethe benchmarking partner to feel they must providesuch data to keep the process going.
• Do not ask competitors for data outside the agreedscope of the study.
• Consider using an experienced and reputable thirdparty to assemble and “blind” competitive data.
• Any information obtained from a benchmarkingpartner should be treated as you would treat anyinternal, confidential communication. If “confiden-tial” or “proprietary” material is to be exchanged,then a specific agreement should be executed toindicate the content of the material that needs to beprotected, the duration of the period of protection,the conditions for permitting access to the material,and the specific handling requirements that arenecessary for that material.
OwnershipThis document has open ownership, and may be
freely reproduced and distributed to further the causeof good benchmarking practice. If you reproduce theCode of Conduct, print it in its entirety, giving credit tothe members of the Eurocode working group whocontributed their time and expertise without cost. Any-one requiring further information or wishing to partici-pate in the Eurocode Working Group should contact:
Robin Walker, The Performance Improvement Group,
The Old Vicarage, Offenham, Evesham WR11 5RLTel: (44-7974) 919-175, Fax: (44-1386) 40703
E-mail: [email protected]

G U I D E L I N E S O N P R O G R E S S M O N I T O R I N G A N D B E N C H M A R K I N G 99
1. Environmental Benchmarking for ICT Industries, SynthesisReport, Noel Duffy et al, 2003.
2. Environmental Benchmarking for Local Authorities: FromConcept to Practice, Agathe Bolli et al, European Environ-mental Agency, 2001.
3. Ibid.
4. Benchmarking on Quality Parameters for EnvironmentalInspectorates, IMPEL Workshop in Copenhagen, Septem-ber 8-9, 2005
6. INECE, Performance Measurement Guidance for Compli-ance and Enforcement Practitioners. 2005. Availableonline at http://inece.org/indicators/guidance.pdf.
7. Durwood Zaelke, et al, Eds., Making Law Work: Environ-mental Compliance & Sustainable Development. Seehttp://inece.org/mlw/Chapter11_IndicatorsForMeasuring-Compliance.pdf.
8. Michael Stahl, Using Indicators to Lead EnvironmentalCompliance and Enforcement Programs. Available onlineat http://inece.org/conference/7/vol1/32_Stahl.pdf.
9. Information based on the Peer Review performed inMarch 2006.
10. Information based on the Peer Review performed in June2006.
11. Based on summary paper presented by the Croatian dele-gation at the ECENA Exchange Programme that took placein Cluj in October 2005.
12. Information based on the Peer Review performed in Febru-ary 2006.
13. Information based on the Peer Review performed in Octo-ber 2005.
14. The tables are taken from a presentation by Daniela Floreaand Michaela Beu during the ECENA Exchange Pro-gramme in Cluj, October 2005.
15. Interview with Mihaela Beu, Regional Chief Commissar –Regional Commissariat Cluj.
16. These examples are provided by the INECE Secretariat.
17. The Government Performance and Results Act (GPRA)requires all federal programmes to develop and publishgoals, objectives, and performance indicators. Seewww.whitehouse.gov/omb/mgmt-gpra/gplaw2m.html forthe text of GPRA.
18. Most of the examples are taken from the IMPEL report onBenchmarking for Quality Parameters in EnvironmentalInspectorates.
19. The indicators in italics are quantitative.
20. Both graphs have been taken from the Three Year Corpo-rate Plan April 2005 – March 2008 of the Scottish Environ-ment Protection Agency (SEPA).
21. Environmental Performance Reviews (1st Cycle) Conclu-sions and Recommendations 32 Countries (1993-2000).OECD Working Party on Environmental Performance
22. www.inece.org
23. Marrakech Statement from the 7th International Confer-ence
24. http://ec.europa.eu/environment/impel/about.htm#intro-duction
25. REPIN website:www.oecd.org/document/56/0,2340,en_2649_34339_26502584_1_1_1_1,00.html
26. Taken from AECEN’s website <www.aecen.org>
27. Taken from www.epa.ie
Endnotes

G U I D E L I N E S O N P R O G R E S S M O N I T O R I N G A N D B E N C H M A R K I N G 100
1. AusAID , The Logical Framework Approach, October, 2005.
2. Danish Ministry of Finance, Benchmarking in the Public Sector, 2000
3. Directive 96/61/EC concerning integrated pollution prevention and control (IPPC Directive)
4. Durwood Zaelke et al, Making Law Work: EnvironmentalCompliance & Sustainable Development,http://inece.org/mlw/Chapter11_IndicatorsForMeasuring-Compliance.pdf
5. EC Communication, Benchmarking: Implementation of anInstrument Available to Economic Actors and Public Authorities, April 1997
6. EC DG Employment, Social Affairs and equal Opportunities,Promoting Benchmarking within Local Employment Development ( LED), December, 2005
7. EC, Progress Monitoring of Approximation. Progress Monitoring Manual. Version 18 October, 2005.
8. ECENA Peer Review of Albanian Enforcement and Compliance System, March 2006
9. ECENA Peer Review of Croatian Enforcement and Compliance System, June 2006
10. ECENA Peer Review of Macedonian Enforcement and Compliance System, February 2006
11. ECENA Peer Review of Serbian Enforcement and Compliance System, October 2005
12. EEA, Agathe Bolli et al, Environmental Benchmarking forLocal Authorities: from Concept to Practice, January 2001
13. EU Recommendation on Minimum Criteria for Environmental Inspections (RMCEI)
14. The European Benchmarking Code of Conduct
15. IMPEL, Benchmarking on Quality Parameters for Environmental Inspectorates, Report from IMPEL Workshop in Copenhagen, 8-9 September, 2005
16. INECE, Brochure on Measuring Performance, ManagingResources, Improving Decision-Making,
17. INECE, Performance Measurement Guidance for Compliance and Enforcement Practitioners, 2005,http://inece.org/indicators/guidance.pdf
18. IMPEL, Management Reference Book for EnvironmentalInspectorates, November 2003
19. Interview with Mihaela Beu, Regional Chief Commissar-Regional Commissariat Cluj, 2006
20. Marrakech Statement from the 7th International Conference,9-15 April, 2005
21. Michael Stahl, Performance Indicators for EnvironmentalCompliance and Enforcement Programs, Presentation toAECEN, June 2006
22. Michael Stahl, Using Indicators to Lead Environmental Compliance and Enforcement Programs,http://inece.org/conference/7/vol1/32_Stahl.pdf
23. Michaela Beu and Daniela Florea, Presentation during theECENA Exchange Programme, Cluj, October, 2005
24. Michael Zangle, The European Union Benchmarking Experience- From Euphoria to Fatigue. EU Integration OnlinePapers, VOL.8 , ( 2004) No.5
25. Noel Duffy et al, Environmental Benchmarking for ICT Industries, Synthesis Report, 2003
26. OECD Environmental Outlook, 2001
27. OECD, Performance Management in Government, Occasional Paper, 1996
28. OECD, INECE, Expert Workshop on Environmental Compli-ance and Enforcement Indicators, Paris, 3-4 November, 2003
29. OECD, The Roadmap to Benchmarking Business Processes,2001
30. Palmer Development Group, Development of Core set ofEnvironmental Performance Indicators – Final Report and Set of Indicators. March 31, 2004
31. Scottish Environment Protection Agency (SEPA), Three YearCorporate Plan April 2005 – March 2008
32. Summary paper presented by the Croatian delegation at theECENA Exchange Programme, Cluj, October, 2005
33. USDA, A Guide to Implementation and Benchmarking forRural Communities, 1998
34. US EPA .Monitoring Guidance for the National Estuary Program. EPA842-B-92-004
35. The World Bank, Monitoring and Evaluation: Some Tools and Methods, 2004
Websites36. About: Management, http://management.about.com
37. Asia Environmental Compliance and Enforcement Network,www.aecen.org
38. The Benchmarking Plus, www.benchmarkingplus.com.au
39. The Brussels Environment, www.ibgebim.be
40. Eco SMEs, http://ex-elca2.bologna.enea.it
Bibliography

B I B L I O G R A P H Y
G U I D E L I N E S O N P R O G R E S S M O N I T O R I N G A N D B E N C H M A R K I N G 101
41. Government Performance Results Act of 1993, www.white-house.gov/omb/mgmt-gpra/gplaw2m.html
42. IMPEL website,http://ec.europa.eu/environment/impel/about.htm#intro-duction
43. INECE, www.inece.org
44. INECE Web Forum on Environmental Compliance and Performance Indicators, www.inece.org/indicators/
45. Irish Environmental Protection Agency, www.epa.ie
46. Office of Government Commerce, www.ogc.gov.uk
47. The Public Sector Benchmarking Service, www.benchmarking.gov.uk
48. REPIN website,www.oecd.org/document/56/0,2340,en_2649_34339_26502584_1_1_1_1,00.html
49. Six Sigma, www.isixsigma.com
50. Wikipedia, http://en.wikipedia.org/wiki/Benchmarking


THE REGIONAL ENVIRONMENTAL CENTER FOR CENTRAL AND EASTERN
EUROPE (REC) is a non-partisan, non-advocacy, not-for-profit international or-
ganisation with a mission to assist in solving environmental problems in Cetral
and Eastern Europe (CEE). The center fulfils this mission by promoting cooperation
among non-governmental organisations, governments, businesses and other en-
vironmental stakeholders, and by supporting the free exchange of information and
public participation in environmental decision making.
The REC was established in 1990 by the United States, the European Commission
and Hungary. Today, the REC is legally based on a charter signed by the govern-
ments of 28 countries and the European Commission, and on an international
agreement with the government of Hungary. The REC has its head office in Szen-
tendre, Hungary, and country offices and field offices in 17 beneficiary countries,
which are: Albania, Bosnia and Herzegovina, Bulgaria, Croatia,
the Czech Republic, Estonia, Hungary, Latvia, Lithuania, the former Yugoslav
Republic of Macedonia, Montenegro, Poland, Romania, Serbia,
Slovakia, Slovenia and Turkey.
Recent donors are the European Commission and the governments of Austria,
Belgium, Bosnia and Herzegovina, Bulgaria, the Czech Republic, Croatia, Den-
mark, Estonia, Finland, Germany, Hungary, Italy, Japan, Latvia, Lithuania, the
Netherlands, Norway, Poland, Slovakia, Slovenia, Sweden, Switzerland, the
United Kingdom, and the United States, as well as other inter-governmental and
private institutions.
Guidelines on Progress Monitoring and Benchmarking