GUIDELINES of UI GREENMETRIC - Mahidol University: …€¦ · The UI GreenMetric World University...
22
UI GREENMETRIC WORLD UNIVERSITY RANKING GUIDELINE 2015
Transcript of GUIDELINES of UI GREENMETRIC - Mahidol University: …€¦ · The UI GreenMetric World University...
UI GREENMETRIC
WORLD UNIVERSITY RANKING
GUIDELINE
2015
Page 1 of 22
ABOUT GREENMETRIC
UI’s GreenMetric University Sustainability Ranking (GreenMetric) is a world university
ranking for universities to assess and compare campus sustainability efforts.UI has taken
the initiative to create a world university ranking to measure campus sustainability efforts.
The UI GreenMetric World University Ranking was established in 2010 with the intention
of creating an online survey of the current conditions and policies intended to make
campuses ‘greener’ or more sustainable in universities around the world.
We based the ranking broadly on the conceptual framework of Environment, Economy,
and Equity. The ranking indicators and categories are intended to be relevant to all. We
have designed the indicators and weightings to be as free of bias as possible. The work of
collecting and submitting data is relatively straightforward and does not make
unreasonable demands on staff time.
Around a hundred universities from 36 countries took part in the 2010 version of Green
Metric: 18 from the Americas, 35 from Europe, 40 from Asia and two from Australasia. A
significant number of participating institutions were prestigious and high ranking. They
included: University of California, Berkeley, University of Nottingham, York University,
Northeastern University, Cornell University, and Washington University In St. Louis. We
estimate that this year we can treble the number of participants and are encouraged to see
many more prestigious institutions already signing up.Our view of what the ranking might
achieve started relatively modestly. The ranking was simply intended to serve as an
awareness raising mechanism. However, encouraged by the results from the first year of
operation of Green Metric, we now see that it may make a more significant contribution.
Until its latest edition, the ranking has ranked301 universities from 61 countries around the
world
Our theme this year is carbon footprint. We improve our methodology by adding criteria
(i.e. sub-indicators that related to energy and climate change, water, and transportation),
adjusting scoring and weighting the criteria in 2015 ranking.
1. Users and stakeholders
It is intended as an entry-level means of assessment for higher education institutions (HEIs)
around the globe.
It should also be of interest to governments, international and local environmental agencies, and
society.
2. Objectives
The ranking has a number ofprimary objectives:
it is open to global participation;
Page 2 of 22
it is accessible to HEIs in both the developed and developing world;
it should contribute to academic discourse on sustainability in education and the
greening of campuses;
it should encourage university-led social change with regard to sustainability goals.
3. Benefits of participation
Universities which participate in GreenMetric by submitting their data to be included in the
ranking can expect to enjoy a number of benefits:
a. Internationalization and recognition
Participation in GreenMetric can help the university’s efforts at internationalization and
recognition by getting its sustainability efforts on the map. Participation in GreenMetric
is accompanied by increased hits to the university website, more mentions of the
institution connected with the issue of sustainability on web pages, and an increase in
correspondence with institutions which are interested in your organization.
b. Awareness raising of sustainability issues
Participation can help to raise awareness in the university and beyond about the
importance of sustainability issues. The world faces unprecedented civilizational
challenges such as population trends, global warming, overexploitation of natural
resources, oil-dependent energy, water and food shortages and sustainability. We realize
that higher education has a crucial role to play in addressing these challenges.
GreenMetric leverages the crucial role that HEIs can play in raising awareness by
helping assess and compare efforts at education for sustainable development,
sustainability research, campus greening, and social outreach.
c. Social change and action
GreenMetric is primarily about awareness raising, but in future it will be adapted to
encourage real change. Understanding needs to shift to action if we are to address
emerging global challenges.
4. Influences on the setup of GreenMetric
The decision to establish GreenMetric was influenced by a number of factors:
a. Idealism
Future challenges to civilization include population pressure, climate change, energy
security, environmental degradation, water and food security and sustainable
development. Despite much scientific research and public discussion, governments
around the world have yet to commit to a sustainable agenda. Concerned people at
Universitas Indonesia see that universities have a privileged position to help develop a
consensus on key areas for action. This includes such concepts as the Triple Bottom
Page 3 of 22
Line, the 3 Es: Equity, Economy, Environment, Green Building, and Education for
Sustainable Development (ESD).
b. Existing models
GreenMetric was not based on any one existing ranking system. It was however
developed with awareness of a number of existing sustainability assessment systems and
academic university rankings. Sustainability systems that were referred to during the
design phase of GreenMetric included: The Holcim Sustainability Awards, GREENSHIP
(the rating system recently developed by the Green Building Council of Indonesia which
itself was based on the Leadership in Energy and Environmental Design (LEED) system
used in the U.S. and elsewhere), The Sustainability, Tracking, Assessment and Rating
System (STARS) and The College Sustainability Report Card (also known as the Green
Report Card).
Meanwhile, university academic ranking systems that were studied during the design
phase of GreenMetric included: the Times Higher Education World University
Rankings(THE) sponsored by Thompson Reuters, the QS World University Rankings,
the Academic Ranking of World Universities (ARWU) published by Shanghai Jiao Tong
University (SJTU), and the Webometrics Ranking of World Universities (Webometrics),
published by Cybermetrics Lab, CINDOC-CSIC in Spain. UI has been one of the member
of International Ranking Expert Group (IREG) Observatory since 2011.
c. Realities and challenges
The goal of creating a world university sustainability ranking was done with an
understanding that the diversity of types of universities, their missions and their
contexts would pose problems for the methodology. In particular, we were aware that
universities differ with regard to levels of awareness and commitment to sustainability,
to their budgets, the amount of green cover on their campuses and many other
dimensions. These issues are complex but GreenMetric is committed to continually
improving the ranking so that it will be both useful and fair to all.
d. Expert advisory
During the early stages of the design of GreenMetric we sought assistance on the issues
from experts in both ranking and in sustainability.These included the holding of a
conference on university ranking and video conferences and expert meetings on
sustainability and green building. The latest workshop on UI GreenMetric was held on
November 21st 2013, in which rectors and representatives from the following universities
share their experiences, i.e University of Nottingham, Università Ca’ Foscari Venezia,
University of Melbourne, Mahidol University, Universitat fur Bodenkultur Wien,
Universidad Autónoma de Nuevo Leon, Kasetsart University, King Mongkut’s University
of Technology Thonburi, Da Yeh University, Universiti Teknologi Malaysia.
Page 4 of 22
5. The Ranking Team
GreenMetric is presently run by a small team reporting directly to the University’s
Rector.The team members have a variety of backgrounds but are all committed to making
GreenMetric fit for purpose.The working teams are assisted by a number of experts at the
university. These include experts in ecology, sustainability, anthropology, engineering,
architecture and urban design, statistics and so on.
6. Methodology
a. The philosophy behind the rankings
We based our instrument on a broad philosophy that encompasses the three E’s:
Environment, Economics, Equity and Education.
b. The criteria
We selected criteria that are generally thought to be of importance by universities
concerned with sustainability. These include the collection of a basic profile of the size of
the university and its zoning profile, whether urban, suburban, rural. Beyond this we
want to see the degree of green space. The next category of information concerns
electricity consumption because of its link to our carbon footprint. Then we want to
know about transport, water usage, waste management and so on. Beyond these
indicators, we want to get a picture about how the university is responding to or dealing
with the issue of sustainability through policies, actions, and communication. In the
first version of the methodology, used in 2010, 23 indicators were used within the five
categories to calculate the ranking scores. In 2011, 34 indicators were used.Then in 2012
we leave the indicator of “smoke free and drug free campus environment” and used 33
indicators to evaluate the green campus. In 2012, we also categorize the indicators into 6
category including education criteria. One change being considered is the formation of a
new category for sustainability education and research.
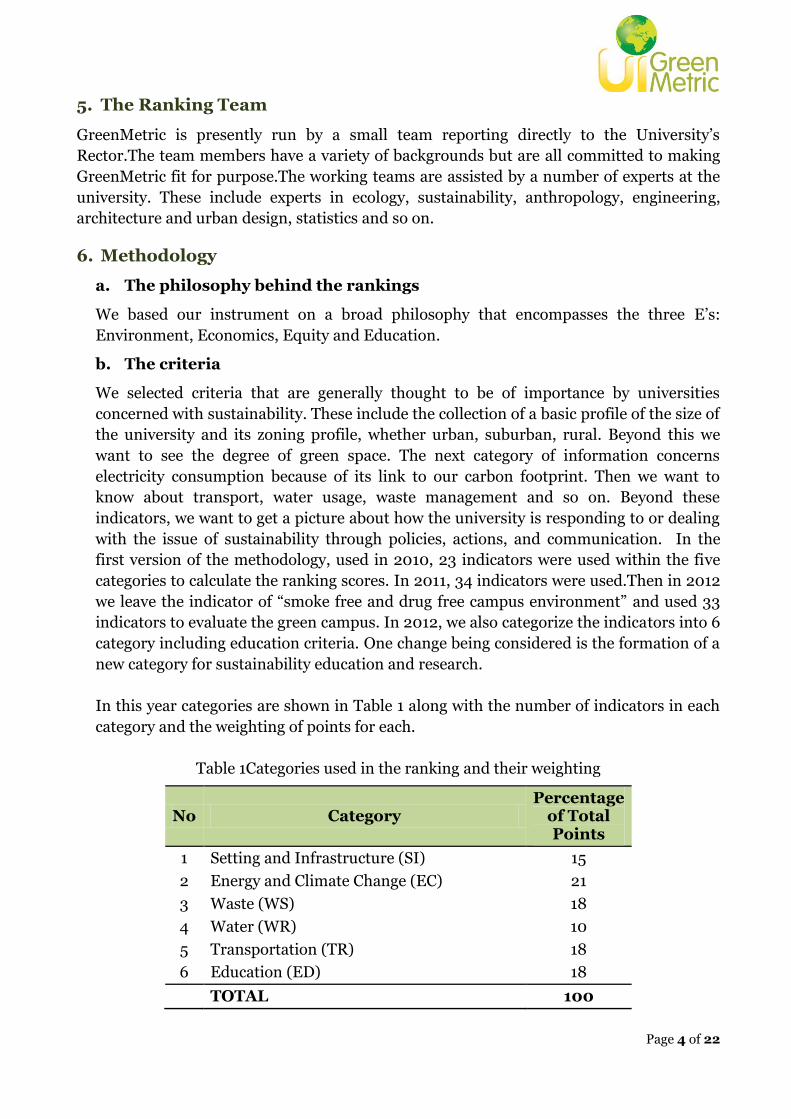
In this year categories are shown in Table 1 along with the number of indicators in each
category and the weighting of points for each.
Table 1Categories used in the ranking and their weighting
No Category Percentage
of Total Points
1 Setting and Infrastructure (SI) 15
2 Energy and Climate Change (EC) 21
3 Waste (WS) 18
4 Water (WR) 10
5 Transportation (TR) 18
6 Education (ED) 18
TOTAL 100

Page 5 of 22
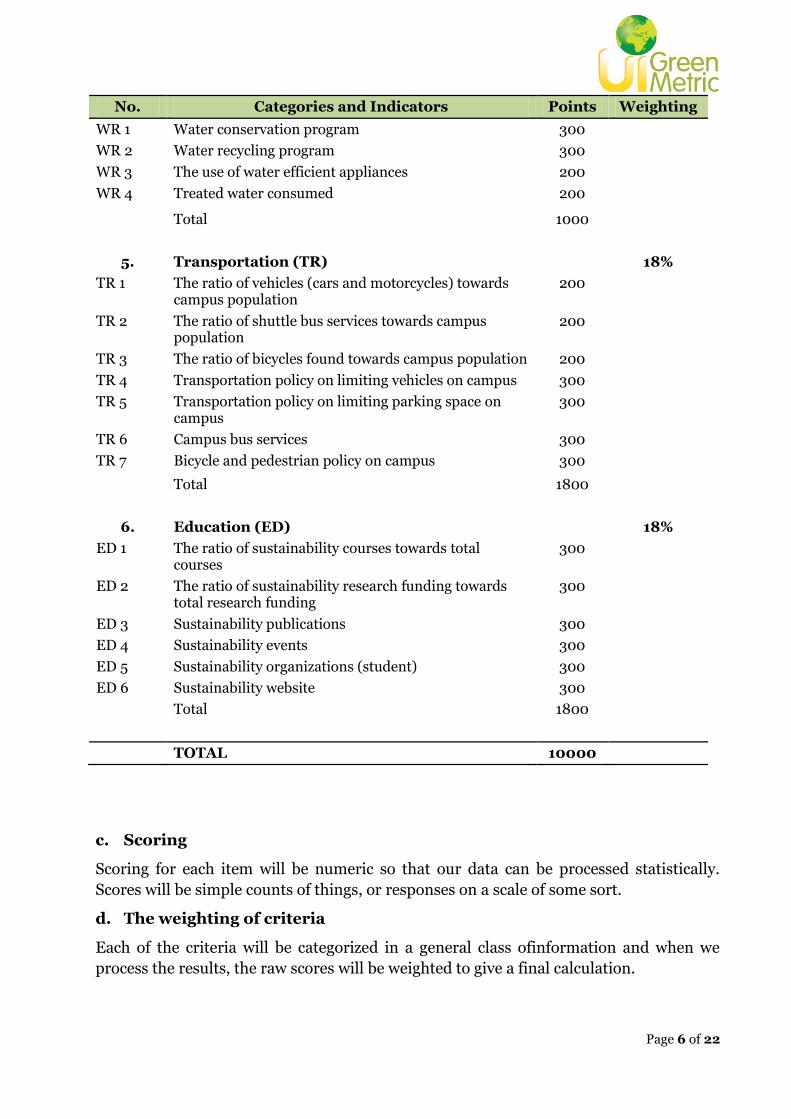
The specific indicators and the points awarded for indicators in each section are shown
in Table 2. Each indicator has been uniquely identified by a category code and a number
(e.g. SI 5).
Table 2 Indicators and categories suggested for use in the 2015 ranking
No. Categories and Indicators Points Weighting
1. Setting and Infrastructure (SI) 15%
SI 1 The ratio of open space area towards total area 300
SI 2 The ratio of open space area towards campus population
300
SI 3 Area on campus covered in forested vegetation 200
SI 4 Area on campus covered in planted vegetation 200
SI 5 Area on campus covered in non-retentive surfaces 300
SI 6 University budget for sustainable effort 200
Total 1500
2. Energy and Climate Change (EC) 21%
EC 1a Energy efficient appliances usage 200
EC 1b Smart building program implementation 100
EC 2 Renewable energy usage policy 300
EC 3 The ratio of total electricity usage towards campus population
200
EC 4 Energy conservation program 300
EC 5 Element of green building implementation 300
EC 6 Climate change adaptation and mitigation program 300
EC 7a Greenhouse gas emission reduction policy 100
EC 7b Carbon footprint policy 100
EC 7c The ratio of total carbon footprint towards campus population
200
Total 2100
3. Waste (WS) 18%
WS 1 Recycling program for university waste 300
WS 2 Toxic waste recycling 300
WS 3 Organic waste treatment (garbage) 300
WS 4 Inorganic waste treatment (rubbish) 300
WS 5 Sewerage disposal 300
WS 6 Policy to reduce the use of paper and plastic in campus 300
Total 1800
4. Water (WR) 10%
Page 6 of 22
No. Categories and Indicators Points Weighting
WR 1 Water conservation program 300
WR 2 Water recycling program 300
WR 3 The use of water efficient appliances 200
WR 4 Treated water consumed 200
Total 1000
5. Transportation (TR) 18%
TR 1 The ratio of vehicles (cars and motorcycles) towards campus population
200
TR 2 The ratio of shuttle bus services towards campus population
200
TR 3 The ratio of bicycles found towards campus population 200
TR 4 Transportation policy on limiting vehicles on campus 300
TR 5 Transportation policy on limiting parking space on campus
300
TR 6 Campus bus services 300
TR 7 Bicycle and pedestrian policy on campus 300
Total 1800
6. Education (ED) 18%
ED 1 The ratio of sustainability courses towards total courses
300
ED 2 The ratio of sustainability research funding towards total research funding
300
ED 3 Sustainability publications 300
ED 4 Sustainability events 300
ED 5 Sustainability organizations (student) 300
ED 6 Sustainability website 300
Total 1800
TOTAL 10000
c. Scoring
Scoring for each item will be numeric so that our data can be processed statistically.
Scores will be simple counts of things, or responses on a scale of some sort.
d. The weighting of criteria
Each of the criteria will be categorized in a general class ofinformation and when we
process the results, the raw scores will be weighted to give a final calculation.

Page 7 of 22
e. Refining and improving the research instrument
While we have put every effort into the design and implementation of the questionnaire,
we realize that this third year roundis bound to have shortcomings. Therefore, we will be
reviewing the criteria and the weightings continuously to reflect input from participants
and state of the art developments in the field. We welcome your comments and input.
f. Data collection
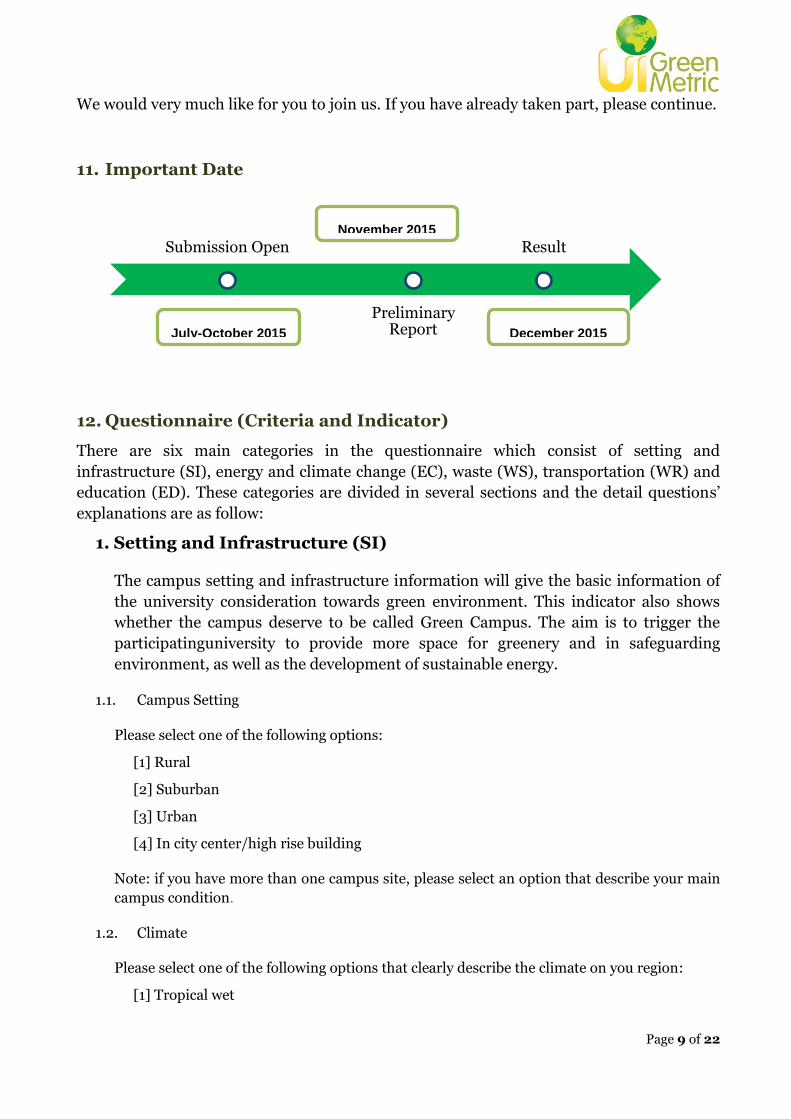
Data will be collected through online system between July-October 2015from the
universities we have contacted and who are willing to provide information.
g. Initial results
The preliminary result of the metrics is expected to be collectedin November 2015, and
final complete result will be released in December 2015.
7. Participation
The number of universities that have provided data in order to take part has shown a
growth trend. In the first year in 2010, Green Metric published the ranking for 95
institutions from among all those that submitted data. In the second year, the number
published in the ranking was 178. The number of participant in the fourth year is 301
universities. On its latest edition, the number of participant was 360 and the came from 62
countries around the world.
Page 8 of 22
The ranking results and the detailed scores can both be found at:
http://greenmetric.ui.ac.id/ranking/year/2014
We are targeting 500 participants this year, from every region in the world.
8. Networking and partnerships
This idealism surrounding awareness of sustainability issues is now generating a network
of likeminded organizations. UI is a member of the International Ranking Experts Group
(IREG) and a signatory to UN Commitments such as that on Sustainable Practices of
Higher Education Institutions for the Rio 2012 Conference on Sustainable Development.
We have also presented our progress at the International Sustainable Campus Network
(ISCN) – GULF-WEF Symposium 2012, together with other Data Monitoring and
Evaluation of Sustainability in Higher Education Report such as the College Sustainability
Green Report Card and GRI. UI GreenMetric also has been presented at the Quality
Education Conference in Universidad Autónoma de Nuevo Leon, Mexico, on October 2013
and the Sustainability, University Ranking Conference at the Università Ca’ Foscari
Venezia, Italy, November 2013. Various articles, magazines, Journal papers, university and
institution webpages cited and referred UI GreenMetric evaluation and result. In 2014, III
Asian Universities Forum organized by Al-Farabi Kazakh National University, in
Astana&Almaty, endorsed UI GreenMetric to be used as a tool to evaluate university
sustainability achievement.
9. Future plans
A new version of GreenMetric should be developed to take into consideration how better to
achieve its own goals, how to learn from constructive criticism about rankings and the
advancement of ESD, and how to learn from the diverse experience of participants with
their different goals and in different settings. Among the ideas under consideration for
possible future innovations in the ranking are:
Better university profiling: universities create a profile based on their unique
mission, objectives, typological features and context.
Category focused results: scores are provided not just as a single aggregate but
separately for the main ranking categories and indicators.
10. How to take part
Submitting data for the ranking is relatively easy and is currently done on line. There is no
fee for taking part.
If you wish to take part, we will provide you with a password that gives you access to the
data submission area on our website:
http://greenmetric.ui.ac.id/backend/index.php/login
Page 9 of 22
We would very much like for you to join us. If you have already taken part, please continue.
11. Important Date
12. Questionnaire (Criteria and Indicator)
There are six main categories in the questionnaire which consist of setting and
infrastructure (SI), energy and climate change (EC), waste (WS), transportation (WR) and
education (ED). These categories are divided in several sections and the detail questions’
explanations are as follow:
1. Setting and Infrastructure (SI)
The campus setting and infrastructure information will give the basic information of
the university consideration towards green environment. This indicator also shows
whether the campus deserve to be called Green Campus. The aim is to trigger the
participatinguniversity to provide more space for greenery and in safeguarding
environment, as well as the development of sustainable energy.
1.1. Campus Setting
Please select one of the following options:
[1] Rural
[2] Suburban
[3] Urban
[4] In city center/high rise building
Note: if you have more than one campus site, please select an option that describe your main
campus condition.
1.2. Climate
Please select one of the following options that clearly describe the climate on you region:
[1] Tropical wet
July-October 2015
November 2015
December 2015
Submission Open
Preliminary Report
Result

Page 10 of 22
[2] Tropical wet and dry
[3] Semiarid
[4] Arid
[5] Mediterranean
[6] Humid subtropical
[7] Marine west coast
[8] Humid continental
[9] Subarctic
1.3. Type of higher education institution
Please select one of the following options:
[1] Comprehensive
[2] Specialized higher education institution
1.4. Number of campus sites
Please state the number of separate locations in which your university has buildings for
academic purposes. For example if your university has some campuses in different districts,
towns or cities which are separated from the main campus, please state the total number of
your university locations.
1.5. Total campus area (meter square)
Please state the total areas of your campuses (in square meter). It is expected that the total
area counted are only those in which academic activities are being conducted. Forest and
fields and other areas can only be counted if it is being used for academic purposes. If you
have separate location for university forest, please do not count this as your campus area.
1.6. Total ground floor area of buildings (meter square)
The green area of your university will be calculated from the percentage of green area of your
university. Please provide the information of the area occupied by buildings, by providing the
total area of the first floor part of your university buildings.
1.7. Number of students including part time and full time students
The total number of students (full time and part time) registered at your university. If your
university has calculated the Effective Full Time Students (EFTS) number, you are welcome
to submit this number.
1.8. Number of academic and administrative staff
Please state the total number of lecturers and administrative staff working in your university.
1.9. Area on campus covered in vegetation in the form of forest
Page 11 of 22
Please provide the percentage of the area on campus covered in vegetation in the form of
forest to the total campus area.
1.10. Area on campus covered in planted vegetation
Please provide the percentage of the area on campus covered in planted vegetation (include
lawns, gardens, green roofs, internal planting) to the total campus area.
1.11. Area of non retentive surfaces on campus for water absorption
Please provide the percentage of non retentive surfaces (eg. earth, grass, concrete block, etc.)
in your campus for water absorption as percentage to the total site area. The larger water
absorption area is desirable.
1.12. University budget for sustainability effort
Please provide the percentage calculation of the environment and sustainability budget to the
total university budget.
2. Energy and Climate Change (EC)
The university’s attention to the use of energy and climate change issues is the
indicator with the highest weighting in this ranking. In our questionnaire we define
several indicators for this particular area of concern, i.e. energy efficient appliances
usage, the implementation of smart building/automation building/intelligent
building, renewable energy usage policy, total electricity use, energy conservation
program, elements of green building, climate change adaptation and mitigation
program, greenhouse gas emission reductions policy and carbon footprint. Within
these indicators, university is expected to increase the effort in energy efficiency on
their building and to care more about nature and energy resources.
2.1a. Energy efficient appliances usage are replacing conventional appliances
Energy efficient appliances usages are replacing conventional appliances. This is also extent
to the use of energy efficient appliances/lighting fixtures (e.g. the use of energy star-rating for
electronic devices, LED light bulb).
Please select one of the following options:
[1] Conventional, if your university is still using conventional equipments/ways in all
energy-based appliances in your university.
[2] Partly replaced, if your university has conducted some effort to replace energy
appliances with the more efficient appliances, such as lamps, water heaters, etc. Some
equipment replacement with better and more efficient appliances have already taken
place.
[3] Fully employed, if energy efficient appliances have been fully employed in your
university.
2.1b. Smart Building program implementation
Page 12 of 22
Please provide the stage of smart building program in your university. This is defined as the
existence of formalized effort in applying the program in order to accommodate all of energy
efficient appliances usage. Please select one of the following options:
[1] No program
[2] Program in preparation
[3] Program in initial implementation
[4] Program implemented with some problem
[5] Program in full implementation
Smart Building can be defined as the use of networked technology, embedded within
architecture to monitor and control elements of the architecture for exchange of information
between users, systems and buildings. If any of your university building applied this concept,
you can choose “Smart Building” in the questionnaire. We are aware that in LEED standard,
there is “Energy and Atmosphere” element that accommodate smart building concept, so you
can choose “Smart Building” in the questionnaire if you have LEED certificate.
2.2. Renewable energy usage policy
Please select one or more of the following alternative energy sources used in your campus:
[1] None
[2] Bio Diesel
[3] Clean Biomass
[4] Solar Power
[5] Geothermal
[6] Wind Power
[7] Hydropower
2.3. Electricity usage per year
Please provide the total energy used in the last 12 months in your entire university (in Kilo
Watt Hour/KWH) used for all purposes such as lighting, heating, cooling, running university
laboratories, etc.
2.4. Energy conservation program
Please provide the stage of the energy conservation programs in your university. This is
defined as the existence of formalized effort in encouraging members of the campus
community to reduce energy use. Please select one of the following options:
[1] No program
[2] Program in preparation
[3] Program in initial implementation
[4] Program implemented with some problem
Page 13 of 22
[5] Program in full implementation
2.5. Elements of green building implementation as reflected in all construction and renovation
policy
Please provide information on the elements of green building implementation as reflected in
the construction and renovation policy in your university. Please select one or more that apply
of the following list:
[1] None. Please select this option if there is no green building implementation in your
university.
[2] Natural Ventilation.Please select this option if natural ventilation is used in your
university for air circulation purposes.
[3] Full-Day Natural Lighting. Please select this option if natural light is encouraged to be
used for daily source of lighting during the day time whenever possible.
[4] Building Efficiency. Please select this option if your university considers building
efficiency less than 35% for circulation (the movement of people in building).
2.6. Climate change adaptation and mitigation program
Please select a condition which reflects the current stage of your university program on the
following options:
[1] No program
[2] Program in preparation
[3] Program in initial implementation
[4] Program implemented with some problem
[5] Program in full implementation
2.7a. Greenhouse gas emission reductions policy
Please select a condition which reflects the current condition of your university in providing
formal policy to reduce greenhouse gas emissions on the following options:
[1] No policy
[2] Policy in preparation
[3] Policy in initial implementation
[4] Policy implemented with some problem
[5] Policy in full implementation
2.7b. Do you calculate your campus yearly carbon emission?
Please select a condition which reflects the current condition of your university in calculating
the carbon emission of the university:
[1] No
[2] Yes

Page 14 of 22
2.7c. If you answer yes in 2.7b, please provide total carbon footprint (CO2 emission in the last 12
months, in metric tons).
Please provide the total carbon footprint in your university if you answer ‘yes’ in the question
2.7b. Please fill in this question with ‘0 (zero)’ if you answer ‘no’ in question 2.7b. Please
exclude carbon footprint from flights and secondary carbon sources such as dishes and
clothes. You can use carbon footprint calculator fromwww.carbonfootprint.com as the
standard of carbon footprint calculation, please visit the website to see elements of carbon
footprint that you can count.
3. Waste (WS)
Waste treatment and recycling activities are major factors in creating a sustainable
environment. The activities of university staff and students in campus will produce a
lot of waste, therefore some programs and waste treatments should be among the
concern of the university, i.e. recycling program, toxic waste recycling, organic waste
treatment, inorganic waste treatment, sewerage disposal, policy to reduce the use of
paper and plastic in campus.
3.1. Recycling program for university waste
Please select a condition which reflects the current condition of your university policy led
effort to encourage staff and students to recycle waste, from the following options:
[1] None
[2] Partial
[3] Extensive
3.2. Toxic waste handled
Please select a condition which reflects the current condition onhow your university
handlestoxic wastes.The handling process includes whether toxic wastes are dealt separately,
for example by classifying and handling it over to third party or certified handling companies.
Please select one of the following options:
[1] Not managed
[2] Partly contained and inventoried
[3] Completely contained, inventoried and handled
3.3. Organic waste treatment
The method of organic waste (e.g. garbage, discarded vegetable and plant matter) treatment
in your university. Please select an option that best describe your university overall treatment
of the bulk of your organic waste:
[1] Open dumping
[2] Partly composted
[3] Partly composted and the compost are dumped
Page 15 of 22
[4] Fully composted and the compost are used
3.4. Inorganic waste treatment
Please describe the method of inorganic waste (e.g. rubbish, trash, discarded paper,
plastic, metal, etc.) treatment in your university. Please select an option that best
describes your university overall treatment of the bulk of your inorganic waste:
[1] Burned in open
[2] Taken off campus to a dump site
[3] Partially recycled
[4] Fully recycled
3.5. Sewerage disposal
Please describe the primary method of sewerage treatment in your university. Please
select an option that best describes how the bulk of your sewerage is disposed of:
[1] Disposed untreated to waterways
[2] Treated individually in septic tank
[3] Centralized treatment before disposal
[4] Treatment for reuse
3.6. Policy to reduce the use of paper and plastic in campus
Please select a condition which reflects the current condition of your university in
providing formal policy to reduce the use of paper and plastic from the following options:
[1] No policy
[2] Policy in preparation
[3] Policy in initial implementation
[4] Policy implemented with some problem
[5] Policy in full implementation
Page 16 of 22
4. Water (WR)
Water use in campus is another important indicator in GreenMetric. The aim is that
universities can decrease water usage, increase conservation program, and protect the
habitat. Water conservation program, water recycling program, water efficient
appliances usage, and treated water consumed are among the criteria.
4.1. Water conservation program
Please select a condition which describes your current stage program, which has a
systematic and formalized program that support water conservation program (e.g. for lake
and lake management system) in your university, from the following options:
[1] No program
[2] Program in preparation
[3] Program in initial implementation
[4] Program implemented with some problem
[5] Program in full implementation
4.2. Water recycling program
Please select a condition which reflects the current condition of your university in
providing formal policy for water recycling program (e.g. the use of recycled water for
toilet flush, car wash, plants irrigation). Please select an option that describes your
program at current stage:
[1] No program
[2] Program in preparation
[3] Program in initial implementation
[4] Program implemented with some problem
[5] Program in full implementation
4.3. Water efficient appliances usage
Water efficient appliances usages are replacing conventional appliances. This is also
extent to the use of water efficient appliances (e.g. using censored/automated hand
washing tap, high efficient toilet flush). Please select one of the following options:
[1] Conventional, if your university is still using conventional equipments/ways in all
water appliances in your university.

Page 17 of 22
[2] Partly replaced, if your university has conducted some effort to replace water
appliances with the more efficient appliances. Some equipment replacement with
better and more efficient appliances have already taken place.
[3] Fully employed, if water efficient appliances have been fully employed in your
university.
4.4. Treated water consumed
Please indicate the percentage of treated water consumed (e.g. piped water and rain water
tank source) from utility or piped system as a percentage of all water consumed sources in
your university.
5. Transportation (TR)
Transportation system plays an important role on the carbon emission and pollutant
level in university. Transportation policy to limit the number of motor vehicles in
campus, the use of campus bus and bicycle will encourage a healthier environment. The
pedestrian policy will encourage students and staff to walk around campus, and avoid
using private vehicle. The use of environmentally friendly public transportation will
decrease carbon footprint around campus.
5.1a. Number of shuttle bus operatedin your university
Please provide the number of shuttle buses operated in your university.
5.1b. Average passengers of each shuttle bus
Please provide the average passengers of each shuttle bus in one trip.
5.1c. Total trips for shuttle bus service each day
Please provide the total trips for shuttle bus service each day.
5.1d. Number of cars owned by your university
Please provide the number of car owned by your university.
5.2a. Number of cars entering the university daily
Please provide the average number of cars that enter your university daily based on
balanced sample, e.g. considering term and holiday periods.
5.2b. Number of motorcycles entering the university daily
Please provide the average number of motorcycles that enter your university daily based
on balanced sample, e.g. considering term and holiday periods.
5.3. Number of bicycles that are found on campus on an average day

Page 18 of 22
Please provide the average number of bicycles found around the campus daily which
include both those owned by the university and privately owned bikes.
5.4. Transportation policy designed to limit the number of motor vehicles used on campus
Please select a condition which reflects the current condition of your university on the
availability of transportation policy designed to limit the number of motor vehicles used
on campus. Please expressed as stage of implementation of that policy from the following
options:
[1] No policy
[2] Policy in preparation
[3] Policy in initial implementation
[4] Policy implemented with some problem
[5] Policy in full implementation
5.5. Transportation policy designed to limit or decrease the parking area on campus
Please select a condition which reflects the current condition of your university on the
availability of transportation policy designed to limit or decrease the parking area on
campus. Please select an option that best describe your university from the following
options:
[1] No policy
[2] Policy in preparation
[3] Policy in initial implementation
[4] Policy implemented with some problem
[5] Policy in full implementation
5.6. Campus buses
Please describe the condition of the availability of buses for journeys within the campus
and whether the ride is free or charged. Please select an option from the following options:
[1] Not available
[2] Available (paying service)
[3] Available (free service)
5.7. Bicycle and pedestrian policy on campus
Reflects the extent to which use of bicycle or walking is supported. Please select one or
more options from the following list that apply to your campus:
Page 19 of 22
[1] Bicycle use not possible or practical
[2] No policy but bicycle use not discourage
[3] Bicycle provide by university
[4] University providesbicycle track
[5] University providespedestrian way
5.8. The approximate travel distance of a vehicle each day inside campus only(in kilometers)
Please provide approximate travel distance of a vehicle (e.g. bus, car, motorcycle) each day
inside campus only in kilometers.
6. Education (ED)
6.1. Number of courses related to environment and sustainability offered
The number of courses related to environment and sustainability offered at your
university. Some universities have already tracked on how many courses available for this.
The definition of the extent to which a course can be stated to be related to environment,
sustainability, or both, can be define according to your university situation. If a course
contributes in more than a minor or passing way to increasing awareness, knowledge, or
action related to Environment and Sustainability, then it counts.
6.2. Total number of courses offered
The total number of all courses provided at your university yearly. This information will be
used to calculate to what extend environment and sustainability education has been
defined in your university teaching and learning.
6.3. Total research funds dedicated to environmental and sustainability research (in US
Dollar)
Please provide the average funding for research on environment and sustainability per
annum over the last 3 years.
6.4. Total research funds (in US Dollars)
The average total research funds per annum over the last 3 years. This information will be
used to calculate the percentage of environment and sustainability research funding to the
overall research funding.
6.5. Number of scholarly publications on environment and sustainability published
Please provide the average number of publication on environment and sustainability
published annually over the last 3 years.
6.6. Number of scholarly events related to environment and sustainability
Page 20 of 22
Please provide the number of scholarly events (eg. conferences, workshops, etc.) that was
hosted or organized by your university related to environment and sustainability
(average per annum over the last 3 years).
6.7. Number of student organizations related to environment and sustainability
Please provide the total number of student organizations at faculty and university level.
For example a student movement on green campus in the faculty of humanities can be
considered as one organization.
6.8. Existence of a university-run sustainability website
If your university has sustainability website, please provide the address of the web. Some
detailed information of a university website to educate students and staff as well as
providing information of their latest involvement on green campus, environment and
sustainability programs will be very beneficial. You could also email us some report such
as University Sustainability Tracking, Assessment and Rating System (STARS) report, if
you have one. We welcome any e-mail or hardcopy of your university sustainability
evaluation and report as well as evidence on sustainability activities in your university.
13. Related Papers and Publications about UI GreenMetric
1. UI GreenMetric Ranking of World Universities: Methodology and Evaluation by
Prof. Riri Fitri Sari, Prof. Gunawan Tjahyono Published at Journal of Higher
Education Evaluation and Development Volume 6, No.2 (December 2012)
2. Evaluating UI GreenMetric as a tool to Support Green Universities Development:
Assessment of the Year 2011 Ranking by Dr. Nyoman Suwartha and Prof. Riri Fitri
Sari. Published at Journal of Cleaner Production Volume 61, (15 December 2013)
3. Proceeding of International Workshop of UI GreenMetric 2013:
a) University Setting and Infrastructure achievement towards World Class Green University by Nyoman Suwartha, Riri Fitri Sari, Gunawan Tjahjono, Atmadewita in Proceeding of International Workshop of UI GreenMetric 2013
b) Universitas Indonesia, The Nation‘s Greenest Campus Nyoman Suwartha, Riri Fitri Sari, Gunawan Tjahjono, Atmadewita in Proceeding of International Workshop of UI Greenmetric 2013
4. Critical review of a global campus sustainability ranking: GreenMetric by Allan
Lauder, Riri Fitri Sari, Nyoman Suwartha, Gunawan Tjahjono in Journal of
Cleaner Production(March 2015)
UI GreenMetric Ranking Team
Ver 1.5July2nd 2015
greenmetric.ui.ac.id
Universitas Indonesia