Guidelines for Producing Child Health Subaccounts Within the
119
GUIDELINES FOR PRODUCING CHILD HEALTH SUBACCOUNTS WITHIN THE NATIONAL HEALTH ACCOUNTS FRAMEWORK PREPUBLICATION VERSION
Transcript of Guidelines for Producing Child Health Subaccounts Within the

GUIDELINES FOR PRODUCING CHILD HEALTH SUBACCOUNTS WITHIN THE NATIONAL HEALTH ACCOUNTS FRAMEWORK PREPUBLICATION VERSION

2
All standard disclaimers of each of the sponsoring organizations apply to this publication.
The author’s views expressed in this publication do not necessarily reflect the views of the United States Agency for International Development (USAID) or the United States Government

GUIDELINES FOR PRODUCING CHILD HEALTH SUBACCOUNTS WITHIN THE NATIONAL HEALTH ACCOUNTS FRAMEWORK PREPUBLICATION VERSION


Guide to Producing CH Subaccounts Contents iii
Contents
Foreword .............................................................................................................................................vii
Acknowledgements .............................................................................................................................. ix
Acronyms .............................................................................................................................................xi
1. Introduction................................................................................................................................ 1 1.1. Background........................................................................................................................ 1 1.2. Concept of NHA................................................................................................................ 2 1.3. Overview of the child health subaccounts ......................................................................... 4 1.4. Policy purpose of child health subaccounts....................................................................... 5 1.5. Indicators produced by child health subaccounts .............................................................. 7 1.6. Outline of methodological approach and structure of these guidelines............................. 7
2. Definitions and scope for the child health subaccounts .......................................................... 9 2.1. Child health interventions and programmes involved in their delivery............................. 9 2.2. Scope and boundaries of the NHA child health subaccounts .......................................... 11
2.2.1. Child health expenditures in the NHA............................................................... 11 2.2.2. Child health and other NHA subaccounts ......................................................... 14 2.2.3. Geographic boundaries ...................................................................................... 15 2.2.4. Time boundaries ................................................................................................ 15 2.2.5. NHA and the health information system ........................................................... 16
3. Classification scheme and tables............................................................................................. 17 3.1. Dimensions of NHA and their codes ............................................................................... 17 3.2. Approach to assigning classification categories .............................................................. 17 3.3. NHA tables and the child health subaccounts ................................................................. 18
3.3.1. Basic tables for child health subaccounts .......................................................... 19 3.3.2. Aggregates ......................................................................................................... 20
3.4. Child health expenditures: illustrative examples............................................................. 21
4. Data identification and collection ........................................................................................... 27 4.1. Approaching the data identification process.................................................................... 27
4.1.1. Understanding what you need and why you need it .......................................... 28 4.2. Data collection................................................................................................................. 28
4.2.1. Types of data ..................................................................................................... 28 4.2.2. Identifying data sources..................................................................................... 32
4.3. Data collection plan ......................................................................................................... 39 4.4. Summary.......................................................................................................................... 42
5. Data analysis............................................................................................................................. 43 5.1. Getting organized: what is needed?................................................................................. 43 5.2. Conducting the analysis itself.......................................................................................... 45
5.2.1. Step one - creating a T-account ......................................................................... 45 5.2.2. Step two - populating the NHA tables ............................................................... 46 5.2.3. Additional steps ................................................................................................. 47
5.3. Specific issues that may arise with the child health subaccounts .................................... 47 5.3.1. Dealing with targeted expenditure..................................................................... 47

iv Guide to Producing CH Subaccounts
5.3.2. Dealing with non-targeted expenditures for child health .................................. 49 5.3.3. Dealing with out of pocket expenditures........................................................... 55 5.3.4. Dealing with integrated expenditures for curative and preventive services...... 55 5.3.5. Tracking commodity related expenditures ........................................................ 56 5.3.6. Other data analysis issues.................................................................................. 57
5.4. Summary ......................................................................................................................... 58
6. Implementation process for child health subaccounts ......................................................... 59 6.1. Objectives and general considerations ............................................................................ 59 6.2. Resources needed............................................................................................................ 62
6.2.1. Equipment ......................................................................................................... 62 6.2.2. Other needed resources ..................................................................................... 62 6.2.3. Limited resources .............................................................................................. 62
6.3. Report writing and efficient communication of results................................................... 63 6.4. Work plan........................................................................................................................ 64 6.5. Complementarity of child health subaccounts with costing estimates............................ 65 6.6. Child health subaccounts when not done in conjunction with NHA .............................. 66 6.7. Institutionalization .......................................................................................................... 66
7. Child health subaccounts indicators ...................................................................................... 69 7.1. Background ..................................................................................................................... 69 7.2. Key health policy objectives ........................................................................................... 70
7.2.1. Equity in health care financing ......................................................................... 70 7.2.2. Efficiency .......................................................................................................... 70 7.2.3. Sustainability and resource availability............................................................. 71
7.3. Minimum set of indicators .............................................................................................. 71
Annex 1: Ethiopia donor questionnaire ........................................................................................... 79
Annex 2: Adding rider questions to ongoing surveys ..................................................................... 83
Annex 3: Apportionment rules applied to expenditures in Bangladesh health accounts to estimate child health spending.......................................................................................................... 85
Annex 4: Apportionment rules applied to expenditures in Sri Lanka health accounts to estimate child health spending ......................................................................................................................... 87
Annex 5: Methodology used in Bangladesh for estimating unit cost and utilization data .......... 91
Annex 6: Optional indicators on intervention-specific expenditures ............................................ 93
Annex 7: Summary of key statistics for child health subaccounts in Malawi, 2002/03-2004/05. 97
Annex 8: Summary of key statistics for child health subaccounts in Ethiopia, 2004/05 ............. 99
Annex 9: Summary of key statistics for child health subaccounts in Bangladesh (1999/2000) and Sri Lanka (2003)............................................................................................................................... 101

Guide to Producing CH Subaccounts Contents v
List of Tables Table 2.1 Examples of activities included and not included within the CH expenditure boundaries .. 14 Table 2.2: Some examples of overlapping services among child health and other types of
subaccounts .................................................................................................................................. 15 Table 3.1 Functional classification for child health interventions and activities.................................. 21 Table 3.2 Financing sources (FS) by financing agents (HF) ................................................................ 24 Table 3.3 Financing agents (HF) by providers (HP) ............................................................................ 25 Table 3.4 Financing agents (HF) by functions (HC) ............................................................................ 26 Table 4.1. Relationship between needed data estimates and the child health subaccounts-related
questions they inform and potential data sources......................................................................... 30 Table 4.2: Examples of routine financial information data sources ..................................................... 33 Table 4.3: Information needed for data analysis from the Health Information System ....................... 33 Table 4.4. Examples of survey reports available in-country “On Office Shelves” and used for child
health subaccounts........................................................................................................................ 35 Table 4.5: Examples of international databases for non-routine survey reports .................................. 36 Table 4.6: Kenya NHA data collection plan for secondary sources..................................................... 40 Table 5.1. Information needed for data analysis .................................................................................. 44 Table 5.2: Example of child health T-accounts: Malawi, 2004/05....................................................... 46 Table 5.3 Expenditure for the Ministry of Health in Malawi ............................................................... 50 Table 5.4. Financing agents contribution to non-targeted child health spending on inpatient care ..... 54 Table 6.1: Activities and timeline for conducting the child health subaccounts .................................. 65 Table 7.1. Proposed list of indicators for the child health subaccount report ..................................... 73 List of Figures Figure 1.1 Tri Axial Framework: the three dimensions to measure health expenditure flows............... 3 Figure 2.1. Causes of child and neonatal deaths 2000-2003. ............................................................... 10 Figure 2.2. Expenditure boundaries of NHA........................................................................................ 12 Figure 3.1: Construction of classification codes in the ICHA.............................................................. 18 Figure 3.2 NHA tables.......................................................................................................................... 19 Figure 3.3 Recommended tables for child health subaccounts............................................................. 20 Figure 4.1 Example of a map of the flow of funds for child health ..................................................... 29 Figure 6.1: Stakeholders involved in the production of NHA and child health subaccounts.............. 61


Guide to Producing CH Subaccounts Foreword vii
Foreword
Worldwide, more than ten million children die every year before reaching the age of five, and many more suffer life-long consequences of ill health during childhood. Over time, programmes and partnerships have been developed to increase the delivery of simple, affordable and life-saving interventions for the management of major childhood illnesses and malnutrition. They include the Partnership for Maternal, Neonatal and Child Health (PMNCH), the Expanded Programme on Immunization (EPI), and country-based programmes delivering the Integrated Management of Childhood Illness (IMCI), Insecticide Treated Nets for malaria (ITNs), and interventions linked to the Prevention of Mother to Child Transmission of HIV (PMTCT). Further, application of child health interventions (outside the programme framework) by the many public and private sector providers provide the bulk of care for children in many parts of the developing world. They all address different aspects of child survival, and have had positive results in reducing deaths from common and preventable conditions. Countries have pledged to scale-up the coverage of health services to reach the Millennium Development Goals (MDGs). In the fourth goal (MDG4), countries have committed to a two-thirds reduction in under-five mortality by 2015 from the 1990 baseline. Scaling up the delivery of interventions to address child mortality will require additional investments in commodities, equipment, and human resources as well as strengthening of the operational health system. National policy makers need precise information on the funding gap between the resources currently available for child health and those additional investments required to achieve national targets. In addition, they need to assess whether current child health expenditure is targeted towards the key interventions with the greatest impact on child survival, to determine the source of funding and understand which institutions determine how funds flow within a country’s health system. Such information provides the evidence necessary to make informed decisions, to allocate resources between competing needs, to help set strategic priorities and to ensure sustainable funding for child health programmes and strategies.
National Health Accounts (NHA) is an internationally accepted tool that provides a comprehensive estimate of all national health expenditures, whether it is contributed by donors or from domestic public and private sources. Subaccounts generate information on expenditure in accordance with the NHA framework. The term ’subaccounts’ refers to an additional and more detailed reporting of spending levels and patterns for a particular component of health care. The child health subaccounts have been designed to provide financial information to policy makers, programme managers and service providers on the resources spent on child health interventions. Expenditure on child health is defined as expenditure during a specified period of time on goods, services and activities delivered to the child after birth or to its caretaker. Only those goods, services and activities whose primary purpose is to restore, improve and maintain the health of children of the country between birth and the child's fifth birthday are included.
Child health subaccounts results can be used in various ways to inform child health policy and programming. They provide answers to specific questions regarding child health financing in the same way that general NHA answers questions on overall health care financing. For example, the child health subaccounts reveal how much is being spent, who is paying, what services and products are purchased and for whom. Because the subaccounts use the internationally recognized NHA framework, child health expenditure can be compared across countries. Once subaccounts results become available at regular intervals, trends in expenditure levels can be tracked, patterns of resource use monitored over time and their relation to the achievement of child health programme goals assessed. Ultimately such assessments can be used to adjust and inform financing strategies to scale up key child survival interventions.

viii Guide to Producing CH Subaccounts
The Health System Financing and the Child and Adolescent Health and Development Departments at the World Health Organization; the United States Agency for International Development/Partners for Health Reformplus (PHRplus) Project and its successor the Health Systems 20/20 (HS 20/20) project worked together to prepare these Guidelines. The Guidelines benefited from the participation and contribution of numerous child health and NHA experts, and from four country pilots for the development of the methodology. Efforts were made to ensure consistency with the Guide to Producing National Health Accounts with special applications for low-income and middle-income countries. Intended for NHA country experts as well as health account novices, these Guidelines aim to facilitate the production of child health subaccounts on a regular basis in order to better inform child survival policies.
David B. Evans
Elizabeth Mason Richard Greene
Director Director Director Department of Health System Financing World Health Organization
Department of Child and Adolescent Health and Development World Health Organization
Office of Health, Infectious Diseases and Nutrition Bureau for Global Health United States Agency for International Development
Peter Salama Flavia Bustreo Chief, Health Section
Deputy Director
Programme Division UNICEF, New York
Partnership for Maternal, Newborn and Child Health

Guide to Producing CH Subaccounts Acknowledgements ix
Acknowledgements
The child health subaccounts Guidelines were produced with support from the World Health Organization departments of Health System Financing (WHO/HSF) and Child and Adolescent Health and Development (WHO/CAH); the United States Agency for International Development/Partners for Health Reformplus (PHRplus) Project and its successor the Health Systems 20/20 (HS 20/20) project. The production of this report has benefited from discussions with the advisory group established for this purpose and led by the Department of health system financing at World Health Organization, the input of numerous child health and NHA experts, Meetings of the Global Child Survival Partnership (now the Partnership for Maternal, Newborn and Child Health (PMNCH)), and from country implementation experiences in Bangladesh, Ethiopia, Malawi and Sri Lanka. The core drafting team consisted of Maria Fernanda Merino, Stephanie Boulenger, Takondwa Mwase (PHRplus and HS 20/20), Charu C. Garg (WHO/HSF), and Karin Stenberg (WHO/ CAH). Initial drafts received input and valuable feedback from an internal review team consisting of Al Bartlett (USAID), Flavia Bustreo (PMNCH/WHO), Karen Cavanaugh (USAID), David Collins (Management Sciences for Health), Tania Dmytraczenko (PHRplus), Tessa Tan-Torres Edejer (WHO/HSS), Daniel Kraushaar (Bill & Melinda Gates Foundation), Yogesh Rajkotia (USAID), Ravi Rannan-Eliya (Institute for Health Policy, Sri Lanka), Aparnaa Somanathan (Institute for Health Policy, Sri Lanka), Robert Scherpbier (WHO/ CAH), and Abdelmajid Tibouti (UNICEF). These guidelines also benefited from the inputs in two working group meetings for the Child Health Survival Partnership forum.1 2 The work of Anne Mills and Tim-Powell Jackson for capturing donor flows for Child health at the international level and of Jane Briggs for tracking expenditures of commodities for child health provided input in developing the child health analytical framework and field work methodology. Critical to the development of the Child Health subaccounts approach was its application in Bangladesh, Ethiopia, Malawi and Sri Lanka. The issues raised, strategies employed, and lessons learned from these country experiences were integral to defining the methodology outlined in these guidelines as well as to determining the feasibility of tracking child health-specific health expenditures in the developing country context. The following comprised the country teams: Bangladesh team, based at Data International, led by Dr. Ghulam Rabbani with Dr. Najmul Hossain, Khairul Abrar and A. K. M. Shoab. Ethiopia team based in the USAID ESHE project, conducted by Hailu Nega, Leulseged Ageze and Tesfaye Dereje. Malawi team led by Mr. Edward Kaita (Ministry of Health), with Mr. Paul Revill (DFID), Dr. Eyob Zere (WHO) and Mr. Davie Kalomba (National AIDS Commission). Sri Lanka team based at the Institute for Health Policy was led by Dr. Ravi P. Rannan-Eliya, assisted by Dr. K.C.S. Dalpathadu and Tharanga Fernando together with Aparnaa Somanathan. Finally, the authors would like to acknowledge the efforts of Jenna Wright, Manjiri Bhawalkar and Ricky Merino (HS 20/20) for their help in finalizing this prepublication version.
1 Tracking Progress in Child Survival. Countdown 2015. Meeting hosted by the Working Group in December 2005 2 Child Health Resource Tracking Consultative Meeting: For the Global Child Survival Partnership (CSP). Hosted by the London School of Hygiene and Tropical Medicine. May 5-6, 2005.


Guide to Producing CH Subaccounts Acronyms xi
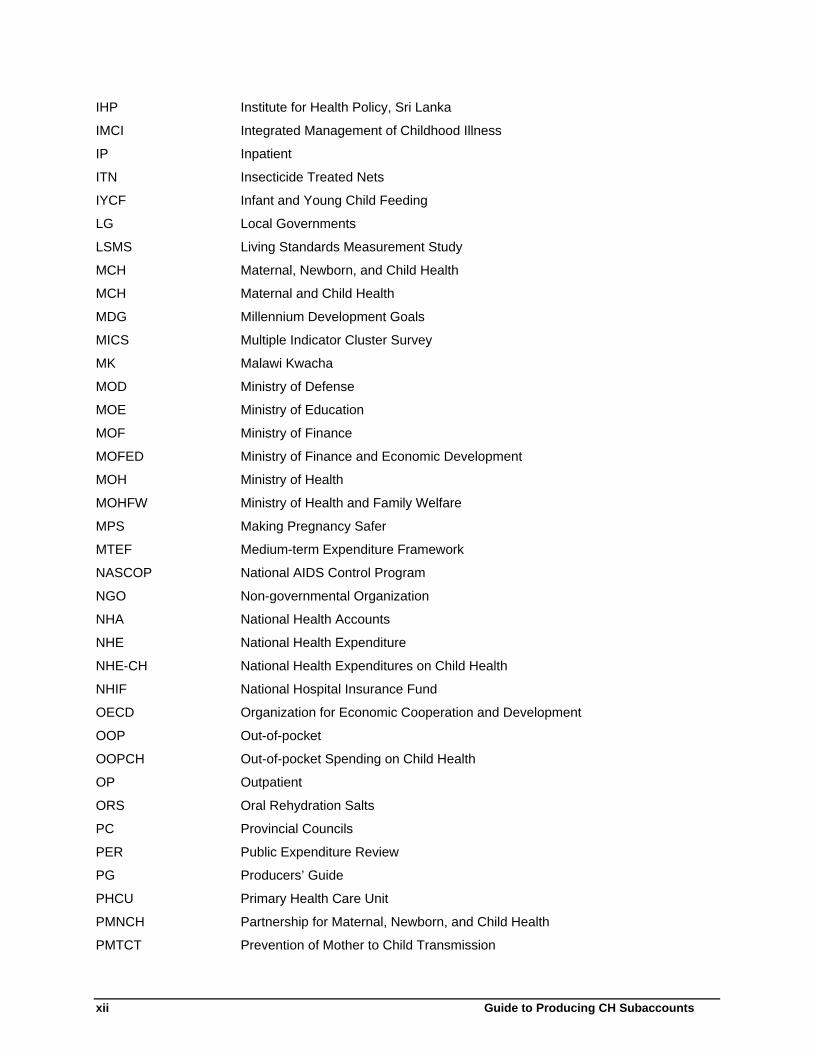
Acronyms
AIDS Acquired Immunodeficiency Syndrome
ARI Acute Respiratory Infection
CAH Child and Adolescent Health and Development
CB Central Bank
CD Central Dispensaries
CFS Central Bank Consumer Finance Surveys
CH Child Health
CHA Child Health Subaccounts
CNAPT Ceylon National Association for the Prevention of Tuberculosis
CSP Child Survival Partnership
DG District Hospital
DRG Diagnosis Related Group
EFY Ethiopian Fiscal Year
EPI Expanded Program on Immunization
ESHE Essential Services for Health in Ethiopia
FMOH Federal Ministry of Health
FS Financing Sources
GDP Gross Domestic Product
GH General Hospital
GMP Global Malaria Programme
GRN Goods Received Notes
HA Health Accounts
HC Functions
HCR Health Related Functions
HDS Health and Demographic Survey
HF Financing Agents
HIS Health Information System
HIV Human Immunodeficiency Virus
HMIS Health Management Information System
HP Providers
ICD International Classification of Diseases
ICHA International Classification of Health Accounts
IDS International Development Statistics
IEC Information, Education, and Communication
xii Guide to Producing CH Subaccounts
IHP Institute for Health Policy, Sri Lanka
IMCI Integrated Management of Childhood Illness
IP Inpatient
ITN Insecticide Treated Nets
IYCF Infant and Young Child Feeding
LG Local Governments
LSMS Living Standards Measurement Study
MCH Maternal, Newborn, and Child Health
MCH Maternal and Child Health
MDG Millennium Development Goals
MICS Multiple Indicator Cluster Survey
MK Malawi Kwacha
MOD Ministry of Defense
MOE Ministry of Education
MOF Ministry of Finance
MOFED Ministry of Finance and Economic Development
MOH Ministry of Health
MOHFW Ministry of Health and Family Welfare
MPS Making Pregnancy Safer
MTEF Medium-term Expenditure Framework
NASCOP National AIDS Control Program
NGO Non-governmental Organization
NHA National Health Accounts
NHE National Health Expenditure
NHE-CH National Health Expenditures on Child Health
NHIF National Hospital Insurance Fund
OECD Organization for Economic Cooperation and Development
OOP Out-of-pocket
OOPCH Out-of-pocket Spending on Child Health
OP Outpatient
ORS Oral Rehydration Salts
PC Provincial Councils
PER Public Expenditure Review
PG Producers’ Guide
PHCU Primary Health Care Unit
PMNCH Partnership for Maternal, Newborn, and Child Health
PMTCT Prevention of Mother to Child Transmission

Guide to Producing CH Subaccounts Acronyms xiii
PRSP Poverty Reduction Strategy Paper
PuSHE Public Sector Health Expenditure
PuSHECH Public Sector Health Expenditure on Child Health
RH Reproductive Health
ROWHE Rest of the World Health Expenditure
ROWHECH Rest of the World Health Expenditure on Child Health
SHA System of Health Accounts
SNA System of National Accounts
SNNPR Southern Nations, Nationalities, and People’s Region
SPA Service Provision Assessment
SWAP Sector-wide Approach
Tar-HE-CH Targeted Health Expenditures on Child Health
TB Tuberculosis
TCHE-CH Total Current Health Expenditures on Child Health
THC Thana Health Complex
THE Total Health Expenditure
THECH Total Health Expenditures on Child Health
THE-CH Total Health Expenditures on Child Health
UNICEF United Nations Children’s Fund
USAID United States Agency for International Development
WB World Bank
WHO World Health Organization


Guide to Producing CH Subaccounts Introduction 1
1. Introduction
1.1. Background
Policymakers are constantly faced with difficult decisions in selecting appropriate policies and implementation strategies in order to achieve public health targets. Information on how much is being spent on the health of a population is a key element in supporting solid decisions and policy-making. Information on expenditures can be useful to:
• Monitor whether funds are directed towards effective strategies, in order to improve health system performance
• Assess accountability of policy makers • Determine the gaps between current expenditures and the financial resources needed to
achieve goals set for the health sector, • Assess the current flows of funds from various financial sources in order to inform future
fundraising strategies At the global level, countries have pledged to scale-up their provision of health services to reach the Millennium Development Goals. At the national level, strategic plans for health include targets for the expansion of services and for a reduction in disease. However, in many countries insufficient funding remains a major constraint for scaling up delivery of priority interventions. Policymakers therefore need instruments and tools that allow them to monitor financial resource flows within the health system in order to assess how funds are currently spent, and for what purposes. Moreover, information on health expenditure flows can be useful in many settings for assessing the accountability of governments with regards to commitments made to channel resources towards health.3 However, even when total health expenditures have reached a fair level, studies have shown that expenditure patterns may not always be in line with policy priorities. 4 Health policies for target populations or for combating certain diseases will therefore require information that is detailed beyond that presented by total health expenditure aggregates. Information on expenditures for specific diseases, programmes or age groups can be assessed in relation to the outcomes produced by specific investments as a means to track attainment of global and national indicators. Programme managers also need tools that estimate the financial resources required to reach programme targets. The use of cost estimates along with assessments of current expenditures can help to raise the funds required to close the resource gap. All of the above are relevant for child health and child survival. The global burden of child health is high, with more than ten million children in low and middle-income countries dying each year before reaching the age of five5. The Millennium Development Goal 4 commits countries to reduce under-five child
3 For example, in the Abuja declaration African leaders pledge to set a target of allocating at least 15 percent of public budgets to the improvement of the health sector.: http://www.uneca.org/adf2000/Abuja%20Declaration.htm Maputo 2003 declaration: http://www.africaunion.org/Official_documents/Decisions_Declarations/Assembly%20final/Assembly%20%20DECLARATIONS%20%20-%20Maputo%20-%20FINAL5%2008-08-03.pdf Gaborone 2005 declaration, http://www.africaunion.org/root/au/Conferences/Past/2006/March/SA/Mar6/GABORONE_DECLARATION.pdf 4 TEHIP assessment, Tanzania 5 Jones G, Steketee RW, Black RE et al. How many child deaths can we prevent this year? Lancet 2003; 362:65-71.

2 Guide to Producing CH Subaccounts
mortality by two thirds from the 1990 baseline. 6 The attainment of this goal requires the promotion of efficient, low-cost interventions. To assess the adequacy of expenditures, it is necessary to collect relevant and sound information on how much is being spent on child health and how the funds are flowing within a country’s health system. Knowledge generated from such information, together with evidence on the effectiveness of interventions at different levels of the health system, provides the evidence to make informed decisions and to allocate resources between competing needs. Analyzing the organization and financing of child health services will lead to an understanding of how much is being spent and by whom, which will help in setting strategic priorities. Within the international community there is growing interest in uncovering how much is being spent on child health. For example, one of the responsibilities of the global Child Health Survival Partnership7 is to raise awareness of the funding gap between the resources that are currently available for child health and the resources required for achieving the child survival Millennium Development Goal. 8 This information becomes an important policy and advocacy tool in engaging more resources, monitoring progress in reducing child mortality, and holding stakeholders accountable. National Health Accounts (NHA) is a tool used to monitor flow of funds and estimate all national health expenditures across the health system. The NHA methodology has been used in more than 100 countries to date. The objective of these guidelines is to offer an internationally-viable approach for countries to track child health expenditures within the NHA framework. The methodology presented here has benefited from discussions with the working group constituted for developing these guidelines.9 It adheres closely to the methodology for conducting general NHA and therefore presents a methodology for tracking resources spent in child health that is consistent with a globally endorsed tool. The guidelines are flexible enough for each country, while still maintaining a certain degree of comparability, to respond to the local needs for information. Furthermore, these guidelines help comprise a set of internally consistent guidelines10 produced to track expenditure flows for specific programs, diseases, and age groups. The multiple guidelines are developed by WHO and other international partners in order to provide guidance for expenditure tracking and to ensure that methods and estimates are internationally comparable. This document is intended for the technical staff conducting NHA subaccounts, though policymakers and analysts will find the introductory and final chapters useful for understanding the policy motivation for this analysis. It is strongly recommended that the Guide to Producing National Health Accounts with special applications for low-income and middle-income countries11 (hereafter referred to as the Producers’ Guide, or PG), compliments these guidelines when one embarks on child health subaccounts. 1.2. Concept of NHA
NHA is a policy tool that presents the expenditure in health, both public and private, in a given country in a defined period of time. NHA tracks both the amount spent and the flow of funds across the health
6 United Nations General Assembly, 56th session. Road map toward the implementation of the United Nations Millennium Declaration: report of the Secretary General. New York: United Nations, 2001. 7 Since September 2005 the Child Health Survival Partnership is part of the Partnership for Maternal, Newborn & Child Health. 8 Powell-Jackson T, Mueller D, Borghi J, Mills A. Tracking Official Development Assistance for Child Health, Challenges and Prospects. Arlington, VA., USA: Basic Support for Institutionalizing Child Survival (BASICS) for the United States Agency for International Development (USAID). 9 Members/organizations participating: WHO, USAID, Health Systems 20/20, UNICEF, Institute for Health Policy, PMNCH 10 Other subaccounts guidelines include HIV/AIDS, Reproductive Health, and Malaria 11 WHO, World Bank, USAID. Guide to Producing National Health Accounts with special applications for low-income and middle-income countries. Geneva, 2003

Guide to Producing CH Subaccounts Introduction 3
system. By doing so, it presents the information across different dimensions summarized in the box below:
Figure 1.1 Tri Axial Framework: the three dimensions to measure health expenditure flows
The flow of funds is presented in a series of tables that show the transaction between two different dimensions, allowing for a comprehensive overview of the financing of the health system. The expenditures are recorded using a classification scheme that group transactions sharing common characteristics in the dimensions mentioned in Figure 1.1. The United Nations developed in the 1940’s a System of national accounts (commonly referred to as SNA 93) 12 as a methodology for understanding the inputs and products produced by different sectors of the economy. 13 The System of health accounts (SHA), developed by the Organisation for Economic Co-Operation and Development (OECD), shares the underlying principles used in the SNA 93 in that it
12 United Nations, Commission of European Communities, International Monetary Fund, OECD, World Bank http://unstats.un.org/unsd/sna1993/tactop.asp 13 The SNA has undergone various rounds of revision with the countries and different international organizations. Most industrialized countries utilize the latest version of SNA (updated in 1993) as a planning tool. Different “Satellite Accounts” have been proposed to focus on particular sectors of the economy, such as tourism or education. National Accounts serve the purpose of tracking factors of production and types of goods and services produced and NHA are created for the purpose of knowing the amount and flow of funds among and between the different actors of the health system.(for a more detailed explanation of the similarities and differences of the two types of account, the reader can refer to the Guide to producing national health accounts and the OECD manual A System of Health Accounts)
Financing Sources Agents
Production Factors of production Providers
Consumption/Use
Health Functions Beneficiaries Changes in level and distribution of health by:
Geopolitical sub national entities, Demographic & socio-economic characteristics Disease/programmes/cluster of interventions
Source: National Health Accounts, Health System Financing, EIP; World Health Organization

4 Guide to Producing CH Subaccounts
constitutes a system of comprehensive, internally consistent and internationally comparable accounts of the health sector for a given country in a specified period of time. 14 An important methodological contribution to the construction of health accounts is the Producers’ Guide, itself grounded on the OECD SHA principles. 15 This methodology rests on the foundations of the United Nations SNA 93 (World Health Report 2006). 16 The conceptual and methodological NHA framework can be used for conducting analysis of expenditure for particular areas of interest within each country. For this purpose several methodological guidelines have been developed for conducting accounts for HIV/AIDS, reproductive health, child health and malaria. It is important to note that subaccounts provide information on the expenditures along the various dimensions mentioned in Figure 1.1 for a particular disease or population group, or for the program or regional level. In these guidelines, child health subaccounts are developed at the program level and therefore some of the expenditures incurred for the boundaries defined for child health subaccounts will tend to overlap with other programs and age groups. In adhering to the general NHA framework, the child health subaccounts are only concerned with direct expenditures on health services and do not measure expenditures on indirect activities, that is, activities that are associated with the loss of income due to child health (e.g., the loss of income of a parent that stays home to care for the sick child, expenditure on transportation, complementary feeding, etc.), or expenditures associated with child care such as social services. 1.3. Overview of the child health subaccounts
These guidelines present the methodology for tracking expenditures for child health within the general NHA framework. The expenditures on child health are defined as expenditures during a specified period of time on goods, services and activities delivered to the child or its caretaker after birth,17 and whose primary purpose is to restore, improve and maintain the health of children between zero and less than five years of age in a given country. While countries can track resources along any dimensions, the major dimensions defined for tracking expenditures for child health are
• From the financers of health care called “financing sources” • to the principal managers of the funds, called “financing agents” • to those that deliver the services, referred to as “health providers” • for activities defining the “functions” of the health system
The proposed priority tables for child health subaccounts are the following:
• Financing sources to financing agents (FS x HF) • Financing agents to providers (HFxHP)
14 There are many similarities between the SHA and the SNA 93 Satellite Accounts. For example, both types of accounts use a similar concept of output, have the same production boundary and the same approach to placing value on output. Some of the differences between the two accounts refer to the different perspective of the economic activity of a society14, an expression of the different purposes of each account. 15 Organisation for Economic Co-operation and Development, A system of health accounts, Version 1.0, 2000 16 WHO. World Health Report 2006, Working together for Health, p. 159 17 For a more detailed definition refer to chapter 2.

Guide to Producing CH Subaccounts Introduction 5
• Financing agents to functions (HFxHC) • Providers to functions (HPxHC)
The tables are described in greater detail in Chapter 3. Child health accounts as described in these guidelines can be done as subaccounts using the general NHA methodology. As the subaccounts methodology is consistent with the NHA framework, it is recommended that whenever possible, child health subaccounts are done within the context of the general NHA. This approach has several advantages. First, the child health subaccounts can benefit from the routine data collection efforts set in place for conducting general NHA. It is therefore cost effective to do both analyses concurrently since effort needed for child health data collection is marginal. Second, the estimation methods for missing data can be consistent with the sector wide approach and will therefore ensure consistency when reporting health expenditures. Third, conducting specific subaccounts builds on existing technical capacity, and it provides a platform for dissemination of results. Fourth, conducting the subaccounts as part of the general NHA effort allows identification of expenditures that fit into more than one programme and therefore identification of possible overlaps. Fifth, a general NHA benefits from the different subaccounts because they more clearly expose the need for detailed information and therefore “lobbies” among the producers of data for the need to disaggregate information when gathering and processing data. Finally, the suggested approach helps to place a country’s pattern of expenditure on child health within the context of overall health spending. In all, it is a symbiotic endeavor. The child health subaccounts provide information useful for measuring the expenditure flows between financing sources, financing agents, providers and functions particular to child health interventions and activities for both the public and private sectors. It may also be particularly relevant for some countries to track the expenditure on child health from multilateral, bilateral and donor agencies, which is also captured by the NHA methodology. 1.4. Policy purpose of child health subaccounts
As underlined in the World Health Report 2005: Make every mother and child count, the health of children is today seen as a priority in the improvement of population health worldwide. Recent years have seen a shift in the way child health is envisioned: from being a technical issue pertaining to the delivery of certain programmes it is now seen as a moral and political concern for all. 18 Despite the moral concerns of child mortality and the attention given by the media, policy makers and civil society to this subject, many child health programmes remain under funded. Understanding the amount spent and resource flows in child health is a requisite for advocating for increased investment in child health, including the health of newborns. This investment is not only a priority for saving lives, but is also critical in advancing other goals related to human welfare, equity and poverty reduction. 19 The Bellagio Study Group on Child Survival has identified 23 priority interventions for child survival. 20 A recent study on the cost associated with delivering the 23 interventions suggests that effective strategies for achieving the Millennium Development Goal for child survival would include: focus on prevention in order to decrease treatment costs, use of integrated delivery strategies, and expanded coverage through
18 WHO. World Health Report 2005, Making every mother and child count. 19 A continuum of care to save newborn lives. The Lancet. Published online, March 2005. htto://image.thelancet.com/extras/05cmt49web.pdf 20 The Bellagio Study Group on Child Survival. Knowledge into action for child survival. Lancet 2003; 362: 323-327.

6 Guide to Producing CH Subaccounts
improved delivery of existing care. 21 Furthermore, Darmstadt et al identified 16 interventions with proven efficacy for neonatal survival, while recognizing that improving neonatal care requires not only the identification of effective interventions, but also a clear implementation process and framework for applying such interventions within existing programmes. 22 In order to put in practice these strategies, key information is needed about the way resources for child health are being allocated, the amount spent on preventive and curative care, the contribution of household expenditures on child health, etc. The overall improvement of child health requires political will and leadership. This statement is supported by studies on the amount and efficiency of expenditures for improving and maintaining the health of children zero to five years of age. The child health subaccounts as presented here encourage disaggregation of expenditures by priority interventions and activities aimed at reducing child mortality. This level of disaggregation is an ideal method for conducting a thorough analysis of the amount and flow of funds spent on activities to reduce child mortality. Obtaining such a detailed disaggregation can be difficult technically due to limitations of existing information systems. However, any information produced, even if at a more aggregate level, will be helpful for policy makers to assess current expenditure patterns. The level of disaggregation can be improved upon gradually as the country works towards strengthening their health information system. These guidelines therefore encourage country teams to work on the subaccounts even if the level of detail suggested as ideal cannot be achieved. A classification scheme is presented in Chapter 3. As mentioned briefly, health accounts provide information about the expenditure and the flow of corresponding funds. By doing so, the child health subaccounts can help answer the following policy relevant questions:
• What is the current level of funding for child health at national level? • What are the current sources of funding for child health and who manages these funds? • What is the direct contribution of households for child health? • What is the distribution of child health resources between various child health interventions
and total expenditures on core child health interventions? • What is expenditure on preventive and curative services? • What proportion of child health expenditures are in treatment in hospitals vs. outpatient care
facilities? • Who provides child health care services and with what resources? • What is the difference in per capita expenditure in child health between the insured and
uninsured? • To what extent are child health expenditures dependent on foreign aid? • What has been the trend of child health expenditure over the past years?
Additionally, each country must decide if there are specific questions the subaccounts must address. For example, the priority for a country may be to distinguish between the per capita expenditure on child health for the insured and uninsured, or to distinguish between preventive and curative care. Other countries may have as a special focus of interest the geographic inequities in financing of child health interventions. 23 The effort of the NHA team conducting the child health subaccounts will lean towards obtaining sufficient information to allow for these distinctions, as opposed to focusing on other questions.
21 Bryce J, Black RE, Walker N et al. Can the world afford to save the lives of 6 million children each year? Lancet 2005; 365:2193-2200. 22 Darmstadt G, Bhutta ZA, Cousens S et al for the Neonatal Survival Steering Team. 4 million neonatal deaths: When? Where? Why?. Lancet 2005. Neonatal Survival: 19-30. 23 Please refer to the Regional subaccounts guidelines, produced under the same series as the child health subaccounts guidelines

Guide to Producing CH Subaccounts Introduction 7
1.5. Indicators produced by child health subaccounts
Among the requisites for attainment of public health goals is adequate and targeted financial resources. 24 It is widely recognized that in many countries insufficient funding remains a major constraint for scaling up delivery of child survival interventions. The amount of additional per capita expenditures required varies between countries depending upon their current health systems and epidemiological situations. Indicative estimates presented in the World Health Report 2005 predict that approximately an additional US$ 50 billion is required for the period 2006 to 2015, in order to reach 95% coverage with 16 priority child health interventions in 75 countries. This represents an increase in per capita health expenditure of US$ 1.48 in 2015, equivalent to increasing average general government health expenditure over current levels by 26%. In countries with the weakest health systems, the scale-up scenario implies considerable increases in public expenditure on health, of up to 75%. Another estimate was produced by Bryce J et al, who estimated that US$ 5.1 billion in new resources are needed annually to avoid 6 million child deaths.25 Given the importance of domestic and international investment in child health, it is important to track the flow and amount of such investments, and assess this information in the context of health indicators in order to evaluate the equity and efficiency of the delivery of child health. Some of these indicators include:
• Child health expenditure as a percentage of total health expenditure, • External funds for child health as a percentage of total health expenditure • Percentage of out-of-pocket child health spending out of total health spending • Expenditure on preventive and curative services • Per capita expenditure on child health by region or population group • National (or total) child health expenditure per child
A complete set of indicators with detailed definitions and explanations are presented in Chapter 7. 1.6. Outline of methodological approach and structure of these
guidelines
The approach suggested in these guidelines, as mentioned previously, adheres to the one described in the Producers’ Guide. However, when a country decides to embark upon estimating NHA, local organizational and political considerations must be taken into account so that the general methodology is applied to a particular context. For example, issues such as the nature of provision of services, the specific arrangements for the age group under study, the availability of information, the availability of output indicators, etc. have an impact on the resulting NHA implementation strategy. The initial step involves defining the purpose for conducting child health subaccounts. This in turn will help establish the boundaries for each country. For example, what types of goods and services related to the improvement of health of children will be included in the analysis? These issues are discussed in Chapter 2.
24 The Bellagio Study Group on Child Survival. Knowledge into action for child survival. Lancet 2003; 362: 323-327. 25 Bryce J, Black RE, Walker N et al. Can the world afford to save the lives of 6 million children each year? Lancet 2005; 365: 2193-2200.

8 Guide to Producing CH Subaccounts
After the purpose and boundaries have been established, the expenditures are classified in accordance with the classification recommended in Chapters 3 and 4 of the Producers’ Guide. In Chapter 3, a breakdown for the specific dimensions of child health is outlined. The main difference with the general NHA classification scheme refers to the level of detail relating to child health functions. This chapter also presents mapping of classifications that provide the names and codes that will be the row and column headings of the core NHA tables. Chapter 4 outlines the desired data for child health subaccounts and suggests different methods for obtaining it. In this chapter, reference is given to the use of available information as well as the possibility of adding further questions to existing surveys that provide the data for general NHA. It is very important that the team has a clear understanding of how child health is delivered and obtained within the national context. This understanding facilitates the planning process for gathering data and ultimately facilitates its analysis. Once all the data (or at least minimum data required) has been collected and its quality assessed, the process of populating the NHA tables begins. Populating tables requires a thorough examination of existing data gaps, resolving data conflicts, agreeing upon estimation techniques, and clearly documenting these techniques. Chapter 5 describes some of the issues that are particular to child health subaccounts. Chapter 6 presents a suggested process for implementation. These guidelines suggest, institutionalizing the practice of producing information regarding expenditures in child health and making it a part of the routine health information system outputs. Achieving this goal involves the will and commitment of the political stakeholders, as well as the production, analysis and dissemination of sound information from the technical experts. This chapter will also present a suggested time-frame for the development of child health subaccounts and the resources needed for such implementation. Finally, Chapter 7 will present the different indicators important for policy purposes that can be produced by child health subaccounts.

Guide to Producing CH Subaccounts Definitions and scope for the CH subaccounts 9
2. Definitions and scope for the child health subaccounts
The following chapter describes the scope of the NHA child health subaccounts within the context of general NHA. The reader should refer to the Producers’ Guide for details on NHA. The writing of these chapters is the result of discussions on methods for identifying and tracking child health expenditure as part of the efforts to track progress in child survival26 stemming from the Child Survival Partnership Meeting held in London in May 2005. 27 The production of this report has benefited from discussions with the advisory group established for this purpose and led by the World Health Organization. 2.1. Child health interventions and programmes involved in their
delivery
Children bear an undue share of the global burden of disease. Annually, approximately 10 million children younger than five years of age will die, and many more suffer life-long consequences of inappropriate care and ill health during childhood. The vast majority of neonatal and child deaths occur in developing countries. The brief background presented here on child health in less developed countries serves as a guide to identifying and understanding the range of activities and expenditures included in child health subanalysis. Diarrhoea, pneumonia, and neonatal conditions are the most important direct causes of childhood mortality worldwide. Malaria and HIV infections are also important causes in some countries (Figure 2.1). The relative importance of different conditions will vary across countries and over time. For example, neonatal mortality currently accounts for between 31% and 98% of infant deaths. In settings where child deaths from common illnesses such as pneumonia and diarrhoea have been reduced, the proportional contribution of neonatal mortality to under-five mortality is increased. Malnutrition is the single most important underlying cause associated with 53% of all child deaths. In low-income countries one in every three children suffers from stunted growth. The effects continue throughout life contributing to poor school performance, reduced productivity, and impaired intellectual and social development. It is well known that proven interventions, properly implemented, could prevent millions of child deaths every year. 28 For example, effective nutrition interventions including promotion of appropriate breastfeeding and complementary feeding, Vitamin A and zinc supplementation could save 2.4 million children each year or 25% of total annual deaths. Programmes have developed over time to address the major causes of mortality and morbidity. The Expanded Program on Immunization (EPI) sets out to increase vaccination coverage in line with 26 Tracking Progress in Child Survival. Countdown 2015. Meeting hosted by the Working Group in December 2005 27 Child Health Resource Tracking Consultative Meeting: For the Global Child Survival Partnership (CSP). Hosted by the London School of Hygiene and Tropical Medicine. May 5-6, 2005. 28 Jones G et al. Lancet (2003).

10 Guide to Producing CH Subaccounts
HIV/AIDS 3%
Pneumonia 19%
Other 10%
Neonatal 37%
Measels 4%
Malaria 8%
Injuries 3%
Diarrhoea 17%
Preterm 28%
Sepsis or pneumonia 26%
Asphyxia 23%
Congenital 8%Tetanus 7%Other 7%Diarrhoea 3%
HIV/AIDS 3%
Pneumonia 19%
Other 10%
Neonatal 37%
Measels 4%
Malaria 8%
Injuries 3%
Diarrhoea 17%
Preterm 28%
Sepsis or pneumonia 26%
Asphyxia 23%
Congenital 8%Tetanus 7%Other 7%Diarrhoea 3%
HIV/AIDS 3%
Pneumonia 19%
Other 10%
Neonatal 37%
Measels 4%
Malaria 8%
Injuries 3%
Diarrhoea 17%
Preterm 28%
Sepsis or pneumonia 26%
Asphyxia 23%
Congenital 8%Tetanus 7%Other 7%Diarrhoea 3%
international commitments. Thanks to sustained efforts to promote immunization, deaths from measles decreased by 39% between 1999 and 2003. Compared to levels in 1980, measles mortality declined by 80%. Widespread introduction of oral rehydration therapy through national programmes for Control of Diarrhoeal Disease largely contributed to reducing the number of diarrhoeal deaths from 4.6 million per year in the 1970s to 3.3 million in the 1980s and 1.8 million in 2000. The distribution of Insecticide Treated Nets (ITN) through malaria control programmes, and the Prevention of Mother to Child Transmission (PMTCT) component of HIV control programmes address other aspects of child survival. These programmes have had positive results in reducing deaths from common and preventable conditions through the use of cost-effective and simple interventions.
Figure 2.1. Causes of child and neonatal deaths 2000-2003.
Source: Bryce J, Boschi-Pinto C, Shibuya K, Black R and the WHO Child Health Epidemiology reference Group. WHO estimates the causes of death in children. Lancet 2005; 365:1147-1151
Children brought for medical treatment in the developing world are often suffering from more than one condition. The common occurrence of multiple conditions at the same time has emphasized the need for integrated delivery approaches. One such approach is the Integrated Management of Childhood Illness (IMCI), which presents a set of simple, affordable and effective interventions for the combined management of the major childhood illnesses and malnutrition. 29 IMCI includes core curative interventions such as management of diarrhoea and dysentery, pneumonia, malaria and neonatal sepsis, along with preventive care focusing on growth monitoring, nutrition counseling and administering micronutrients and essential vaccines. The three main components of the IMCI strategy are: improving case management skills of health-care staff; improving family and community health practices; and improving overall health system support. Expenditures will therefore relate to events occurring at all three levels, i.e. at the family/community, facility and health system levels. Evidence shows that correctly managed IMCI reduces childhood mortality at a lower cost per child than does current care. 30 Whether delivered through vertical or more integrated approaches, a recent analysis showed that coverage with key child survival interventions remains unacceptably low, impeding the achievement of MDG4. 31 Lack of political will and insufficient financial commitment to child survival are among the major 29 Gove S for the WHO Working Group on Guidelines for Integrated Management of the Sick Child. Integrated management of childhood illness by outpatient health workers: technical basis and overview. Bull of the WHO. 1997:75:supplement 1:7-16. 30 Bryce J, Gouws E, Adam T, Black RE, Armstrong Schellenberg J, Manzi F, Victora CG, Habicht J-P. Improving quality and efficiency of facility-based child health care through Integrated Management of Childhood Illness in Tanzania. Health Policy and Planning 2005 Dec 20 (Supplement S1): i69-i76. 31 Countdown to 2015: tracking intervention coverage for child survival Lancet. 2006 Sep 23; 368(9541):1067-76.

Guide to Producing CH Subaccounts Definitions and scope for the CH subaccounts 11
reasons. In response, WHO and UNICEF are supporting regions and countries in the development of long-term child survival strategies and operational plans. Increasingly, such strategies and plans are convincing policy makers of the need to revisit their health investment strategies and give due attention to the unacceptably high burden of child mortality and morbidity. NHA, and more specifically child health subaccounts are important tools to analyse and possibly redirect current health investments, including those on child survival. As illustrated above, child health expenditures at the national level are needed for both vertical and integrated programmes for the treatment and prevention of child diseases. This data is also needed for programmes that promote child development, including mental development. These areas of health concern provide general guidance to defining the scope of expenditures that should be included in the child health subaccounts. 2.2. Scope and boundaries of the NHA child health subaccounts
2.2.1. Child health expenditures in the NHA
The NHA framework considers the value, in monetary terms, of goods and services consumed and activities carried out whose primary purpose is to restore, maintain or improve the health status of the population over a given period of time. The NHA framework uses the health care function as the primary reference for defining health expenditures. For the purposes of classification, health expenditures are grouped into two main types: direct health expenditures –sometimes referred to as core health expenditures- and health related expenditures. The first group is associated with certain functions of a health system: provision of care, prevention and public health, stewardship, and general administration. 32 The health-related expenditures are associated with activities, or goods and services that relate to other functions of the health system such as capital formation, education and training of health personnel, research and development in health, food, hygiene and water control, environmental health, etc. The sum of core or direct health expenditure and capital formation is referred to as Total Health Expenditure (THE). The sum of direct health expenditures and the expenditure on all health related functions is known as the National Health Expenditure or NHE. The current expenditures in health (core health expenditure) do not include the value of depreciation of buildings and equipment. A further aggregation refers to the distinction between capital expenditure and recurrent expenditure. Capital formation is referred here to the physical assets (land, buildings and equipment) owned by or available to the health sector acquired during one year. The NHA literature sometimes refers to expenditures "below" and "above" the line (Figure 2.2). The expenditures considered above the line are those that refer to the health and health related functions. Expenditures below the line are items that are not generally considered to be part of the NHA framework. An example of below the line expenditures would be payments by social insurance agency for loss of income due to illness. However, for some countries, it may be an important policy issue to track the below the line expenditures.
32 Under International Classifications of Health Accounts (ICHA), capital formation is classified as a health related function. Therefore, the THE will be the sum of ICHA classifications HC.1 to HC.7 plus HC.R.1. More detail is provided in the following chapter.

12 Guide to Producing CH Subaccounts
Figure 2.2. Expenditure boundaries of NHA
In line with the Producers’ Guide (p.20), the classification scheme developed interventions important for tracking the expenditures on children, the boundaries for child health expenditures are defined as follows:
The expenditures on child health are defined as expenditures during a specified period of time on goods, services and activities delivered to the child after birth or its caretaker whose primary purpose is to restore, improve and maintain the health of children of a country between zero and less than five years of age.
Many of the interventions delivered to children between zero and five years will have an impact on the health of the individual many years after the intervention. However, these guidelines recommend the inclusion only of those interventions that are delivered to the child during the first five years of life and with the main purpose to restore or improve child health. Moreover, the interventions delivered to the mother before delivery are not included as part of child health expenditures, as they will be captured in the reproductive health subaccounts. There is a need to define a cutoff that makes sense for policy and programmatic perspectives, and maternal care with emphasis on the mothers well/being does not fall under child health programmes. The interventions delivered to the mother after delivery and expected to impact the health of the newborn child such as breastfeeding campaigns are included as part of child health expenditure. Expenditures for social care where the primary purpose is not to restore, improve and maintain the health of children, such as social care of orphans is not included. The boundaries established for defining what is considered an expenditure on child health must be relevant from a child health policy perspective, but remain within the framework of general NHA. This allows for estimates to be disaggregated in a way that defines the need for child survival, but that can also link the total expenditure on child health with the total health expenditure of each country. To compare intermediate outcomes such as mortality reduction from different interventions or activities33, or to measure expenditures on the key interventions set for Child Survival in order to track investments related to reaching MDG4, a key set of interventions to be included in child health expenditures are presented in Table 2.1.
33 The Bellagio Study Group on Child Survival. Knowledge into action for child survival. Lancet 2003; 362: 323-327.
Below the line
Above the line
Core health expenditure
Health related expenditure
Tota
l Hea
lth E
xpen
ditu
re -
THE
Nat
iona
l Hea
lth E
xpen
ditu
re -
NH
E
Addendum items
Services of curative careServices of rehabilitative careAncilliary servicesMedical goodsPrevention and public health servixcesHealth administration and health insurance
Capital formation for healthcare
Education and training Research and developmentFood, hygiene and drinking water controlEnvironmental health
Cap
ital H
ealth
Ex
pend
iture
Tota
l C
urre
nt H
ealth
Ex
pend
iture
-T
CH
E

Guide to Producing CH Subaccounts Definitions and scope for the CH subaccounts 13
Included in the expenditures for child health are expenditures for treatment and prevention of child diseases including core interventions to improve child survival as well as the promotion of child health. These expenditures reflect interventions delivered directly to the child, such as curative interventions (surgery, provision of antibiotics), preventive interventions (vaccines), promotional activities (counseling, IEC, health related legislation, etc.), community interventions (see Box 2.1) and targeted supplementation and treatment of severe malnutrition (vitamin A or other specific nutrition programmes such as Infant and Young Child Feeding (IYCF))). The availability of data in each country guides to what extent expenditures under the broader activities can be disaggregated to be included as part of child health expenditures. It is important to note that in some cases, the data is available as targeted expenditure for child health, and in other cases, the proportion of an activity that is aimed for child health will have to be determined. The criteria for allocation of expenditures towards child health will be determined by a relevant measure, such as the under five population as a percentage of the total population benefiting from such activity. This is further discussed in chapters to follow. Box 2.1 Community interventions - overcoming geographic barriers to care Current coverage levels of key child survival interventions are low in most developing countries. High intervention coverage, necessary to achieve MDG4, is impeded by the existence of geographic and financial access barriers to care. In the five countries with the highest under five mortality burden (India, Nigeria, China, Pakistan and DR Congo), government expenditure on health as % of total health expenditure is below 40%, and most of the private expenditure is from out-of-pocket payments. High out-of-pocket payments present a financial barrier to children accessing care. While financial access barriers needs to be overcome, WHO, in collaboration with UNICEF and other UN agencies, is supporting the development of community interventions for pneumonia, diarrhoea and severe malnutrition to reduce geographic access barriers to key interventions: • countries can reduce pneumonia related mortality by adopting and promoting policies that support the role of
community health workers to identify and treat pneumonia with antibiotics under appropriate monitoring and supervision, promoting close linkages with health facilities (1)
• used in conjunction with effective home treatment and appropriate health services, low osmolarity ORS in combination with zinc supplementation can save many more lives and must become routine practice in both the home and health facilities (2)
• countries can save children's lives by adopting and promoting national policies and programmes that ensure that national protocols for the management of severe acute malnutrition (based, if necessary, on the provision of Ready-to-Use Therapeutic Food) have a strong community based component that complements facility-based activities (3)
Other child health interventions that can be delivered by community health workers (CHW) or community groups include breastfeeding counseling, growth monitoring, providing antimalarials and bednets, and prevention and care for newborns. Aside from providing delivery of health interventions to children, community level actors are often engaged to promote family and community practices that promote child survival, growth and development - such as hygiene, micronutrient intake, and care seeking. The role of community level workers is crucial in many countries - for example in Pakistan the Lady Health Workers cover 35 percent of the total population with child health services such as management of diseases, facilitation of referral, growth monitoring and other services. (4) Expenditures at community level will include those incurred due to delivery of child health interventions (such as management of pneumonia, diarrhoea and severe malnutrition) as well as programmatic expenditures incurred to introduce, sustain and scale-up community based delivery (recruitment, training, supervision, CHW equipment and supplies) --------------- (1) WHO/UNICEF Joint Statement on management of pneumonia in community settings (2) WHO/UNICEF Joint Statement on clinical management of acute diarrhoea (3) WHO/WFP/UNSCN/UNICEF Joint Statement on community based management of severe acute malnutrition (4) For more information on this programme and others see WHO/UNICEF 2006 management of sick children by community health workers - intervention models and programme examples.

14 Guide to Producing CH Subaccounts
Table 2.1 Examples of activities included and not included within the CH expenditure boundaries
Included as child health expenditure Not included as child health expenditure
• Treatment of childhood illness, including Integrated management of childhood illness (IMCI)
• Family planning and birth spacing related activities and programmatic support
• Malaria activities targeting children under 5. Includes all preventive activities, treatment of malaria using anti-malarials and programmatic support
• Maternal and reproductive health related activities and programmatic support. Includes antenatal care, basic comprehensive emergency obstetric care, and all other interventions given directly to the mother
• Management of children with symptomatic HIV/AIDS and HIV/AIDS exposed children, including testing
• PMTCT activities that target the mother (**)
• Care of the newborn • General food supplementation activities
• Control of diarrhea and respiratory tract infections • Care of orphans
• All immunization activities to children under five (including new and underused vaccines, e.g. Hib, rotavirus, pneumococcal conjugate). Includes procurement of vaccines, materials and cold chain equipment as well as programmatic support
• Water and sanitation activities except those targeting the elimination of water borne diseases and air pollution control
• Services for child health provided at the community level (any preventive and curative interventions which are delivered at community level)
• General education - schooling and day care
• Promotion of breastfeeding and complementary feeding
• PMTCT activities targeted to the child and provided after birth (**)
• Micronutrient supplementation given to children under five (e.g. vitamin A, iron, zinc)
• Fortification of food*. Includes activities related to iodized salt and vitamin A fortification as well as any support to government programmes
• Treatment of severely malnourished children
• Water and sanitation activities targeting the elimination of water borne diseases and air pollution control*
• Training of community health workers and in-service training of health facility staff for the delivery of child health services (e.g. EPI, IMCI, IYCF) and training of mid-level managers
• Oral health for under fives
• Inpatient treatment of children under five
* Only in the case that these activities are considered an integral part of child survival programmes. (**) The UN strategy for the prevention of HIV transmission in pregnant women, mothers and their children indicates the need to consider action in the following areas, which form a four-prong comprehensive approach: 1) prevention of HIV infection in general, especially in young women and pregnant women; 2) prevention of unintended pregnancies among HIV-infected women; 3) prevention of HIV transmission from HIV-infected women to their infants; and 4) provision of care, treatment and support to HIV-infected women, their infants and families. Child health expenditures should include those referring to the third component of PMTCT (prevention of HIV transmission from HIV infected women to their infants) and delivered after the birth of the child. This includes: ART to the baby; infant feeding counselling including breastmilk substitutes; and counselling and testing of the child at 6-8 weeks and/or 18 months. This excludes the following activities of the third component (because they are delivered before the birth of the child) : ART to the pregnant woman; HIV testing and counseling of the pregnant woman during ANC visit or at birth; safe delivery (skilled attendant).
2.2.2. Child health and other NHA subaccounts
The expenditures registered under child health cut across diseases, programmes and different age groups. For example, the expenditure of insecticide treated bednets is recorded in the malaria subaccounts, but

Guide to Producing CH Subaccounts Definitions and scope for the CH subaccounts 15
there is a percentage of these funds that is spent for the prevention of malaria in children under five years and, therefore, this percentage has to be included in the child health subaccounts. Another example of overlapping expenditures relate to the breastfeeding counseling provided to the mother. In this case the intention of the intervention is to benefit the child and therefore is recorded under child health subaccounts. However, breastfeeding counseling is often part of the maternal care package of services recorded under the reproductive health subaccounts. When conducting subaccounts it is essential to establish clearly what is included as part of the expenditure and to identify any possible overlap with other subaccounts in order to have a comprehensive idea of the country’s total expenditure. Table 2.2 shows examples of overlapping services among different subaccounts. The crosses indicate the possible overlap between subaccounts, and the number of crosses refer to where the expenditure of a specific service should be accounted for in order not to double count this expenditure.
Table 2.2: Some examples of overlapping services among child health and other types of subaccounts
Subaccounts that could include overlapping services with the child health subaccounts
Overlapping service
Child health subaccounts
Reproductive health subaccounts
HIV/AIDS subaccounts
Malaria subaccounts
PMTCT services Component of PMTCT delivered to the child
Component of PMTCT delivered to the mother
XX
Intermittent Preventive Therapy and Antimalarial chemoprophylaxis
X X XX
Basic newborn health care during perinatal period
XX X
Breast feeding counseling
XX X
Maternal health care XX
2.2.3. Geographic boundaries
In adhering to the general NHA framework (PG, pg. 22, 3.12), the geographic boundary refers to the countries of usual residence of the beneficiary of the expenditure. Therefore, the subaccounts will include expenditures that benefit the residents of the given country, whether these expenditures are made in-country or abroad. The child health expenditures made by foreigners that reside temporarily in the country should be excluded whenever it is possible to identify these expenditures. Alternatively, a note must be made when these expenditures of foreigners cannot be excluded from the estimates. In the case of interventions that are considered public goods, they must also be included even though the benefit is also for the foreigners temporarily residing in the country, because the non-excludability principle is inherent to the nature of a public good. 2.2.4. Time boundaries
The time frame suggested by the general NHA framework is one calendar year (PG, pg. 22, 3.13-3.14). If the country chooses a different time period (e.g., fiscal year), care must be taken to ensure consistency for

16 Guide to Producing CH Subaccounts
all the expenditures in the subaccounts, and any adjustments made for comparison purposes must be clearly identified. Because the general NHA applies the accrual accounting method, the expenditures included refer to the obligations incurred for goods and services consumed and provided and not to actual cash payments. This means that expenditures are recorded at the time when the obligations are made as opposed to when the actual payments are made. If monetary transactions are not registered in accrual terms, a note explaining the difference must be included. 2.2.5. NHA and the health information system
Linking NHA to the health information system (HIS) serves two main purposes. On one hand, the HIS provides data that can be used to apportion expenditure (for example, by using data on the allocation of human resources to pediatric wards, the number of out-patient consultations provided to children between zero and five as a percentage of the total number of out-patient visits, the distribution of facilities that care for children, etc.). This aspect will be presented with more detail in Chapters 4 and 5. The other important dimension of the link between NHA and the country’s HIS relates to the presentation of results. Having information on expenditure in relation to the outputs of the health system provides information on aspects such as efficiency and equity of the health system. NHA information is also an important component of the WHO framework for the assessment of health system performance assessment.
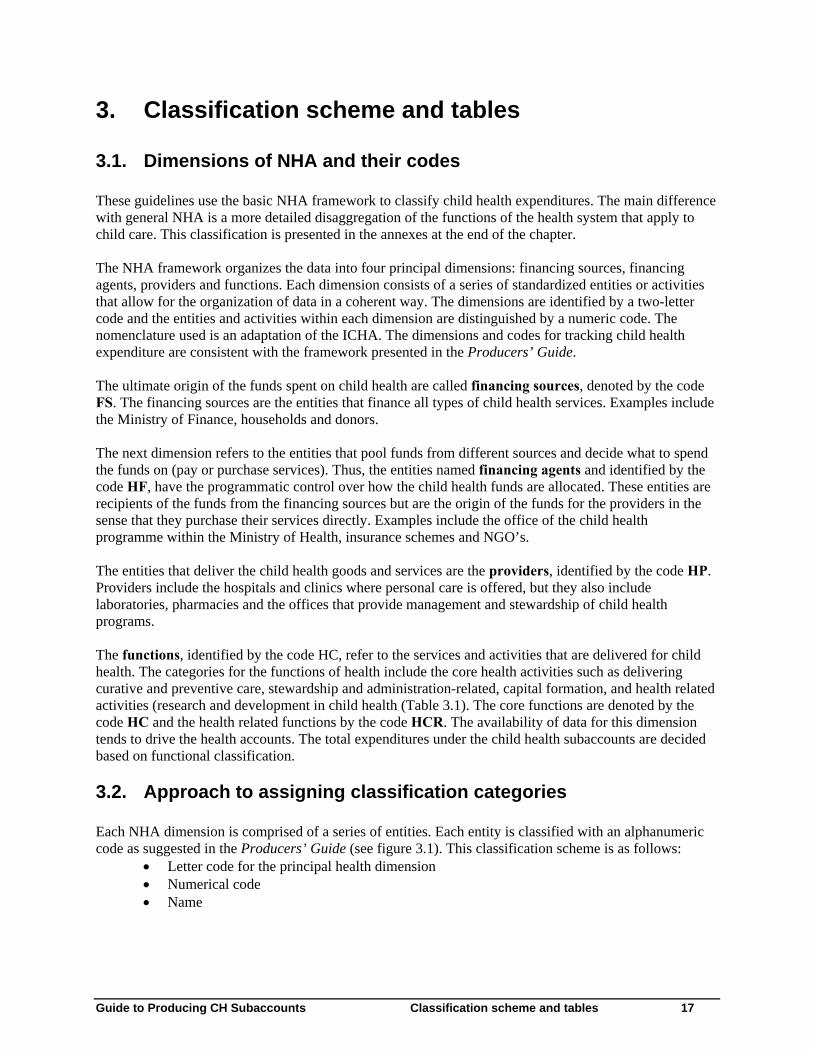
Guide to Producing CH Subaccounts Classification scheme and tables 17
3. Classification scheme and tables
3.1. Dimensions of NHA and their codes
These guidelines use the basic NHA framework to classify child health expenditures. The main difference with general NHA is a more detailed disaggregation of the functions of the health system that apply to child care. This classification is presented in the annexes at the end of the chapter. The NHA framework organizes the data into four principal dimensions: financing sources, financing agents, providers and functions. Each dimension consists of a series of standardized entities or activities that allow for the organization of data in a coherent way. The dimensions are identified by a two-letter code and the entities and activities within each dimension are distinguished by a numeric code. The nomenclature used is an adaptation of the ICHA. The dimensions and codes for tracking child health expenditure are consistent with the framework presented in the Producers’ Guide. The ultimate origin of the funds spent on child health are called financing sources, denoted by the code FS. The financing sources are the entities that finance all types of child health services. Examples include the Ministry of Finance, households and donors. The next dimension refers to the entities that pool funds from different sources and decide what to spend the funds on (pay or purchase services). Thus, the entities named financing agents and identified by the code HF, have the programmatic control over how the child health funds are allocated. These entities are recipients of the funds from the financing sources but are the origin of the funds for the providers in the sense that they purchase their services directly. Examples include the office of the child health programme within the Ministry of Health, insurance schemes and NGO’s. The entities that deliver the child health goods and services are the providers, identified by the code HP. Providers include the hospitals and clinics where personal care is offered, but they also include laboratories, pharmacies and the offices that provide management and stewardship of child health programs. The functions, identified by the code HC, refer to the services and activities that are delivered for child health. The categories for the functions of health include the core health activities such as delivering curative and preventive care, stewardship and administration-related, capital formation, and health related activities (research and development in child health (Table 3.1). The core functions are denoted by the code HC and the health related functions by the code HCR. The availability of data for this dimension tends to drive the health accounts. The total expenditures under the child health subaccounts are decided based on functional classification. 3.2. Approach to assigning classification categories
Each NHA dimension is comprised of a series of entities. Each entity is classified with an alphanumeric code as suggested in the Producers’ Guide (see figure 3.1). This classification scheme is as follows:
• Letter code for the principal health dimension • Numerical code • Name

18 Guide to Producing CH Subaccounts
Figure 3.1: Construction of classification codes in the ICHA
In the case of the numerical codes, each additional number relates to a further level of disaggregation within the same category. The NHA classification satisfies certain criteria in the sense that the categories presented are relevant from the policy point of view, are mutually exclusive, and reflect international standards. 34 Nonetheless, it is flexible enough to allow for country specific categories and subcategories to be added for each dimension as long as this is done in the general framework of the NHA classification scheme. The possibility of adding more codes, and thus distinguishing subcategories, is useful when the level of analysis required by a particular policy concern can be addressed by different levels of detail within a given category. This also means that it is possible to eliminate categories that are irrelevant to the study of child health expenditures in a particular country. For example, if a country wishes to distinguish between public and private hospitals, a subcategory must be added because in the original ICHA classification this distinction does not exist. Original code: HP.1.1 General Hospitals New sub categories: HP.1.1.1 Government general hospitals HP.1.1.2 Non-government general hospitals Subcategory denotes a nationally relevant category. When one introduces new subcategories as done above, the first two digits of the code should match the ICHA categories. The ICHA categories described in the Producers’ Guide for financing sources (PG, p. 36, Table 4.1), financing agents (PG, p. 37, Table 4.2) and providers (PG, p. 39, Table 4.3) should be used in developing the child health subaccounts. National categories as described above could be created as subclassifications within ICHA. Some of these are shown in Tables 3.2-3.4. 3.3. NHA tables and the child health subaccounts
The NHA tables provide information on the flow of funds from one dimension to another. In order to have a complete picture of the flows in the health system, four basic tables are recommended:
34 Producer’s guide
Dimension
HF.1.1.1.1 Ministry of HealthLetter code Numerical code Name
Dimension
HF.1.1.1.1 Ministry of HealthLetter code Numerical code Name

Guide to Producing CH Subaccounts Classification scheme and tables 19
(1) Financing source to financing agents (FS x HF), (2) Financing agents to providers (HF x HP), (3) Financing agents to health care function (HF x HC), and (4) Providers to health care functions (HP x HC).
Other tables are constructed if there are specific needs by policymakers and if data are available. Please refer to the NHA Producer’s Guide (Chapter 5) for descriptions of other tables which include, among others: providers to resource inputs; financing agents to resource inputs; financing agents to population grouped by age and sex; financing agents to population grouped by income; financing agents to disease groups; and financing agents to population grouped by geographic location. The NHA tables are linked to each other through the entities that make up the rows and columns of each table. The recipients in one table (e.g., the financing agents in the FS x HF table) may make up the originators of funds in another table (e.g., the financing agents in the HF x HP table). Tables may also have the same originators (e.g., financing agents in HF x HP and HF x HC tables).
Figure 3.2 NHA tables
In table one of Figure 3.2, the funds transferred from the Ministry of Finance (“originator”) to the Ministry of Health (“recipient”) is A, and the funds transferred between the Ministry of Finance (“originator”) and the Ministry of Education (“recipient) is C. That is, the amount in each cell represents a given transaction or “flow” within the system. The total amount spent by each “originator” is shown at the bottom of each column. Similarly, the total amount received by a given “recipient” appears at the end of each row. The NHA tables are also linked to each other. This link presents the flow of funds between the different dimensions. As shown in tables 1 and 2 from Figure 3.2, the row headings from one table (financing agents as recipients in table 1) become the column headings in the other table (financing agents as originators of the flow towards providers). The total expenditure from each table, represented by the bottom right cell, has to be the same in all the tables. 3.3.1. Basic tables for child health subaccounts
As with the NHA, four basic tables are recommended for child health subaccounts (Figure 3.3). However, as a minimum, countries should aim to produce the tables HF x HP and HF x HC distinguishing at the HF dimension the public and private actors, and using at least one digit code at the HC and HP dimensions.
Financing agentsMinistry of Finance Donors Employers Households TOTALS
Ministry of Health A B A+BMinistry of Education C CInsurers D E D+EHouseholds F FTOTALS A+C B+D E F G
ProvidersProviders Ministry of Ministry of Insurers Households TOTALSPublic hospitals W X W+XPrivate hospitals C CPublic clinics Y YTOTALS W=A+B C X+Y=D+E F G
Financing Sources
Financing Agents
Table
Table

20 Guide to Producing CH Subaccounts
The formats of the first three main child health subaccount tables are shown in illustrative tables, Tables 3.2 to 3.4. The format for the providers by functions table does not need to be shown as the provider dimensions for this table is presented in Table 3.2 and the functions dimensions in Table 3.3. The category codes indicated are standard codes followed in the NHA (see Producers’ Guide – Chapters 3 and 4). Codes are provided to be used as common reference when examining subaccounts tables estimated for different countries and when comparing subaccounts results to the country's NHA.
Figure 3.3 Recommended tables for child health subaccounts
Other subaccounts tables in addition to the basic four may be constructed. The decision to do so depends upon expressed need by policymakers and other users in the country and, of course, also depends upon data availability. 3.3.2. Aggregates
Among the types of aggregates or totals generated for NHAs, equivalents for child health expenditures will be compiled for three types of NHA totals: The NHA total current health expenditures, the NHA total health expenditures or THE; and the NHA national health expenditures or NHE. The difference between these three aggregates is made explicit in Figure 2.1. The three types of aggregates for child health expenditures are as follows: Total current health expenditures on child health (TCHE-CH): This estimate is recommended as a minimum as this represents expenditures on core child health activities, goods and services. This total value will be comparable with other country estimates and with the TCHE from the general NHA. Total Health Expenditures (THE-CH): This estimate represents expenditures on core child health activities, goods and services as well as capital formation for child health (that is, THE-CH = TCHE-CH + capital formation for child health). This total value will be comparable with other country estimates and with the THE from the general NHA. National Health Expenditures (NHE-CH) on child health: This total includes the THE plus expenditures described in the NHA as health-related expenditures (other than capital formation). These additional components include for example expenditures for medical education on child health activities, for research and development on child health, and for food hygiene and drinking water control. Targeted expenditures on child health (Tar-HE-CH): This total refers to the amount spent on child health that is directed or earmarked for child health. For example, the expenditure on public health programs that is targeted for the health of children under five years of age, or the expenditure on neonatal wards.
Financing sources - FSFinancing agents - HF
Providers - HP
Functions - HCFS
HF HF
HFHP
HP
HC HC
Financing sources - FSFinancing agents - HF
Providers - HP
Functions - HCFS
HF HF
HFHP
HP
HC HC
Financing sources - FSFinancing agents - HF
Providers - HP
Functions - HCFS
HF HF
HFHP
HP
HC HC

Guide to Producing CH Subaccounts Classification scheme and tables 21
Non-targeted child health expenditures (NTar-THE-CH): Non-targeted expenditures refer to expenditures on activities that are not specifically identified for the treatment, management or prevention of childhood illness. Maintaining a health information system, providing care in general hospitals that also serve children under five years of age, or operating public health facilities, are examples of these types of expenditures. A portion of these non-targeted funds can be attributed to child health expenditure (refer to the section on data analysis for more detail). Note that, in both targeted and non-targeted expenditures, there is a proportion of expenditure that is done regardless of the extent of childhood illness, and independent of an explicit demand for a particular service. For example, the total salary cost for pediatric physicians and nurses is generally not dependant on the number of children treated A more detailed description of the suggested aggregates and the indicators produced is presented in Chapter 5. 3.4. Child health expenditures: illustrative examples
The boundaries for the child health subaccounts are established by the activities that are targeted for the restoration or maintenance of child health. The activities refer to those services delivered directly to the child or that have a direct impact on the health of the child. A general list of these activities is presented in the following table. The child health activities have been adapted to the International Classification of Health Accounts that provides the functional classification of NHA. If a country has activities that do not appear in this list, these can be included provided that the basic classification scheme is followed. 35
Table 3.1 Functional classification for child health interventions and activities
ICHA Code Description
HC.1-HC.5 Personal health services and goods
HC.1 Services of curative care (inpatient and outpatient)
HC 1.1 Inpatient curative care
HC1.1.1 • Care of the newborn – clean cord care, newborn resuscitation, temperature management, case management of neonatal pneumonia and sepsis
HC1.1.2 • Management and care of childhood illness – for children aged 29 days - 59 months. (e.g. IV for dehydrated children; treatment of cerebral malaria, management of neonatal infections, severe malnutrition, and severe pneumonia)
HC1.1.3 • Management of HIV/AIDS exposed children
HC1.1.4 • All other curative inpatient services provided to children 0-5 (e.g. injuries)
35 According to the PG (page 5), a classification scheme should satisfy the following criteria:
• It should represent an important, policy relevant dimension, and should partition the dimension in policy relevant ways. • It should partition the dimension in a mutually exclusive and exhaustive way, so that each transaction of interest can be
placed in one –and only one- category. • It should respect and reflect, to the extent possible, existing international standards and conventions. • It should be feasible to implement using the data available.

22 Guide to Producing CH Subaccounts
ICHA Code Description
HC1.2 Day cases of curative care
HC1.3 Outpatient curative care
HC1.3.1 • Care of the newborn – clean cord care, newborn resuscitation, temperature management, case management of neonatal pneumonia and sepsis
HC1.3.2 • Management of childhood illness – for children aged 29 days - 59 months. (e.g. treatment of malaria with anti-malarials, management of neonatal infections, malnutrition, pneumonia and diarrhoea)
HC1.3.3 • Management of HIV/AIDS exposed children
HC1.3.4 • All other curative outpatient services provided to children 0-5
HC 1.4 Services of curative home care
HC.2 Services of rehabilitative care
HC.3 Services of long-term nursing care
HC.4 Ancilliary services to health care
HC.5 Medical goods dispensed (to outpatients) 36
HC 5.1 Pharmaceuticals and other non-medical durables
HC 5.1.1 • Prescribed medicines
HC 5.1.2 • Over-the counter medicines
HC 5.1.3 • Other medical nondurables
HC 5.2.5 • ORS
HC 5.2.6 • Breast milk substitutes for HIV/AIDS exposed children
HC 5.2.7 • Vaccines
HC 5.2.8 • Micronutrients supplementation given directly to all under fives (e.g. Vitamin A Programme,
Iodized salt etc)
HC 5.2.9 • ITNs for child health
HC.6-7 Collective health services
HC.6 Prevention and public health services
HC 6.1. Maternal and child health
HC 6.1.1 Delivery of preventive care 37
36 Self-purchased only. 37 Service delivery costs including time of health worker costs

Guide to Producing CH Subaccounts Classification scheme and tables 23
ICHA Code Description
HC 6.1.1.1
HC6.1.1.2
HC6.1.1.3
HC6.1.1.4
HC6.1.1.5
• Breast feeding counseling and promotion of complementary feeding
• Immunization programme
• Targeted food supplementation to identified malnourished children: Nutrition programme
• Expenditure on PMTCT
• Other - All other preventive health services provided to children from 0 to less than 5 years, (e.g. prevention of injuries and violence, deworming)
HC 6.1.2. Promotion of child health (IEC, social mobilization)
HC 6.1.2.1
HC 6.1.2.2
HC 6.1.2.3
• Breastfeeding promotion
• Immunizations
• Other preventive health services provided to children from 0 to less than 5 years, including prevention of injuries and violence
HC 6.1.3. Central level management functions for child health
HC 6.1.3.1. • Guideline development,
HC 6.1.3.2. • In-service training
o In-service training of health facility staff for the delivery of child health services
o In-service training of hospital staff for the delivery of child health services
HC 6.1.3.3 • Monitoring and surveillance of prevention programs
HC 6.1.3.4 • Training of Community Health Workers to deliver specific child health activities such as immunization
HC 6.3. Prevention of communicable disease
HC 6.3.1 • Water and sanitation activities targeted at eliminating water borne disease when delivered as part of a child survival program
HC.7 Health administration (stewardship) and health insurance
HC7.1 General government administration of health (e.g. formulation, coordination, administration and monitoring of child health policies, programs and plans, preparation of legislation, production and dissemination of information)
HCR.1-HCR.5 Health-related functions
HCR.1 Capital formation of health care provider institutions
HCR.2 Education and training of health personnel
• Pre-service training for the delivery of child health services
HCR.3 Research and development in child health
HCR.5
Environmental health
General Water and sanitation activities - i.e. not those specifically delivered as part of a child survival program

24 Guide to Producing CH Subaccounts
Table 3.2 Financing sources (FS) by financing agents (HF)
FS.1 Public Funds FS.2 Private Funds FS.3 FS.nsk
Code Financing Agent (HF)
FS.1.1.1 Central Gov
Revenue
FS.1.1.2 Regional
and Municipal
Govt. revenue
FS. 1.2 Other
Public funds
FS.2.1.1 Parastatal Employer
Funds
FS.2.1.2 Private
Employer Funds
FS.2.2 Households
FS.2.4 Other private funds
Cooperating Partners (Rest of the World)
Not specified by any kind Row Total
HF.1.1.1 Ministry of HealthHF.1.1.2 Regional Ministries of healthHF.1.1.3 Other MinistriesHF.1.2 Social Security Fund HF.2.1. Employer insurance programHF.2.5.1 Parastatals
HF.2.2 Private Insurance Enterprises (other than social insurance)
HF.2.3. Private household out of pocket payments
HF.2.4 Non profit institutions
HF.2.5 Private firms and corporations (other than health insurance)
HF.3 Rest of WorldHF.nsk Not specified by any kind
Column Total (THE-CH)
HF.4 Financing Agents spending on Health Related ItemsColumn Total (NHE-CH)
Financing Source (FS)

Guide to Producing CH Subaccounts Classification scheme and tables 25
Table 3.3 Financing agents (HF) by providers (HP)
Financing AgentHF.3 ROW HF.nsk
HF.1.1.1 HF.1.1.2 HF.1.1.3 HF.1.2 HF.2.1. HF.2.5.1 HF.2.2 HF.2.3. HF.2.4 HF.2.5 HF.3 HF.nsk
Provider
Ministry of Health
Regional Ministries of
health
Other Ministries
Social Security
Fund
Employer insurance program
Parastatals
Private Insurance
Enterprises (other than
social insurance)
Private household
out of pocket payments
Non profit institutions
Private firms and
corporations (other than
health insurance)
Rest of World
Not specified by any kind Row Total
HP.1 Hospitals HP.3 Providers of ambulatory health care HP.3.1 Offices of physicians HP.3.2 Offices of dentists HP.3.3 Offices of other health practitioners HP.3.4 Out-patient care centers HP.3.5 Medical and diagnostic laboratories HP.3.9.1 Ambulance services HP.3.9.2 Blood banks (CNTS transfusion) HP.3.9.9 All other ambulatory health care
services HP.4 Retail sale and other providers of
medical goods HP.4.1 Dispensing chemists HP.5 Provision and admin of public health
programs HP.6 General health administration and
insurance HP.nsk Providers not specified by any kind
Column Total THE-CH
HP.8 Providers of Health Related Services
HP.8.1 Research Institutions
HP.8.2 Education and training institutions Subtotal for health relatedColumn Total NHE-CH
HF.A Public Sector

26 Guide to Producing CH Subaccounts
Table 3.4 Financing agents (HF) by functions (HC)
Financing Agent HF.1.1.1 HF.1.1.2 HF.1.1.3 HF.1.2 HF.2.1. HF.2.5.1 HF.2.2 HF.2.3. HF.2.4 HF.2.5 HF.3 HF.nsk
Function
Ministry of Health
Regional Ministries of
health
Other Ministries
Social Security
Fund
Employer insurance program
Parastatals Private Insurance Enterprises (other
than social insurance)
Private household out of pocket payments
Non profit institutions
Private firms and corporations (other
than health insurance)
Rest of World Not specified by any kind
Row total
HC.1 Services of curative careHC.1.1 Inpatient curative care HC.1.2 Day cases of curative care HC.1.3 Outpatient curative care
HC.1.4 Services of curative home care
HC.2 Services of rehabilitative care
HC.3 Services of long-term nursing care
HC.4 Ancilliary services to health care
HC.5 Medical goods dispensed to patients
HC.6 Oprevention and public health services
HC.7 Health administration and health insurance Column Total THE-CH
HCR.1
Capital formation for child health of health care provider institutions
HCR.2 Education and training of health personnel
HCR.3 Research and development in child health
HCR.5 Environmental health Column Total NHE-CH

Guide to Producing CH Subaccounts Data identification and collection 27
4. Data identification and collection
The following chapter describes the considerations one must take when identifying and collecting data for NHA child health subaccounts. Before identifying data and the best collection methods, it is important to determine the policy questions one hopes to answer and determine the necessary tables and details of classifications to produce. While making a plan for obtaining the desired data, the NHA team must determine whether primary data collection is necessary or if the data can be extracted from secondary sources. The team also needs to consider what is feasible to obtain, given available resources and what the trade-offs are in considering the information gathering exercise. Once the initial data and source identification is complete, the NHA team should create a data collection plan to move forward. The collection of data may take several months and a data collection plan will ensure that the process is carried out in an organized way. At the time of writing this report, child health subaccounts have been conducted in four countries, namely Bangladesh, Ethiopia, Malawi and Sri Lanka. The methodology is thus in an early stage of development and the content of this chapter will be subject to improvements while the methodology is tested in other countries and as the application of subaccounts becomes more widespread. This chapter provides a description of the methodological approach taken to identify child health expenditures, and in doing so documents the different approaches used in the four countries. 38 4.1. Approaching the data identification process
Child health subaccounts calls for a gathering of comprehensive data estimates from all financing sources (public, private, and donor) of the health care system. The time and resources needed for this task will depend on many factors such as the availability of existing data within a country, the ability to access existing data, the resources available to implement surveys if need be, the level of cooperation given by gatekeepers of data sources and/or survey respondents, and team efforts to keep up the momentum of data retrieval by regular follow-ups with providers of data. This chapter will focus on the specific data collection issues and processes relevant to the child health subaccounts. As a general rule for both NHA and child health-specific subaccounts, every effort should be made to “triangulate” the data by obtaining more than one information source for any given datum. For example, if estimating the funds provided by donors to the MOH for child health, the NHA team should examine what donors report giving to the MOH and also what the MOH report receiving from donors for child health. 39 Further descriptions on triangulation and data retrieval for general health expenditures are provided in detail in the Producers’ Guide (PG, Chapter 6). Understanding the importance of triangulation influences the data identification process and the data collection as a consequence.
38 In Bangladesh and Sri Lanka, the approach involved taking the existing health accounts estimates of national health expenditures, and applying a variety of methods (secondary data, experts opinion) to disaggregate each element of expenditure into the portions that benefit children and those which do not. In Ethiopia and Malawi, the CH Subaccounts were done in conjunction with the general NHA analysis. The main method of data collection was the use of NHA questionnaires, which contained a section on total health expenditure and a section on child health expenditure; and secondary data. 39 If the two sources report a different amount, it is recommended to verify if the sources have an audit document that could back up the data. If one of the sources has such a document, then that source should be privileged over the other. If none, or both sources, have an audit document, then the differences between the two reported amounts should be reconciled by identifying the source of difference, by looking at the methodology used to arrive to those amounts.

28 Guide to Producing CH Subaccounts
4.1.1. Understanding what you need and why you need it
The starting point for the data collection process is having an understanding of what data is needed and why. In practical terms, this means identifying “who is funding whom and for what purpose are those funds used?” to the best of your team’s knowledge. This process involves listing all known entities (financing agents, financing sources, providers and functions) associated with child health and then mapping the flow of funds between them (See Figure 4.1 for an example). Generating this map of the general health expenditure is very useful because it offers a reference point from which to start the data collection. For example, Figure 4.1 shows that the regional government revenues are first channeled through the regional health bureaus, which then transfer the funds between different providers. In this case, the providers are regional hospitals and private and public primary health care units. Conceptualizing the map of funding flows for child health is be a good exercise for determining the objectives of the child health subaccounts and the relevant policy questions given the country context. A brief description of the link between child health and policy-relevant questions was presented in Chapter 2. Child health expenditure indicators are described in Chapter 7. 4.2. Data collection
After conceptualizing the map of funding flows, the NHA team will then be able to identify the entities from which data estimates are needed. It is important that the NHA team understands why such estimates are needed and how those estimates will specifically inform the NHA tables. Table 4.1 provides a generic listing of entities involved in child health care, the types of child health subaccounts-related questions that can be addressed to retrieve estimates, and the potential sources of data for these entities 4.2.1. Types of data
The objective of the child health subaccounts is to capture “what has been spent on child health,” (namely “child health expenditures”), “how has it been spent” and “to where are the funds directed.” The NHA team should primarily search for information on expenditure amounts and not budget or cost estimates. 40
40 The Producers’ Guide recommends using estimates calculated based on an accrual methodology and not a cash based accounting system. Thus, in addition to actual cash disbursements made during the year of estimation, the NHA team should also include obligated amounts in their annual expenditure estimate. For example, if health care equipment was obtained in December 2003 but the actual cash transfer did not take place until February 2004, the value of the equipment should still be included in the NHA 2003 estimate.

Guide to Producing CH Subaccounts Data identification and collection 29
Figure 4.1 Example of a map of the flow of funds for child health
However, in several cases such expenditure data is not readily available or retrievable from secondary data sources. In such cases, alternative data will be needed. Past experience shows that it was necessary to obtain unit cost data derived from expenditures and utilization indicators in order to estimate child health subaccounts. This and other uses of cost and utilization data are described further in Chapter 5. The data that is available to the team for the child health subaccounts will determine or influence the different expenditure estimation techniques that must be employed during the analysis phase.
FINANCINGSOURCES
FINANCINGINTERMEDIARIES PROVIDERS
FS.1.1.1 Centralgovernment revenue
FS.1.1.2 Regionalgovernment revenue
FS.2.1 Privateemployer funds
FS.2.2 Householdfunds
FS.3 Rest of theworld funds
HF.1.1.1.1 Ministry ofHealth
HF.1.1.1.2 Ministry ofEducation
HF.1.1.1.3 Otherministries
HF.1.1.2 Regional HealthBureaus
HF.2.3 Households’ OOPpayment
HF.2.4.1 NGOs
HP.1.1.1 Federal hospitals
University and teachingfacilities
Pharmacies
HP.1.1.2 Regionalhospitals
HF.3 Rest of the world
FS.2.3 Non-profitinstitutions funds
HF.2.2 Private insuranceenterprises
HP.3.4.5.1 Public PrimaryHealth Care Units
HP.3.4.5.2 Private (for-profit and not-for-profit)
Primary Health Care Units
HP.1.1.3 Private (for-profitand not-for-profit)
hospitals

30 Guide to Producing CH Subaccounts
Table 4.1. Relationship between needed data estimates and the child health subaccounts-related questions they inform and potential data sources
Child health care entities
Note that each entity listed can be a financing agent and/or a financing source and/or a provider
Child health subaccounts-related questions addressed by data estimates on each entity
The questions asked to each entity will vary depending on the role taken by it (financing agent, financing source, provider).
Potential data sources
Government entities
E.g. Ministry of Finance, Ministry of Health, and other relevant government entities
• Government as financing source:
o How much and to which financing agents does the Ministry of Finance give child health funds? (for the FSxHF table)
• Government as financing agent:
o From which financing sources do the various ministries (excluding the Ministry of Finance) receive their child health funds? How much is received? (for the FSxHF table)
o How do the various ministries (excluding the Ministry of Finance) allocate their child health funds across each type of provider and function? (for the HFxHP, HPxHC and HFxHC tables)
• Budget and Expenditure books, Audited Government Accounts, Expenditure print-out copies
• HMIS reports-utilization data by age: outpatient, admissions, inpatient days by age, average length of stay by facility type etc
• Existing unit cost studies by type of intervention/ facility type
• Special survey of selected providers by level of care/ region etc
Insurance Companies/Schemes
• Insurance companies as financing agent:
o Do insurance schemes offer child health benefits? If so, how much was paid out in the year of estimation? For what services and providers? (for the HFxHP, HFxHC, and HPxHC tables)
• Insurer records preferable by age group
• Special national sample survey of firms and corporations.
• National sample survey of health insurers or census of health insurers
Employers • Employer as financing source
o How much and to whom (financing agents such as insurance schemes) do employers give funds that are ultimately used for child health care? (for the FSxHF table)
• Employer as financing agent and provider
o How much do they spend on child health in their on-site facilities? (For the HFxHP, and HFxHC)
• Existing reports of firms expenditures on health or utilization of their health services by age group
• Special national sample survey of firms and corporations
NGOs • NGOs as financing source
o Do NGOs serve as financing sources for child health by generating their own revenue from local philanthropy (e.g. church groups)? If so, how much of the funds generated by this mechanism go to child health?
• Existing NGO reports on health expenditures or utilization of their services by age groups etc
• Special national sample survey of NGOs or census of all NGOs involved in financing and delivery of child health services and goods.

Guide to Producing CH Subaccounts Data identification and collection 31
Child health care entities
Note that each entity listed can be a financing agent and/or a financing source and/or a provider
Child health subaccounts-related questions addressed by data estimates on each entity
The questions asked to each entity will vary depending on the role taken by it (financing agent, financing source, provider).
Potential data sources
• NGOs as financing agent:
o From which financing source do NGOs receive their CH funds? How much was received? (For the FSxHF table)
o How do NGOs allocate their funds across each type of provider and function? (For the HFxHP, HPxHC, and HFxHC tables)
Households
• Households as financing agent:
o How much do households pay out-of-pocket for inpatient and outpatient services at various providers, including drugs and vaccines? (For the FSxHF, HFxHP, HFxHC, and HPxHC tables)
• Existing Household Health Expenditure and Utilization reports containing data on expenditures and utilization by age groups e.g., ero to four years old
• Existing Household Health Utilization reports/databases by age group etc e.g. DHS
• Existing Provider records/ survey reports
• Special Household Health Expenditure and Utilization surveys with a special module for child health
Donors • Donors as financing source:
o To which financing agents do donors contribute their child health funds? How much is contributed? (For the FSxHF table)
• Donors as financing agent:
o Do donors transfer their funds directly to providers? If so, to which ones? How much, and for what functions? (For the HFxHP, HPxHC, and HFxHC tables)
• Existing Public Health Expenditure Review reports
• Existing Donor Health Expenditure/Disbursement reports/databases
• Special survey of all donors involved in funding child health services and goods
• Ministry of Finance or Central Bank records for donor receipts by functions
Providers
Hospitals (HP.1), nursing and residential care facilities (HP.2), providers of ambulatory health care (HP.3), Retail sale and other providers of medical goods (HP.4)
• How much does each provider receive from each financing agent? (For the HFxHP tables)
• How do providers spend their funds across each type of function? (For the HPxHC table)
• Existing provider records on health expenditures or utilization by age
• HMIS reports-utilization data by age: outpatient, admissions, inpatient days by ward, average length of stay by facility type/by ward etc
• Existing unit cost studies by type of intervention or facility type
• Special national sample survey of selected facilities by ownership:

32 Guide to Producing CH Subaccounts
Child health care entities
Note that each entity listed can be a financing agent and/or a financing source and/or a provider
Child health subaccounts-related questions addressed by data estimates on each entity
The questions asked to each entity will vary depending on the role taken by it (financing agent, financing source, provider).
Potential data sources
MOH, Private not-for-profit, Private for-profit by level of care-health centre, district hospital, central hospital and region-North, Centre and South
Providers of public health programs (HP.5)
• From which financing agents do the providers of public health programs receive their funds? How much do they receive? (For HFxHP and HPxHC tables)
• Budget and Expenditure books, Audited Government Accounts; district accounts,
• Survey of non - governmental organizations
Of course, the ideal situation is to have detailed expenditure data for child health (e.g. expenditure for inpatient and outpatient care for children in public and private hospitals, clinics, out-of-pocket spending for drugs to treat children under five etc.). Pilot tests to date however have shown that these types of information are not readily available. In all four countries where the child health subaccounts have been estimated, it was necessary to make several assumptions and to use unit cost, utilization data or population data to apportion expenditures. Also notable is that in each of the four countries (Bangladesh, Ethiopia, Malawi, Sri Lanka), the child health subaccounts were estimated using the general NHA as a starting point and using utilization data to determine what proportion of expenditure for each financing agent and provider went to child health. This topic will be further developed in Chapter 5 on data analysis techniques. For the data analysis phase, data outside of general NHA data is needed to compute key policy indicators for use in the NHA-child health subaccounts report. Examples of this additional data include total expenditure and general government expenditures for child health per children under five, per immunized child, per annual number of under-five deaths. Chapter 7 presents a detailed list of suggested indicators. 4.2.2. Identifying data sources
After identifying all the data collection needs, the team’s next step is to determine where to obtain these data. 41 Data sources can be organized into two broad categories: primary and secondary sources. These data can be obtained through various methods: sample surveys, or census for primary sources and desk review, and Internet searches for secondary sources. To minimize financial costs for the data collection phase and to avoid unnecessary duplication of efforts, the NHA team should first search for secondary sources of information for all needed information as in Table 4.1. If secondary sources of data are clearly unavailable or inadequate, primary sources of data should then be collected using child health-specific surveys and questionnaires designed to collect data on child health. A. Secondary sources
41 For further information on data collection needs, refer to Chapters 6 and 7 of the Producers’ Guide

Guide to Producing CH Subaccounts Data identification and collection 33
A.1 Routine data reports A.1.1 Financial information: In most low and middle income countries, governments produce annual budgets expenditure reports e.g. government budgetary records; MOH (or other ministries) annual expenditure reports; executed financial operations of social security schemes; insurer financial reports and budgets; provider reports and budgets; employer and private companies annual reports; For more details on the strengths and weaknesses of these secondary data sources, see Chapter 6 of the Producers’ Guide.
Table 4.2: Examples of routine financial information data sources
Health care entity Name of secondary data source (existing studies/reports)
Government Bangladesh
- Annual Government Budget-Government Development Budget 42Ethiopia:
- MOFED executed budget
- Health and Health Related Indicators 1997. Planning and Programming Department, FMOH.
Malawi:
- Government budget books
Sri Lanka:
- Electronic records from Sri Lanka NHA phase 3 study
A.1.2 Non-financial information (Health Information System- HIS): This is perhaps the most accessible data source for non-financial information. At the onset, the team should list the data that are available through the HIS system and assess how these data can be used for the child health subaccounts. A way of doing this is to analyse the form that is completed by the facilities for reporting their outpatient and inpatient activities (refer to Box 1 for an example). For examples of the data that should be collected for analysis, see Table 4.3.
Table 4.3: Information needed for data analysis from the Health Information System
To inform estimation techniques particularly when disaggregated expenditure data is not available.
• Utilization data- e.g. % of inpatient admissions and outpatient visits attributable to children, average length of stay, inpatients days. These proportions may be used to estimate the amount of general revenues (not targeted) that is indirectly used to deliver child health services.
• Number of admissions by age group (if information available, broken down by diagnosis) per type of facility
• General expenditure breakdown at facilities between inpatient and outpatient. The same ratio may be used to disaggregate expenditure at a given facility if functional data is not available.
• Health commodity or service unit costs
42 In Bangladesh, donor assistance to health and family welfare is accounted for in the development budget of the government. These funds are primarily used for construction, addition or alterations to existing facilities, training and education, children’s immunization and family welfare programs. These expenditures are documented in the Annual Government of Bangladesh budgets from where the child health expenditures were extracted.

34 Guide to Producing CH Subaccounts
BOX 1: Example of Hospital discharge form (Ethiopia)
Discharged Patients’ Report of all Hospitals in the Region
Patient Discharged Patient by Age Group by group of length of Stay ys
Summary Report of Discharged Patients by Department/Ward/Type of case
ype of case beds harges stay in days eaths d to other
s
fy)
Information systems can provide data that can help with functional classifications, such as utilization rates by population groups or by types of facilities, and sometimes diagnosis or cause of illness data. For example, when information about expenditure for inpatient care from public hospitals is not readily available, the hospital discharge data on inpatient-days for children under five can be used to approximate this expenditure. Hospital discharge forms will often contain information on the patient’s age, sex and average length of stay. This information is then condensed into a hospital report that provides national figures on inpatient stays and average length of stay by age and sex. It is then possible to identify the proportion of hospital discharges that are for children. If the total amount spent at that hospital is also known, that percentage is applied to identify of total inpatient care expenditure for children in hospital. One limitation of this method is that it assumes that the expenditure of an inpatient stay is the same across age groups. For more details on the use of these data in estimating child health expenditures, see Chapter 5. The level of detail provided and the quality of data in these systems will also differ from country to country, and low-income countries may have less developed information systems. While much data may be collected, less data may be reported. Experience in conducting child health subaccounts to date indicates that existing information systems in countries have certain deficiencies both in terms of the type of data reported, which is limited, and the number of facilities reporting to the central level. A factor that often limits the reporting from health facilities is the degree of decentralization of the health care system. In Ethiopia for example, most data are managed at the regional level and there are no clearly established procedures for transmitting data from the regions to the central level. In this case, it is necessary to conduct data collection at the regional level in addition to the central level. Depending on the number of regions in a country, this task can be very time consuming. Even if this method is imperfect, it provides guidance for understanding the distribution of expenditure within facilities that have child health services. Reviewing the data provided by a country’s health information system will also allow identifying its data gaps or areas that could be improved upon if the child health subaccounts were to be estimated on a regular basis.

Guide to Producing CH Subaccounts Data identification and collection 35
A.2 Non-Routine data reports A.2.1 Existing reports/databases of non-routine surveys: Examples of non-routine surveys reports include DHS; Income and Expenditure Survey; Household health expenditure and utilization survey; Welfare Monitoring Survey; Living Standards Measurement Study (LSMS) household surveys; Multiple Indicator Cluster Survey (MICS) or general NHA report surveys or databases. Table 4.4 shows some of the secondary data sources for local non-routine surveys which could be found in most countries office shelves and were used in the 4 pilot countries. Table 4.4. Examples of survey reports available in-country “On Office Shelves” and used for child
health subaccounts
Health care entity Name of secondary data source (existing studies/reports)
Households Bangladesh:
- Household Survey
- Health and Demographic survey 1999-2000
Ethiopia
- Household Income Consumption and Expenditure, Ethiopia 1999/2000. Central Statistical Agency.
- Welfare Monitoring Survey 2004. Central Statistical Authority, Addis Ababa, June 2004.
- General NHA study
Sri Lanka:
- Central Bank Consumer Finance Surveys, 1996/97 and 2003/04
- Sri Lanka Household Health Survey 1991
Providers Bangladesh
- NHA data base and NHA report 1999-2001
Ethiopia:
- ESHE. Twelve Baseline Health Surveys. USAID: Ethiopia. March 2005
- USAID, Pathfinder. Knowledge, Attitudes, and Practices in Family Planning in Amhara, Oromia, SNNPR and Tigray regions of Ethiopia. June 2005.
- General NHA study
- Sri Lanka
- Phase 3 of Sri Lanka health accounts database which is maintained as an electronic database, which codes all covered expenditures by year, source of funds, function, provider and provincial location of spending.
Donors and NGOs Ethiopia
- USAID Contraceptive Price List
- General NHA study
Table 4.5 provides an overview of some of the secondary data sources of international/national non-routine survey reports which could be found in most countries office shelves or websites were consulted

36 Guide to Producing CH Subaccounts
by child health subaccounts teams in the four pilot countries. These sources of information could be vital for triangulation and cross-checking estimates.
Table 4.5: Examples of international databases for non-routine survey reports
Health care entity targeted by data source
Name of secondary data source (existing studies/reports)
All National health accounts (NHA) website [www.who.int/nha/en]. The website provides country information (database, focal points etc.) as well as the NHA documents and links to other NHA sites.
Donors International Development Statistics (IDS) online Databases on aid and other resource flows [www.oecd.org/dataoecd/50/17/5037721.htm]. These databases cover bilateral and multilateral donors' aid and other resource flows to developing countries and countries in transition.
Households For utilization data and in some cases expenditure information, the Demographic Health Survey [www.measuredhs.com] can be a good source of information- particularly for countries with poor information systems and a broad mix (public and private) of provider types. Implemented in over 75 countries, the DHS “are nationally-representative household surveys with large sample sizes (usually between 5,000 and 30,000 households). DHS surveys provide data for a wide range of monitoring and impact evaluation indicators in the areas of population, health, and nutrition. Typically, DHS surveys are conducted every 5 years, to allow comparisons over time. Interim Surveys focus on the collection of information on key performance monitoring indicators but may not include data for all impact evaluation measures (such as mortality rates). These surveys are conducted between rounds of DHS surveys and have shorter questionnaires than DHS surveys. Although nationally representative, these surveys have smaller samples than DHS surveys (2,000–3,000 households).”
World Health Surveys [www.who.int/healthinfo/survey/en/index.html]. WHO has developed and implemented a Survey Program and a World Health Survey to compile comprehensive baseline information on the health of populations and on the outcomes associated with the investment in health systems; baseline evidence on the way health systems are currently functioning; and, ability to monitor inputs, functions, and outcomes. The results are available for a limited number of countries (18).
Living Standards Measurement Study (LSMS) [www.worldbank.org/lsms]. The main objective of LSMS surveys is to collect household data that can be used to assess household welfare, to understand household behavior, and to evaluate the effect of various government policies on the living conditions of the population. Accordingly, LSMS surveys collect data on many dimensions of household well-being, including consumption, income, savings, employment, health, education, fertility, nutrition, housing and migration
Multiple Indicator Cluster Survey (MICS) [www.childinfo.org/index2.htm] is a household survey program developed by UNICEF to assist countries in filling data gaps for monitoring the situation of children and women.
The survey questionnaires are modular tools that can be customized to the needs of a country. They consist of 3 questionnaires (the content of which is summarized below): a household questionnaire, a questionnaire for women aged 15-49, and a questionnaire for children under the age of five (addressed to the mother or primary caretaker of the child).
Household questionnaire: Household characteristics, household listing, education, child labor, water and sanitation, salt iodization, insecticide-treated mosquito nets, and support to children orphaned and made vulnerable by HIV/AIDS, with optional

Guide to Producing CH Subaccounts Data identification and collection 37
Health care entity targeted by data source
Name of secondary data source (existing studies/reports)
modules for disability, child discipline, security of tenure and durability of housing, source and cost of supplies for ITNS, and maternal mortality.
Women’s questionnaire: Women's characteristics, child mortality, tetanus toxoid, maternal and newborn health, marriage/union, contraceptive use, HIV/AIDS knowledge, malaria, polygymy, female genital cutting, and sexual behavior, with optional modules for unmet need, security of tenure, and attitudes toward domestic violence.
Children’s questionnaire: Children's characteristics, birth registration and early learning, vitamin A, breastfeeding, care of illness, malaria, immunization, and anthropometry, with optional modules for child development, and source and cost of supplies of ORS, antibiotics and antimalarias.
Other data sources
WHO MCH coverage survey
WHO Neonatal and child health profiles
Providers Service Provision Assessment survey [www.measuredhs.com]. Also conducted by the same group responsible for DHS (ORC MACRO), this survey includes a nationally representative sample of over 400 facilities and covers all types of health services sites from hospitals to health posts. Public, private, and faith-based institutions are all represented. It aims to obtain information about the health and family planning services available in a country.
The SPA survey offers a comprehensive assessment of a country’s health care services, including Costs, Availability of services, Infrastructure, Quality of care, Components of care, Data for Improvement
As of March 2005, SPA surveys have been completed in Bangladesh, Uganda, Kenya, Egypt, Ghana, and Rwanda. New surveys are underway or planned in Zambia, Guyana, Kenya, Egypt and Tanzania.
Health facility surveys
Short Programme Reviews
Routine Health Information System
B. Primary data sources B.1 Special child health subaccounts surveys Once it has been established that there are no secondary data sources or inadequate secondary data sources for child health subaccounts such as those highlighted above, special national sample surveys or census for entities involved in financing and provision of child health services should be undertaken specifically aimed at collecting child health subaccounts data as outlined in Table 4.1 column 2. These special surveys for child health should be undertaken using specifically designed child health questionnaires or module as seen in Annex 1.

38 Guide to Producing CH Subaccounts
When child health subaccounts are undertaken in tandem with general NHA, it is recommended that specially designed questionnaires or modules be added to the general NHA questionnaires as was the case in Ethiopia and Malawi. For more details see Annex 2. B.2 Adding rider Questions to Other Planned Surveys Another cost-effective method of obtaining primary data for child health subaccounts is to identify ongoing surveys in the country. Through negotiation and facilitation, the NHA team leader may be able to secure approval for the addition of questions on child health expenditures and/or programs to these ongoing surveys. This would allow for the retrieval of specific NHA child health data at little to no extra financial cost. For more details see Annex 2. When examining whether to add child health questions to ongoing surveys, the team should think of the following issues: What is the sampling size and sampling distribution of the ongoing survey? Will it be useful for obtaining national and annual estimates of child health spending by the entity of interest? Perhaps not all NGOs are targeted, for example. The NHA team should make sure that the sample frame includes the main contributors to child health among the entities surveyed. How many questions need to be added in order to determine who spends, how much, and for what child health services? Keep in mind the need to avoid burdensome questionnaires. Thus the goal should be to add as few questions as possible in order to meet your team’s data requirements. Confirm that they are not redundant after being addressed in the general NHA section. What is the time period within which respondents will be reporting? Sometimes, surveys like the DHS may ask households about expenditures on the last outpatient visit; however, for health accounts purposes, it is difficult to estimate accurately an annual outpatient expenditure amount from one visit. Thus to annualize the data, the team should investigate whether the survey includes a question on the “number of visits in the past month” and whether there is any seasonality associated with the utilization rates of child health services among households. Another issue that may arise is that an ongoing survey may ask donors to report on expenditures for a year that does not coincide with the time period being used in the NHA (they are sometimes done for the fiscal rather than calendar year). While in many cases the reported amounts may be adjusted to the year of choice by incorporating inflation rates and other factors, this assumes that the entity in question follows a steady trend in its spending practices. This assumption may not be accurate, particularly with donors. What is the workplan and time line for the ongoing survey? Does it coincide with your deadlines for producing child health subaccounts estimates? When can the NHA team expect the data set from this survey? This is a critical question when adding rider questions to surveys that are not coordinated by the NHA team. For example, if the timeframe of the ongoing survey is later than that anticipated for the subaccounts, it may be difficult to complete the tables on time. B.3 Household surveys – a few considerations One of the major advantages of the NHA framework is its inclusion of private sector data, particularly household information. In many developing countries, out of pocket expenditures for child health care are of particular interest to policymakers as they assess the burden of financing on households to pay for child health care. This is because direct household out of pocket payments have major negative effect on the utilization of health care services especially for poor. Thus, at the onset of the child health subaccounts process, it is critical that the issue of how to estimate household spending be addressed. Generally speaking, the team needs to either be able to access such data from the provider side (providers may

Guide to Producing CH Subaccounts Data identification and collection 39
record their out of pocket revenue) or from the household side. While feasible in countries where out of pocket payments can be linked to the type of service rendered, provider records may not be as easily accessible due to many reasons and chief among these is the fear by providers that the data might be used for other purposes such tax determination or the official figures obtained from providers might under reported due to the under the table payments by patients to providers which are not recorded in the official books. Thus, the team will need to rely on existing household survey reports for such data if available. However, this source of data also poses its own problems such as under/over reporting of household out of pocket payments due to sample and non-sampling biases if not properly dealt with during the time of the survey. For more details on the strengths and weaknesses of the household out of pocket surveys see the Producers’ Guide, Chapters 6 and 7. One of the goals of the analysis is also to estimate the out of pocket expenditure on drugs for children. This might be challenging to obtain since surveys providing this type of information are done sporadically, or not done at all. Nevertheless, it was possible to estimate these spending in Bangladesh using the DHS. Another issue is estimating expenditure on priority interventions such as IMCI. This will need a specific survey to collect such information especially from the household side. This highlights the importance of formulating the policy questions to be addressed by the child health subaccounts early on in the process. If policymakers consider it essential to know how much of child health spending is on priority interventions then data collection should be planned and funded accordingly. 4.3. Data collection plan
A useful step is the development of a data collection plan which includes a “census” of available data and team members responsible for retrieving each data source. In some cases, a careful strategy for secondary data retrieval will need to be developed, which may require higher-level intervention (i.e. from senior policymakers); thus, it is advisable that the “accessibility” of available data be assessed at the onset of the NHA activity. In addition, the plan should list all data collection efforts, if needed, as well as the team point person for each survey. The point-person may be necessary for making sure that child health questions to ongoing surveys are added or for coordinating and implementing a child health subaccounts-specific survey. The process of obtaining the data can be facilitated by consulting with the NHA Steering Committee if one exists (See Chapter 6 for more details). An example of a data collection plan is provided in Table 4.6. This plan was developed for the Kenya general NHA and provides a good example of team responsibilities, tasks, and deadlines in a data collection process. Similar plans can be followed for child health accounts. For each data source identified (first column), a person from the NHA team is designated to be responsible for obtaining the data (second column). The third column lists the person to contact to obtain the data. Finally, a deadline is set for obtaining the source in the fourth column.

40 Guide to Producing CH Subaccounts
Table 4.6: Kenya NHA data collection plan for secondary sources
Name of data source NHA team member responsible for obtaining the data
Person to contact to obtain
information
Deadline to collect
data source
Government Records
MOH Executed budgets or Expenditure Returns
Assistant Secretary - Finance Department, MoH;
Economist - Department of Planning, MoH
No need to contact 3rd party
1-Oct-02
Expenditure returns, Other Ministries (incl. MoE, MoD, MoLocal Government, MoHome Affairs)
Assistant Secretary - Finance Department, MoH;
Economist - Department of Planning, MoH
Contact each Ministry PS
15-Nov-02
Public Expenditure Review (PER) only MOH
Economist - Department of Planning, MoH
No need to contact 3rd party
1-Oct-02
HMIS annual report Head Officer, HMIS No need to contact 3rd party
1-Mar-03
Annual Ministry of Health Program Managers Report (for example: HIV, TB, EPI, Reproductive health, IMCI, Nutrition, and others)
Deputy Program Manager - NASCOP43, MOH Program Officer, National TB program, MOH
No need to contact 3rd party
1-Mar-03
Import-Export Records – Ministry of Finance
Economist, MOF&D Revenue Authority Commissioner
1-Feb-03
Other Public Records
District poverty reduction report Economist, Department of Planning, MoH;
Economist - Department of Planning, MoH
No need to contact 3rd party
15-Oct-02
Human Development report – UNDP UNDP representative No need to contact 3rd party
1-Oct-02
TB and Poverty report Program Officer, National TB program, MOH
No need to contact 3rd party
1-Nov-02
Wealth Index Economist, Department of Planning, MoH
No need to contact 3rd party
15-Oct-02
Donor Mapping report - activity expenditures
Economist - Department of Planning, MoH
Health Reform Secretariat (principal contact); USAID officer
15-Oct-02
Insurer Records
National Hospital Insurance Fund (NHIF) annual report
Health Economist, Department of Planning, MOH
Managing Director, NHIF
15-Oct-02
Parastatals
43 National AIDS Control Programme
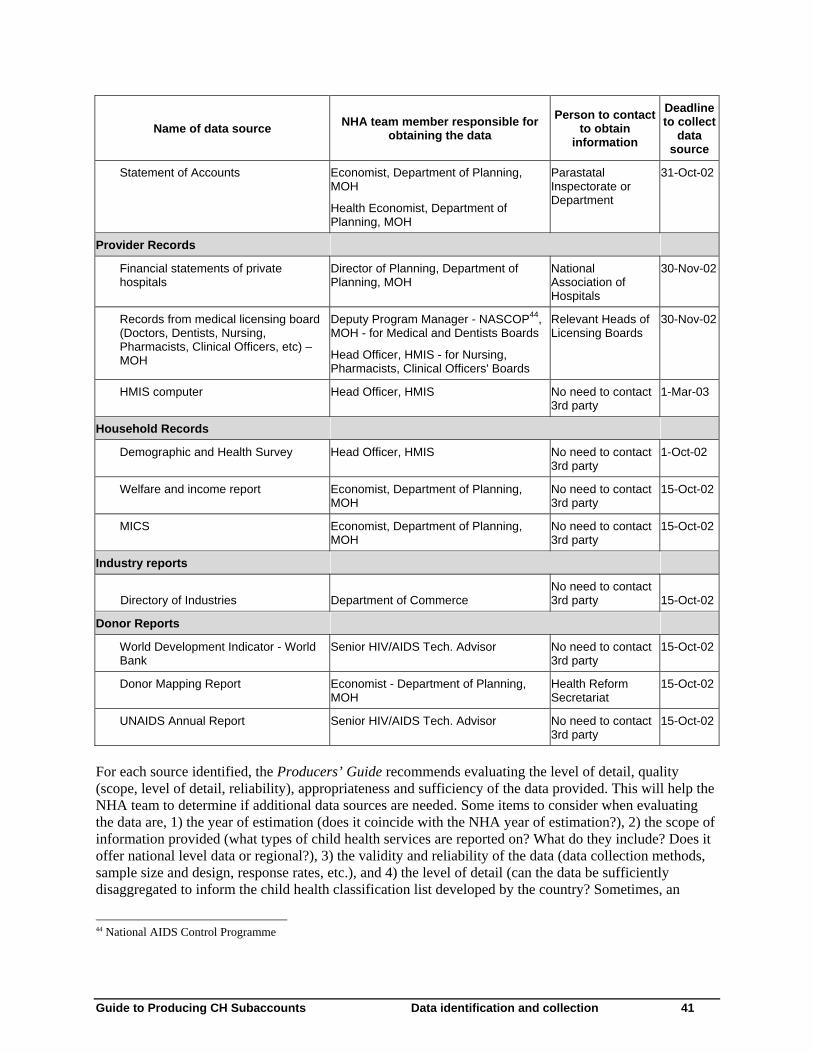
Guide to Producing CH Subaccounts Data identification and collection 41
Name of data source NHA team member responsible for obtaining the data
Person to contact to obtain
information
Deadline to collect
data source
Statement of Accounts Economist, Department of Planning, MOH
Health Economist, Department of Planning, MOH
Parastatal Inspectorate or Department
31-Oct-02
Provider Records
Financial statements of private hospitals
Director of Planning, Department of Planning, MOH
National Association of Hospitals
30-Nov-02
Records from medical licensing board (Doctors, Dentists, Nursing, Pharmacists, Clinical Officers, etc) – MOH
Deputy Program Manager - NASCOP44, MOH - for Medical and Dentists Boards
Head Officer, HMIS - for Nursing, Pharmacists, Clinical Officers' Boards
Relevant Heads of Licensing Boards
30-Nov-02
HMIS computer Head Officer, HMIS No need to contact 3rd party
1-Mar-03
Household Records
Demographic and Health Survey Head Officer, HMIS No need to contact 3rd party
1-Oct-02
Welfare and income report Economist, Department of Planning, MOH
No need to contact 3rd party
15-Oct-02
MICS Economist, Department of Planning, MOH
No need to contact 3rd party
15-Oct-02
Industry reports
Directory of Industries Department of Commerce No need to contact 3rd party 15-Oct-02
Donor Reports
World Development Indicator - World Bank
Senior HIV/AIDS Tech. Advisor No need to contact 3rd party
15-Oct-02
Donor Mapping Report Economist - Department of Planning, MOH
Health Reform Secretariat
15-Oct-02
UNAIDS Annual Report Senior HIV/AIDS Tech. Advisor No need to contact 3rd party
15-Oct-02
For each source identified, the Producers’ Guide recommends evaluating the level of detail, quality (scope, level of detail, reliability), appropriateness and sufficiency of the data provided. This will help the NHA team to determine if additional data sources are needed. Some items to consider when evaluating the data are, 1) the year of estimation (does it coincide with the NHA year of estimation?), 2) the scope of information provided (what types of child health services are reported on? What do they include? Does it offer national level data or regional?), 3) the validity and reliability of the data (data collection methods, sample size and design, response rates, etc.), and 4) the level of detail (can the data be sufficiently disaggregated to inform the child health classification list developed by the country? Sometimes, an
44 National AIDS Control Programme

42 Guide to Producing CH Subaccounts
expenditure estimate may be reported for “maternal and child health services;” the difficulty will be to extract the portion that relates solely to children for the purpose of the child health subaccounts. See Chapter 5 for proposed estimation methods when faced with such an issue). The degree to which existing data are available, accessible, and useful will vary from country to country. It is often the case that secondary data may not be available and if it is in existence it may not be readily accessible. For example, a DHS dataset may be found at the National Bureau of Statistics, but the Bureau may not be able to share the dataset unless all the appropriate political authorities approve this transfer— which can take time and a considerable amount of effort to facilitate for the NHA team. Alternatively, due to regulations, the Bureau may not be authorized to share the dataset itself. Finally, even when a potentially useful dataset is obtained, it may not be viable for child health subaccounts due to sample size issues (the number of children included in the sample might be too small and the results not representative), poor data quality etc. Thus, experience to date has shown that when information is not readily available and when done for the first time, many ‘creative’ estimation techniques may need to be employed (some of which will be discussed in the following chapter) that use and piece together a variety of data, ranging from cost, utilization, import/export records and so forth. Thus, teams in such countries should be prepared for investigative efforts. It should be reminded that all the data sources, assumptions and methodology should be recorded and documented for future use. Although the challenges and difficulties faced during the first round of child health subaccounts may seem formidable, if the process is thoroughly documented, if weaknesses in information systems are identified (and addressed subsequently), and if awareness is raised regarding other potential surveys where child health expenditure questions may be added, then subsequent child health subaccounts estimations will become easier to produce. It is useful to remember at this stage that NHA or child health subaccounts is not simply intended as a “study” or a one-time event. It is a process, one that seeks to sustain or institutionalize the estimation of health expenditures for policy purposes. 4.4. Summary
The data collection process critically depends on the nature of existing information, whether or not it is possible to take advantage of existing surveys, the availability of household data, and the available budget for conducting any needed primary data collection. Understandably, the more primary data that is required, the greater the cost and time it will take to complete the child health subaccounts. Therefore, the NHA team is encouraged to examine all non-primary data collection options before embarking upon separate surveys. Furthermore, if child health subaccounts are done as part of the process of implementing NHA in the country, this effort will also help facilitate the institutionalization process of the subaccounts, such that child health expenditure estimates can be obtained on a routine basis without much added cost or extra effort.

Guide to Producing CH Subaccounts Data analysis 43
5. Data analysis
This chapter builds upon the recommendations described in Chapters 9 to 13 of the Producers’ Guide and focuses on child health-specific issues that may arise during data analysis. The suggested strategies for dealing with these issues have grown out of discussions with NHA experts and child health programme managers, and draws upon the four country experiences. The content of this chapter is subject to improvements and changes as the methodology is tested in more countries. 45 As mentioned in the earlier chapters, it is reiterated at this stage that if child health subaccounts are developed as a part of the NHA process in the country it would ease the analysis stage to a very large extent. Once data have been gathered from numerous sources, the analysis stage involves a thorough review of data and their assembly into a clear picture of child health funding flows. Inevitably during this process, the NHA team will face a number of data conflicts and gaps that require further scrutiny and possible use of alternative estimation techniques. The purpose of the data analysis stage is to:
• Populate for a given year at a minimum four NHA Tables on child health expenditures • FSxHF table • HFxHP table • HFxHC table • HPxHC table
• Compute critical policy indicators for the NHA report and for stakeholders 46 5.1. Getting organized: what is needed?
Data analysis depends on having the right data available, and can otherwise be a long drawn out process. To avoid analysis bottlenecks, it is useful to first assemble all needed data that may or may not be directly related to the NHA tables or child health information, including financial and non-financial information. The key types of data and information, classified by purpose of use, are listed in Table 5.1. It is also proposed, if possible, that countries develop a database or data repository of health expenditure information with codes that could identify where the child health expenditures are likely to be present. In addition to obtaining a variety of data, the analysis stage can be expedited if the template for the NHA tables is already created. This template, best created in excel, should incorporate 1) country-adapted classifications in the row and table headings (refer to Chapter 3), 2) formulas for summation of columns and rows, 3) links between the tables for standard calculations to cross-check that the sums of rows and columns match between the tables, and 4) links to ‘CH indicator’ sheet so that once the estimate is entered in the NHA table, policy indicators and charts can be automatically generated.
45 While detailed analysis with regards to the intervention-specific expenditures has not yet been possible in the four pilot countries, this chapter offers guidance for such analysis and for providing a full list of minimal reporting indicators in future applications of these guidelines. 46 The list of proposed indicator is showed in Chapter 7.

44 Guide to Producing CH Subaccounts
Table 5.1. Information needed for data analysis
Purpose of needed information
Examples of the types of data needed
To populate the four main NHA tables on child health expenditures
• Clean data sets on health expenditures from surveys preferable with age and program break down
• General NHA data or reports
• Secondary data (as listed in the NHA data collection plan), such as the Ministry of Health’s financial records for the year of estimation.
• Health expenditure data base with codes identifying possible child health expenditures
To weigh primary datasets to national level
NHA-related surveys may target a sample of given entity. To estimate national-level data from such datasets, appropriate weights must be applied. Deriving these weights may require additional information such as:
• Total number of NGOs that contribute to child health relative to total NGOs involved in the health sector (to weigh NGO datasets). Also the way NGO samples are selected would determine the weights
• weighting methods for the sampling procedures for surveys of facilities
To convert currencies • Average official exchange rate from donor reported currencies to local currency (take average of the year) (to convert donor disbursements in local currency in the countries)
• Average official exchange rate from local currency to US$ for year of estimation (for comparison with other countries)
• International dollar rate to achieve purchasing power parity (for comparison with other countries)
To adjust those datasets with earlier/later timeframes to NHA year of estimation
• GDP deflator, consumer price index, or medical inflation rates (when available)
• Population growth rates
• For current dollar, inflation rates (for time series comparisons)
To compute key policy indicators and to use these macro series as control series
• GDP
• Total population
• Number of children under five
• Add any other data needed to compute indicators
• Total government expenditure
• Total Household Private consumption expenditures
• Total government health expenditures
• Total donor commitments, disbursements and expenditure
• Total out of pocket expenditures
To verify expenditure estimates
• Existing cost and utilization studies
• Cost recovery data
• Other studies on national or subnational child health expenditures (e.g. at select providers etc.).
If the child health subaccounts has been done concurrently with the general NHA estimation (which is advised strongly), it is also useful to link the subaccounts tables to the general NHA tables in order to

Guide to Producing CH Subaccounts Data analysis 45
determine the proportion of overall health expenditures consumed by child health-related spending. This serves as a gauge for assessing the interim child health estimates produced. For example, is an institution, such as a bilateral donor or NGO, reporting greater expenditures on child health in comparison to its reported contribution for overall health? Is the out of pocket spending on pharmaceuticals for child health reasonably less than that found for general health? Red flags will be raised if the subaccounts expenditures are equivalent to or larger than general health expenditures. In such cases, the NHA team will then need to revise the child health numbers and estimations. It may also be useful to maintain the general NHA database as an electronic database, which codes all covered expenditures by year, source of funds, function, provider and provincial location of spending. One can introduce age categories in this database and use algorithms to apportion total expenditures into child health expenditures for each record maintained in the database as has been done in case of Sri Lanka. When apportioning expenditures by age, it would also help to identify and add other expenditures that may not be captured under the age category but is still child health expenditures such as expenditures for promotion of breast feeding which may not be in the zero to five age group defined for child health accounts. Age breakdown of total health expenditures can also provide with important checks and allocation rules to identify child health expenditures. 5.2. Conducting the analysis itself
The initial phase of the analysis process essentially involves two steps: 1) tallying up the national annual amounts received and spent by each principal health care entity in accordance with NHA classifications (essentially through T-accounts), and 2) populating the tables. Once the tables have been populated, the next step is to calculate the relevant indicators. The analysis outlined in this chapter refers to the first two steps. The last step is explained in Chapter 7. 5.2.1. Step one - creating a T-account
The first step entails a review of primary and secondary expenditure data for a given entity. As recommended by the Producers’ Guide, the T-Account is quite helpful for organizing this process (see PG, p. 146-147). In T-accounts, national expenditures for an entity are listed in the left column and revenues on the right side. See Table 5.2 for an example of a T-Account. Note that the guiding principle of T-accounts is that the left and right sides must always be equal. The team should capture revenue that was spent during the year of estimation. 47 In the process of creating T-accounts, the team should map each type of expenditure to the appropriate NHA classification. 47 As mentioned in Chapter 4, it is generally suggested that NHA use the accrual method, in which expenditures are attributed to the time period during which the economic value was created, rather than the cash method, in which expenditures are registered when the actual cash disbursements took place. However, in practice health accounts are reported on cash based methods, particularly for government spending as a pragmatic compromise.

46 Guide to Producing CH Subaccounts
Table 5.2: Example of child health T-accounts: Malawi, 2004/05
Malawi: local non-governmental organization’s child health expenditure T-accounts Malawi: Local (HF.2.4.2)
Financial Year 2004/05 (Thousands of Malawi Kwacha)
Expenditure Revenue
Inpatient curative care
Outpatient curative care
Prevention and public health services
91,406
30,469
32,799
External organizations 154,674
Total 154,674 Total 154,674
When starting the T-account process, it is recommended that teams begin with those entities principally involved at the financing agent level where there may be more detail on child health expenditure. Financing agents are a good place to start because funds at this level are generally targeted to functional activities or providers of health care or child health care and are thus more clearly identifiable. 5.2.2. Step two - populating the NHA tables
Upon completion of the individual T-account summaries for each entity, the next step is to populate the NHA tables. This step involves triangulating data estimates, resolving data conflicts and data gaps, and avoiding double counting. Triangulation is a very useful approach for verifying data estimates. 48 Obtaining multiple estimates for the same NHA cell provides a range of possible expenditure amounts. Inevitably, no two data sources will report the same expenditure estimate; thus, the team will need to make a selection or compute an alternate estimate. Some questions to consider during the data reconciliation process are:
• Is one data source more reliable than the other? Perhaps one survey had a higher response rate than the other?
• Do both data sources measure the same data and conform to the same boundaries? For example, one entity’s definition of health expenditures may include spending on sanitation services whereas other data sources may exclude such expenditures.
• Do both data sources measure the same time period? • Do both data sets measure the same concept? For example, donors report commitments or
disbursements while NGOs and Ministries of Health can report expenditures. 49 Because data can be obtained from the originator and recipient of the fund transfer, care must be taken to avoid double counting. This occurs when the same piece of information is captured in more than one data source. For example, households in a survey generally report their entire out of pocket spending amounts inclusive of the amount that may have been reimbursed by their employers. In this case, care must be taken to avoid counting this amount under both employers and households in the NHA tables. Please refer to Producers’ Guide (Chapters 8-13) for examples of double counting, which the analysts must be careful of while making the estimates.
48 For example, if the expenditure transaction in question involves the fund transfer between employers and insurance schemes, the NHA team can try to obtain this estimate from at least three different data sources: the employers themselves, insurance schemes, and employees/households. 49 The Producers’ Guide, particularly through its ‘Appia’ case study, offers guidelines on resolving a variety of data conflicts and data gaps.

Guide to Producing CH Subaccounts Data analysis 47
There are several issues to consider if the NHA teams face the problem of lack of data while populating the matrices. If the gap in question corresponds to a transaction that is of significant policy interest or answers a key policy question that needs to be addressed, then estimating these figures is important. 50 Otherwise, it is advisable to leave the NHA cell blank, considering the transaction will still be recorded in the “other” category. Another issue to consider is if the benefit of filling that cell is worth the effort. One must weigh the “time versus quality trade-off.” The NHA data should be produced in a timely fashion such that it can inform the policy process. Following the generation of the HFxHP and HFxHC tables, it is easier to work “upstream” and complete the HPxHC table followed by the FSxHF table. Again, this is just a recommendation; different countries may employ different methods. 5.2.3. Additional steps
Finally, an important tip is simply “to step back from time to time and look at the findings to see whether or not they seem reasonable”. Of paramount importance during the analysis process is the need to document all assumptions, weighting procedures, and estimation techniques used. Such approach facilitates the drafting of the methodology chapter of the report and, more importantly, informs and expedites subsequent country NHA efforts. For further description about the general approach to data analysis, please consult the Producers’ Guide (Chapter 10, 11, 12 and 13). This chapter now turns to specific issues concerning child health expenditure estimations. 5.3. Specific issues that may arise with the child health subaccounts
The issues discussed in this section are intended to be illustrative of the major challenges faced during the data analysis stage for child health and draws upon the experience to date with child health subaccounts implementation. Most expenditure records are not prepared to report expenditures on specific programs, age groups or diseases. Health resources are generally shared and not necessarily specifically allocated to a single program area. This section provides guidance on methodologies that can be employed for extracting the relevant child health expenditures from categories that are part of the overall health expenditures in national health accounts or to identify categories which would specifically be allocated to single program area (see Annex 3, 4, and 5). 5.3.1. Dealing with targeted expenditure
How can expenditures that target child health but are imbedded as part of multiple age groups, conditions, diseases, or areas of intervention be estimated? Targeted funds are identified from primary and secondary data sources. These funds are generally programmatic expenditures incurred by major child health financing agents (or sources in some cases), such as the Ministry of Health, NGOs, and donors who may have an entire project dedicated to child health (e.g. immunization programs). In addition, household out of pocket spending may be specifically targeted to a child health care service.
50 The link between child health subaccounts and policy-making is presented in Chapter 1.

48 Guide to Producing CH Subaccounts
However, most health interventions and programs address multiple conditions concurrently and cannot be directly extracted. This has to do with the way the national budgets are planned and resources allocated: specific units can be in charge of child health, or child health can be part of a reproductive, maternal and child health unit, other programs such as malaria, HIV/AIDS, and nutrition; or child health programs may also be included as part of general prevention and public health strategies. Reported expenditures often encompass broad categories rather than specific areas. Traditional accounting methods suggest that each transaction should be reported only once. That is to say that the total amount of a transaction, which may extend beyond the targeted boundaries, should be allocated to its principal purpose. The approach of these guidelines is that, in order to maintain policy relevance, the measurement of child health expenditures should aim to capture, to the extent possible, only the amount spent on activities that are aimed at improving or maintaining the health of children between zero and five years of age. This may mean, on occasion, breaking groups of transactions (such as expenditures on maternal and child health care programs, malaria etc.) to estimating the child health proportion of integrated expenditures. The first order of business is to investigate the nature of the program; perhaps more details on the types of service rendered can be gleaned from talking to a key informant or from reading materials on the project from reports, the internet or other secondary sources. As stated earlier, disaggregating the expenditure of integrated programs should only be pursued when the child health portion is thought to be relevant and when excluding the full value of the integrated activity is likely to be a significant underestimate. Also, it is worth considering the two percent rule. 51 If it is deemed that a portion be extracted from the full value of the program, this should be estimated based on the opinion of a key informant or perhaps based upon a description of the program. Regardless of the strategy chosen, the NHA team must document this assumption in the T-accounts data summary files (for the particular financing agent), as well as the reasons for taking the approach. However, apportioning from the total transaction amount the percentage that is directed towards child health, while allowable, should be used only when:
• The child health share is thought to be significant, • Relevant from the child health survival perspective and • When the inclusion of the entire integrated transaction would be a gross overestimate.
Apportioning without clear guidelines and scientific methods should be kept to a minimum to limit production of expenditure “guesstimates.” The allocation ratios/decisions used in estimating such child health shares will differ from country to country, depending on available data and the country context. In any case, the approach taken should be well documented in the NHA report and/or tables. The experience in the four countries where child health subaccounts have been conducted to date shows that when it was necessary to apportion for child health, the main criteria used were based on the following:
• Percentage of population under five • Percentage of personnel inside a unit working on child health • Expert opinion
Box 5.1 shows some concrete examples of the apportioning rules used in the four countries where the child health NHA analysis was undertaken. 51 If the expenditure under consideration is expected to amount to less than 2 % of the total national health expenditure, then it can be excluded from the estimation.

Guide to Producing CH Subaccounts Data analysis 49
Box 5.1: Examples of apportioning approaches used at the national level
In Bangladesh, the approximate distribution of donor spending was calculated by pro-rating by provider type according to the fraction of spending at each provider type which was for child health. This approximation assumed that the child share of donor spending for a particular recipient was the same as overall spending from all sources at that recipient. By doing this, it was possible to generate an analysis of donor spending by provider type for child health.
In Ethiopia, the Family Health Department works in the area of child health and reproductive and maternal health. To estimate the portion of the total cost of that department that went to child health, the percentage (45%) of people assigned to working on child health inside that department was applied.
In Sri Lanka, prevention and management of communicable diseases (H.C.6.3) for child health was calculated based on consultation with program directors for MOH expenses and individual provincial council data on Medical Officers of Health staff salary allocation.
5.3.2. Dealing with non-targeted expenditures for child health
Non-targeted expenditures refer to indirect spending on child health like, for example, the proportion of medical staff wages for public hospital staff that treat children. For these types of expenditures, non-market providers may use their general revenue (contributed by various financing agents for all health services rendered by the provider) to pay for child health-related services.52 Generally speaking, such information is not readily disaggregated in the information systems of most countries. How can non-targeted expenditures for child health be estimated? Expenditures on service delivery (e.g., inpatient and outpatient care delivered at hospitals, health centers, clinics etc.), part of which benefits children are also non-targeted expenditure. For example, a doctor/nurse who treats an adult in the male/female ward will also treat an under five in the pediatric ward. Now considering that salaries are the major expenditure items at the provider level, the challenge therefore becomes how to allocate the doctor’s/nurse’s salary expenditure for child health. The fact is that the integration of financing and provision and programmatic and input method of budgeting is the commonest system existing in low and middle-income countries. Methods are required to apportion the expenditures for such non targeted expenditures. The first step should be to identify at what level, should the apportionment methods be applied. This is explained below using an example of expenditure for the Ministry of Health in Malawi. Table 5.3 shows the way health expenditure of the Ministry of Health in Malawi are reported and organized. 52 It should be noted that the full cost of intermediate inputs (including salaries, equipment, supplies) at private-for-profit providers is embedded within the price charged to patients or insurance schemes. Thus, non-targeted expenditures do not need to be estimated separately in these cases.

50 Guide to Producing CH Subaccounts
Table 5.3 Expenditure for the Ministry of Health in Malawi
Cost centre
(Name of facility/level of care)
Programme No: 10
Sub-programme 2002/03
APRROVED ESTIMATES
(MK)
2002/03 ACTUAL
(MK)
02 Queen Elizabeth Central Hospital
10. Tertiary Curative Services
01 BUILDING/EQUIPMENT PROVISION AND MAINTENANCE
• PERSONAL EMOLUMENTS AND BENEFITS
• OTHER RECURRENT TRANSACTIONS
21 Internal Travel
24 Office supplies expenses
25 Medical Supplies and Expenses
28 Training Expenses
33 Other Goods and Services
41 Formation of and Maintenance of Capital Assests
Sub-Programme: Total
200 220
6 361 810
0
1 345 450
1 484 861
46 835
3 400
3 481 264
6 562 030
3 307 828
3 330 812
0
1 079 134
1 347 289
17 300
3 400
883 689
6 638 640
02 IN-PATIENT SERVICES
• PERSONAL EMOLUMENTS AND BENEFITS
• OTHER RECURRENT TRANSACTIONS
21 Internal Travel
24 Office supplies
28 Training Expenses
33 Other Goods and Services
Sub-Programme: Total
71 604 306
10 780 110
0
9 511 050
117 560
1 151 500
82 384 416
70 985 078
10 093 120
0
9 431 140
113 480
548 500
81 078 197
03 OUT-PATIENT SERVICES
• PERSONAL EMOLUMENTS AND BENEFITS
• OTHER RECURRENT TRANSACTIONS
21 Internal Travel
24 Office supplies
28 Training Expenses
33 Other Goods and Services
Sub-Programme: Total
4 987 740
1 797 835
896 480
603 905
228 250
69 200
6 785 575
4 987 740
1 797 835
896 480
603 905
228 250
69 200
6 785 575

Guide to Producing CH Subaccounts Data analysis 51
Cost centre
(Name of facility/level of care)
Programme No: 10
Sub-programme 2002/03
APRROVED ESTIMATES
(MK)
2002/03 ACTUAL
(MK)
04 PATIENT CARE TECHNICAL SERVICES
• PERSONAL EMOLUMENTS AND BENEFITS
• OTHER RECURRENT TRANSACTIONS
21 Internal Travel
24 Office supplies
25 Medical supplies
28 Training Expenses
33 Other Goods and Services
Sub-Programme: Total
9 687 778
3 939 087
96 600
1 552 397
2 069 780
109 610
110 700
13 626 865
9 270 445
3 955 636
89 600
1 387 526
2 292 291
75 410
110 700
13 226 081
05 PATIENT CARE GENERAL SUPPORT SERVICES
• PERSONAL EMOLUMENTS AND BENEFITS
• OTHER RECURRENT TRANSACTIONS
21 Internal Travel
Public utilities
24 Office supplies
25 Medical Supplies and Expenses
28 Training Expenses
30 Insurance Expenses
32 Food and Ration
33 Other Goods and Services
41 Formation and Maintenance of Capital Assets
Sub-Programme: Total
4 820 445
93 294 009
1 676 691
102 360
1 573 172
75 151 196
114 690
25 000
14 591 900
48 000
11 000
98 114 454
4 820 445
187 878 640
1 178 047
3 510
1 538 244
170 805 721
112 750
0
14 181 368
48 000
11 000
187 878 640
06 HOSPITAL SERVICES MANAGEMENT
• PERSONAL EMOLUMENTS AND BENEFITS
• OTHER RECURRENT TRANSACTIONS
21 Internal Travel
23 Public Utilities
24 Office supplies
28 Training Expenses
33 Other Goods and Services
2 969 092
39 845 815
4 341 535
31 380 000
3 401 390
1 858 238
36 090 939
3 437 972
28 605 039
3 401 390
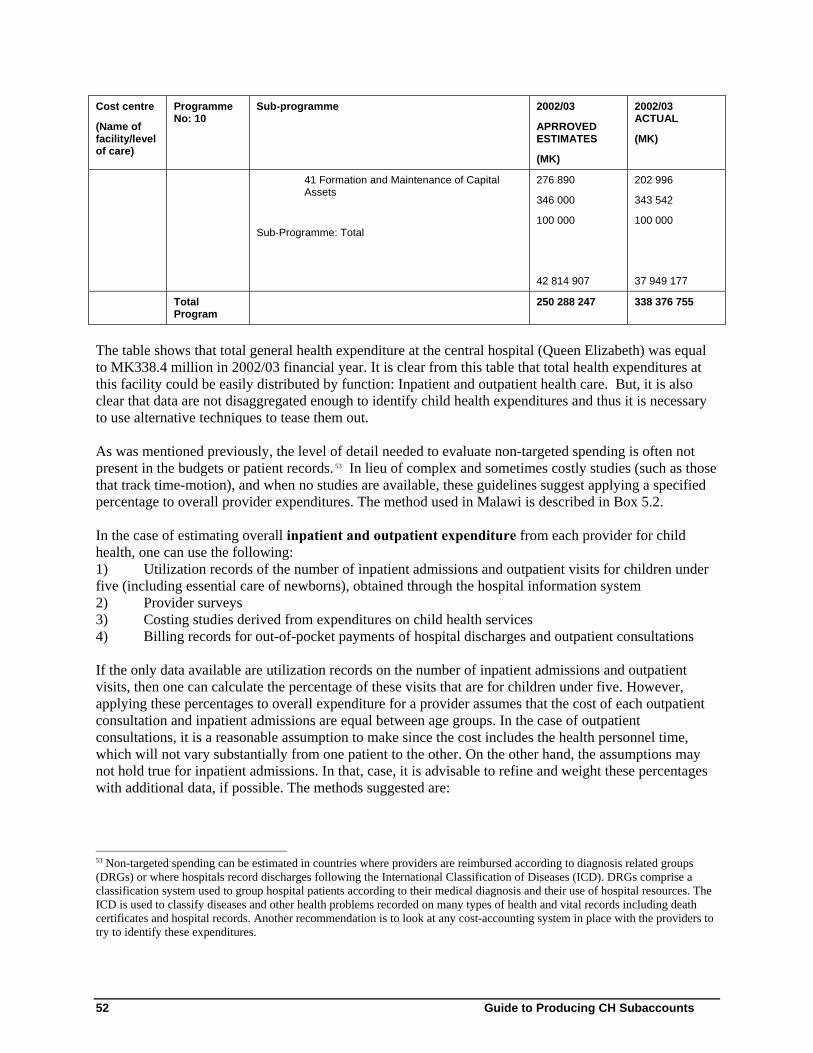
52 Guide to Producing CH Subaccounts
Cost centre
(Name of facility/level of care)
Programme No: 10
Sub-programme 2002/03
APRROVED ESTIMATES
(MK)
2002/03 ACTUAL
(MK)
41 Formation and Maintenance of Capital Assets
Sub-Programme: Total
276 890
346 000
100 000
42 814 907
202 996
343 542
100 000
37 949 177
Total Program
250 288 247 338 376 755
The table shows that total general health expenditure at the central hospital (Queen Elizabeth) was equal to MK338.4 million in 2002/03 financial year. It is clear from this table that total health expenditures at this facility could be easily distributed by function: Inpatient and outpatient health care. But, it is also clear that data are not disaggregated enough to identify child health expenditures and thus it is necessary to use alternative techniques to tease them out. As was mentioned previously, the level of detail needed to evaluate non-targeted spending is often not present in the budgets or patient records. 53 In lieu of complex and sometimes costly studies (such as those that track time-motion), and when no studies are available, these guidelines suggest applying a specified percentage to overall provider expenditures. The method used in Malawi is described in Box 5.2. In the case of estimating overall inpatient and outpatient expenditure from each provider for child health, one can use the following: 1) Utilization records of the number of inpatient admissions and outpatient visits for children under five (including essential care of newborns), obtained through the hospital information system 2) Provider surveys 3) Costing studies derived from expenditures on child health services 4) Billing records for out-of-pocket payments of hospital discharges and outpatient consultations If the only data available are utilization records on the number of inpatient admissions and outpatient visits, then one can calculate the percentage of these visits that are for children under five. However, applying these percentages to overall expenditure for a provider assumes that the cost of each outpatient consultation and inpatient admissions are equal between age groups. In the case of outpatient consultations, it is a reasonable assumption to make since the cost includes the health personnel time, which will not vary substantially from one patient to the other. On the other hand, the assumptions may not hold true for inpatient admissions. In that, case, it is advisable to refine and weight these percentages with additional data, if possible. The methods suggested are:
53 Non-targeted spending can be estimated in countries where providers are reimbursed according to diagnosis related groups (DRGs) or where hospitals record discharges following the International Classification of Diseases (ICD). DRGs comprise a classification system used to group hospital patients according to their medical diagnosis and their use of hospital resources. The ICD is used to classify diseases and other health problems recorded on many types of health and vital records including death certificates and hospital records. Another recommendation is to look at any cost-accounting system in place with the providers to try to identify these expenditures.

Guide to Producing CH Subaccounts Data analysis 53
1. Weight by average length of stay data (by ward, type of disease or condition, age group). 2. Weight by input, using information on size (number of beds, number of personnel) or cost of wards
(e.g. pediatric ward), relative to the overall cost or size of the hospital, and compared to other wards. 3. Use cost of services data. From other studies, look at what is the cost of child health services relative
to the overall cost of services. 4. Use prices obtained from private sector facilities. Box 5.2 presents some country examples of how inpatient and outpatient care expenditure for child health were estimated.
The data may show, for example, the amount of funds provided by NGOs to public hospitals but not the breakdown of those funds across NHA functions. In such cases, the team may need to use the same breakdown as found for general health expenditure at that given provider. Thus, it may be known from the health information system (HIS) that in public hospitals 70% of expenditures is for inpatient care and 30% for outpatient care. Assume the same split of funds for the amount NGOs as financing agents give to public hospitals, and clearly document this assumption. If cost data are available, the inpatient allocation factor can be derived by a combination of cost data54 and utilization data (see formula):
Average cost per inpatient admission for a child health related service at public hospitals
X Number of inpatient days for child health care at public hospitals
≈
Z % of overall inpatient expenditures used for child health care
54 Implementing Hospital Autonomy in Jordan: An Economic Analysis of Princess Raya Hospital, PHRplus, January 2002. Implementing Hospital Autonomy in Jordan: An Economic Analysis of Al-Karak Hospital, PHRplus, January 2002.
Box 5.2: Estimation of child health inpatient and outpatient curative care expenditures from general health expenditures In Malawi, for outpatient child health services, the allocation factor was estimated using the relative share of visits related to ARI, malaria, pneumonia and diarrheal diseases for children to total outpatient visits. This factor was then multiplied by total outpatient expenditure across all types of providers. In Bangladesh, outpatient care in the public sector by providers and age groups was distributed using HDS 1999/2000 data, which contains data on health care utilization and out-of-pocket expenditure by type of provider and individual. Public sector inpatient expenditure was distributed according to distribution of utilization measured in terms of admissions as in-patients. Annexes 3 and 4 show a more detailed list of the apportioning rules used in Bangladesh and Sri Lanka for estimating child health expenditures. Private sector inpatient expenditure was distributed according to distribution of out of pocket payments, which included operation charges, rental fees and accompanying persons’ food and other expenses. In Ethiopia, facility expenditures such as salary, other operational costs and capital formation that were not recorded as child health or other health services were disaggregated using the ratio of utilization figures from the Health and Health Related Indicators (FMOH 1997). For curative care, the ratios of utilization of child health services to the total health services utilization were applied: 32% for inpatient care and 19.71% for outpatient care. For capital formation, the ratio of child health curative care to total curative care was applied. That ratio was 25%.

54 Guide to Producing CH Subaccounts
Average cost overall per inpatient admission at public hospitals
X
Number of inpatient days for all care at public hospitals
The derived allocation factors Z% is then applied to the public and/or private provider spending on all inpatient care, as shown in Table 5.4. In this example, the Ministry of Health through public hospitals spent US$ 100 on inpatient care for general health. The estimate the portion of these expenditure that goes to child health, use the allocation factor Z% on that total amount.
Table 5.4. Financing agents contribution to non-targeted child health spending on inpatient care
Financing Agents
Public Hospitals HF. 1.1.1.1 Ministry of
Health HF.2.4 NPISH (NGOs)
HC.1.3 General Inpatient Expenditures
(Taken from the general HFxHC table)
100 100
HC.1.3 CH Non-targeted Inpatient Expenditures =Z% x 100 =Z% x 100
To determine which financing agents contribute to non-targeted spending for child health, the same ratios of contributors for overall health care (as shown in the general NHA tables; HFxHPXHC) at the provider can be used for the child health subaccounts. Note, that the percentage is derived for each provider type. Similarly, to trace the non-targeted spending back to the financing source level, the same proportional breakdown found in the general NHA FSxHF table can be applied to those financing agents that contribute to non-targeted spending (see box 5.3).
How to account for surveillance activities that target multiple conditions (e.g. the basic health information system expenditure)? Should a child health expenditure share be extracted from these surveillance programs? It should first be determined whether extracting the child health share is relevant for policy purposes. Is this information relevant due to the national context? In many cases, the immunization surveillance system is a separate entity of the health information system. In such a case, tracking these expenditures becomes straightforward. However, in the case of service provision or resources used for child health, the information may not be readily available. Efforts should be made to obtain information on, for example, the number of health personnel that treat children under five (including the staff that take care of newborns). Another important consideration is the amount of beds or hospital wards for treating children under five.
Box 5.3: Proportion of inpatient and outpatient visits for children under five in Ethiopia, Rwanda and Kenya
The patterns observed in different countries indicate that the proportion of outpatient visits (as a percentage of total outpatient visits) in public facilities for children under 5 ranges considerably, from 19% in Ethiopia to about 30% in Rwanda. Data for inpatient admissions indicate that about 32% (33% in Kenya and 32% in Ethiopia) are for children under five.

Guide to Producing CH Subaccounts Data analysis 55
5.3.3. Dealing with out of pocket expenditures
How can out of pocket expenditures for child health be estimated? The main source to estimate household expenditure is household surveys (see also Chapter 4 for more details household surveys), which generally provide the amount of out of pocket spending per family member for different health care functions. However from country to country, the comprehensiveness (level of detail of information) of this source varies. In the case where it is not possible to identify the out of pocket spending for children under five, an alternative is to apply the inpatient and outpatient allocation factor (as in the example in Box 5.4) to the total household out of pocket payments for inpatient and outpatient care. In the case of Bangladesh (illustrated in Box 5.4), the team applied the percentage of total out of pocket expenditures for the age group “below one year” and “1-4” (Table 2, Box 5.4), thus 3 and 9%, to the figures in Table 1 (of Box 5.4). For the amount paid/reimbursed through insurance schemes to shops and pharmacies in Malawi, utilization figures of private insurance schemes members were analyzed and the proportion of under five who used health care services was estimated and applied to the global figure from the general NHA table. For the proportion that was paid by households, health expenditure and utilization survey results were used to estimate the proportion of expenditures paid by households through out-of-pocket to retailers (shops and pharmacies) for children under five. 5.3.4. Dealing with integrated expenditures for curative and preventive services
How do we deal with interventions for child health that include curative and preventive services? Another challenge is dealing with integrated approaches such as IMCI which only address child health, but which are integrated in terms of curative and preventive care. Box 5.5. illustrates how this was dealt with in Malawi.
Box 5.4: Dealing with IMCI Expenditures- The Malawi case In order to estimate expenditures for IMCI, the following steps were followed:·
• All curative, preventive and public health programmes are funded in a vertical manner by donors (government only funds the salaries of staff and a few items) and IMCI is one of the vertical programmes at central level.·
• The provision and administration of IMCI programme at central level was regarded as prevention and public health services for child health. As such, all expenditures on this vertical programme were regarded as child health prevention and public health and were added together with other child health prevention and public health programmes such as immunization.
• The provision of IMCI services at facility level was regarded as curative health care: inpatient and outpatient. However, since funding and service delivery is integrated at facility level, it was impossible to isolate IMCI expenditures from all other child health inpatient and outpatient services at facility level. This is because in order to estimate child health inpatient and outpatient health expenditures a ratio of utilization for child health was used to tease out child health outpatient health expenditures from general outpatient health expenditures while a ratio of inpatient days was used to tease out child health inpatient health expenditures from general inpatient health expenditures.

56 Guide to Producing CH Subaccounts
5.3.5. Tracking commodity related expenditures
5.3.5.1: How can commodity spending on medical goods for children be estimated? Tracking expenditures incurred on commodities is critical for tracking intervention-specific expenditures, some of the indicators in Chapter 7 are proxy measures based on commodities (e.g. ORS; zinc). As an illustration of how this can be done, the following paragraphs describe briefly the main steps of a possible methodology to track commodities for children. 55 The methodology was to start with a tracer list that identifies all the drugs that were used at the primary health care level for children in the country (impossible to capture all the commodities ever used in children). The second step was to collect information on quantity of pharmaceutical or commodity procured, supplier/manufacturer, source country, source of funding, date/government fiscal year, invoice number, data source, cost of procurement, including unit price and extended costs. The sources of information were, in one country, the Medical Stores Agency, EPI and Global Fund, and in the other country, a database of Goods Received Notes – GRN. Where a commodity or medicine was not specific to child health, its quantity was prorated based on expert opinion, and epidemiological data to account for use in children. While this methodology provides data on the number and amounts of commodities that enter a country, it doesn’t, however, inform on the utilization and distribution of the drugs to the providers or the population. It may be prudent to multiply unit cost (to the consumer) and utilization data to determine expenditure. In the case of pharmaceuticals, such information may be derived from applying the market average price by the reported imported amounts (that are likely to be distributed during the year of estimation). 56 Note that the type of information available will greatly vary from country to country depending on the performance and design of the HIS, who is in charge of procurements, and how they are done. There are other ways to track commodity spending on medical goods for children, as illustrated in the examples of Bangladesh, Ethiopia and Sri Lanka:
• Bangladesh: Household out of pocket expenditures on medicine and other medical goods as reported in HDS 1999/2000 on medicines and other medical goods
• In Ethiopia, to estimate the distribution of drug expenditures sold by independent pharmacies the ratios of child health curative care over total curative care was applied. So the percentage of out-of-pocket expenditure on drugs for child health out of the total out of pocket spending on health was 25%.
• Sri Lanka: • Public Sector Medical Goods dispensed to outpatients (H.C.5): (i) MOH component
consists of spending through Sri Lankan Red Cross and so assumed to be 0% for child care; (ii) for all public sources a pro rated share of child expenses estimated for curative care was applied.
• Public Sector Pharmaceuticals and other medical non-durables (H.C.5.1): i) National Blood transfusion proportion based on expert opinion at private hospital (3.2%); (ii) share
55 Tracking Expenditures on Public Procurement of Commodities for Child Health August 2005–January 2006, Jane Briggs, Naomi Brill, Katie Senauer, Melissa Thumm, March 2006, RPM plus, Management Sciences for Health 56 Effort should be made to estimate the total amount distributed that year. Often times, the volume of imports in a given year does not necessarily correlate with the volume distribute that year.

Guide to Producing CH Subaccounts Data analysis 57
for Provincial Councils spending based on outpatient proportion estimated based on the <5 utilization rates of the Central Bank, consumer finance surveys of 1996/97 and 2003/04 with linear interpolation for the intervening years.
5.3.5.2 Commodity imports versus amount used in the country If there are only import records of medical goods, how can you estimate the amount used in country? Assume that shipments made during a certain time frame – say from August 2001 to August 2002, are dispensed during the year of estimation, 2002. The amount dispensed is then multiplied by the international procurement cost for a given commodity type. This very crude assumption needs to be thoroughly documented and cited as an area in need of better estimation. 5.3.5.3 Conflicting reports of donor contributions to MOH due to in-kind transfers Often, donors report a different value of their contributions to the government than what the government records as having been received. Why is this the case and how can this data conflict be reconciled? As with any transaction, the team first needs to investigate how much of the transfer of funds was ultimately rendered as a service for patients that given year. Only the amount received, which is ultimately spent on a particular service is included in the subaccounts. One other point to be aware of from the child health perspective is that sometimes government expenditure records do not include the full value of donated commodities whereas the donor records do. Thus, this adjustment should be made to the government expenditure records- provided that those commodities were dispensed that year. 5.3.6. Other data analysis issues
Relying on cost and utilization data. In the absence of expenditure data, NHA teams may resort to using unit cost and utilization data as proxy measures of price and volume. This should be done with caution and with the following considerations. Several methods exist for deriving unit cost figures –aggregate accounts, facility surveys and estimated cost functions. In Bangladesh NHA unit cost and utilization data were based on actual expenditures derived through a cost accounting system. No ideal unit costs were assumed to derive unit expenditure ratios. This can be elaborated with respect to the Bangladesh Health facility Efficiency Study of 1997. See details of the methodology in Annex 5. Direct use of prices/unit costs of services that are not linked to total expenditures for a particular year and multiplying it with utilization figures for another year leads to a distorted picture of expenditures. Unless the costs are derived from actual expenditures through cost-accounting systems, multiplying cost and utilization data is not ideal for estimating expenditures on curative care. This is because unit cost derivation is often based on the “ideal” or full set of services rendered. To the extent that services are inefficiently provided, unit cost estimates will be higher than for more efficient delivery of services. Alternative to a simple multiplication of cost and utilization data, such information can be used to develop ratios of expenditures or weights that can then be applied to the total expenditure incurred at facilities (as explained in section 5.3.2) because the objective of NHA is to track actual expenditure, not costs. Although not ideal for curative care expenditures, a method for deriving commodity expenditures is to multiply cost [price] and utilization estimates. This method can be used because there is usually no variability in the services rendered when commodities are purchased, and the cost equals the price since it’s a market good. This is true not only of commodities but also of market services.

58 Guide to Producing CH Subaccounts
5.4. Summary
The data analysis stage requires access to a lot of directly- and indirectly- associated NHA data, ranging from expenditure information, to cost, use, population, and prevalence data. Given this, it is best if such information can be assembled ahead of time to avoid data analysis bottlenecks. Some guiding principles for the analysis itself, particularly for the child health subaccounts estimation, are a) to always check the “primary purpose” of the reported expenditure in question and to revisit the boundaries of the child health subaccounts, b) to always cross check with the aggregate NHA estimates (if available) for each item to see that the estimated amount is feasible. Specific estimation issues include dealing with expenditure that target multiple age groups, diseases or interventions, dealing with non-targeted expenditure, commodity transfers, and the extraction or addressing of child health expenditures embedded within integrated activities. The latter issue can be one of the most challenging matters to deal with. While not negated altogether, it is best to keep the process of disaggregating of integrated activities to a minimum in order to preserve expenditure data and to curtail ‘guesstimates.’ Sometimes it may be necessary to derive child health proportions from integrated activities (e.g. MCH programs); in these cases, it should be done when the child health expenditure is thought to be sizeable and when the full value of the integrated activity is likely to be a significant overestimate. Regardless of what approach is used, it is critical that all assumptions and estimation techniques be thoroughly documented. Countries will find that as their information systems improve and NHA data collection becomes routine, they will rely less and less on estimation techniques and more on actual detailed expenditure data.

Guide to Producing CH Subaccounts Implementation process for CH subaccounts 59
6. Implementation process for child health subaccounts
6.1. Objectives and general considerations
This section discusses the implementation of child health subaccounts and the institutionalization process. It is suggested that the child health subaccounts are conducted as part of the general NHA or within the NHA framework if countries already have a regular NHA process in place. This chapter will also suggest a time frame for the development of child health subaccounts and the resources needed for such implementation. The Producers’ Guide suggests establishing a Steering Committee of high-level representatives from stakeholder organizations to guide the production of NHA. This Steering Committee can also serve as an authoritative conduit for communicating findings and facilitates the NHA institutionalization by establishing ownership at a high level of the country’s socio-political organization. The process of implementing a child health subaccounts starts with the relevant stakeholders identifying the rationale, motivation and funding for conducting the project. Child health experts can be incorporated to the existing Steering Committee to form a Child Health Group. It may also be convenient to meet the representatives of international organizations and donors that provide funding or technical expertise for child health survival. The objective for implementing a child health subaccounts should be determined by the country specific needs, with national institutions and stakeholders having ownership of the problem definition. In order to make this more efficient, a special meeting for child health subaccounts should be held to start the project. General descriptive materials on NHA and these guidelines should be provided to the new group members of the Steering Committee to inform them of the general purpose and objectives of NHA. The other members of the Steering Committee can help the child health group by providing necessary information. Also, these members will ensure that the child health subaccounts are conducted in the context of general NHA (Figure 6.1). The Steering Committee should be provided with Chapters 1 and 2 of these guidelines to help the Steering Committee formulate relevant policy questions that can be answered by NHA child health subaccounts and provide realistic expectations of the results. The ownership of the project by the members of the Child Health Group within the Steering Committee will lead to an improved follow up of progress achieved and involvement in identifying ways of obtaining data, bringing down the barriers to data gathering, etc. It will also increase the likelihood that the end results produced by the exercise will be used in the national policy process. Both users and producers of information on child health should be involved in this work. The Steering Committee - Child Health Working Group should execute the following responsibilities:
• Define the relevant child health policy questions to be addressed by the child health subaccounts
• Agree on scope and boundaries of the child health subaccounts • Meet regularly with the technical team to guide the latter on relevant policies and priority
areas and to be informed about methodological issues, intermediate results and possible data gaps
• Assist the technical team by facilitating the data collection process • Organize meetings and workshops between the Steering Committee and the NHA technical
team to discuss results and findings

60 Guide to Producing CH Subaccounts
• Promote and help in the analysis of NHA child health subaccounts information and other relevant information on child health status and service outputs
• If available, link the analyses of NHA child health subaccounts information with cost projections for child survival, as to identify investment gaps
• Organize meetings and workshops with the broader group of stakeholders to discuss results and findings
The Technical Team should be responsible for the following tasks:
• Conduct training workshop and develop project work plan • Design data entry screens • Undertake the data collection process • Undertake analysis • Draft report and submit to Steering Committee for Review

Guide to Producing CH Subaccounts Implementation process for CH subaccounts 61
Figure 6.1: Stakeholders involved in the production of NHA and child health subaccounts
The human resources needed for conducting the child health subaccounts depend on the existing capacity of institutions and individuals involved in the development of general NHA. Assuming that both a technical team and a Steering Committee have been established for conducting NHA, as suggested by the Producers’ Guide (Chapter 9), it is recommended that the following be added:
• To the existing Steering Committee (in order to establish the Child Health Group): • Head of the child health program at national level • Representative of international organizations that fund or provide technical assistance to
child health programs, such as WHO and UNICEF • On a needed basis, Coordinator of relevant programs including Malaria and vector
control, HIV/AIDS, Maternal and Reproductive Health and Nutrition • To the NHA technical team:
• WHO regional/national technical officer for child health • Representative from the statistics office in charge of child health statistics
NHA technical team MOH Health information systems Office of planning Office of budgeting National Office of Statistics
Steering Committee MOH Head of planning Head of budgeting Head of health information systems Head, Child Health programs Head of research institution Representative of WHO other international organization Representatives from donor agencies Ministry of Economics Head, Central statistical offices Head, Information systems in central Banks Head, Survey agencies Representative from private sector (e.g. Medical association) NGO representatives
Child health team MOH (all relevant programme officers) WHO child health officer UNICEF health officer and other representatives of international organizations Donors interested in child health and survival

62 Guide to Producing CH Subaccounts
6.2. Resources needed
6.2.1. Equipment
Conducting NHA basically relies on using computers, with access to internet and a spreadsheet program. It is a data-intensive process but does not require sophisticated equipment. It is recommended however, to have at least one computer that has sufficient power to process the data sets that are often the result of surveys, such as household surveys. It is often very useful to profit from the expertise in data management of the national office of statistics. However, it is important to note that part of the institutionalization process involves having assigned resources and equipment for the NHA team. 6.2.2. Other needed resources
Resources are needed to train the members of the Child Health Group. A child health training conducted in conjunction with a general NHA training would require about one additional day of training. The resources needed involve the preparation of the training (preparing content, power point presentation, supporting documents), and the conducting of the training (facilitator’s fee, per diem, transport, meals, hall hire, printing and stationeries). Resources are also needed to discuss and interpret findings, produce the relevant reports and to disseminate the information in hard and electronic copies. The process of producing the report and disseminating results is part of the implementation process. Experience has shown that the funds available for conducting NHA tend to end with the production of the NHA tables. Lack of funding for dissemination of results can limit the extent to which findings are used. Therefore, it is suggested that sufficient time is dedicated to communication activities, and that funds are allocated accordingly. Teaming up with other areas of the Ministry of Health to obtain ideas on design, editing, printing and result dissemination is also useful. For example, the office in charge of producing other publications within the MOH may share ideas and resources. 6.2.3. Limited resources
In the case resources for conducting child health NHA are very limited, it is best to try to do at least two tables identified as priority tables in these guidelines: the financing agent by health provider table (Table 3.3, see Chapter 3); and the financing agent by health function table (Table 3.4, see Chapter 3). The data for these two tables is often more readily available than the information required for constructing additional tables. The financing agents and the providers tend to have information systems that allow the retrieval of expenditure data. The two tables present breakdowns of health expenditures that provide useful information for evaluating routine operations of child health programs. More specifically, programming and allocation of child health resources are generally carried out by type of provider institution and by type of activity or function.

Guide to Producing CH Subaccounts Implementation process for CH subaccounts 63
6.3. Report writing and efficient communication of results
The presentation of results is a crucial step in the implementation and institutionalization of NHA. This step is essential for promoting a culture of evidence, for providing the necessary evidence in an adequate format for policy making. Having reports and documentation readily available will contribute to accountability. The presentation of results can take the form of policy briefs, technical reports, press releases, presentations, speeches, etc. Each one of these has a different purpose and a different audience and will therefore need to be adjusted accordingly so that the language and format used are targeted for each type of audience. In this process, obtaining advice from communications experts is very useful.
Feasibility of conducting child health subaccounts with limited resources available As mentioned, this study was conducted in both countries with minimal resources. The total budget for each country team was only US$ 5,000. This limited budget necessitated use of methods that relied primarily on exploiting the existing health accounts estimates and available secondary data. Funding was much less than adequate to initiate any primary data collection, or to support extensive new analyses of available large data sets. The research team had to emphasize simplicity in methods, make the best use of any available data, and tolerate a considerable level of “guesstimation” and imprecision in final estimates. Despite this, the efforts were successful in producing estimates for the two countries covering a span of 6 years in Bangladesh (1996/97-2001/02) and 14 years in Sri Lanka (1990-2003). At the methodological and standards level, these estimates are fully consistent with the WHO-endorsed OECD SHA statistical framework, and thus consistent with the overall SHA-based health accounts estimates for each country. The estimates also allow for comparisons between the two countries. The success in being able to produce these estimates despite limited resources was primarily due to the following: (i) Both countries had pre-existing health accounts estimates compatible with international standards. It was not necessary to estimate expenditures anew in this study. Instead, the focus was on apportioning the known expenditures to child health. (ii) Both countries had some health accounts technical capacity. In particular, the skills required to find and develop methods to apportion items of expenditure by specific purpose were critical and central to the analysis. These are skills that are integral to the process of estimating functional disaggregations that are required for internationally compatible health accounts. (iii) Both countries had access to a minimum level of household survey data, which could be used to analyse patterns of utilization (and in some instances expenditures) by age group. However, the household data was not abundant and comprehensive and the extent of data availability varied. These two limitations related to the periodicity of the survey data and whether the surveys collected data expenditures by individual household member. The Sri Lankan analysis was able to rely on two different rounds of the same survey conducted seven years apart to obtain a fix on trends in spending, but the Bangladeshi analysis had to rely on only one survey during the period covered. On the other hand, the Sri Lankan survey data did not contain information on health spending by individual household member, unlike in Bangladesh. Nevertheless by making assumptions and extrapolating where necessary it was possible to extend the available household survey data to the all the years assessed. Given this experience, if the pre-conditions implied are met, it is certainly feasible to produce meaningful estimates of the level, pattern and general trend in child health expenditures within a framework meeting international standards in the developing country context. This can also be done with limited resources. This study would suggest for example that regular updates of child health spending could be produced every two to three years as an extension of the existing health accounts process in each of the two countries. In these two cases, meaningful interpretation of data also means an acknowledgement of the limitations in data availability and quality.

64 Guide to Producing CH Subaccounts
There is no standard NHA template for a report. In general, result presentation must be tailored to the specific needs of each country. We do recommend however that the report:
• Includes the specific child health indicators with some explanations to the trends or discrepancies found.
• Makes reference to the expenditure on child health in reference to the total health expenditure and the total expenditure on child health
• Makes reference to the proportional expenditure on child health (in relation to THE) in reference to the proportion of under five population (in relation to overall population)
Although emphasis is placed on the report of results, the development of a methodological basis to achieve the results is critical. Therefore, it is strongly suggested that a detailed document is produced to describe the methodology used to obtain the results. This document must include the assumptions made, the sources of information and references to the persons contacted and involved throughout the process. This methodological description is generally left out of the main report in order to facilitate comprehension of results and avoid the use of technical language. It can be attached as an annex to the main report. Once reports have been produced and distributed, it is important to assess how the results are being used and to evaluate to what extent the need for expenditure data has been satisfied. This is valuable step in implementing NHA because it provides guidance for improving or changing the focus of interest of the child health subaccounts in the longer-term perspective. 6.4. Work plan
The work plan proposed in the following chart assumes that certain NHA capacity and infrastructure already exists in the country. With time, as NHA becomes a component of the health information system, the time spent collecting data will be successively reduced. Ideally, each year should produce a set of accounts for the previous year. However, because some of the data refers to public expenditure, the regular cycles for reporting expenditure to the Ministries of Finance must be considered. That is, if the Ministry of Health has to present audited accounts for the expenditure of funds received from MOF by March of a given year, it is unlikely that the information for conducting NHA will be available before that date. Furthermore, the information presented with subaccounts has a two-year lag period. That is, although the subaccounts can be produced on a yearly basis, the results will correspond to funds spent two years before (e.g. the 2005 subaccounts will report on data from 2003, the 2006 subaccounts will report on 2004 data and so on). See Table 6.1 for a suggested work plan.

Guide to Producing CH Subaccounts Implementation process for CH subaccounts 65
Table 6.1: Activities and timeline for conducting the child health subaccounts
Month Activity 1 2 3 4 5 6 7 8 9 10 11 12
Project start up Form the child health group within the NHA Steering Committee Form the child health technical team Conduct training workshop and develop project work plan Identify with the Steering Committee the relevant CH policy questions Project implementation Identify child health relevant entities in the NHA flows Undertake inventory and assessment of existing data, identify gaps and develop data collection plan Set-up and finalize formats Collect secondary date Undertake primary data collection* Design or modify survey instruments -develop sampling frames and sample selection schemes -pre-test survey questionnaires -arrange logistics for implementation of surveys -implement data collection Design data entry screens Create electronic data file and clean data Analyse data and produce NHA subaccounts data Write report and submit to Steering Committee for Reviews Dissemination and Feedback Present subaccounts results to stakeholders Prepare dissemination materials according to specific audiences Disseminate and track use of subaccounts information * It is suggested to use as far as possible the existing surveys in the country. If required the team should discuss with the survey agencies to include certain questions that are relevant for expenditures related to child health refer reader to specific section in Chapter 4.
6.5. Complementarity of child health subaccounts with costing
estimates
The child health subaccounts are complementary not only to the National Health Accounts and to other subaccounts (reproductive health, malaria, and HIV/AIDS), but also to costing exercises undertaken to estimate the financial resources required to scale up key child survival interventions and reach the Millennium Development Goal number 4. 57 Such estimates usually cover a longer time period than the one-year period covered by the child health subaccounts. If such estimates are available, care should be taken to ensure that these results and those of the child health subaccounts be presented in a complementary fashion, so that the financing gap for child survival can be ascertained for that particular time period or projected for a longer period.
57 MDG 4: Reduce the under-five mortality rate by two-thirds between 1990 and 2015, equivalent to an annual rate of reduction of 5.4 percent.

66 Guide to Producing CH Subaccounts
6.6. Child health subaccounts when not done in conjunction with
NHA
The recommended approach to estimating child health expenditures is to carry this out along with the estimation of the entire NHA or within the context of an already existing NHA. The usefulness and comprehensiveness of the estimates are enhanced if the NHA is available as a reference. With NHA as a reference, the significance of child health expenditures in comparison with other health expenditures can be examined. This comparison is important for policy purposes, for example, because child health competes with other health needs within a limited pool of resources, the total of which is measured by the NHA. The child health expenditures can also be comprehensively estimated using the NHA boundaries and scope as guide. Furthermore, when the country teams have been trained in general NHA, and have used the knowledge in practice, it is much easier to extend the methodology for conducting child health subaccounts. When there is no existing NHA, it is possible to undertake stand-alone studies of child health expenditures. However, with no pre-existing experience of NHA, the resources required to embark on such study are considerable, and many obstacles may be encountered in the process. To undertake or to use the results of stand-alone studies of child health, consider how well NHA expenditure components are captured. For example:
1. What targeted58 child health expenditures are included? 2. What non-targeted health expenditures are included? How were these expenditures allocated between child health and other health activities? 3. What health related expenditures (research and training) are included? How was the boundary between child health and non-child health expenditures defined?
Caution must be observed when comparing child health expenditures estimated as stand-alone with results of other similar exercises, especially if the various components to compare are not estimated using uniform concepts and methodology. Moreover, as a stand-alone study, the child health expenditure estimates may not be an effective monitoring tool without a reference point such as the NHA. If the subaccounts are done outside the Ministry of Health, there may be less opportunity to incorporate the results into the policy process. 6.7. Institutionalization
Institutionalization refers to the process whereby the production of child health subaccounts becomes part of the routine activities of the country, with clearly defined objectives and allocated budget and staff. In many countries, the “institution” is the Ministry of Health or statistical organization. In others, it is an academic institution that has the mandate of producing the information on a yearly basis. The institutionalization of child health subaccounts, just as in the case of general NHA, can be analysed by looking at four dimensions: Recurrence – This component refers to the continuous production of child health subaccounts, preferably on a yearly basis. The importance of having the information produced regularly relates to the generation of trend data and the facility to monitor changes in the financing of health systems over time. The regular 58 For definition of targeted vs. non-targeted expenditures, refer to Chapter 2

Guide to Producing CH Subaccounts Implementation process for CH subaccounts 67
implementation of child health subaccounts can take some years. In some cases, several rounds of the subaccounts are produced before enough momentum is generated and the demand of information makes producing annual results an established process. Policy penetration – This component refers to the introduction of child health financial information into the policy making process. The information that is produced but not used becomes useless. For this reason, engaging different areas within the Ministry of Health and other Ministries (such as finance, social development) that either use or produce child health information is beneficial to the institutionalization process. Furthermore, various opportunities to use the information produced by the child health subaccounts, and thus contributing to the institutionalization process, exist: large donor meetings on the health components of Poverty Reduction Strategy Papers (PRSPs), Medium Term Expenditure Frameworks (MTEF), Sector Wide Approaches (SWAps), Annual Health Sector Reviews, Primary Health Care Reviews and meetings of the Partnership for Maternal Newborn and Child Health (PMNCH). On a smaller scale, Child Health Programme Reviews and more informal donor meetings may be used. Understanding the resources spent and how they flow for child health is a necessary requisite for advocating for increased investment in child health, including the health of newborns. It is therefore important to track the flow and amount of such investments, and to assess this information in the context of health indicators in order to evaluate the equity and efficiency of the delivery of child health. Government ownership – The initial trigger for using this tool is the government’s need for the child health financial information. The government ownership has to be translated into ongoing support, in terms of resource and time, from key policymakers. Broad demand and utilization – Under the premise that “information that is not used is not useful,” the production of child health subaccounts has to respond to the need of information of the broad group of users of such information. Furthermore, clear presentation of this information, targeted to different audiences, will increase its utilization and will lead to an increased demand and a repeating cycle. The process required for institutionalization differs from country to country, but exhibits some general features: Establish the relevant policy questions to be addressed by the child health subaccounts It is extremely important to start the child health subaccounts with the definition of policy relevant issues that need to be addressed. As pointed out previously in the chapter, this step will create ownership of the results, but also ensure that expectations are kept realistic. Having specific issues to address can focus the efforts of the team into obtaining the most relevant information to answer these questions. For example, if a country is particularly interested in knowing the amount spent on pharmaceuticals for children because a pharmaceutical reform is being planned, the team should spend enough time ensuring the availability of information on pharmaceuticals. This action may mean that the team may be unable to obtain as much information on other aspects of NHA such as expenditure by level of care. Establish standards for data collection and analysis The procedures and methods used for the collection and analysis of data needs to be clearly specified so that they become systematic. This also means that NHA child health teams need to have a long-term approach to data collection such as adding the necessary questions to other on-going surveys or data collection efforts. The methodologies used for weighing and extrapolation, as well as the persons contacted and the procedure for obtaining the data from different sources, must be clearly documented. Institute data reporting requirement Legislation of the data reporting requirements is recommended. This is particularly relevant for including a private sector that is often reluctant to share information.

68 Guide to Producing CH Subaccounts
Link NHA to the Health Information System Establishing NHA must become one of the strategies to strengthen the health information system. This will ensure continuity of NHA, as it is integrated to an institutionalized process. Furthermore, NHA can benefit by using the links that are established to obtain other information such as the procedures that exist for securing information on services provided. It is often the case that the same staff member can have access to data on services provided and financial information in a particular clinic. NHA will also benefit from any strategies, methods or standards that ensure the quality and timeliness of information being produced by the health information system. Establish links with academia, international organizations and civil society Involving academia, international organizations and members of the civil society in the implementation process contributes to the accountability of the results. Establish a process for dissemination of results This process involves promoting the results but also obtaining feedback on the use of information.

Guide to Producing CH Subaccounts Child health subaccounts indicators 69
7. Child health subaccounts indicators
7.1. Background
The important contribution of NHA child health subaccounts to improving health systems performance lies in its potential to produce relevant and accurate financial indicators that can be used to design, monitor and evaluate health policies and programmes. There is a great need for a clear understanding of the linkages between financial information generated by child health subaccounts and health policy objectives such as resource availability, equity, efficiency, effectiveness, and sustainability. Given the current focus on the MDGs, many policies and programmes aim to scale-up child health interventions and strategies, such as immunization and IMCI, to reach universal coverage. This entails reaching children that are marginalized and currently unable to access general health services. Scaling up service delivery to reach these children obviously requires increased resources and a more equitable sharing of the financial burden. In many countries households spend considerable amounts on health care, and out of pocket expenditures for health services can be between two and three times greater than the total health expenditure by governments and donors. Financial barriers to access have to be reduced or eliminated in order to reach universal access for children. However, most of the current monitoring and evaluation frameworks at all levels – global, national and local – do not include the use of financial indicators to help track progress towards child health outputs and outcomes. 59 This is a serious omission. Without knowing the balance between government spending and out of pocket payments, governments cannot be confident that the population enjoys equitable access to health care goods and services. In the absence of reliable financial data on how health resources are spent, there can be no certainty that the right services are reaching the people who are in greatest need. In addition, there can be little basis for prioritizing among health care objectives, evaluating alternative ways of raising finance and allocating resources or designing efficient and effective ways of providing health care services. Thus, reliable and accurate NHA child health indicators are fundamental to effective stewardship for the health system. Once the child health subaccount tables have been populated, there is need to construct relevant and accurate child health indicators that could inform evidence-based policymaking in the health system with regard to child health service financing, organization and delivery. In addition, these indicators could be used for making comparisons over time and between countries of similar socio-economic backgrounds. These indicators should be constructed in such a way that they relate to the key health policy goals of the health sector, i.e. equity, efficiency and sustainability so that they contribute to the policy debates within the country and at the international level. However, it should be noted that the structure of a health system, its health information system and the design of child health programs, raise methodological issues for computing policy-relevant indicators. Differences in the content of programs and the way child health services are delivered demands flexibility in devising a generally agreeable set of indicators. Nonetheless, country specific indicators should be constructed in such a way that they assist in addressing key child health policy goals and are also used for comparative and benchmarking purposes with other countries.
59 Only the Immunization Programme has developed indicators for monitoring Financial Sustainability

70 Guide to Producing CH Subaccounts
This chapter intends to inform the child health subaccounts team members on how to compute and interpret the child health subaccounts results in relation to the health policy objectives of resource availability, sustainability, efficiency and equity. However, in order to have a clear understanding of the link between child health subaccounts indicators and the key health policy objectives, it is important that the key health policy objectives be reviewed. 7.2. Key health policy objectives
There are several health policy objectives in the health system but this guide will review only those for whom indicators need to be developed. 60 7.2.1. Equity in health care financing
Equity in health care financing takes two forms, namely vertical and horizontal equity. According to Wagstaff and Van Doorslaer (1993) the financing of health care should be a function of the ability to pay i.e. vertical equity; and that individuals or families with the same ability to pay should make the same contribution i.e. horizontal equity. 61 Equity in finance is mainly evaluated on the basis of progressivity or regressivity of the financing source. Thus with regard to child health subaccounts, the following indicators could be constructed in order to measure equity in financing (for more details see Table 7.1):
• Expenditure on child health per child under five by urban/rural population • Private households’ out of pocketpayment for child health62
• as a percentage of Total Health Expenditure for child health • as a percentage of nonpublic sector expenditure on child health • per children under five
7.2.2. Efficiency
Efficiency could be defined as the allocation of resources that yields the best value at the lowest cost. In health care, efficiency could be categorized into three groups: technical; allocative and scale/economic efficiency. 63 Child health indicator results could be used to examine efficiency in health systems over time and across countries that are socio-economically similar. However, with regard to child health subaccounts only allocative efficiency indicators should be calculated. This is because allocative efficiency deals with the allocation of resources between the most cost-effective interventions with the aim of maximizing the net benefit to the society, which is the main focus of child health subaccounts, i.e., the allocation of child health financial resources between functions whose primary purpose is to improve, restore or maintain the health of the children between zero and less than five years and that of the 60 For more details on indicators and health policy objectives see: Knowles, J., C. Leighton, and W. Stinson. 1997. Measuring Results of Health Sector Reform for System Performance. A Handbook of Indicators. Special Initiative Report No.1. Bethesda, MD: Partners for Health Reform (PHR), Abt Associates Inc. Schneider, Pia and Paurvi Bhatt. November 2004. Linking Indicators from National Health Accounts and the NHA HIV/AIDS Subanalysis to Health Policy Goals. Bethesda, MD: The Partners for Health Reformplus (PHRplus), Abt Associates Inc. 61 Wagstaff A, van Doorslaer E (1993). Equity in the finance and delivery of health care: Concepts and definitions. In: Van Dooeslaer E, Wagstaff A, F. Equity in the finance and delivery of health care: An International Perspective. New York: Oxford University Press. 62 Out of pocket expenditure only includes direct payments to providers. 63 Newbrander W, Barnum H (1992). Hospital Economics and Financing in developing countries. WHO Geneva.

Guide to Producing CH Subaccounts Child health subaccounts indicators 71
caretaker. The following allocative efficiency indicators could be constructed (for more details see Table 7.1):
• Services of curative care on child health as a percentage of Total Health Expenditure for child health services by provider type
• Inpatient curative care on child health as a percentage of Total Health Expenditure for child health by provider type
• Outpatient curative care on child health as a percentage of Total Health Expenditure by provider type
• Prevention and public health services for child health as a percentage of Total Health Expenditure by provider type
7.2.3. Sustainability and resource availability
Sustainability in financing mainly refers to, 1) the capacity of the health system to continue its activities in the future and 2) to expand activities to keep up with population growth and with additional demands created by diseases. It also refers to the capacity of the health system to replace donor funds with funds from domestic sources (Knowles, et al. 1997). As many low-income countries are significantly donor dependent and they have very low general revenue tax-bases which generates low revenues and consequently low revenues being allocated for general health or child health, this indicator is very useful. It will greatly assist in portraying the resource envelope currently available in the country and between countries and in future after making projections of different sources of child health sources of finance. Such an approach would bring reality to child health planning and process-development of child health programmes as stakeholders would be aware of the limitations imposed on their plans by financial resources that are currently available and in future. Some of the notable indicators which could be generated include (for details see Table 7.1):
• Public funds on child health as a percentage of Total Health Expenditure for child health • Public funds on child health as a percentage of total public funds on health
7.3. Minimum set of indicators
As noted above there are several indicators which could be produced from child health subaccounts tables. In order to analyse a problem and derive policy recommendations a combination of indicators is needed. However, in these child health subaccounts guidelines it is recommended that a minimum set of indicators which are most common, easy to construct and relevant to most countries’ health policy objectives be constructed. The proposed indicators in Table 7.1 are not exhaustive but are mainly selected to present choices of indicators linked to the health accounting classifications and to potential health policy uses within countries and at the international level. For these indicators to be calculated there is need for monetary units and physical (non monetary) units data. Table 7.1 proposes the minimum and optional set of indicators that the child health subaccounts should produce and links them with four topical areas linked to health policy relevance and implications:
• Resource availability • Financial sustainability • Allocative efficiency • Equity
Some details on optional indicators are also presented on Annex 6. As much as these tables provide a list of minimum set of desired indicators, the quality of data input is key to defining the value and reliability of each indicator. In most cases, data availability constitutes the first barrier in generating an indicator. As

72 Guide to Producing CH Subaccounts
such, country teams should carefully evaluate the quantity and quality of data sources before attempting to compute any of the indicators.

Guide to Producing CH Subaccounts Child health subaccounts indicators 73
Table 7.1. Proposed list of indicators for the child health subaccount report64
Type of indicator
Indicator Description Health Policy/Objective Area of Concern Source Table in CH Subaccounts
General Indicators
• Total Health Expenditure for Child Health- THECH • Total Health Expenditure per child under 5-THECH per child under 5 • Total Health Expenditure on child health - THECH as a percentage of
Total Health as a percentage of THE
Resource availability for CH services and programmes
• Assess allocation of total health expenditures towards CH and compare with national priorities/burden of diseases/need
• Advocate for increased funding for child health
All
Financing Sources Indicators
• Public funds (FS.1) on CH as a percentage of THECH • Private funds (FS.2) on CH as a percentage of THECH • Rest of the world funds (FS.3) on CH as a percentage of THECH
65 • Public funds (FS.1) on CH as a percentage of total public funds (FS.1) on
health
Financial sustainability of CH services and programmes
• Assess the sustainability of CH services and programmes in the absence of donor support
Resource availability • Assess adequacy of funds from all sources
and evaluate alternative sources of financing CH
Allocative efficiency • Assess allocation of public expenditures
towards CH and compare with national priorities/burden of diseases/need
FSxHF
64 The codes in Table 7.1 are based on the classifications of the Producers’ Guide. 65 Note, in some countries the donor funding is included under public expenditures, depending on the system of accounts used (e.g. Sri Lanka)

74 Guide to Producing CH Subaccounts
Type of indicator
Indicator Description Health Policy/Objective Area of Concern Source Table in CH Subaccounts
Financing Agent Indicators
• Public sector expenditure (HF.A) on CH as a percentage of THECH • Nonpublic sector expenditure (HF.B) on CH as a percentage of THECH
o Private insurance expenditure on CH (HF.2.1.2+HF.2.2) as a percentage of THECH as a percentage of nonpublic sector expenditure (HF.B)
on CH o Private households’ out-of-pocket66 payment for CH (HF.2.3)
as a percentage of THECH as a percentage of nonpublic sector expenditure (HF.B)
on CH per children under 5 as a percentage OOPS
o CH expenditure from non-profit institutions serving households (HF.2.4)
as a percentage of THECH as a percentage of nonpublic sector expenditure (HF.B)
on CH o CH expenditure from private nonparastatal firms and
corporations (HF.2.5.2) as a percentage of THECH as a percentage of nonpublic sector expenditure (HF.B)
on CH
Financial sustainability • Assess the sustainability of CH services and
programmes in the absence of donor support
Equity in financing of CH child health services
• Assess the burden of financing CH placed upon households through direct out-of-pocket payments
• Assess alternative financing options for CH services and programmes (e.g. prepaid versus Out-of-pocket payments
FSXHF HFXHP
Provider Indicators
• Hospital expenditure on CH (HP.1) as a percentage of THECH o Public sector hospital expenditure on CH as a percentage of
THECH o Private sector hospital expenditure on CH as a percentage of
THECH • Expenditure on CH from providers of ambulatory health care (HP.3) as a
percentage of THECH o Expenditure on CH from providers of ambulatory health care in
the public sector as a percentage of THECH o Expenditure on CH from providers of ambulatory health care in
the private sector as a percentage of THECH
Allocative Efficiency • Assess allocative efficiency between
provider by ownership- i.e. the cost effectiveness of public provision versus private provision
• Assess allocative efficiency between levels of care-i.e. the cost effectives of hospital level versus ambulatory level CH services
HFXHP
66 OOP expenditure only includes direct payments to providers.

Guide to Producing CH Subaccounts Child health subaccounts indicators 75
Type of indicator
Indicator Description Health Policy/Objective Area of Concern Source Table in CH Subaccounts
Functional Indicators
• Services of curative care on CH (HC.1) as a percentage of THECH o Inpatient curative care on CH (HC.1.1) as a percentage of
THECH o Outpatient curative care on CH (HC.1.3) as a percentage of
THECH • Medical goods dispensed to outpatients for CH (HC.5) as a percentage of
THECH • Prevention and public health services for CH (HC.6) as a percentage of
THECH • Health administration and health insurance for CH (HC.7) as a
percentage of THECH • Capital formation for CH (HC.R.1) as a percentage of THECH
Allocative Efficiency • Monitor allocative efficiency between CH
services e.g. curative versus preventive services; allocation of resources to general health administration of CH services and programmes versus curative and preventive CH services etc)
HFx HC HP x HC
Optional Indicators
CH Specific Priority Interventions Indicators
• Expenditure on Breastfeeding promotion as a % of THECH
• Expenditure on Integrated management of sick children as a % of THECH
(use expenditures on curative care under the functional classification to proxy this)
• Expenditure on ITNs as a % of THECH • Expenditure on immunizations as a % of THECH
Allocative efficiency • Assess allocation of resources to CH cost
effective interventions
HC 6.1.1.1 HC 1.3 HC 5.2.9 HC 6.1.1.2 Additional informational and Special Table required
Distributional Indicators
• Expenditure on CH per child under 5 by urban/rural population Equity in financing of CH • Assess the burden of financing CH
between the urban and rural populations
Additional information required
Notes CH Child health PuSHE Public sector health expenditure (at the financing agent level) PuSHECH Public sector expenditure on child health (at the financing agent level) OOPS Out-of-pocket spending on health OOPSCH Out-of-pocket spending on child health ROWHE Rest of the World Health Expenditure (at the financing source level) ROWHECH Rest of the World Expenditure on Child Health (at the financing source level) TGE Total Government Expenditure THE Total Health Expenditure THECH Total Health Expenditure on Child Health

76 Guide to Producing CH Subaccounts
As it can be seen in Table 7.1, these indicators could greatly assist in carrying out appropriately the health system function of stewardship and health financing-revenue collection, pooling and resource allocation/purchasing hence accelerate health systems performance. However, for these indicators to be more relevant to policymakers, countries must ensure that policymakers are made aware of the importance of child health subaccounts first and that complete, accurate and consistent data is gathered and analyzed for decision-making. Once the indicators are computed by the child health subaccounts Team, it is recommended that that their interpretation should be done in collaboration with policymakers so that they are presented within the context of the country’s health policy objectives. Thereafter, these indicators should be discussed with all relevant stakeholders in the health systems or those involved in planning and implementation of child health programmes. It is more likely that this kind of approach will inform policy process and also assist in deriving evidence based recommendations. For this to be effective there is strong need for financial transparency among agencies involved in health financing and provision. Agencies should be able to report data on how much they spend on child health and on what it is spent on so as to cross check with the objectives of the health system and thereafter be engaged in interpreting the results and making policy recommendations. For example, child health subaccounts findings from the Sri Lanka and Bangladesh studies emphasized the importance of looking at efficiency of expenditures, i.e. what the money is used for rather than just looking at the level of expenditures. This is very important especially in resource constrained environments found in developing countries where the potential of raising additional revenues from domestic sources are limited and the only best options appear to be that of using the existing limited resources efficiently or donor resources. As such, it is important that a breakdown of expenditures by provider and function be made so as to make it easy for interpreting data and using them in health policy decisions. Such a provider by function expenditure breakdown would simultaneously address most of the issues dealing with allocative efficiency of child health resources in the health system. For instance, it would clearly show which provider receives which funds and for what and how efficient it is using the funds it had received from financing agents. This information would greatly assist in setting benchmarks for monitoring efficiency between providers or commissioning further investigations on the causes of the differences in efficiency between similar health providers. Annexes 7, 8 and 9 give examples of some of the child health subaccounts indicators that were developed in Malawi, Ethiopia, Bangladesh and Sri Lanka. These indicators have proved to be extremely useful in revealing the absolute inadequacy of child health resources in the health systems and have also exposed the issue of non-sustainability of child health programmes in the event of withdraw of donor support especially in Malawi and Ethiopia. Furthermore, the indicators have been used in making international comparisons. For example child health expenditures per child in Malawi are the highest among the four countries. However, the child health outcomes are the worst. This has raised the debate on the efficiency and equity of child health expenditures in Malawi and the role played by other factors such as income, education of the mother, water and sanitation among others on the health of the child. In summary, indicators are summary measures that synthesize complex conditions. Developing indicators to meet both sensitivity and specificity requirements is a major challenge and the goal is to generate indicators that are universally understandable and easily interpreted. A basic set of indicators can be directly generated from the child health subaccounts tables, and others may require additional information. In any case, a thorough analysis of the financing of child health in a country is not simply the presentation of expenditure indicators. These indicators must be analysed in relation to other aspects of

Guide to Producing CH Subaccounts Child health subaccounts indicators 77
the health system such as service production, or level of health obtained given a determined level of expenditure i.e. key health policies of the health system.

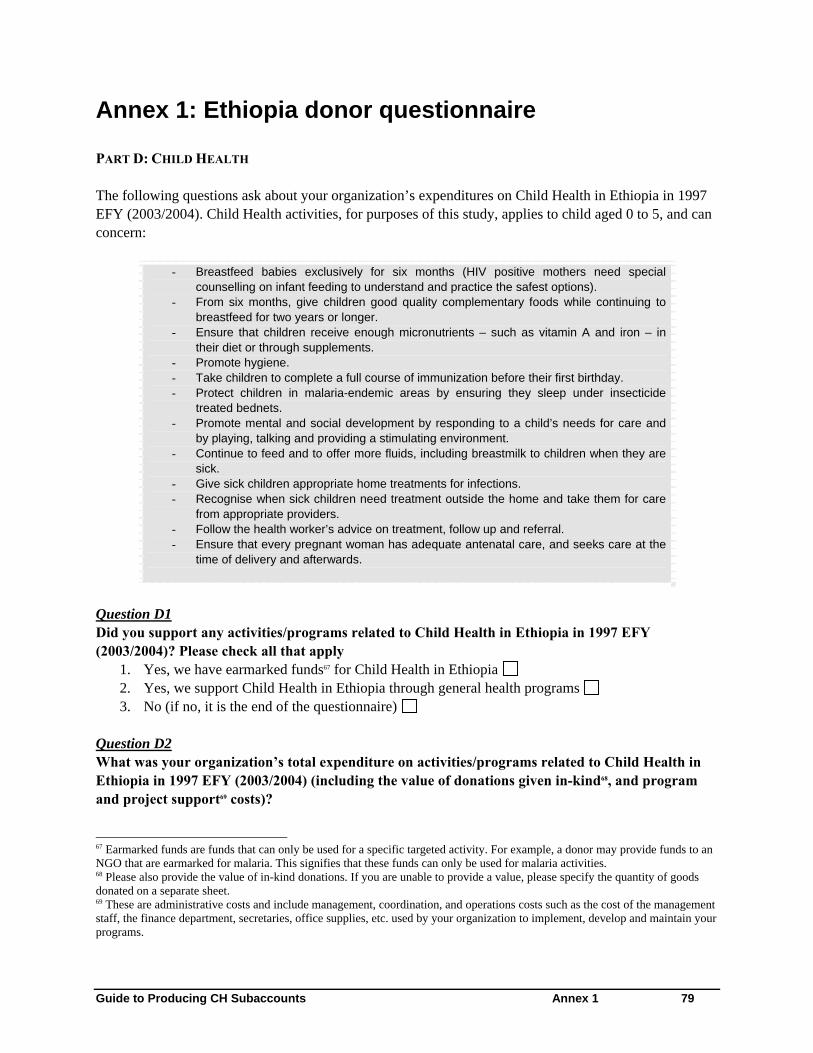
Guide to Producing CH Subaccounts Annex 1 79
Annex 1: Ethiopia donor questionnaire
PART D: CHILD HEALTH The following questions ask about your organization’s expenditures on Child Health in Ethiopia in 1997 EFY (2003/2004). Child Health activities, for purposes of this study, applies to child aged 0 to 5, and can concern:
- Breastfeed babies exclusively for six months (HIV positive mothers need special counselling on infant feeding to understand and practice the safest options).
- From six months, give children good quality complementary foods while continuing to breastfeed for two years or longer.
- Ensure that children receive enough micronutrients – such as vitamin A and iron – in their diet or through supplements.
- Promote hygiene. - Take children to complete a full course of immunization before their first birthday. - Protect children in malaria-endemic areas by ensuring they sleep under insecticide
treated bednets. - Promote mental and social development by responding to a child’s needs for care and
by playing, talking and providing a stimulating environment. - Continue to feed and to offer more fluids, including breastmilk to children when they are
sick. - Give sick children appropriate home treatments for infections. - Recognise when sick children need treatment outside the home and take them for care
from appropriate providers. - Follow the health worker’s advice on treatment, follow up and referral. - Ensure that every pregnant woman has adequate antenatal care, and seeks care at the
time of delivery and afterwards.
Question D1 Did you support any activities/programs related to Child Health in Ethiopia in 1997 EFY (2003/2004)? Please check all that apply
1. Yes, we have earmarked funds67 for Child Health in Ethiopia 2. Yes, we support Child Health in Ethiopia through general health programs 3. No (if no, it is the end of the questionnaire)
Question D2 What was your organization’s total expenditure on activities/programs related to Child Health in Ethiopia in 1997 EFY (2003/2004) (including the value of donations given in-kind68, and program and project support69 costs)?
67 Earmarked funds are funds that can only be used for a specific targeted activity. For example, a donor may provide funds to an NGO that are earmarked for malaria. This signifies that these funds can only be used for malaria activities. 68 Please also provide the value of in-kind donations. If you are unable to provide a value, please specify the quantity of goods donated on a separate sheet. 69 These are administrative costs and include management, coordination, and operations costs such as the cost of the management staff, the finance department, secretaries, office supplies, etc. used by your organization to implement, develop and maintain your programs.

80 Guide to Producing CH Subaccounts
Amount:
If you were unable to provide an amount, what is the approximate percentage of your total health expenditure (as entered in question D1) that goes towards Child Health programs/activities? _________________________%
Question D3 For this question, we want you to describe your organization’s projects or programs that are related to Child Health in Ethiopia.
- Column (a): Give the title of each project - Column (b): Give a description of each project as it pertains to Child Health, using, as much as
possible, the codes provided in the table below. - Column (c): Specify for each project, to which recipient agency and/or implementing
organization did the funds go to, by ticking the appropriate box. - Column (d): Give the amount you spent on each project in 1997 EFY (2003/2004).
To describe the projects you fund, you may use the following descriptors (write the corresponding code in column (b). If these descriptors, do not apply to your project, describe the projects using your own words and vocabulary. Code Description CH1 Immunization CH2 De-worming, Vitamin A and food supplementation CH3 Promotion of Exclusive Breast Feeding and Complementary Feeding CH4 Prevention (other than immunization) CH5 ITNs for children under five CH6 Curative care: Management of childhood illness such as oral rehydration therapy, zinc for diarrhea
management, treatment of malaria with anti-malarials, case management of under five pneumonia (use of antibiotics), management of neonatal sepsis (use of antibiotics)
CH7 Community and Facility based therapeutic feeding CH8 Training of health workers CH9 Operational research CH10 Capital formation (This category refers to investments in physical assets, such as land, buildings and
equipment, such as the construction of clinics)

Guide to Producing CH Subaccounts Annex 1 81
# (a)
Project / Program Title
(b) Description of project /
program as it pertains to Child Health (as much as possible, use the codes CH1 to Ch10 in the table
above)
(c) Recipient agency and/or
implementing organization
(d) Total amount spent on the project / program
in 1997 EFY (2003/2004) per
Recipient agency and/or implementing
organization 1) Federal Government
Specify:
2) Regional Health Bureau
Specify region(s):
3) Other regional office Specify office(s):
4) Woreda Health Office How many?: Specify region(s):
5) Local NGO Specify name(s):
6) International NGO Specify name(s):
7) Own organization/programs
8 Others Specify:

82 Guide to Producing CH Subaccounts
Question D4 How much did your organization spend for program and project support70 for Child Health activities?
Amount: ______________________________________ If you were unable to provide an amount, what is the approximate percentage of your total expenditure on child health (as entered in question D2) that goes towards program and project support for child health activities? ____________________%
Question D5 How much did you spend on local consultancy (for technical assistance) for child health related activities?
Amount: ______________________________________
If you were unable to provide an amount, what is the approximate percentage of your total expenditure on child health (as entered in question D2) that goes towards local consultancy for child health related activities? ____________________%
**** END OF QUESTIONNAIRE **** If you have any questions concerning this questionnaire, please call the supervisor below: Name: _______________________________________________________________ Telephone number: _______________________________________ Email: __________________________________________________________________ We ask you to return your completed questionnaire to the supervisor by the following date Due Date: ________ ___________ 2005
70 These are administrative costs and include management, coordination, and operations costs such as the cost of the management staff, the finance department, secretaries, office supplies, etc. used by your organization to implement, develop and maintain your programs.

Guide to Producing CH Subaccounts Annex 2 83
Annex 2: Adding rider questions to ongoing surveys
Donor and NGO NHA surveys A common place to add rider questions are in ongoing donor and NGO NHA surveys when the subaccounts are implemented concurrently. This approach allows for analysis of CH spending within the context of overall health expenditures. Annex 1 provides an example of a donor survey instrument used in Ethiopia that included a module on overall health spending and on CH-related expenditure. The experience in Ethiopia and Malawi showed that sending NHA surveys, either to donors, NGOs, insurance companies, and/or employers, requires extensive follow-up and communication with the respondents to make sure that the questionnaires are understood and filled out correctly, and to obtain more detailed information on the programs that are related to CH. The first reason being that between the areas of reproductive health, CH, HIV/AIDS, and malaria, it is sometimes difficult for the respondent to identify the expenditure that go to each of them, or to apportion, among programmatic expenditure, the amounts that go to child health. To help the process, it is critical that donors and NGOs provide information and a comprehensive description of their projects and programs in order to infer the expenditure related to CH. Household surveys While general expenditure surveys rarely include modules to track expenditures for specific health interventions, depending upon policy need such modules may be developed and included in surveys. Modules for specific age groups or even diseases can be added to Household Health Expenditure and Utilization Surveys. or other regular expenditure surveys. One such module has been developed for child health and used in the Malawi along with a module for Reproductive health. However, even when no such specific modules are used, the general results produced by these surveys can later be sorted out by age, gender etc. to provide data that is useful for producing the out of pocket component of the child health subaccounts. In general, there is a trade-off between adding specific modules and making the household questionnaires long and costly. WHO has developed a MCH coverage survey for gathering information on key indicators for maternal, newborn, and child health (MCH). The survey is intended to complement other larger household surveys, such as MICS and DHS, which require substantial resources and are implemented with longer intervals. The MCH coverage survey is therefore intended to be applied in a more limited number of households, requiring fewer financial resources, and providing quick indicative results on coverage and delivery channels that can be used by countries to manage their maternal and child health programmes. The modular format allows for countries to implement selected modules of particular interest. The tool is targeted at districts or subregions, with implementation time of about one month. The survey will focus on collecting information useful for programme management at the local level. It will complement the MICS and DHS which are not conducted frequently enough for routine programme management. The survey instruments and methodology have been developed by CAH with input from several WHO Departments (MPS, GMP) as well as the Regional Offices and UNICEF/HQ. One of the modules included deals with care seeking and expenditures for key child health interventions in the two weeks preceding the survey. In addition to being part of the coverage survey, the child health expenditure module can also be integrated into a general household expenditure survey, or it may be used as a stand-alone instrument to gather information about care seeking and household expenditures for children under five.


Guide to Producing CH Subaccounts Annex 3 85
Annex 3: Apportionment rules applied to expenditures in Bangladesh health accounts to estimate child health spending
[ICHA-HC Code] Function category
Apportionment method
[1] Personal Health care [1.1] Hospital services
[1.1.1] Hospital inpatient care
• Inpatient care by providers and age groups was distributed using HDS 1999/2000 data, which contains data on health care utilization and out-of-pocket expenditure by type of provider and individual. These ratios were then applied to all years.
• Public sector inpatient expenditures distributed according to distribution of utilization measured in terms of admissions as in-patients.
• Private sector inpatient expenditures distributed according to distribution of out-of-pocket payments, which included operation charges, rental fees and accompanying persons’ food and other expenses.
• NGO inpatient care was assumed to be zero, since NGO care is directed overwhelmingly to outpatient care and child immunization.
[1.1.2] Hospital outpatient care
• Outpatient care by providers and age groups was distributed using HDS 1999/2000 data, which contains data on health care utilization and out-of-pocket expenditure by type of provider and individual. These ratios were then applied to all years. However, HDS data do not permit disaggregation of private use by for-profit and non-profit providers in the case of private hospital care.
• Outpatient care provided to 0-4 years by private hospitals was assumed to be zero
• Outpatient care provided by MOHFW facilities to age group 0-4 years distributed according to the distribution of visits made to public sector facilities in the HDS data
[1.2] Ambulatory health care Services
Medical practitioners • This category of expenditure comprises only private sector providers paid out-of-pocket, and include practicing modern and traditional physicians, and homeopaths.
• Expenditures distributed by age according to the HDS 1999/2000 data. [2] Diagnostic and imaging services
• Included are household out-of-pocket expenditures reported in HDS 1999/2000 on diagnostic and imaging services
• Expenditures distributed by age according to the HDS 1999/2000 data [3] Medicine and other medical goods
• Included are household out-of-pocket expenditures reported in HDS 1999/2000 on medicines and other medical goods
• Expenditures distributed by age according to the HDS 1999/2000 data [4] Collective Health care
[4.1] Family planning including maternal and child health care services
• 5% of these expenditures (that relate primarily to birth-related expenditures) allocated to child health – this share is based on expert consultation.
• Note that total number of births in hospitals is small (less than 10% of all births)
[4.2] School health services • Zero expenditure (0%) is assumed as 0-4 years age group does not attend school
[4.3] Prevention of communicable disease - immunizations
• All expenditures (100%) by MOFW and NGOs in this functional category were ascribed to immunization of children of age 0-4 years.

86 Guide to Producing CH Subaccounts
[5] Health administration and health insurance
• Private health insurance is very limited, and no social insurance in Bangladesh. Share for child health was assumed to be zero since private health insurance is mostly to cover workers in a few companies, and only public health administration cost was considered.
• Expenditures for public sector health administration were distributed to child health by prorating according to distribution of all other public sector expenditures
[6] Capital formation • 5% of the total expenditure allocated to child health determined on the basis of expert consultation.
[7] Education and training • 5% of the total expenditure allocated to CH on the basis of expert consultation.
[8] Research • 10% of the total expenditure allocated to CH on the basis of expert consultation.
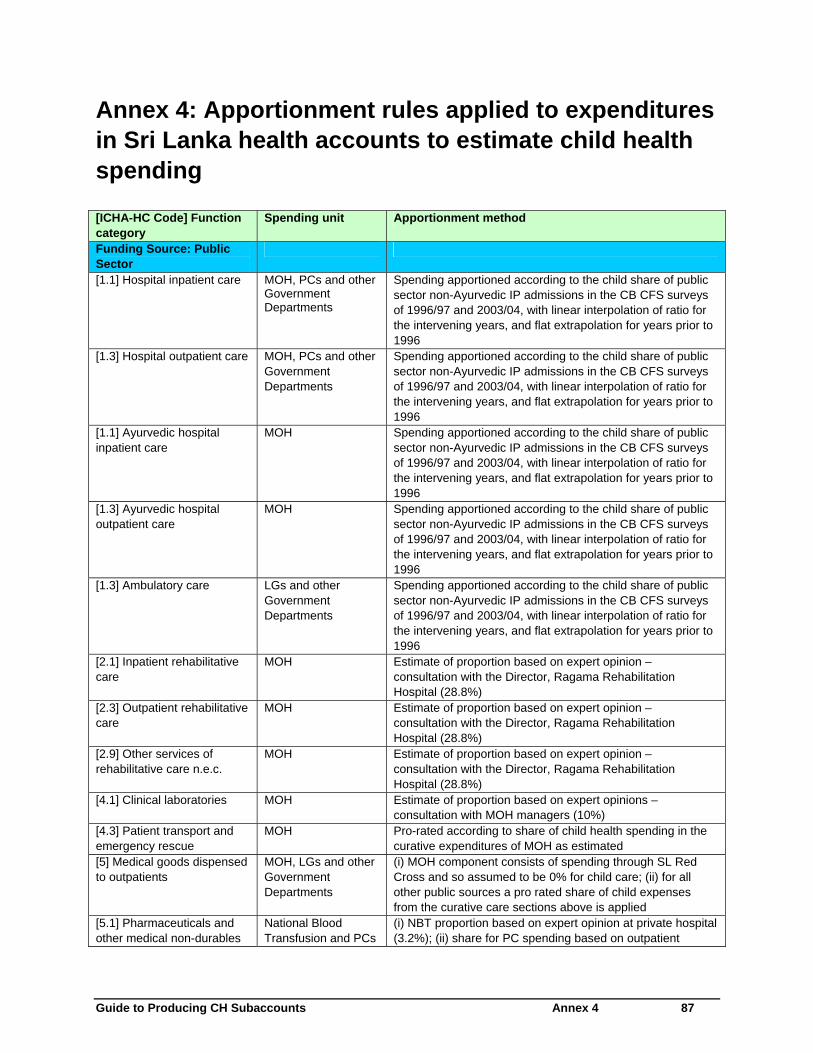
Guide to Producing CH Subaccounts Annex 4 87
Annex 4: Apportionment rules applied to expenditures in Sri Lanka health accounts to estimate child health spending
[ICHA-HC Code] Function category
Spending unit Apportionment method
Funding Source: Public Sector
[1.1] Hospital inpatient care MOH, PCs and other Government Departments
Spending apportioned according to the child share of public sector non-Ayurvedic IP admissions in the CB CFS surveys of 1996/97 and 2003/04, with linear interpolation of ratio for the intervening years, and flat extrapolation for years prior to 1996
[1.3] Hospital outpatient care MOH, PCs and other Government Departments
Spending apportioned according to the child share of public sector non-Ayurvedic IP admissions in the CB CFS surveys of 1996/97 and 2003/04, with linear interpolation of ratio for the intervening years, and flat extrapolation for years prior to 1996
[1.1] Ayurvedic hospital inpatient care
MOH Spending apportioned according to the child share of public sector non-Ayurvedic IP admissions in the CB CFS surveys of 1996/97 and 2003/04, with linear interpolation of ratio for the intervening years, and flat extrapolation for years prior to 1996
[1.3] Ayurvedic hospital outpatient care
MOH Spending apportioned according to the child share of public sector non-Ayurvedic IP admissions in the CB CFS surveys of 1996/97 and 2003/04, with linear interpolation of ratio for the intervening years, and flat extrapolation for years prior to 1996
[1.3] Ambulatory care LGs and other Government Departments
Spending apportioned according to the child share of public sector non-Ayurvedic IP admissions in the CB CFS surveys of 1996/97 and 2003/04, with linear interpolation of ratio for the intervening years, and flat extrapolation for years prior to 1996
[2.1] Inpatient rehabilitative care
MOH Estimate of proportion based on expert opinion – consultation with the Director, Ragama Rehabilitation Hospital (28.8%)
[2.3] Outpatient rehabilitative care
MOH Estimate of proportion based on expert opinion – consultation with the Director, Ragama Rehabilitation Hospital (28.8%)
[2.9] Other services of rehabilitative care n.e.c.
MOH Estimate of proportion based on expert opinion – consultation with the Director, Ragama Rehabilitation Hospital (28.8%)
[4.1] Clinical laboratories MOH Estimate of proportion based on expert opinions – consultation with MOH managers (10%)
[4.3] Patient transport and emergency rescue
MOH Pro-rated according to share of child health spending in the curative expenditures of MOH as estimated
[5] Medical goods dispensed to outpatients
MOH, LGs and other Government Departments
(i) MOH component consists of spending through SL Red Cross and so assumed to be 0% for child care; (ii) for all other public sources a pro rated share of child expenses from the curative care sections above is applied
[5.1] Pharmaceuticals and other medical non-durables
National Blood Transfusion and PCs
(i) NBT proportion based on expert opinion at private hospital (3.2%); (ii) share for PC spending based on outpatient
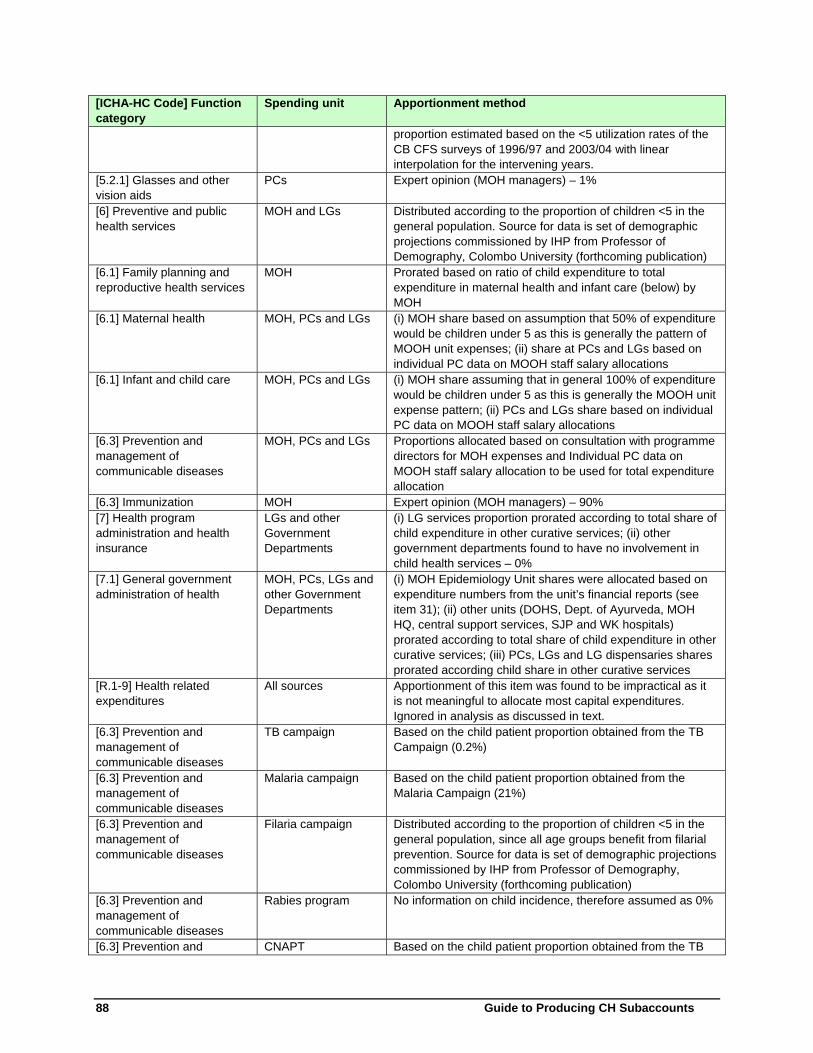
88 Guide to Producing CH Subaccounts
[ICHA-HC Code] Function category
Spending unit Apportionment method
proportion estimated based on the <5 utilization rates of the CB CFS surveys of 1996/97 and 2003/04 with linear interpolation for the intervening years.
[5.2.1] Glasses and other vision aids
PCs Expert opinion (MOH managers) – 1%
[6] Preventive and public health services
MOH and LGs Distributed according to the proportion of children <5 in the general population. Source for data is set of demographic projections commissioned by IHP from Professor of Demography, Colombo University (forthcoming publication)
[6.1] Family planning and reproductive health services
MOH Prorated based on ratio of child expenditure to total expenditure in maternal health and infant care (below) by MOH
[6.1] Maternal health MOH, PCs and LGs (i) MOH share based on assumption that 50% of expenditure would be children under 5 as this is generally the pattern of MOOH unit expenses; (ii) share at PCs and LGs based on individual PC data on MOOH staff salary allocations
[6.1] Infant and child care MOH, PCs and LGs (i) MOH share assuming that in general 100% of expenditure would be children under 5 as this is generally the MOOH unit expense pattern; (ii) PCs and LGs share based on individual PC data on MOOH staff salary allocations
[6.3] Prevention and management of communicable diseases
MOH, PCs and LGs Proportions allocated based on consultation with programme directors for MOH expenses and Individual PC data on MOOH staff salary allocation to be used for total expenditure allocation
[6.3] Immunization MOH Expert opinion (MOH managers) – 90% [7] Health program administration and health insurance
LGs and other Government Departments
(i) LG services proportion prorated according to total share of child expenditure in other curative services; (ii) other government departments found to have no involvement in child health services – 0%
[7.1] General government administration of health
MOH, PCs, LGs and other Government Departments
(i) MOH Epidemiology Unit shares were allocated based on expenditure numbers from the unit’s financial reports (see item 31); (ii) other units (DOHS, Dept. of Ayurveda, MOH HQ, central support services, SJP and WK hospitals) prorated according to total share of child expenditure in other curative services; (iii) PCs, LGs and LG dispensaries shares prorated according child share in other curative services
[R.1-9] Health related expenditures
All sources Apportionment of this item was found to be impractical as it is not meaningful to allocate most capital expenditures. Ignored in analysis as discussed in text.
[6.3] Prevention and management of communicable diseases
TB campaign Based on the child patient proportion obtained from the TB Campaign (0.2%)
[6.3] Prevention and management of communicable diseases
Malaria campaign Based on the child patient proportion obtained from the Malaria Campaign (21%)
[6.3] Prevention and management of communicable diseases
Filaria campaign Distributed according to the proportion of children <5 in the general population, since all age groups benefit from filarial prevention. Source for data is set of demographic projections commissioned by IHP from Professor of Demography, Colombo University (forthcoming publication)
[6.3] Prevention and management of communicable diseases
Rabies program No information on child incidence, therefore assumed as 0%
[6.3] Prevention and CNAPT Based on the child patient proportion obtained from the TB

Guide to Producing CH Subaccounts Annex 4 89
[ICHA-HC Code] Function category
Spending unit Apportionment method
management of communicable diseases
Campaign (0.2%)
[6.3] Prevention and management of communicable diseases
Central government public health services
Distributed according to the proportion of children <5 in the general population, since all activities are targeted at whole population. Source for data is set of demographic projections commissioned by IHP from Professor of Demography, Colombo University (forthcoming publication)
[6.3] Prevention and management of communicable diseases
Health Education Bureau
Distributed according to the proportion of children <5 in the general population, since all activities are targeted at whole population. Source for data is set of demographic projections commissioned by IHP from Professor of Demography, Colombo University (forthcoming publication)
[7.1] General government administration of health
Epidemiology unit Vaccination-related expenses allocated according to relative share of vaccination of which 80% is for children <5; the remainder of the epidemiology unit expenses are distributed according to the proportion of children <5 in the general population, since all activities are targeted at whole population.
[6.3] Targeted nutrition for malnourished children
Thriposha Programme
Actual data obtained from program, and were allocated to prevention and management of CDs
Funding Source: Private Sector
[1.1] Hospital inpatient care Private insurance companies, households, NGOs and employer spending
(i) Relative rate of admissions for children <5 estimated based on the child share of (private IP + public IP) utilization rates in the CB CFS surveys of 1996/97 and 2003/04 with linear interpolation for the intervening years; (ii) relative rates of admission then multiplied into size of each age group for each year to obtain distribution of admissions by age group (iii) the child share of expenditures was then derived by using as weights the per visit age-specific unit expenditure estimates from the 1991 HHS.
[1.3] Hospital outpatient care Private Insurance companies and NGOs
Same method used as for private sector inpatient care funded by private insurance (see above)
[1.3] Ambulatory care Households and employer spending
Same method used as for private sector inpatient care funded by private insurance (see above)
[1.3] General practitioner Households Same method used as for private sector inpatient care funded by private insurance (see above)
[1.3] Medical specialist Households Same method used as for private sector inpatient care funded by private insurance (see above)
[1.3] Traditional medicine providers
Households Same method used as for private sector inpatient care funded by private insurance (see above)
[4.1] Clinical laboratories Households Expert opinion (10%) [4.2] Diagnostic imaging Households Pro-rated according to share of child health spending in all
other private curative expenditures as estimated [4.3] Patient transport and emergency rescue
Households Pro-rated according to share of child health spending in all other private curative expenditures as estimated
[5.1] Pharmaceuticals and other medical non-durables
Households and NGOs
Consensus estimate agreed with advisory committee -10% allocated to IP care and 90% to OP care
[5.1.3] Traditional medicines Households Consensus estimate agreed with advisory committee -10% allocated to IP care and 90% to OP care
[5.1.3] Other pharmaceuticals and medical non-durables n.e.c
Households Consensus estimate agreed with advisory committee -10% allocated to IP care and 90% to OP care

90 Guide to Producing CH Subaccounts
[ICHA-HC Code] Function category
Spending unit Apportionment method
[5.2.1] Glasses and other vision aids
Households Expert opinion (1%)
[5.2.2] Orthopedic appliances and other prosthetics
Households Expert opinion (2%)
[5.9] Other medical goods dispensed to outpatients n.e.c
Households Expert opinion (2%)
[6.1] Family planning and reproductive health services
NGOs Child share of this is assumed to be zero as this is mainly for contraceptives, etc
[R.1-9] Health related expenditures
All sources Making an assumption here was deemed not appropriate, and therefore no shares were derived
Funding Source: Rest of the World
WHO funded projects Actual expenditure numbers were obtained from WHO, and analysis based on expert opinion on a project by project basis of the share of children was worked out. The rest of the foreign funds are basically coming through the Treasury and MOH therefore is included in the public expenditure component as it is already recorded in MOH expenditure reports.

Guide to Producing CH Subaccounts Annex 5 91
Annex 5: Methodology used in Bangladesh for estimating unit cost and utilization data
The Bangladesh Health Facility Efficiency Study of 1997 surveyed a nationally representative stratified sample of 122 Ministry of Health and Family Welfare (MOHFW) facilities. From the data collected service indicators and recurrent unit costs for outpatient and inpatient services in four kinds of facilities were estimated from the actual expenditures incurred in 1997. The four kinds of facilities were: thana health complexes (THCs, district and general hospitals (DG/GHs), medical college hospitals (MCHs) and specialized hospitals. For estimating average unit costs of services for inpatient and outpatient services the recurrent expenditures of each facility in 1997 by major line items, such as personnel, supplies, utilities and drugs were analyzed and allocated. All recurrent expenditures that were allocated to either inpatient or outpatient services using a step down procedure are presented in Table 5.5. Table 5.5: Allocation of recurrent cost/expenditures to inpatient and out patient services: Staff category Basis of estimation Doctors According to reported allocation of time between
outpatient and inpatient duties Nurses According to reported allocation of time between
outpatient and inpatient duties Pharmacists, medical technologists, storekeepers Prorated according to percentage volume of drugs used
by inpatient and outpatient services. Physiotherapists, occupational therapists 30% to inpatient (ratio estimated on the basis of direct
observation by NHA specialist) Pathologists 32% to inpatient (same as in case of physiotherapist
above) Radiology technician 48% to inpatient (ratio estimated as above) Rent controllers, ward masters, ward boys, laundry staff, cooks, stretcher boys.
100% to inpatient
Sweepers 75% to inpatient (ratio estimated by NHA specialist) Other staff Allocated as overhead cost using distribution of all other
salary expenditures Distribution of drug costs into inpatient and outpatient categories was based on an estimate of the value of drugs actually distributed from facilities’ stores. The information on allocation of drugs to inpatient wards and outpatients was acquired by examining the records kept at facilities’ pharmacies for a sample of months during 1997. Results of the survey are provided in Table 5.6 in the form of gross unit cost for inpatient and outpatient service.

92 Guide to Producing CH Subaccounts
Table 5.6: Unit Cost of Inpatient and Outpatient Service (in Taka)
Cost item Thana health complexes
District/general Hospitals
Medical college hospitals
Specialized hospitals
Gross cost of beds available per year
111,397 56,119 110,565 117,830
Gross cost per bed day occupied
521 188 277 441
Gross cost per admission 1957 843 3249 11,872 Gross cost per outpatient visit
66 55 102 283
Source: Table 8.14, The Bangladesh Facility efficiency study 1977 (Data International)
In short, the results showed that THCs were the most costly facilities for delivery of inpatient services and there were several possible explanations for the higher unit cost at the THCs. Overall, the ratio of administrative and other support staff to doctors and nurses were the highest at the THCs. The outpatient gross unit costs were found to be highest at the highest level facilities.

Guide to Producing CH Subaccounts Annex 6 93
Annex 6: Optional indicators on intervention-specific expenditures
Why assess intervention-specific expenditures? In addition to general indicators for child health, it may be important to look at specific interventions and/or packages that are of interest from a policy or programmatic perspective at country level. The optional indicators listed in table 7.1 are selected because of (i) their relevance for child health, and (ii) the feasibility to attain the relevant data from an NHA viewpoint. The tracking of intervention-specific indicators is consistent with the sub account guidelines for other programmatic areas; both the malaria subaccounts and the HIV expenditure tracking guidelines recommend package-specific indicators. 71 The purpose of presenting four key indicators here is to highlight the importance of addressing specific child health issues, and to present choices of indicators linked to the main disease burden for child health at global level. Individual countries will of course set their own priorities on what needs to be measured. For each subaccount study, there will be need to weigh the expected benefits of having an intervention-specific expenditure measure against the costs of getting the data, and to consider the potential reliability and validity of the information gathered. Due to difficulties involved with allocating joint health system resources towards child health, such as the time of multi-purpose health workers, commodity procurement expenditure is proposed as a proxy for some interventions, such as ITNs and vaccines. 1. Expenditure on Breastfeeding promotion This is defined as the % share of total child health expenditure devoted to promoting exclusive and continued breastfeeding. Policy and programmatic use: measures the weight of resources spent on promoting breastfeeding which is a key preventive child health intervention. Sources and methods: Most expenditures related to breastfeeding promotion will be targeted programmatic expenditures, classified as part of expenditures on public health and prevention. This will include activities such as support to Baby Friendly Hospitals and IEC activities to strengthen breastfeeding practices. The identification of specific expenditures on breastfeeding promotion can be done in discussions with representatives from government and NGOs undertaking such activities. 2. Expenditure on integrated management of sick children Most integrated management of sick children takes place at health center level. Therefore the measure proposed here is the expenditure on ambulatory care / outpatient curative care. This is one of the core
71 For example, for malaria there are minimum set indicators included for ITNs and malaria diagnosis (There are optional indicators for expenditure on treatment of severe malaria, and expanded set indicators for ACTs and outdated insecticides.

94 Guide to Producing CH Subaccounts
indicators for provider functions and therefore it will already have been calculated as one of the core indicators. 72 Policy and programmatic use: measures the weight of resources paid on curative care at the primary level. Studies have shown that integrated management of child hood illness (IMCI) is a cost-effective strategy to improve child health and to reduce under-five mortality. The expenditure level will depend on a number of factors, including the disease burden, the availability and coverage of primary level curative care for children, and the resources used to deliver such care. Sources and methods: This is one of the core indicators for provider functions and therefore it need not be recalculated here. 3. Expenditure on ITNs This is defined as the percentage share of expenditure devoted to providing ITNs to children, out of the total expenditure on child health. Policy and programmatic use: this indicator measures the weight of resources spent on preventive interventions for malaria. Its importance will depend upon the epidemiology of the country - whether malaria is a key issue or not. It will be important to assess this expenditure separately to highlight the relative spending on malaria compared to that of other interventions. In many countries, the malaria programme is well-funded due to external donor funds provided. Sources and methods: If a malaria subaccount has been undertaken or is being done at the same time as the child health subaccounts, then the child health team will need to work together with the malaria subaccounts team to identify the share of ITN expenditures that should be considered for child health. If there is no malaria subaccount available, the child health team should discuss with the national malaria programme regarding the procurement of nets, i.e. who are the main agencies procuring nets in the country? The main agencies can then be contacted to find out the total amount spent on ITNs. Allocation of ITN expenditures towards child health can be assessed by assuming that a ratio should be allocated to under-fives (e.g. 50%). Alternatively, the main implementers of ITN distribution can be contacted to discuss the share of ITNs that can be assumed to benefit children < 5 years old. 4. Expenditure on Immunizations This is defined as the percentage share of expenditure devoted to providing immunizations to children, out of the total expenditure on child health. Policy and programmatic use: measures the weight of resources spent on immunizations. 73 Sources and methods: The expenditure on immunization may be either those of the total immunization programme (commodities + programme costs, e.g. on staff and IEC) or those only on immunization commodities, depending on the data available and what makes sense from a policy perspective. In most countries, immunization is mainly undertaken by the government and activities are managed by an individual programme of MOH. It should therefore be feasible to identify separately the expenditures incurred by this programme. There may be need for some adjustment methods to adjust for vaccines that 72 If expenditures for outpatient curative care is presented separately for newborn (<28 days) and child (28 days < child < 5 years); i.e. if HC 1.3 is split into HC 1.3.1 and HC 1.3.2; then the measure may refer to HC 1.3.1. If the HC 1.3. is not split by age, then the measure may refer to total outpatient curative care as under HC 1.3.
73 Note that some immunizations are delivered to children aged under five with the primary objective to improve health of individuals as adults.

Guide to Producing CH Subaccounts Annex 6 95
are not provided to children under the age of five, such as tetanus toxoid. Note that delivery expenditures (i.e., staff time etc., at health facilities, delivering the actual intervention) would not be included under this indicator since it is very difficult to tease out the specific time spent by health facility staff on providing vaccines. Why assess expenditures by Geography (region)? From an equity perspective, it is relevant to compare differences on CH expenditures between regions, mainly for reasons of identifying inequities so that programming can be improved to better serve the population. Data on expenditures can also be compared with regional analysis of the source of funds, to assess the burden of financing child health activities. The proposed optional indicator to assess equity in financing for child health is the expenditure on CH per child under 5 by urban and rural population (in % and in absolute numbers). Note that the calculation of this indicator requires one or more surveys.


Guide to Producing CH Subaccounts Annex 7 97
Annex 7: Summary of key statistics for child health subaccounts in Malawi, 2002/03-2004/05
2002/03 2003/04 2004/05
General Indicators
THECH (US$) 27,746,819 26,350,178 35,851,664
THECH per children under 5 (US$) 12 11 15
THECH as a percentage of THE 16.8% 14.1% 15.5%
THECH as a percentage of GDP 1.6% 1.7% 1.9%
Financing Sources Indicators
Public funds on CH as a percentage of THECH 41% 28% 30%
Private funds on CH as a percentage of THECH 20% 23% 21%
o Total household expenditure as a percentage of THECH 14% 18% 15%
Rest of the world funds on CH as a percentage of THECH 39% 49% 49%
Financing Agents
Public sector expenditure on CH as a percentage of THECH 63% 58% 54%
Nonpublic sector expenditure on CH as a percentage of THECH 30% 32% 30%
o Private households’ out-of-pocket payment for CH as a percentage of THECH 14% 18% 14%
o Private households’ out-of-pocket payment for CH per children under 5 2.74 2.01 2.08
Rest of the World expenditure on CH as a percentage of THECH 7% 11% 16%
Providers
Public provider expenditure on CH as a percentage of THECH 53% 46% 49%
o Public hospital spending as a percentage of THECH 39% 25% 29%
o Public health center spending as a percentage of THECH 14% 21% 20%
Private provider expenditure on CH as a percentage of THECH 17% 27% 27%
Independent pharmacies/shops/dispensaries as a percentage of THECH 3% 4% 4%
Provision of prevention and public health programs as a percentage of THECH 27% 23% 20%
Functions
Services of curative care on CH as a percentage of THECH 58% 71% 68%
Medical goods dispensed to outpatients for CH as a percentage of THECH 3% 4% 8%
Services of rehabilitative care on CH as a percentage of THECH 5% 2% 4%

98 Guide to Producing CH Subaccounts
2002/03 2003/04 2004/05
Prevention and public health services for CH as a percentage of THECH 27% 23% 20%
Capital formation for CH as a percentage of THECH 6% 0% 1%

Guide to Producing CH Subaccounts Annex 8 99
Annex 8: Summary of key statistics for child health subaccounts in Ethiopia, 2004/05
General Indicators
THECH (US$) 101,095,158
THECH per children under 5 (US$) 7.86
THECH as a percentage of THE 19%
Financing Sources Indicators
Public funds on CH as a percentage of THECH 24%
Private funds on CH as a percentage of THECH (Household funds) 42% (40%)
Rest of the world funds on CH as a percentage of THECH 34%
Financing Agent Indicators
Ministry of Health funds on CH as a percentage of THECH 6%
Ministry of Education funds on CH as a percentage of THECH 6%
Regional Health Bureau funds on CH as a percentage of THECH 29%
Other Ministries funds on CH as a percentage of THECH 3%
Private insurance expenditure on CH as a percentage of THECH 1%
Private households’ out-of-pocket74 payment for CH as a percentage of THECH 40%
CH expenditure from local non-profit institutions serving households as a percentage of THECH 4%
CH expenditure from international non-profit institutions serving households as a percentage of THECH 11%
Provider Indicators
Public sector facilities’ expenditure on CH as a percentage of THECH
o Hospitals 18%
o PHCUs 20%
Private sector facilities’ expenditure on CH as a percentage of THECH
o Hospital 1%
o Clinics/PHCU 6%
o Pharmacies/Shops 31%
Provision and administration of public health programs for CH as a percentage of THECH 13%
CH expenditure for traditional practitioners as a percentage of THECH 1%
CH expenditure for providers of health-related functions as a percentage of THECH 3%
CH expenditure for other providers of health care as a percentage of THECH 7%
74 Out of pocket expenditure only includes direct payments to providers.

100 Guide to Producing CH Subaccounts
General Indicators
Functional Indicators
Services of curative care on CH as a percentage of THECH 28%
Medical goods dispensed to outpatients for CH as a percentage of THECH 31%
Prevention and public health services for CH as a percentage of THECH 20%
Capital formation for CH as a percentage of THECH 19%
Others 2%

Guide to Producing CH Subaccounts Annex 9 101
Annex 9: Summary of key statistics for child health subaccounts in Bangladesh (1999/2000) and Sri Lanka (2003)
Bangladesh 1999/2000 Sri Lanka 2003 Taka million Rupees million General Indicators TCHECH 8,769 2,469 TCHECH per children under 5 534.7 1,550.88 TCHECH as a percentage of TCHE 12.10% 3.90% Financing Sources Indicators Public funds (FS.1) on CH as a percentage of TCHECH n.a. n.a. Public funds (FS.1) on CH as a percentage of total public funds (FS.1) on health n.a. n.a. Private funds (FS.2) on CH as a percentage of TCHECH n.a. n.a. Rest of the world funds (FS.3) on CH as a percentage of TCHECH n.a. n.a. Financing Agent Indicators Public sector expenditure (HF.A) on CH as a percentage of TCHECH 35% 41% Nonpublic sector expenditure (HF.B) on CH as a percentage of TCHECH 65% 59% Private households’ out-of-pocket payment for CH (HF.2.3)
as a percentage of TCHECH 60% 50% as a percentage of nonpublic sector expenditure (HF.B) on CH 92% 85% per children under 5 321.46 776.38 as a percentage OOPS n.a. n.a.
CH expenditure from non-profit institutions serving households (HF.2.4)
as a percentage of TCHECH 5% 0.49% as a percentage of nonpublic sector expenditure (HF.B) on CH 8% 1%
CH expenditure from private nonparastatal firms and corporations (HF.2.5.2)
as a percentage of TCHECH n.a. 6% as a percentage of nonpublic sector expenditure (HF.B) on CH n.a. 10%
Provider Indicators Hospital expenditure on CH (HP.1) as a percentage of THECH 38% 28%
Public sector hospital expenditure on CH as a percentage of TCHECH n.a. n.a. Private sector hospital expenditure on CH as a percentage of TCHECH n.a. n.a.
Expenditure on CH from providers of ambulatory health care 11% 26%

102 Guide to Producing CH Subaccounts
Bangladesh 1999/2000 Sri Lanka 2003 Taka million Rupees million (HP.3) as a percentage of TCHECH
Expenditure on CH from providers of ambulatory health care in the public sector as a percentage of TCHECH n.a. n.a. Expenditure on CH from providers of ambulatory health care in the private sector as a percentage of TCHECH n.a. n.a.
Functional Indicators Services of curative care on CH (HC.1) as a percentage of TCHECH 37% 46%
Inpatient curative care on CH (HC.1.1) as a percentage of TCHECH 20% 21% Outpatient curative care on CH (HC.1.3) as a percentage of TCHECH 8% 25%
Medical goods dispensed to outpatients for CH (HC.5) as a percentage of TCHECH 48% 23% Prevention and public health services for CH (HC.6) as a percentage of TCHECH 8% 24% Health administration and health insurance for CH (HC.7) asa percentage of TCHECH 3% 2% Capital formation for CH (HC.R.1) as a percentage of TCHECH 1% n.a.