GUIDELINES FOR MULTIDISCIPLINARY …groundwaterportal.net/sites/default/files/Guidelines for... ·...
96
GUIDELINES FOR MULTIDISCIPLINARY ASSESSMENT OF TRANSBOUNDARY AQUIFERS International Hydrological Programme United Nations Educational, Scientific and Cultural Organization DRAFT VERSION SEPTEMBER 2015
Transcript of GUIDELINES FOR MULTIDISCIPLINARY …groundwaterportal.net/sites/default/files/Guidelines for... ·...
GUIDELINES FOR MULTIDISCIPLINARY ASSESSMENT OF
TRANSBOUNDARY AQUIFERS
International Hydrological Programme
United NationsEducational, Scientific and
Cultural Organization
DRAFT VERSIONSEPTEMBER 2015

Guidelines for Multidisciplinary Assessment of Transboundary Aquifers
Delft, September 2015
Draft Version

IGRACWestvest 72611AX Delft The Netherlands
T:+31 15 215 2325E: [email protected]: www.un-igrac.org
International Hydrological Programme
United NationsEducational, Scientific and
Cultural Organization
IGRAC is the UNESCO Global Groundwater Centre, it also works under the auspices of WMO, it is a corporate IAH partner and it is financially supported by the Government of the Netherlands.
The International Hydrological Programme (IHP) is the only intergovernmental programme of the UN system devoted to water research, water resources management, and education and capacity building.
Publication reference IGRAC and UNESCO-IHP. Guidelines for Multi-Disciplinary Assessment of Transboundary Aquifers - Draft version.IGRAC Publications, Delft 2015

1.
CONTENTS
SUMMARY 5 ACKNOWLEDGEMENT 7 1. INTRODUCTION 9
2. METHODOLOGY OVERVIEW 13
3. DATA COLLECTION 17 3.1 DATA COLLECTION PROCESS 17 3.2 DATA FORMAT 20
4. HARMONISATION & AGGREGATION 23
5. AQUIFER ASSESSMENT 27 5.1 GENERAL ASSESSMENT 27 5.2 INDICATOR-BASED ASSESSMENT 31 5.3 ASSESSMENT REPORT 34
6. DATA MANAGEMENT 39 6.1 THE TBA INFORMATION MANAGEMENT SYSTEM 40 6.2 DATA COLLECTION AND PROCESSING FOR THE TBA-IMS 40 6.3 THE GLOBAL GROUNDWATER INFORMATION SYSTEM (GGIS) 41
7. REFERENCES 45
APPENDIXES 1. DETAILED OVERVIEW OF DATA TO BE COLLECTED 47 2. INDICATORS 67 3. FORMULAS TO CALCULATE INDICATORS 79

2.
3.
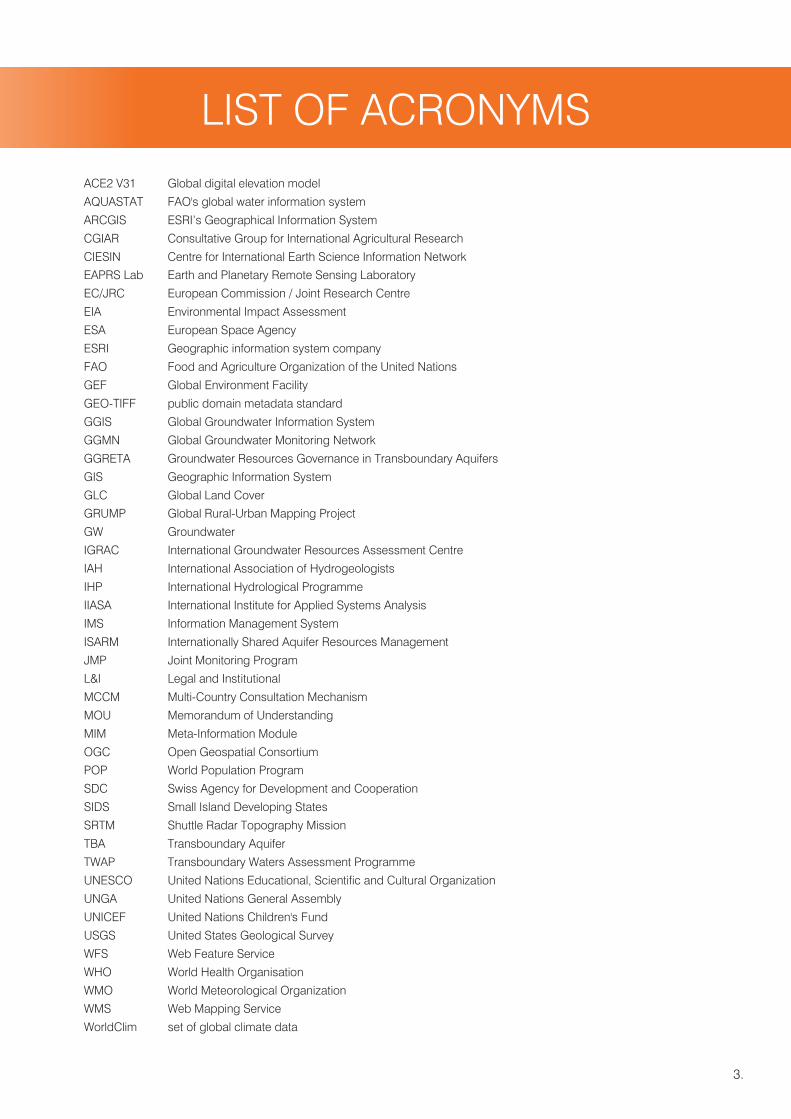
ACE2 V31 Global digital elevation model
AQUASTAT FAO's global water information system
ARCGIS ESRI’s Geographical Information System
CGIAR Consultative Group for International Agricultural Research
CIESIN Centre for International Earth Science Information Network
EAPRS Lab Earth and Planetary Remote Sensing Laboratory
EC/JRC European Commission / Joint Research Centre
EIA Environmental Impact Assessment
ESA European Space Agency
ESRI Geographic information system company
FAO Food and Agriculture Organization of the United Nations
GEF Global Environment Facility
GEO-TIFF public domain metadata standard
GGIS Global Groundwater Information System
GGMN Global Groundwater Monitoring Network
GGRETA Groundwater Resources Governance in Transboundary Aquifers
GIS Geographic Information System
GLC Global Land Cover
GRUMP Global Rural-Urban Mapping Project
GW Groundwater
IGRAC International Groundwater Resources Assessment Centre
IAH International Association of Hydrogeologists
IHP International Hydrological Programme
IIASA International Institute for Applied Systems Analysis
IMS Information Management System
ISARM Internationally Shared Aquifer Resources Management
JMP Joint Monitoring Program
L&I Legal and Institutional
MCCM Multi-Country Consultation Mechanism
MOU Memorandum of Understanding
MIM Meta-Information Module
OGC Open Geospatial Consortium
POP World Population Program
SDC Swiss Agency for Development and Cooperation
SIDS Small Island Developing States
SRTM Shuttle Radar Topography Mission
TBA Transboundary Aquifer
TWAP Transboundary Waters Assessment Programme
UNESCO United Nations Educational, Scientific and Cultural Organization
UNGA United Nations General Assembly
UNICEF United Nations Children's Fund
USGS United States Geological Survey
WFS Web Feature Service
WHO World Health Organisation
WMO World Meteorological Organization
WMS Web Mapping Service
WorldClim set of global climate data
LIST OF ACRONYMSLIST OF ACRONYMS

4.
5.
Transboundary aquifer or transboundary aquifer system means respectively, an aquifer or aquifer system, part of which are situated in different States. (UN ILC, 2008). The international aspect of a transboundary aquifer makes its management more complex than in a case of an aquifer located within the State borders. An informed and sustainable management of commonly shared aquifer asks for adequate knowledge of its characteristics, present state and trends. In order to acquire this knowledge, regular monitoring and assessment of the transboundary aquifer need to be performed. This document is an draft that aims at 1) presenting a methodology for multidisciplinary assessment of transboundary aquifers, and 2) providing guidelines for its implementation.
The methodology builds on the ISARM (Internationally Shared Aquifer Resources Management) programme led by UNESCO International Hydrological Programme (IHP) and the International Association of Hydrogeologists (IAH) since 2001 which is aimed at improving the understanding related to the governance and management of transboundary aquifers through a multidisciplinary approach. In the decade that followed, some aspects of shared groundwater resources (such as hydrogeological delineation and legal foundation for shared use and protection) received significant attention. Importance of others aspects (e.g. social, economic, environmental, etc.) has been recognized as well but not followed with a substantial elaboration. Implementation of the first phase of the Global Environment Facility (GEF) Transboundary Waters Assessment Programme (TWAP) project (completed in 2011) for which UNESCO-IHP was entrusted for the groundwater component, brought a substantial methodological development and created the main contours of the methodology for assessment of transboundary aquifers at the regional scale. In the following phase of the TWAP project (to be completed in 2015), the methodology has been further improved and applied in a global assessment of transboundary aquifers. The methodology developed for the regional/global assessment is indicator-based and uses aggregated values per aquifer, allowing comparative analysis and prioritizing according to risks and required interventions.
Further development of the TBA methodology took place in the still on-going Groundwater Resources Governance in Transboundary Aquifers (GGRETA) project funded by the Swiss Agency for Development and Cooperation (SDC). The methodology was elaborated for a detailed assessment at the transboundary aquifer level. This in-depth assessment takes in account spatial variability of aquifer characteristics and covers all relevant TBA aspects required for joint decision-making and TBA management.
These guidelines have been prepared to assist an in-depth assessment at the aquifer level. Nevertheless, they can also be used for the comparative, regional assessment by - among others- applying the aggregation procedure and paying additional attention to indicators. Regardless at which level the methodology is applied, it always includes data and information collection, processing and presentation. Due to differences in formats, standards, classifications and similar, harmonisation is the major processing activity. The outcomes of an assessment are visualized in maps, but also presented in tables, diagrams, pictures and references. A part of assessment where aquifer characteristics are interpreted through an extensive set of variable and parameter values can be seen as the general assessment. In the (subsequent) indicator based assessment, the outcomes of the general assessment are used as ingredients to form indicators; the indicators can provide easier understanding and comparison but also lead to additional insights in the state of TBAs.
In order to support the transboundary aquifer assessment and management, IGRAC has developed a web-based Information Management System (TBA-IMS). Practically, the system assists in data collection, storage, processing, visualisation and sharing of variety of data and information. The TBA-IMS is very interactive; it also has an extensive functionality for further analysis (such as map overlays and queries) and various authorization levels (e.g. assessment coordinator, national experts, public).
This document contains a draft version of the guidelines. Future updates will be made available via www.un-igrac.org. In meantime, comments and suggestions are very welcome via [email protected].
SUMMARY

6.
7.
The draft of the methodology guidelines presented in this document are the outcome of several initiatives, including the ISARM programme led by UNESCO and the International Association of Hydrogeologists (IAH) and the first phase of the TWAP project, funded by the Global Environment Facility (GEF). IGRAC and UNESCO-IHP are grateful to all experts involved in these initiatives who provided important input and/or feedback on the methodology for the multi-disciplinary assessment of transboundary aquifers. This methodology was also applied and further developed in two projects: The TWAP Groundwater component which is a comparative assessment of 199 transboundary aquifers worldwide; and the GGRETA project funded by the Swiss Agency for Development Cooperation (SDC), which entailed in-depth assessments of three transboundary aquifers. IGRAC and UNESCO-IHP are additionally grateful to the country and assessment coordinators and technical experts whose hard work and feedback further refined and informed this methodology.
ACKNOWLEDGEMENT
1.

9.
This document presents the draft of the methodology for the assessment of transboundary aquifers. The methodology aims to provide guidelines for conducting an aquifer assessment comprising collection, storage, processing and sharing of groundwater-related data and information. As such, the methodology covers various aspects relevant for management/governance of transboundary aquifers, including the state of the aquifer (in terms of groundwater quantity and quality) as well as the associated socio-economic, legal and institutional facets.
IGRAC and UNESCO-IHP have been involved for more than a decade in assessment of internationally shared aquifers and this methodology is a result of experience gained in various bilateral, regional and global assessment activities. The methodology builds on ISARM programme and its multidisciplinary approach to transboundary aquifer governance and management addressing hydrogeological, environmental, socio-economic and legal & institutional aspects. (UNESCO-IHP, 2001). This approach was gradually elaborated into a methodology for multi-disciplinary and detailed assessment of transboundary aquifers. By applying the methodology and encouraging cooperation amongst the countries sharing an aquifer, alternatives can be explored and a foundation for dialogue established for the collaborative management and governance of shared groundwater resources.
By applying this methodology the following objectives are pursued:
i. Improving the knowledge of transboundary groundwater resources and increasing recognition of their importance and vulnerability by carrying out detailed assessments with the full participation of national experts,
ii. Promoting and facilitating the exchange of information between the countries by establishing an information management systems (IMS) at Transboundary Aquifer (TBA) level,
iii. Supporting countries in establishing cross-border dialogue and cooperation at governmental level, including a diagnosis of transboundary concerns, and
iv. Increasing awareness of the UNGA Resolution on the Law of Transboundary Aquifers, as the basis for its implementation.
Comparative assessment vs. in-depth assessment: the assessment methodology can be applied both to transboundary aquifers at regional level and to a single transboundary aquifer. The regional assessment provides aggregated information on TBAs in the region that also results in a comparative analysis at that scale. The in-depth assessment focuses on a single transboundary aquifer, providing insight in spatial variability of important aquifer characteristics.
The methodology can be also applied at the regional/global level to provide a basic assessment and a comparative analysis among aquifers. This was done within the TWAP Groundwater (UNESCO-IHP, IGRAC, WWAP 2012). In this project, the methodology was applied to perform a comparative assessment of 199 transboundary aquifers where aquifers were described using 20 indicators that were calculated by combining various data. The advantages of this approach are that it provides new insights as well as a simple description of the groundwater resource.
The in-depth assessment methodology is currently being tested in the GGRETA project. The latter focuses on a single transboundary aquifer and is based on the TWAP Groundwater component indicator-based assessment methodology and provides additional aggregated information to indicators. Detailed assessments are conducted by teams of national experts in three selected case studies: the Trifinio Aquifer
INTRODUCTION1.
10. GUIDELINES FOR MULTIDISCIPLINARY TBA ASSESSMENT
Complex (El Salvador, Guatemala, Honduras); the Stampriet Transboundary Aquifer System (Botswana, Namibia, South Africa) and the Pretashkent aquifer (Kazakhstan, Uzbekistan).
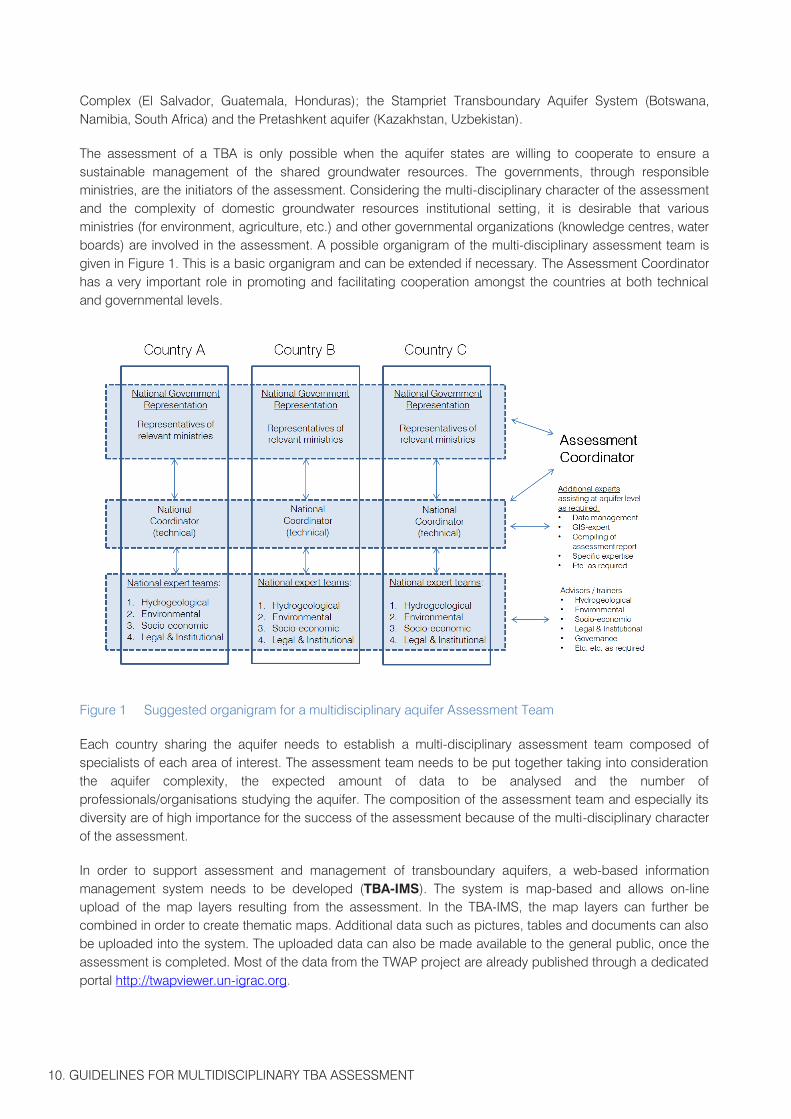
The assessment of a TBA is only possible when the aquifer states are willing to cooperate to ensure a sustainable management of the shared groundwater resources. The governments, through responsible ministries, are the initiators of the assessment. Considering the multi-disciplinary character of the assessment and the complexity of domestic groundwater resources institutional setting, it is desirable that various ministries (for environment, agriculture, etc.) and other governmental organizations (knowledge centres, water boards) are involved in the assessment. A possible organigram of the multi-disciplinary assessment team is given in Figure 1. This is a basic organigram and can be extended if necessary. The Assessment Coordinator has a very important role in promoting and facilitating cooperation amongst the countries at both technical and governmental levels.
Figure 1 Suggested organigram for a multidisciplinary aquifer Assessment Team
Each country sharing the aquifer needs to establish a multi-disciplinary assessment team composed of specialists of each area of interest. The assessment team needs to be put together taking into consideration the aquifer complexity, the expected amount of data to be analysed and the number of professionals/organisations studying the aquifer. The composition of the assessment team and especially its diversity are of high importance for the success of the assessment because of the multi-disciplinary character of the assessment.
In order to support assessment and management of transboundary aquifers, a web-based information management system needs to be developed (TBA-IMS). The system is map-based and allows on-line upload of the map layers resulting from the assessment. In the TBA-IMS, the map layers can further be combined in order to create thematic maps. Additional data such as pictures, tables and documents can also be uploaded into the system. The uploaded data can also be made available to the general public, once the assessment is completed. Most of the data from the TWAP project are already published through a dedicated portal http://twapviewer.un-igrac.org.

11.
This document provides the guidelines for in-depth assessment of a transboundary aquifer which is a detailed assessment at a TBA level. It gives an overview of data to be collected, the harmonisation and assessment procedures and of the information management system which support the whole process. The comparative assessment at the regional level follows the same methodology, only at less detailed level; practically, it means an assessment using a selection of the data (data priority # 1 from Table 2) and the ‘core’ indicators (from Table 6).
The presented methodology relies primarily on existing data. Depending on data availability and aquifer’s specifics, some modifications of suggested assessment data content and/or steps might be needed for a specific case. After all, these are suggested guidelines and certainly not an instruction manual.
Section 2 of the document gives a brief overview of the methodology. Section 3 describes in more detail the data needed for the assessment. Harmonisation of data is discussed in the section 4, while the section 5 presents elements of the actual assessment – general and indicator-based. Finally, the role of TBA-IMS and its basic functionality are presented in the section 6. Several appendixes to the document contain additional info about the assessment methodology.
This document contains a draft version of the guidelines. Future updates will be made available via www.un-igrac.org. In meantime, comments and suggestions are very welcome via [email protected]. Comments received before 15 December 2015 can be included in the final version – planed to be published in the first quarter of 2016.
2.
13.
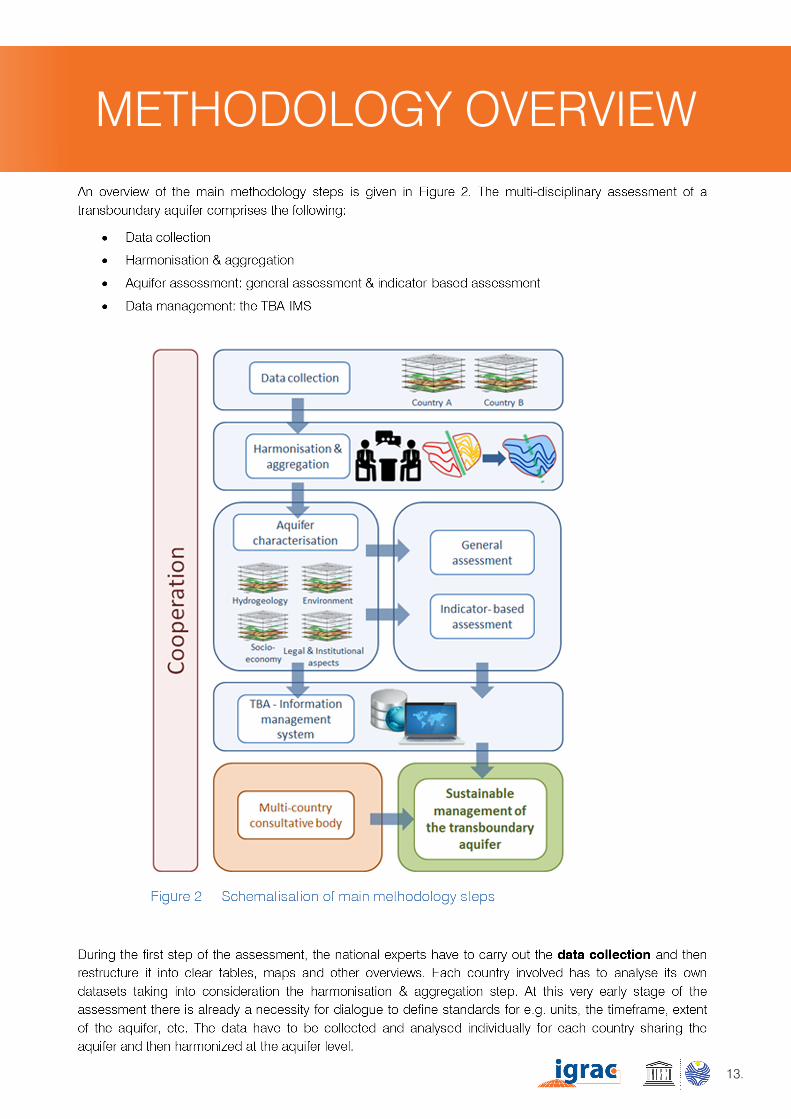
METHODOLOGY OVERVIEW2.

14. GUIDELINES FOR MULTIDISCIPLINARY TBA ASSESSMENT
Harmonisation (and aggregation, in a case of regional assessment) of the data takes place firstly at the country-segment level. The datasets need to meet the standards agreed in advance: the level of detail, the period of time and frequency of measurement, units, etc. If no data are available at the country-segment level, an expert judgement can applied but with a clear record of it. Harmonisation of data at the country-segment level is followed by the harmonisation at the aquifer level.
After these two methodology steps have been carried out, the actual assessment - general assessment and indicator-based assessment - can take place. A part of assessment where aquifer characteristics are interpreted through an extensive set of variables and parameters values can be seen as the general assessment. In the (subsequent) indicator based assessment, the outcomes of the general assessment are used as ingredients to form the indicators; indicators can provide easier understanding and comparison but also lead to additional insights in the state of TBAs.
The aim of applying of this methodology is to assess the current state of the resource, to identify current and potential transboundary issues and explore possibilities to common groundwater management. The outcomes of the assessment need to be easily understood and used by decision makers and even general public. This means that some effort needs to be put into producing an assessment report containing a clear and non-technical message, using thematic maps, tables and other graphical features accompanied with short explanations.
Thematic maps can be prepared in the Transboundary Aquifer Information Management System (TBA-IMS) where all the map layers are stored. TBA-IMS is used during the whole assessment process, starting from data collection to dissemination of results. It is also possible to store all kind of data in TBA-IMS. Hence, it is advisebal to do not store raw data; the focus is on interpreted maps and results, easily understandable by policy makers and the public. The TBA-IMS does not intend to be a supra-national hydrogeological information system.
Table 1 summarizes the overall goals of the assessment, the outcomes and outputs. In parallel with the assessment of the resource, a collaboration mechanism needs to be put in place to ensure necessary contributions to the assessment as well as implementation of the outcomes, once the assessment is completed.
Table 1 Assessment goals and outcomes
Overall Goal Outcomes Outputs
(i) Comparative assessment
Assess transboundary aquifers at regional level, allowing comparative analysis and prioritizing according to risks and required interventions in order to improve cooperation, prevent or mitigate problems and increase overall benefit from shared water resources
(ii) In-depth assessment at TBA level
Assess a transboundary aquifer in depth in order to improve cooperation, prevent or mitigate problems and increase overall benefit from shared water resources
1. States sharing the aquifer(s) recognize the transboundary nature and importance of the resource, and agree to assess its current state and trends in order to define priority actions.
2. States sharing aquifer(s) agree to cooperate and implement priority actions for the protection and equitable utilization of the aquifers.
Assessment of the current conditions of the aquifer(s), including a diagnostic of transboundary concerns, conducted with the full participation of national experts.
A Mulit-Country Consultation Mechanism (MCCM) established by aquifer states that meets regularly during the assessment.


3.

17.
DATA COLLECTION3.
18. GUIDELINES FOR MULTIDISCIPLINARY TBA ASSESSMENT
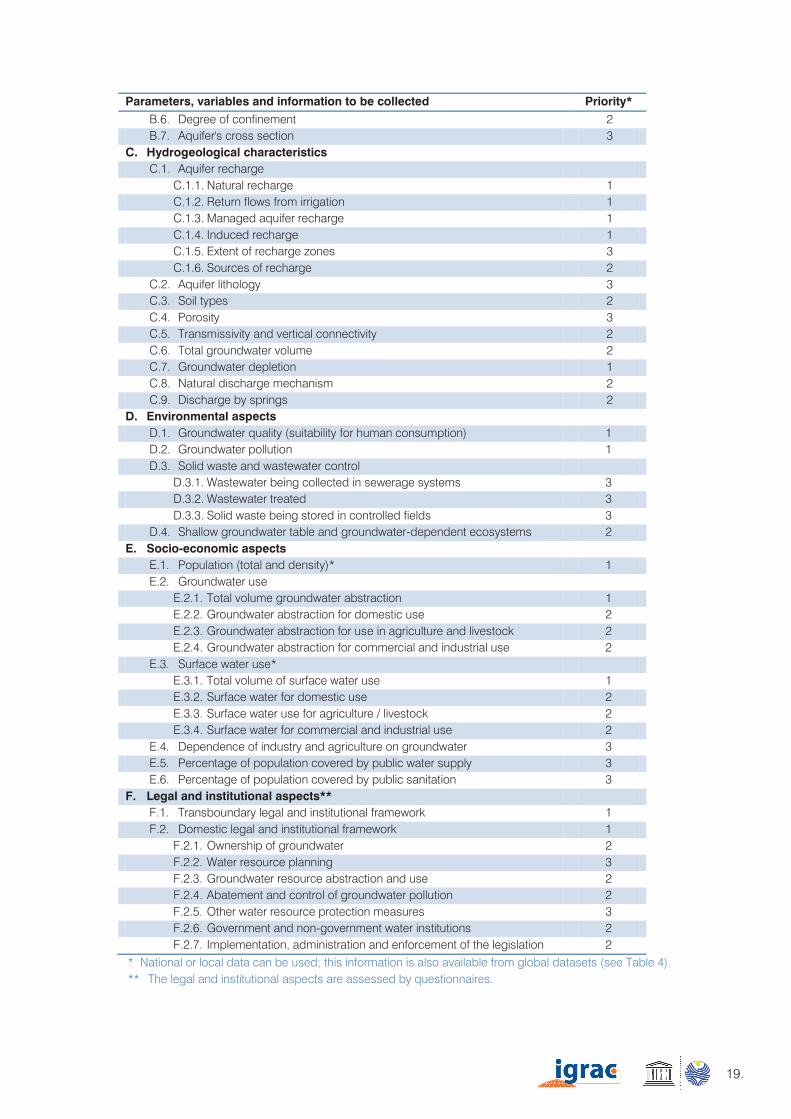
19.
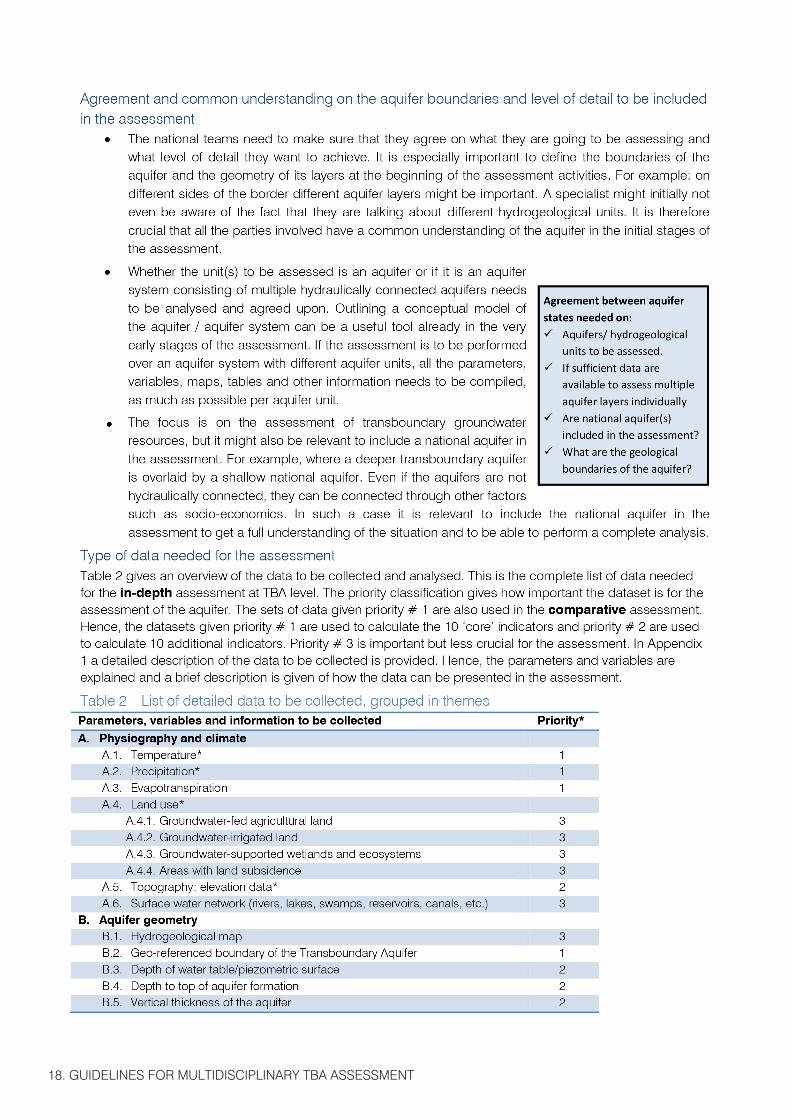
Parameters, variables and information to be collected Priority* B.6. Degree of confinement 2 B.7. Aquifer's cross section 3
C. Hydrogeological characteristics C.1. Aquifer recharge
C.1.1. Natural recharge 1 C.1.2. Return flows from irrigation 1 C.1.3. Managed aquifer recharge 1 C.1.4. Induced recharge 1 C.1.5. Extent of recharge zones 3 C.1.6. Sources of recharge 2
C.2. Aquifer lithology 3 C.3. Soil types 2 C.4. Porosity 3 C.5. Transmissivity and vertical connectivity 2 C.6. Total groundwater volume 2 C.7. Groundwater depletion 1 C.8. Natural discharge mechanism 2 C.9. Discharge by springs 2
D. Environmental aspects D.1. Groundwater quality (suitability for human consumption) 1 D.2. Groundwater pollution 1 D.3. Solid waste and wastewater control
D.3.1. Wastewater being collected in sewerage systems 3 D.3.2. Wastewater treated 3 D.3.3. Solid waste being stored in controlled fields 3
D.4. Shallow groundwater table and groundwater-dependent ecosystems 2 E. Socio-economic aspects
E.1. Population (total and density)* 1 E.2. Groundwater use
E.2.1. Total volume groundwater abstraction 1 E.2.2. Groundwater abstraction for domestic use 2 E.2.3. Groundwater abstraction for use in agriculture and livestock 2 E.2.4. Groundwater abstraction for commercial and industrial use 2
E.3. Surface water use* E.3.1. Total volume of surface water use 1 E.3.2. Surface water for domestic use 2 E.3.3. Surface water use for agriculture / livestock 2 E.3.4. Surface water for commercial and industrial use 2
E.4. Dependence of industry and agriculture on groundwater 3 E.5. Percentage of population covered by public water supply 3 E.6. Percentage of population covered by public sanitation 3
F. Legal and institutional aspects** F.1. Transboundary legal and institutional framework 1 F.2. Domestic legal and institutional framework 1
F.2.1. Ownership of groundwater 2 F.2.2. Water resource planning 3 F.2.3. Groundwater resource abstraction and use 2 F.2.4. Abatement and control of groundwater pollution 2 F.2.5. Other water resource protection measures 3 F.2.6. Government and non-government water institutions 2 F.2.7. Implementation, administration and enforcement of the legislation 2
* National or local data can be used; this information is also available from global datasets (see Table 4). ** The legal and institutional aspects are assessed by questionnaires.
20. GUIDELINES FOR MULTIDISCIPLINARY TBA ASSESSMENT
In this guideline the terms ‘map layers’ and ‘thematic maps’ are related to products of the assessment. A map layer is a file prepared with GIS tools that contain only one geo-referenced feature, which could be a polygon, line or point feature. A thematic map is the combination of map layers prepared to better interpret or understand a variable or parameter.
3.2 DATA FORMAT
The preferred data format depends on factors such as the type of data and the amount of data available. For example: for data that are time dependent it is necessary to structure these into tables (e.g. in Microsoft Excel) and to visualise them in time-series graphs. In addition, the national experts also have to make decisions on the interval in which the data has to be extracted and, if there are different units, to decide which one would be best used in the assessment. Data that have a spatial variability are preferably shown in maps. Maps often give a quicker impression of the situation than tables or text descriptions. They can also be as detailed as possible and show differences per country, regions and sub-regions, etc. Appendix 1 gives the suggested data formats for each of the parameters and variables to be collected. Below are some general explanations of the various formats.
I. Geo-referenced information and thematic maps
Spatial information on location and/or the spatial distribution of relevant data is required for the assessment. Relevant information needs to become available in digital form. This means that existing paper maps may need to be digitized. Often is information only available at the national level. In order to make it possible to create maps for the whole transboundary aquifers, the aquifer states need to agree on the map format (i.e. coordinate system, projection, scale).
Map scale: it is difficult to give a preferred scale for thematic maps without knowing the level of detail in which data is available. One very practical criterion is choosing a map scale that allows maps to be printed on A3 format for easy reproduction and inclusion in reports.
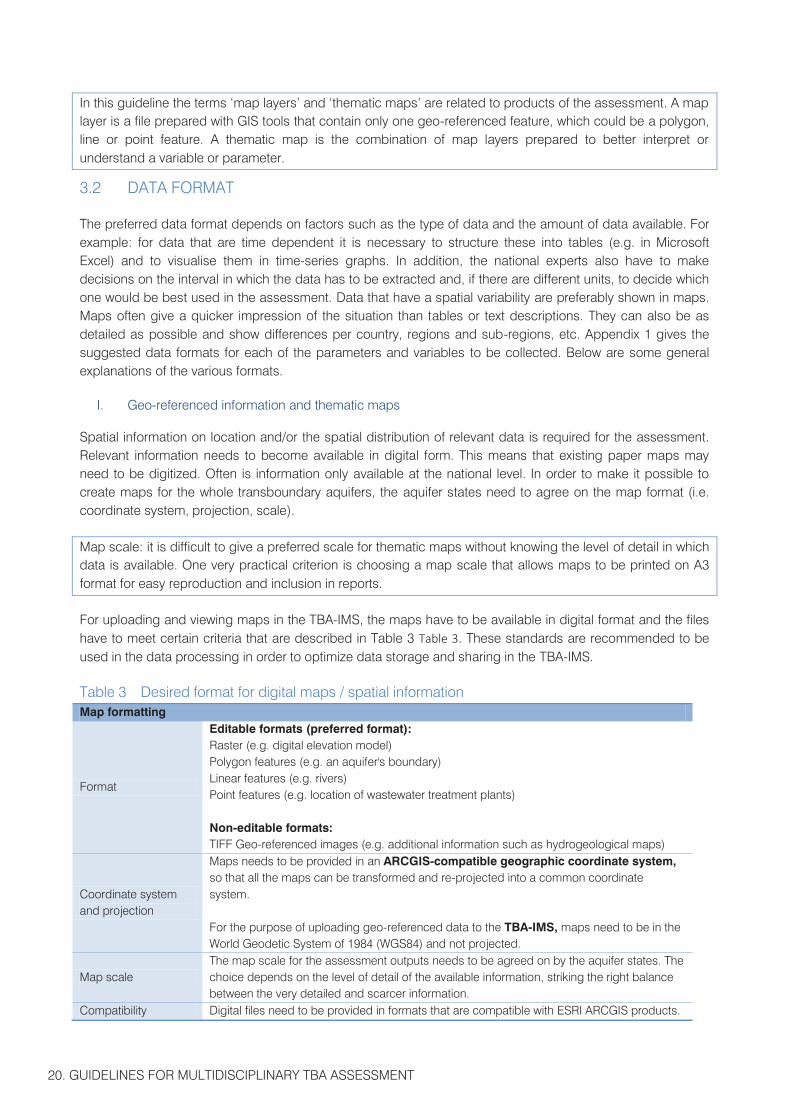
For uploading and viewing maps in the TBA-IMS, the maps have to be available in digital format and the files have to meet certain criteria that are described in Table 3 Table 3. These standards are recommended to be used in the data processing in order to optimize data storage and sharing in the TBA-IMS.
Table 3 Desired format for digital maps / spatial information Map formatting
Format
Editable formats (preferred format): Raster (e.g. digital elevation model) Polygon features (e.g. an aquifer's boundary) Linear features (e.g. rivers) Point features (e.g. location of wastewater treatment plants) Non-editable formats: TIFF Geo-referenced images (e.g. additional information such as hydrogeological maps)
Coordinate system and projection
Maps needs to be provided in an ARCGIS-compatible geographic coordinate system, so that all the maps can be transformed and re-projected into a common coordinate system. For the purpose of uploading geo-referenced data to the TBA-IMS, maps need to be in the World Geodetic System of 1984 (WGS84) and not projected.
Map scale The map scale for the assessment outputs needs to be agreed on by the aquifer states. The choice depends on the level of detail of the available information, striking the right balance between the very detailed and scarcer information.
Compatibility Digital files need to be provided in formats that are compatible with ESRI ARCGIS products.
21.
II. Tabular information
For tabular data, especially those constructed as time series, aquifer states need ideally to agree on a time period and interval for which data is used to calculate averages / statistics and to construct maps. Which time period is the most suitable mostly depends on the data availability from the different countries (choose the most recent time period for which all the countries have data). For the statistical calculations (average, minimum, maximum) it is important to use the same period of time for every state.
Examples of time-dependent variables are:
Groundwater-level monitoring
Groundwater depletion
Discharge by springs
Groundwater abstraction
Temperature
Precipitation
III. Text
For the characterization of the aquifer and reporting purposes, the information and data provided need to be put in text format. However, to achieve the assessment as proposed by this methodology, the assessment team needs to focus on the procurement of quantitative and systematic data in the form of maps, tables, time series or cross sections. Therefore, descriptive information needs to be concise with references to the original sources of information.
IV. Additional information from global datasets
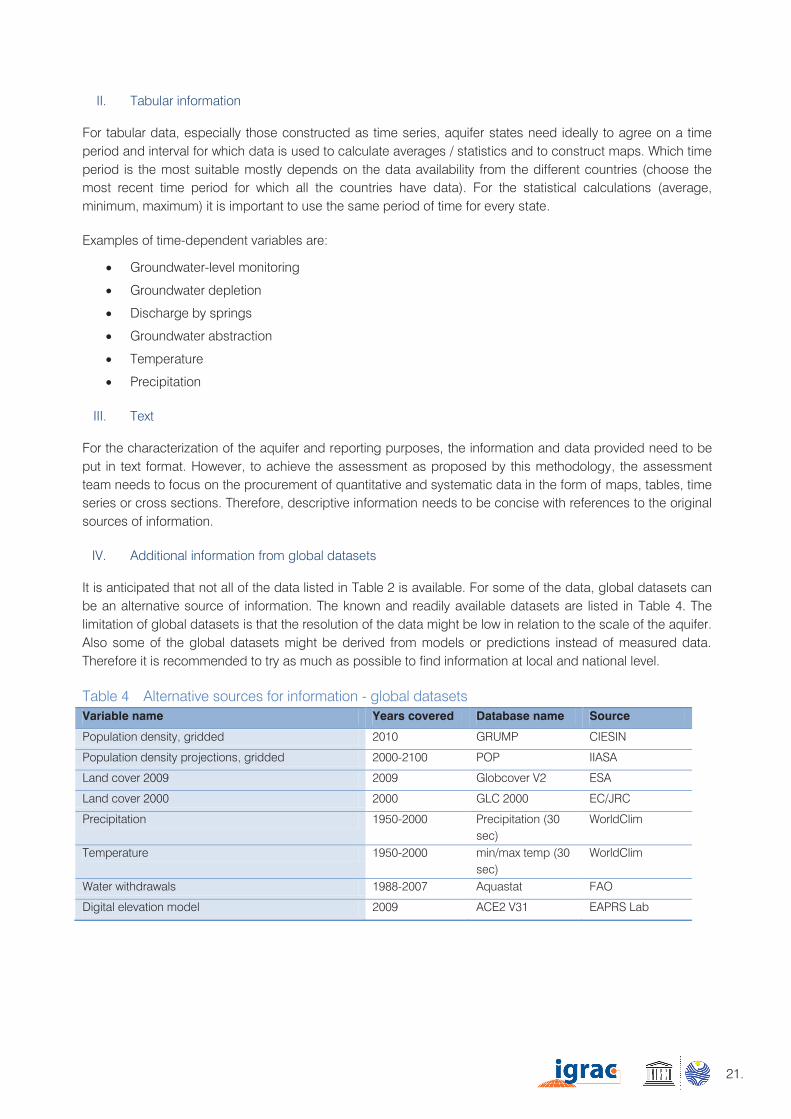
It is anticipated that not all of the data listed in Table 2 is available. For some of the data, global datasets can be an alternative source of information. The known and readily available datasets are listed in Table 4. The limitation of global datasets is that the resolution of the data might be low in relation to the scale of the aquifer. Also some of the global datasets might be derived from models or predictions instead of measured data. Therefore it is recommended to try as much as possible to find information at local and national level.
Table 4 Alternative sources for information - global datasets Variable name Years covered Database name Source
Population density, gridded 2010 GRUMP CIESIN
Population density projections, gridded 2000-2100 POP IIASA
Land cover 2009 2009 Globcover V2 ESA
Land cover 2000 2000 GLC 2000 EC/JRC
Precipitation 1950-2000 Precipitation (30 sec)
WorldClim
Temperature 1950-2000 min/max temp (30 sec)
WorldClim
Water withdrawals 1988-2007 Aquastat FAO
Digital elevation model 2009 ACE2 V31 EAPRS Lab
4.
23.
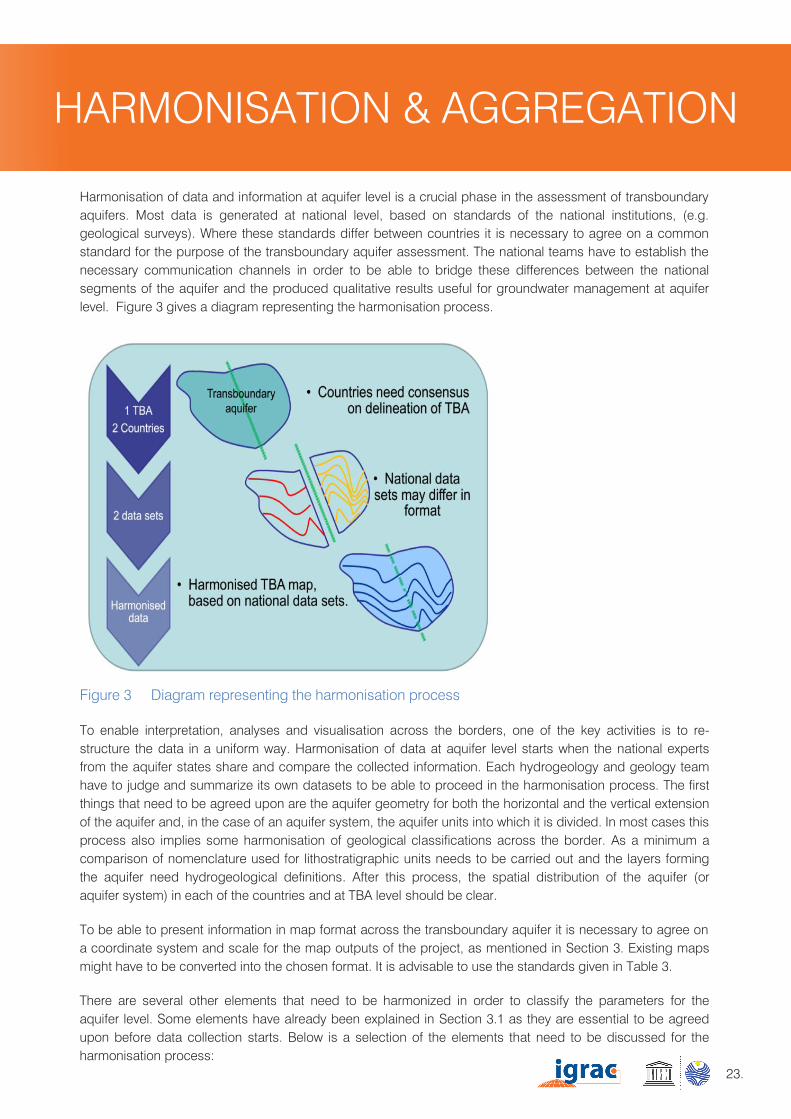
Harmonisation of data and information at aquifer level is a crucial phase in the assessment of transboundary aquifers. Most data is generated at national level, based on standards of the national institutions, (e.g. geological surveys). Where these standards differ between countries it is necessary to agree on a common standard for the purpose of the transboundary aquifer assessment. The national teams have to establish the necessary communication channels in order to be able to bridge these differences between the national segments of the aquifer and the produced qualitative results useful for groundwater management at aquifer level. Figure 3 gives a diagram representing the harmonisation process.
Figure 3 Diagram representing the harmonisation process
To enable interpretation, analyses and visualisation across the borders, one of the key activities is to re-structure the data in a uniform way. Harmonisation of data at aquifer level starts when the national experts from the aquifer states share and compare the collected information. Each hydrogeology and geology team have to judge and summarize its own datasets to be able to proceed in the harmonisation process. The first things that need to be agreed upon are the aquifer geometry for both the horizontal and the vertical extension of the aquifer and, in the case of an aquifer system, the aquifer units into which it is divided. In most cases this process also implies some harmonisation of geological classifications across the border. As a minimum a comparison of nomenclature used for lithostratigraphic units needs to be carried out and the layers forming the aquifer need hydrogeological definitions. After this process, the spatial distribution of the aquifer (or aquifer system) in each of the countries and at TBA level should be clear.
To be able to present information in map format across the transboundary aquifer it is necessary to agree on a coordinate system and scale for the map outputs of the project, as mentioned in Section 3. Existing maps might have to be converted into the chosen format. It is advisable to use the standards given in Table 3.
There are several other elements that need to be harmonized in order to classify the parameters for the aquifer level. Some elements have already been explained in Section 3.1 as they are essential to be agreed upon before data collection starts. Below is a selection of the elements that need to be discussed for the harmonisation process:
4. HARMONISATION & AGGREGATION
24. GUIDELINES FOR MULTIDISCIPLINARY TBA ASSESSMENT
Harmonisation of classifications, such as land use classifications, hydrogeological formations, lithology classifications, types of water use, etc. For example: in the methodology it is suggested that all the different types of surface water use are grouped into three main categories: 1) domestic water use, 2) agricultural / livestock watering and 3) industrial and other commercial use (see table 2 ), socio-economic aspect E3). It is important for the aquifer states to agree what types of water use fall under which category. For example, to agree that groundwater used as a source for bottled water is part of 3) industrial and commercial use and not 1) domestic water use.
Harmonisation of standards used to make a judgement. For example, to classify groundwater quality, in order to determine if the water is suitable for human consumption. The countries involved might use a different set of analyses and also different thresholds of concentrations to judge if water is suitable for human consumption. When producing maps of interpreted data such as a map on ‘suitability for drinking water supply’ it is prudent that countries use the same sets of data and thresholds. If this is not feasible then what criteria are used in each country should be clearly described.
Harmonisation of statistical and interpolation techniques: to harmonize data for analyses and presentation purposes it is necessary to summarize, aggregate or interpolate the original data. It is necessary for the national experts to discuss this and agree how it can be done. Typical operation areas:
i. Summation or aggregation: summation of variables to produce aggregated values for a certain geographic area; abstraction data might be available per groundwater well / borehole and for different time periods. In order to summarize and visualize this information it may be useful to aggregate information per municipality.
ii. Average over time: For time-dependent data historical records for different time periods and with different sampling intervals may be available. When reporting average values, this needs to be discussed and an agreement reached on which time period the average is calculated.
iii. Spatial interpolation: Data from point measurements, such as precipitation or groundwater levels, need to be interpolated to create maps for the whole aquifer. Interpolation techniques are for example 'Inverse Distance Weighted' or 'Kriging'. The national experts from each aquifer state should agree on which interpolation technique is to be used for each relevant data type.
Harmonisation of intervals between the isolines on maps, such as spatially interpolated values of temperature or precipitation, contour lines, spatial distribution of recharge values, porosity, transmissivity or population density.
Harmonisation of time series periods and intervals; data from groundwater monitoring wells, precipitation, temperature, and groundwater abstraction need to be harmonized both in the period length chosen for the data analyses and the time interval. Which time period is the most suitable depends largely on the data availability in the different countries (choose the most recent time period for which all countries have most data).
The suggestions given above on harmonisation are neither conclusive nor complete. Regular and open communication between national experts is the key to successful harmonisation. Aggregating data at aquifer level is not advised. When none of the aquifer states have any collected data for a certain parameter, some considerations need to be made on not including that parameter in the assessment.
Elements of data harmonisation:
Aquifer's geometry Coordinate system and scale for maps Interpolation techniques Harmonisation of classifications Aquifer's conceptual model
Main outputs at the end of this phase:
Harmonised set of maps for the aquifer Harmonised datasets Data needed for the calculation of
indicators

5.

27.
AQUIFER ASSESSMENT
5.1 GENERAL ASSESSMENT
The general assessment takes place when all the raw data is interpreted to characterize the aquifer in all aspects – hydrogeological, environmental, socio-economic and legal & institutional. The outcomes of this kind of assessment are map layers describing the system expressed in parameters, regimes and variables. The previous sections described which type of data has to be collected and how these data can be harmonised. These steps should result in clearly structured and harmonised datasets preferably in the form of maps and tables that can be seen as preparatory work for the actual assessment. Sometimes, depending of the kind of data, source and geographical distribution, it is not possible to prepare map layers or tables, but only a short text summarizing the current situation which can be used in the assessment report. Other sets of data, such as GEO-TIFFs, could also be used for the assessment, but they are rather complicated to be harmonised at TBA level. However such data are still very useful when they cover all the aquifer states.
The general assessment generates the basic characterization necessary to understand and explain the aquifer dynamics. This can be done by describing the dynamics and relationships in the assessment report but will have an extra dimension if translated into graphic representations: thematic maps, cross sections, 3D diagrams describing the conceptual model, graphics, charts, tables, etc. These are powerful features in the communication with the decision makers and the general public as they have already been interpreted and made easier in order to understand the impact of various processes on the groundwater quantity and quality.
Thematic maps
The thematic maps are going to be generated for the aspects of the aquifer grouped in themes A to E (see Table 2). If enough detailed information is available and national experts also succeed in harmonizing the data at aquifer level, map layers can be made for several of these datasets. By combining the map layers, thematic maps can be created, which should be clear and simple enough to be informative for decision makers and the general public.
The legal and institutional aspects (theme F) are mostly not suitable to be expressed in graphical features. They are used for the calculation of the indicators and are tackled later in this section. In Table 1 an overview is given of the possible aspects of the aquifers that can be presented as thematic maps and/or map layers.
Visualisations of the transboundary aquifer
Thematic maps 2D cross sections 3D representation of the
conceptual model Diagrams Graphics Charts Tables
28. GUIDELINES FOR MULTIDISCIPLINARY TBA ASSESSMENT
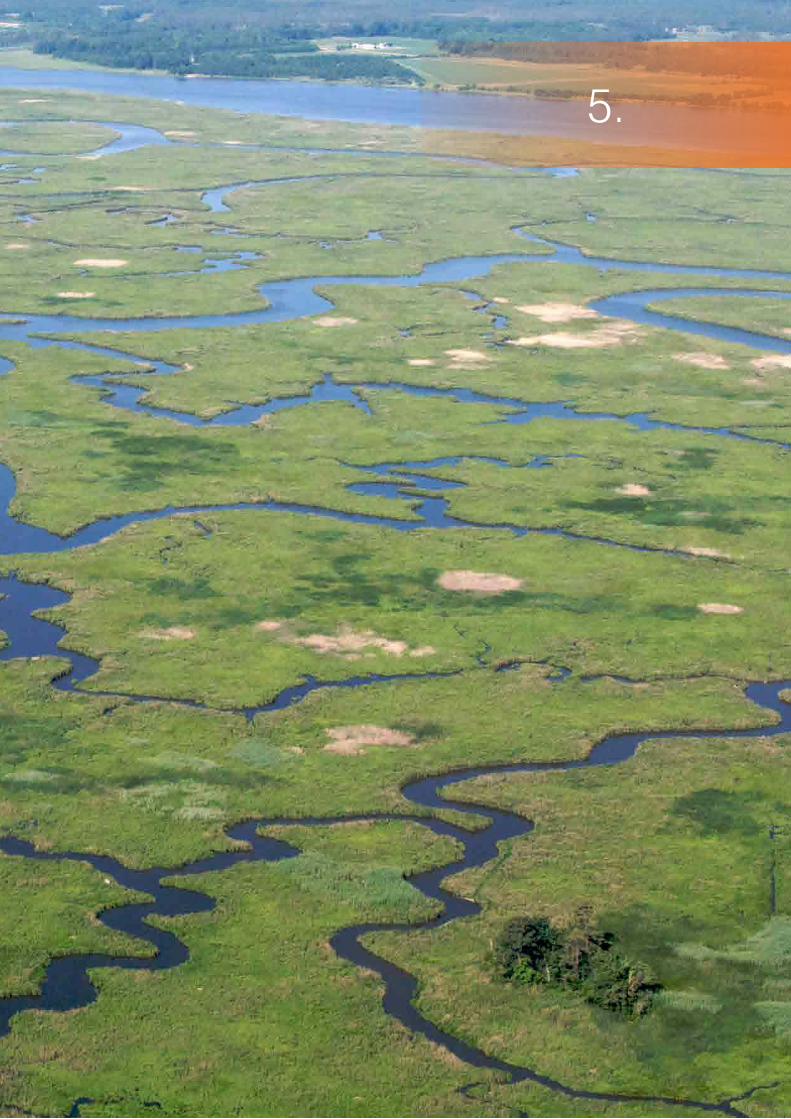
Note that not all data can be presented as map layers. The description of the data and the expected data format is given in Appendix 1.
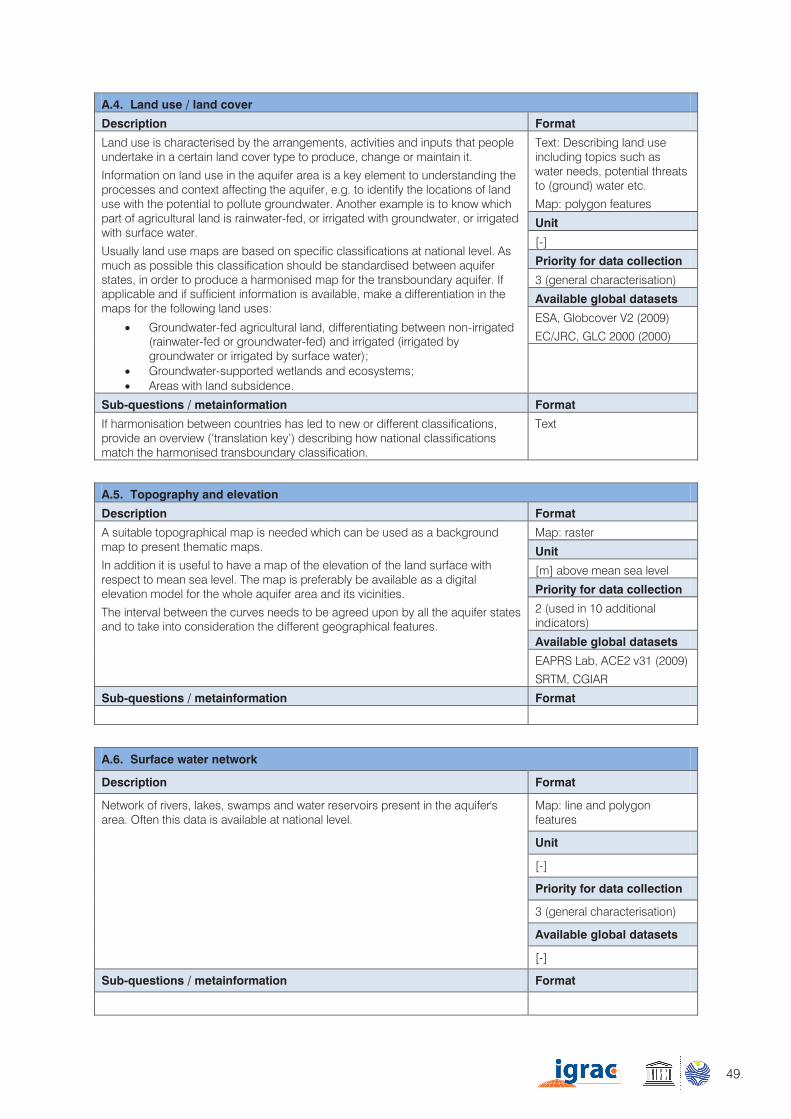
Table 1 Overview of potential map layers and thematic maps to be generated A. Physiography and climate
A.1. Temperature A.2. Precipitation A.3. Evapotranspiration A.4. Land use A.5. Topography: elevation data A.6. Surface water network
B. Aquifer geometry B.1. Hydrogeological map B.2. Geo-referenced boundary of the Transboundary Aquifer B.3. Depth of water table/piezometric surface B.4. Depth to top of aquifer formation B.5. Vertical thickness of the aquifer B.6. Degree of confinement
C. Hydrogeological characteristics C.1. Aquifer recharge C.2. Aquifer lithology C.3. Soil types C.4. Porosity C.5. Transmissivity and vertical connectivity
C.7. Groundwater depletion C.9. Discharge by springs D. Environmental aspects
D.1. Groundwater quality (suitability for human consumption) D.2. Groundwater pollution D.3. Solid waste and wastewater control D.4. Shallow groundwater table and groundwater-dependent ecosystems
E. Socio-economic aspects E.1. Population (total and density) E.2. Groundwater use E.3. Surface water use
E.5. Percentage of population covered by public water supply E.6. Percentage of population covered by public sanitation
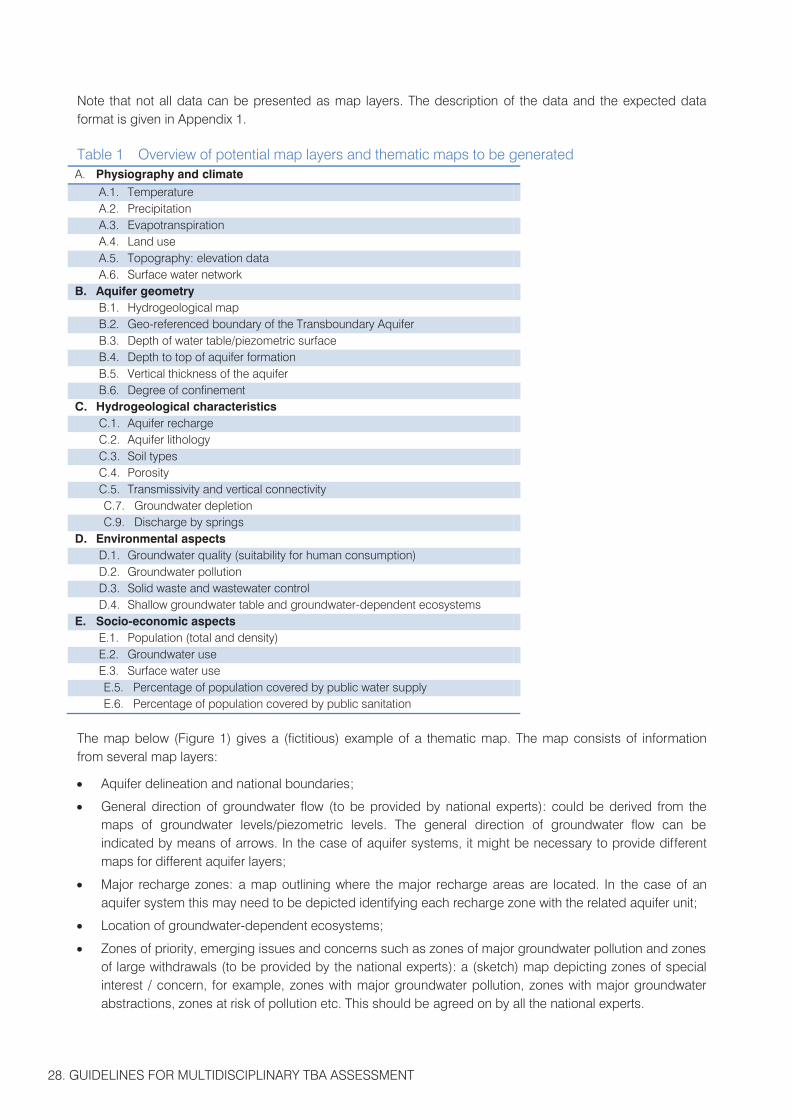
The map below (Figure 1) gives a (fictitious) example of a thematic map. The map consists of information from several map layers:
Aquifer delineation and national boundaries;
General direction of groundwater flow (to be provided by national experts): could be derived from the maps of groundwater levels/piezometric levels. The general direction of groundwater flow can be indicated by means of arrows. In the case of aquifer systems, it might be necessary to provide different maps for different aquifer layers;
Major recharge zones: a map outlining where the major recharge areas are located. In the case of an aquifer system this may need to be depicted identifying each recharge zone with the related aquifer unit;
Location of groundwater-dependent ecosystems;
Zones of priority, emerging issues and concerns such as zones of major groundwater pollution and zones of large withdrawals (to be provided by the national experts): a (sketch) map depicting zones of special interest / concern, for example, zones with major groundwater pollution, zones with major groundwater abstractions, zones at risk of pollution etc. This should be agreed on by all the national experts.
29.
It is possible to combine all kinds of map layers stored in a geo-referenced database such as TBA-IMS into a map to visualize a certain parameter or issue in the aquifer region. Also, analyses of the available data can be made by combining map layers with demographic data, e.g. population density x groundwater use. More understanding on the possibilities and advantages of the TBA-IMS is given in Section 6.
Figure 1 Fictitious example of a thematic map of a complete Transboundary Aquifer
Cross sections
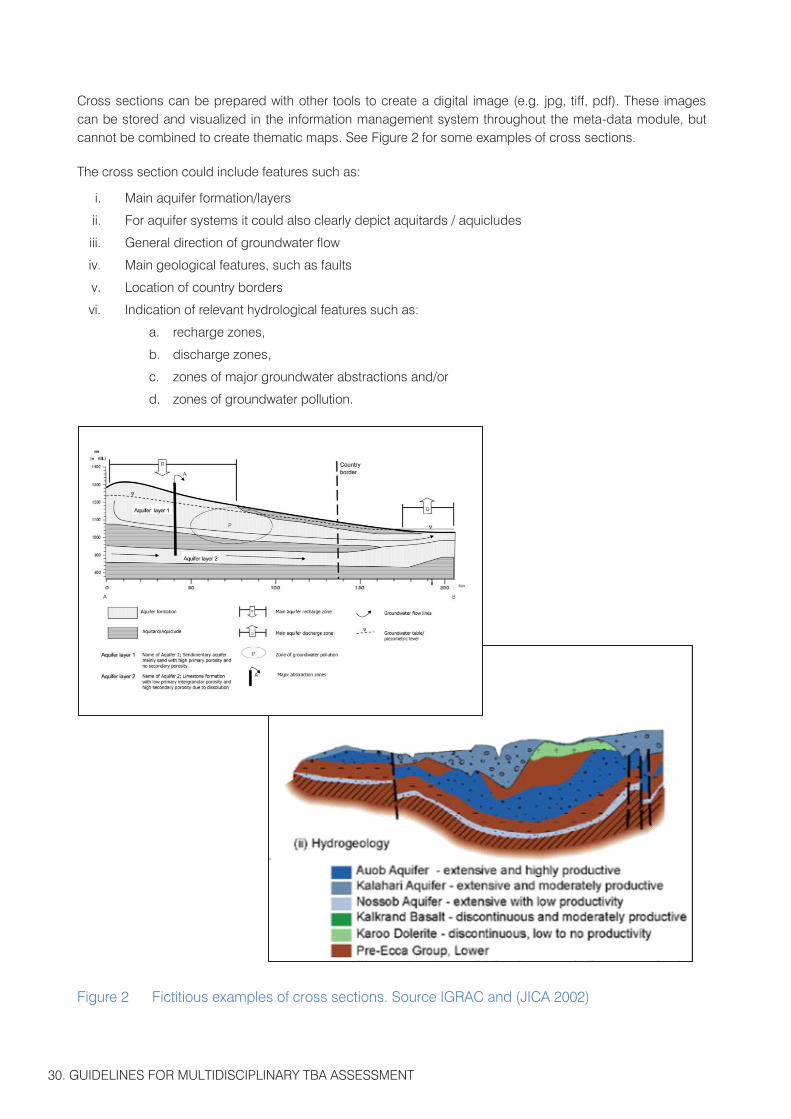
Cross sections are powerful tools (2D) used to visualize sub-surface structures and conceptual models of aquifers. Cross sections can show crucial aquifer features such as the relation between aquifer layers in aquifer systems, the depth to the aquifer or vertical flow patterns that can allow us to better understand for example possible movement of pollutants (time spans and pathways). Therefore, for the purpose of improving groundwater management and governance, focus should be on the conceptual links between the aquifer element and processes influencing groundwater quality and quantity (i.e. a diagram showing the relations between recharge areas, polluted areas, abstraction points, etc.). It is also possible to use cross sections to give an overview of the hydrogeology of the aquifer, with detailed descriptions of each aquifer layer and hydrogeological features. In addition it is possible in the legend to give the name of each aquifer layer, including the lithological classification and predominant type of porosity zones with natural salinity, and other characteristics.
30. GUIDELINES FOR MULTIDISCIPLINARY TBA ASSESSMENT
Cross sections can be prepared with other tools to create a digital image (e.g. jpg, tiff, pdf). These images can be stored and visualized in the information management system throughout the meta-data module, but cannot be combined to create thematic maps. See Figure 2 for some examples of cross sections.
The cross section could include features such as:
i. Main aquifer formation/layers
ii. For aquifer systems it could also clearly depict aquitards / aquicludes
iii. General direction of groundwater flow
iv. Main geological features, such as faults
v. Location of country borders
vi. Indication of relevant hydrological features such as:
a. recharge zones,
b. discharge zones,
c. zones of major groundwater abstractions and/or
d. zones of groundwater pollution.
Figure 2 Fictitious examples of cross sections. Source IGRAC and (JICA 2002)
31.
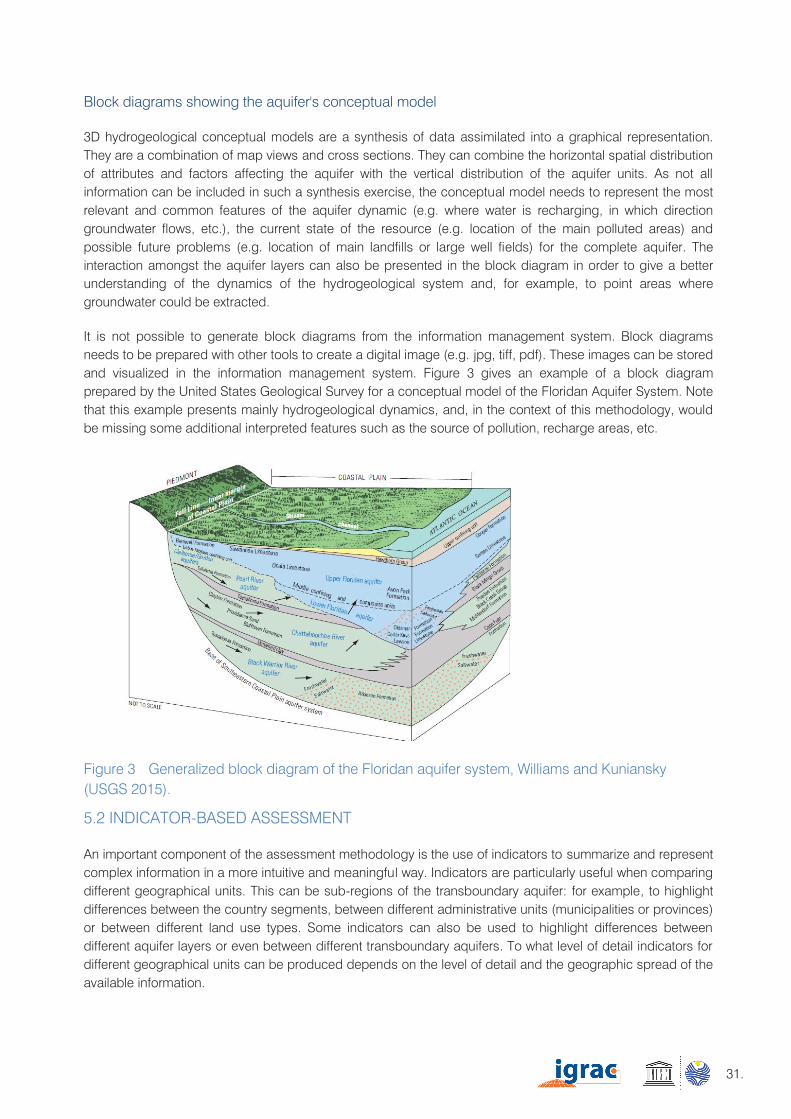
Block diagrams showing the aquifer's conceptual model
3D hydrogeological conceptual models are a synthesis of data assimilated into a graphical representation. They are a combination of map views and cross sections. They can combine the horizontal spatial distribution of attributes and factors affecting the aquifer with the vertical distribution of the aquifer units. As not all information can be included in such a synthesis exercise, the conceptual model needs to represent the most relevant and common features of the aquifer dynamic (e.g. where water is recharging, in which direction groundwater flows, etc.), the current state of the resource (e.g. location of the main polluted areas) and possible future problems (e.g. location of main landfills or large well fields) for the complete aquifer. The interaction amongst the aquifer layers can also be presented in the block diagram in order to give a better understanding of the dynamics of the hydrogeological system and, for example, to point areas where groundwater could be extracted.
It is not possible to generate block diagrams from the information management system. Block diagrams needs to be prepared with other tools to create a digital image (e.g. jpg, tiff, pdf). These images can be stored and visualized in the information management system. Figure 3 gives an example of a block diagram prepared by the United States Geological Survey for a conceptual model of the Floridan Aquifer System. Note that this example presents mainly hydrogeological dynamics, and, in the context of this methodology, would be missing some additional interpreted features such as the source of pollution, recharge areas, etc.
Figure 3 Generalized block diagram of the Floridan aquifer system, Williams and Kuniansky (USGS 2015).
5.2 INDICATOR-BASED ASSESSMENT
An important component of the assessment methodology is the use of indicators to summarize and represent complex information in a more intuitive and meaningful way. Indicators are particularly useful when comparing different geographical units. This can be sub-regions of the transboundary aquifer: for example, to highlight differences between the country segments, between different administrative units (municipalities or provinces) or between different land use types. Some indicators can also be used to highlight differences between different aquifer layers or even between different transboundary aquifers. To what level of detail indicators for different geographical units can be produced depends on the level of detail and the geographic spread of the available information.
32. GUIDELINES FOR MULTIDISCIPLINARY TBA ASSESSMENT
Indicators are no more than a tool and thus should not replace the information and knowledge contained in more detailed reports. Nevertheless, they have a number of strengths that could help achieving progress in a diagnostic analysis:
Indicators are very strong in passing a message. They summarise in a nutshell a number of very important aspects of the system considered and bring them under attention of decision-makers, planners and other persons that do not read the entire report.
Indicators may help integrating information from different disciplines and thus support the development of a holistic view. In particular, they may integrate hydrogeological with socio-economic and ecological aspects. The wider, holistic view will contribute to a more successful dialogue between the different categories of scientists involved and other stakeholders.
Indicators may help differentiating between issues of major concern and secondary issues.
Indicators are strong on summarizing briefly whether and why the aquifer is so important that significant governance and management attention is required.
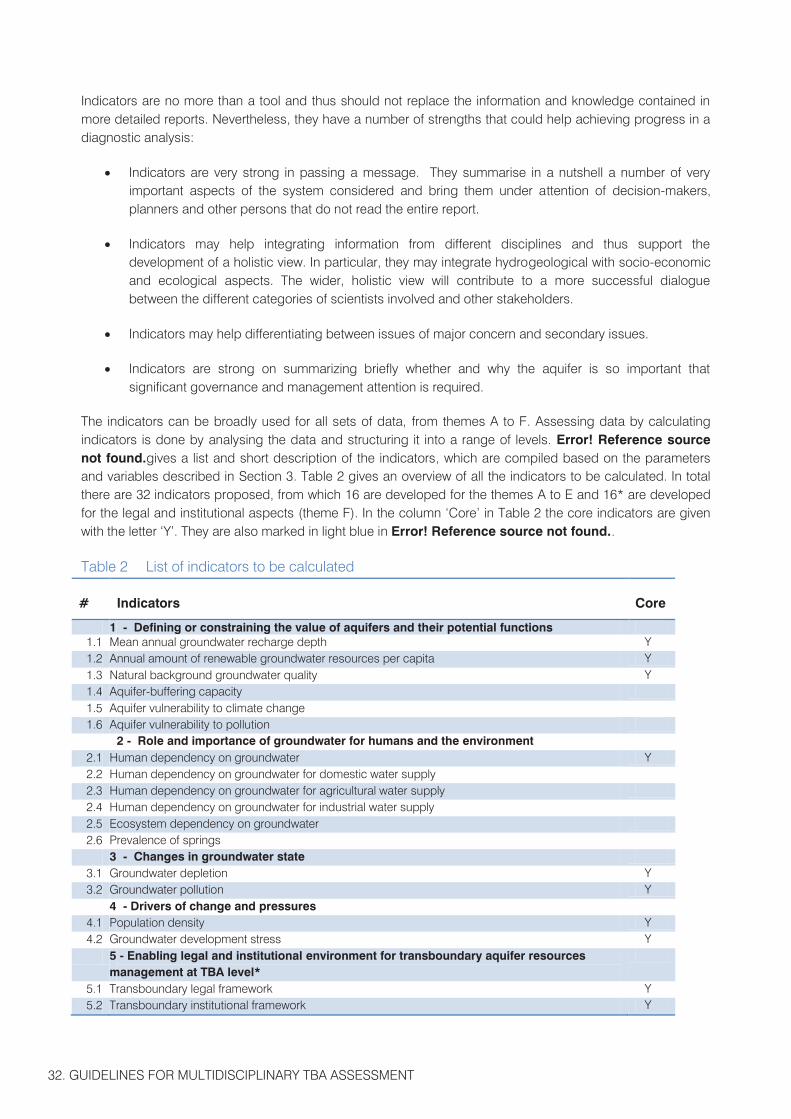
The indicators can be broadly used for all sets of data, from themes A to F. Assessing data by calculating indicators is done by analysing the data and structuring it into a range of levels. Error! Reference source not found.gives a list and short description of the indicators, which are compiled based on the parameters and variables described in Section 3. Table 2 gives an overview of all the indicators to be calculated. In total there are 32 indicators proposed, from which 16 are developed for the themes A to E and 16* are developed for the legal and institutional aspects (theme F). In the column ‘Core’ in Table 2 the core indicators are given with the letter ‘Y’. They are also marked in light blue in Error! Reference source not found..
Table 2 List of indicators to be calculated
# Indicators Core
1 - Defining or constraining the value of aquifers and their potential functions 1.1 Mean annual groundwater recharge depth Y 1.2 Annual amount of renewable groundwater resources per capita Y 1.3 Natural background groundwater quality Y 1.4 Aquifer-buffering capacity 1.5 Aquifer vulnerability to climate change 1.6 Aquifer vulnerability to pollution
2 - Role and importance of groundwater for humans and the environment 2.1 Human dependency on groundwater Y 2.2 Human dependency on groundwater for domestic water supply 2.3 Human dependency on groundwater for agricultural water supply 2.4 Human dependency on groundwater for industrial water supply 2.5 Ecosystem dependency on groundwater 2.6 Prevalence of springs
3 - Changes in groundwater state 3.1 Groundwater depletion Y 3.2 Groundwater pollution Y
4 - Drivers of change and pressures 4.1 Population density Y 4.2 Groundwater development stress Y
5 - Enabling legal and institutional environment for transboundary aquifer resources management at TBA level*
5.1 Transboundary legal framework Y 5.2 Transboundary institutional framework Y
33.
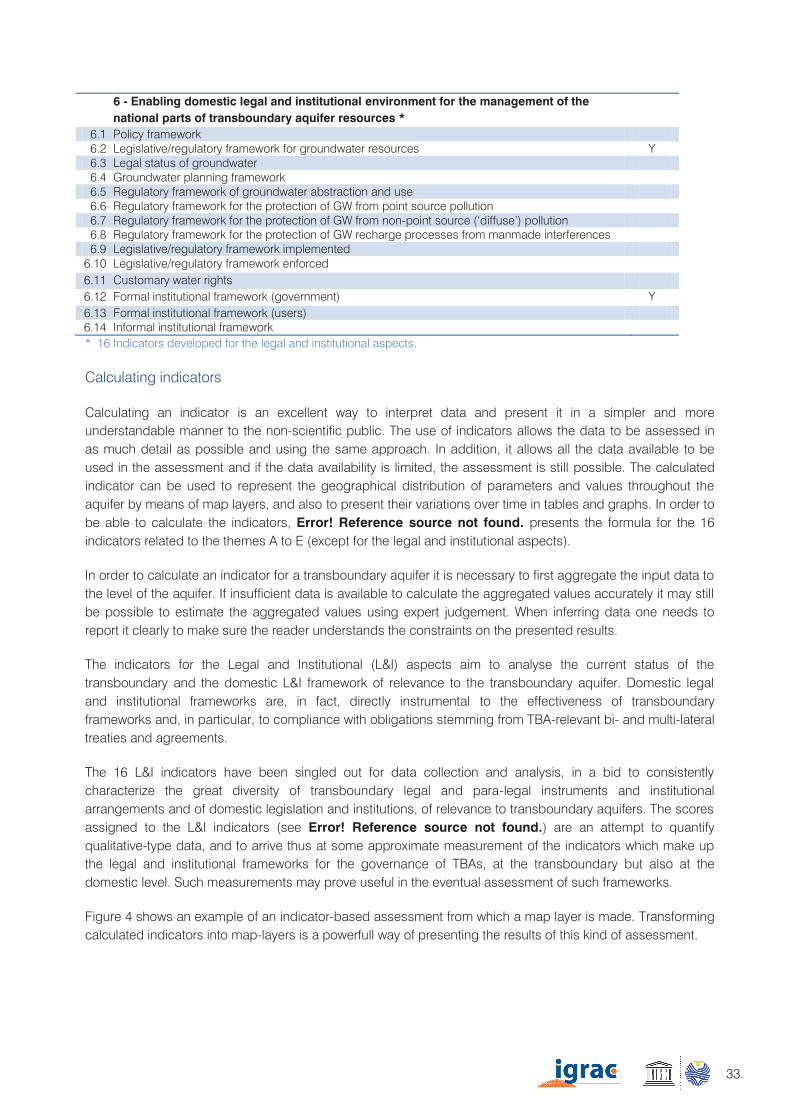
6 - Enabling domestic legal and institutional environment for the management of the national parts of transboundary aquifer resources *
6.1 Policy framework 6.2 Legislative/regulatory framework for groundwater resources Y 6.3 Legal status of groundwater 6.4 Groundwater planning framework 6.5 Regulatory framework of groundwater abstraction and use 6.6 Regulatory framework for the protection of GW from point source pollution 6.7 Regulatory framework for the protection of GW from non-point source (‘diffuse’) pollution 6.8 Regulatory framework for the protection of GW recharge processes from manmade interferences 6.9 Legislative/regulatory framework implemented
6.10 Legislative/regulatory framework enforced 6.11 Customary water rights 6.12 Formal institutional framework (government) Y 6.13 Formal institutional framework (users) 6.14 Informal institutional framework * 16 Indicators developed for the legal and institutional aspects.
Calculating indicators
Calculating an indicator is an excellent way to interpret data and present it in a simpler and more understandable manner to the non-scientific public. The use of indicators allows the data to be assessed in as much detail as possible and using the same approach. In addition, it allows all the data available to be used in the assessment and if the data availability is limited, the assessment is still possible. The calculated indicator can be used to represent the geographical distribution of parameters and values throughout the aquifer by means of map layers, and also to present their variations over time in tables and graphs. In order to be able to calculate the indicators, Error! Reference source not found. presents the formula for the 16 indicators related to the themes A to E (except for the legal and institutional aspects).
In order to calculate an indicator for a transboundary aquifer it is necessary to first aggregate the input data to the level of the aquifer. If insufficient data is available to calculate the aggregated values accurately it may still be possible to estimate the aggregated values using expert judgement. When inferring data one needs to report it clearly to make sure the reader understands the constraints on the presented results.
The indicators for the Legal and Institutional (L&I) aspects aim to analyse the current status of the transboundary and the domestic L&I framework of relevance to the transboundary aquifer. Domestic legal and institutional frameworks are, in fact, directly instrumental to the effectiveness of transboundary frameworks and, in particular, to compliance with obligations stemming from TBA-relevant bi- and multi-lateral treaties and agreements.
The 16 L&I indicators have been singled out for data collection and analysis, in a bid to consistently characterize the great diversity of transboundary legal and para-legal instruments and institutional arrangements and of domestic legislation and institutions, of relevance to transboundary aquifers. The scores assigned to the L&I indicators (see Error! Reference source not found.) are an attempt to quantify qualitative-type data, and to arrive thus at some approximate measurement of the indicators which make up the legal and institutional frameworks for the governance of TBAs, at the transboundary but also at the domestic level. Such measurements may prove useful in the eventual assessment of such frameworks.
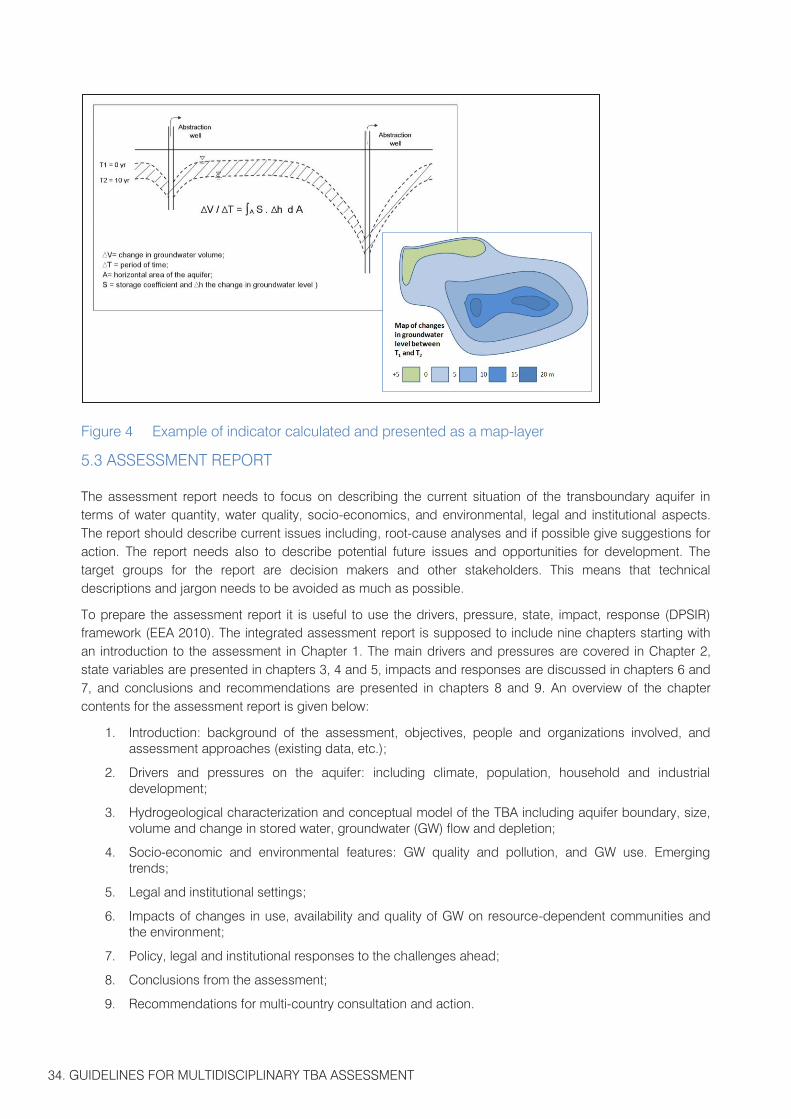
Figure 4 shows an example of an indicator-based assessment from which a map layer is made. Transforming calculated indicators into map-layers is a powerfull way of presenting the results of this kind of assessment.
34. GUIDELINES FOR MULTIDISCIPLINARY TBA ASSESSMENT
Figure 4 Example of indicator calculated and presented as a map-layer
5.3 ASSESSMENT REPORT
The assessment report needs to focus on describing the current situation of the transboundary aquifer in terms of water quantity, water quality, socio-economics, and environmental, legal and institutional aspects. The report should describe current issues including, root-cause analyses and if possible give suggestions for action. The report needs also to describe potential future issues and opportunities for development. The target groups for the report are decision makers and other stakeholders. This means that technical descriptions and jargon needs to be avoided as much as possible.
To prepare the assessment report it is useful to use the drivers, pressure, state, impact, response (DPSIR) framework (EEA 2010). The integrated assessment report is supposed to include nine chapters starting with an introduction to the assessment in Chapter 1. The main drivers and pressures are covered in Chapter 2, state variables are presented in chapters 3, 4 and 5, impacts and responses are discussed in chapters 6 and 7, and conclusions and recommendations are presented in chapters 8 and 9. An overview of the chapter contents for the assessment report is given below:
1. Introduction: background of the assessment, objectives, people and organizations involved, and assessment approaches (existing data, etc.);
2. Drivers and pressures on the aquifer: including climate, population, household and industrial development;
3. Hydrogeological characterization and conceptual model of the TBA including aquifer boundary, size, volume and change in stored water, groundwater (GW) flow and depletion;
4. Socio-economic and environmental features: GW quality and pollution, and GW use. Emerging trends;
5. Legal and institutional settings;
6. Impacts of changes in use, availability and quality of GW on resource-dependent communities and the environment;
7. Policy, legal and institutional responses to the challenges ahead;
8. Conclusions from the assessment;
9. Recommendations for multi-country consultation and action.
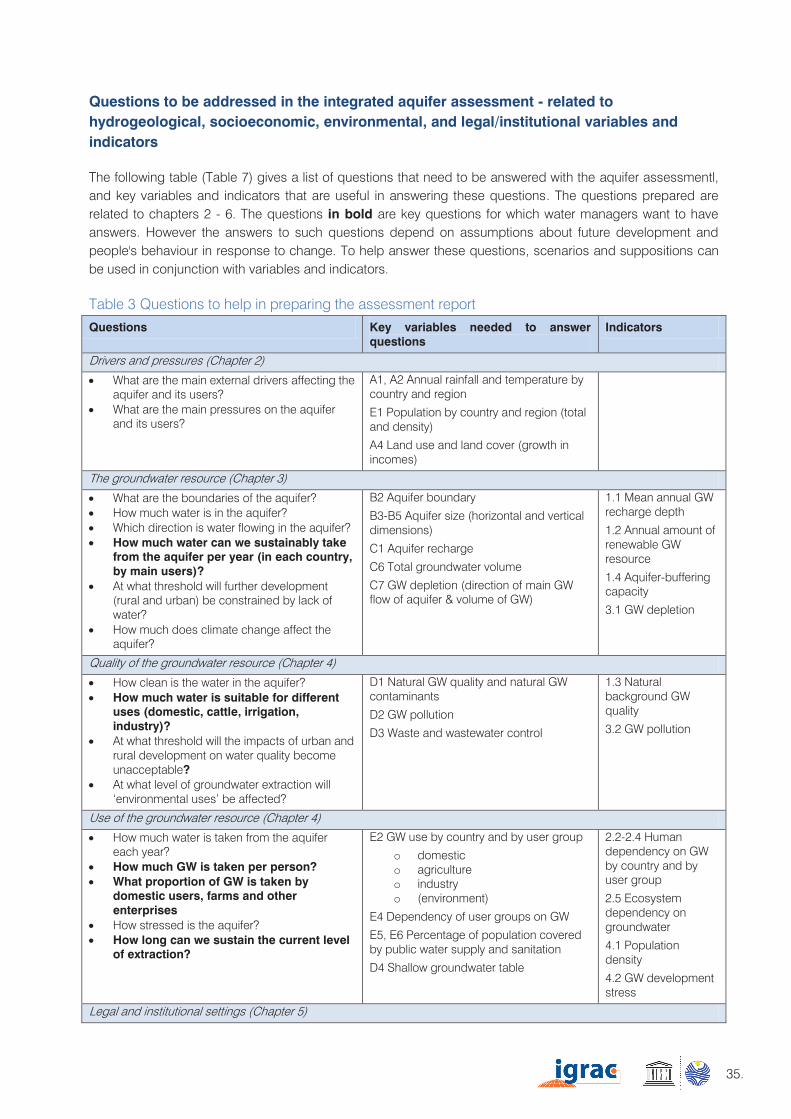
Questions to be addressed in the integrated aquifer assessment - related to hydrogeological, socioeconomic, environmental, and legal/institutional variables and indicators
The following table (Table 7) gives a list of questions that need to be answered with the aquifer assessmentl, and key variables and indicators that are useful in answering these questions. The questions prepared are related to chapters 2 - 6. The questions in bold are key questions for which water managers want to have answers. However the answers to such questions depend on assumptions about future development and people's behaviour in response to change. To help answer these questions, scenarios and suppositions can be used in conjunction with variables and indicators.
Table 3 Questions to help in preparing the assessment report
Questions Key variables needed to answer questions
Indicators
Drivers and pressures (Chapter 2)
What are the main external drivers affecting the aquifer and its users?
What are the main pressures on the aquifer and its users?
A1, A2 Annual rainfall and temperature by country and region
E1 Population by country and region (total and density)
A4 Land use and land cover (growth in incomes)
The groundwater resource (Chapter 3)
What are the boundaries of the aquifer? How much water is in the aquifer? Which direction is water flowing in the aquifer? How much water can we sustainably take
from the aquifer per year (in each country, by main users)?
At what threshold will further development (rural and urban) be constrained by lack of water?
How much does climate change affect the aquifer?
B2 Aquifer boundary
B3-B5 Aquifer size (horizontal and vertical dimensions)
C1 Aquifer recharge
C6 Total groundwater volume
C7 GW depletion (direction of main GW flow of aquifer & volume of GW)
1.1 Mean annual GW recharge depth
1.2 Annual amount of renewable GW resource
1.4 Aquifer-buffering capacity
3.1 GW depletion
Quality of the groundwater resource (Chapter 4)
How clean is the water in the aquifer? How much water is suitable for different
uses (domestic, cattle, irrigation, industry)?
At what threshold will the impacts of urban and rural development on water quality become unacceptable?
At what level of groundwater extraction will ‘environmental uses’ be affected?
D1 Natural GW quality and natural GW contaminants
D2 GW pollution
D3 Waste and wastewater control
1.3 Natural background GW quality
3.2 GW pollution
Use of the groundwater resource (Chapter 4)
How much water is taken from the aquifer each year?
How much GW is taken per person? What proportion of GW is taken by
domestic users, farms and other enterprises
How stressed is the aquifer? How long can we sustain the current level
of extraction?
E2 GW use by country and by user group
o domestic o agriculture o industry o (environment)
E4 Dependency of user groups on GW
E5, E6 Percentage of population covered by public water supply and sanitation
D4 Shallow groundwater table
2.2-2.4 Human dependency on GW by country and by user group
2.5 Ecosystem dependency on groundwater
4.1 Population density
4.2 GW development stress
Legal and institutional settings (Chapter 5)
35.
Questions to be addressed in the integrated aquifer assessment - related to hydrogeological, socioeconomic, environmental, and legal/institutional variables and indicators
The following table (Table 7) gives a list of questions that need to be answered with the aquifer assessmentl, and key variables and indicators that are useful in answering these questions. The questions prepared are related to chapters 2 - 6. The questions in bold are key questions for which water managers want to have answers. However the answers to such questions depend on assumptions about future development and people's behaviour in response to change. To help answer these questions, scenarios and suppositions can be used in conjunction with variables and indicators.
Table 3 Questions to help in preparing the assessment report
Questions Key variables needed to answer questions
Indicators
Drivers and pressures (Chapter 2)
What are the main external drivers affecting the aquifer and its users?
What are the main pressures on the aquifer and its users?
A1, A2 Annual rainfall and temperature by country and region
E1 Population by country and region (total and density)
A4 Land use and land cover (growth in incomes)
The groundwater resource (Chapter 3)
What are the boundaries of the aquifer? How much water is in the aquifer? Which direction is water flowing in the aquifer? How much water can we sustainably take
from the aquifer per year (in each country, by main users)?
At what threshold will further development (rural and urban) be constrained by lack of water?
How much does climate change affect the aquifer?
B2 Aquifer boundary
B3-B5 Aquifer size (horizontal and vertical dimensions)
C1 Aquifer recharge
C6 Total groundwater volume
C7 GW depletion (direction of main GW flow of aquifer & volume of GW)
1.1 Mean annual GW recharge depth
1.2 Annual amount of renewable GW resource
1.4 Aquifer-buffering capacity
3.1 GW depletion
Quality of the groundwater resource (Chapter 4)
How clean is the water in the aquifer? How much water is suitable for different
uses (domestic, cattle, irrigation, industry)?
At what threshold will the impacts of urban and rural development on water quality become unacceptable?
At what level of groundwater extraction will ‘environmental uses’ be affected?
D1 Natural GW quality and natural GW contaminants
D2 GW pollution
D3 Waste and wastewater control
1.3 Natural background GW quality
3.2 GW pollution
Use of the groundwater resource (Chapter 4)
How much water is taken from the aquifer each year?
How much GW is taken per person? What proportion of GW is taken by
domestic users, farms and other enterprises
How stressed is the aquifer? How long can we sustain the current level
of extraction?
E2 GW use by country and by user group
o domestic o agriculture o industry o (environment)
E4 Dependency of user groups on GW
E5, E6 Percentage of population covered by public water supply and sanitation
D4 Shallow groundwater table
2.2-2.4 Human dependency on GW by country and by user group
2.5 Ecosystem dependency on groundwater
4.1 Population density
4.2 GW development stress
Legal and institutional settings (Chapter 5)
36. GUIDELINES FOR MULTIDISCIPLINARY TBA ASSESSMENT
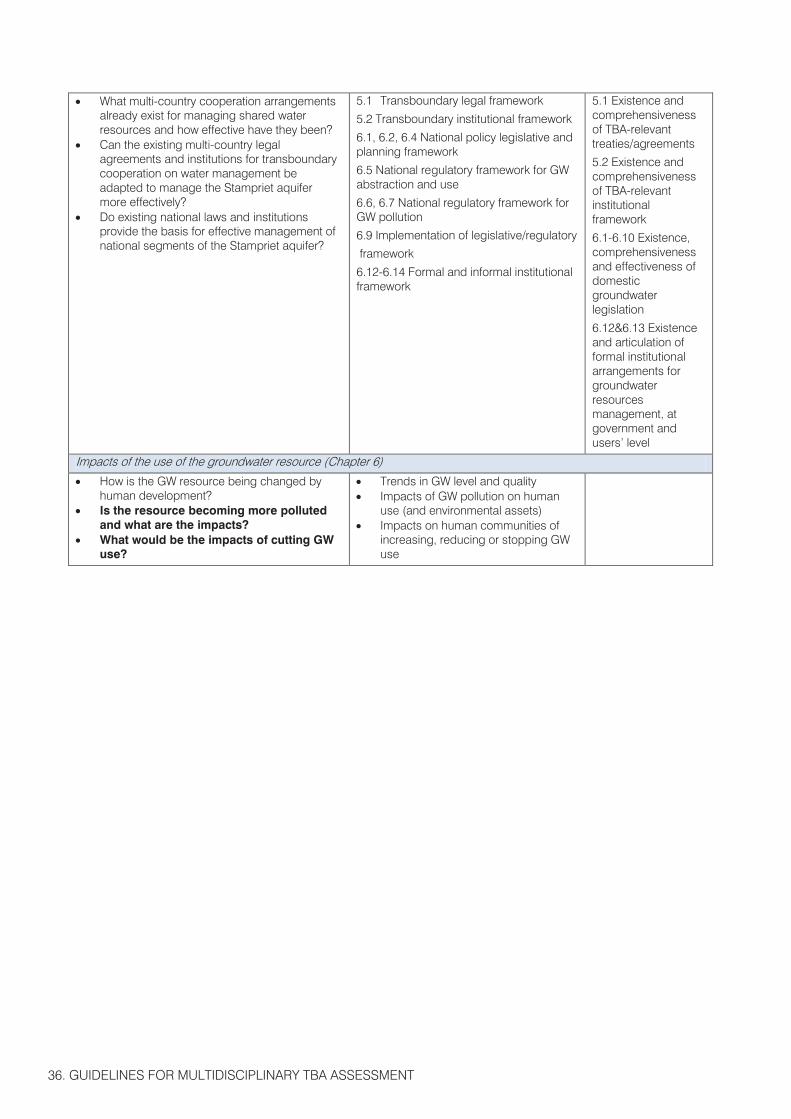
What multi-country cooperation arrangements already exist for managing shared water resources and how effective have they been?
Can the existing multi-country legal agreements and institutions for transboundary cooperation on water management be adapted to manage the Stampriet aquifer more effectively?
Do existing national laws and institutions provide the basis for effective management of national segments of the Stampriet aquifer?
5.1 Transboundary legal framework
5.2 Transboundary institutional framework
6.1, 6.2, 6.4 National policy legislative and planning framework
6.5 National regulatory framework for GW abstraction and use
6.6, 6.7 National regulatory framework for GW pollution
6.9 Implementation of legislative/regulatory
framework
6.12-6.14 Formal and informal institutional framework
5.1 Existence and comprehensiveness of TBA-relevant treaties/agreements
5.2 Existence and comprehensiveness of TBA-relevant institutional framework
6.1-6.10 Existence, comprehensiveness and effectiveness of domestic groundwater legislation
6.12&6.13 Existence and articulation of formal institutional arrangements for groundwater resources management, at government and users’ level
Impacts of the use of the groundwater resource (Chapter 6)
How is the GW resource being changed by human development?
Is the resource becoming more polluted and what are the impacts?
What would be the impacts of cutting GW use?
Trends in GW level and quality Impacts of GW pollution on human
use (and environmental assets) Impacts on human communities of
increasing, reducing or stopping GW use
6.
39.
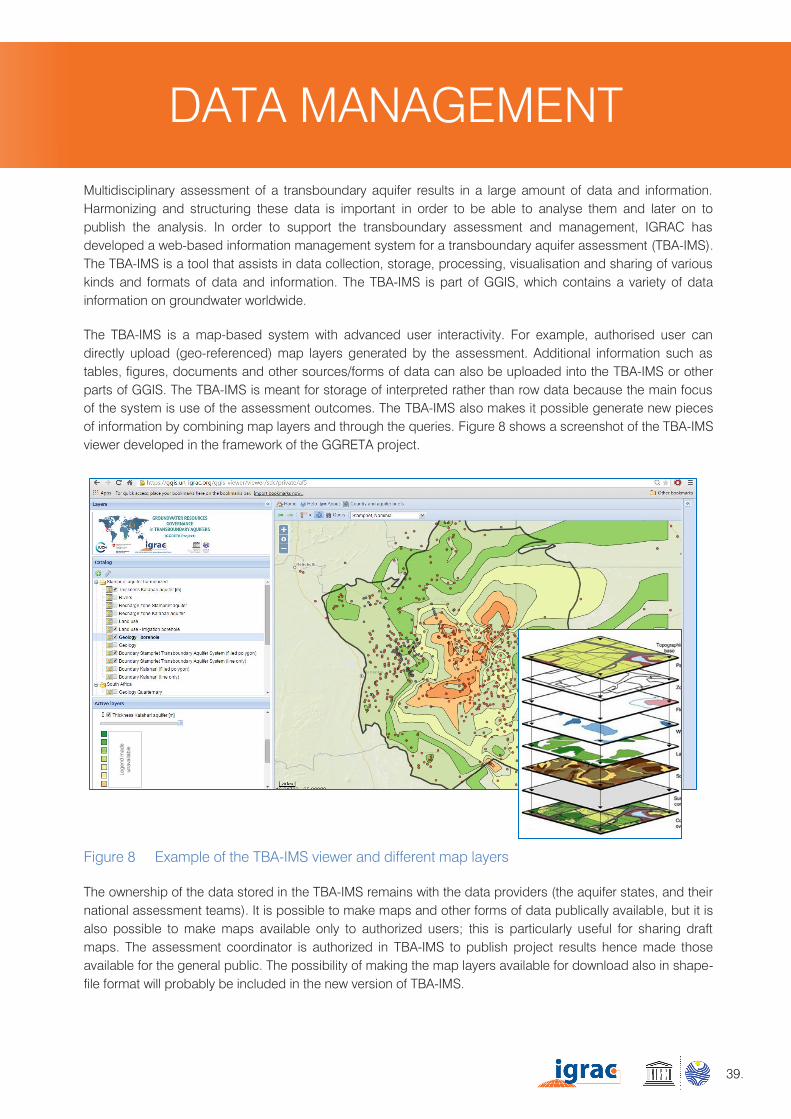
Multidisciplinary assessment of a transboundary aquifer results in a large amount of data and information. Harmonizing and structuring these data is important in order to be able to analyse them and later on to publish the analysis. In order to support the transboundary assessment and management, IGRAC has developed a web-based information management system for a transboundary aquifer assessment (TBA-IMS). The TBA-IMS is a tool that assists in data collection, storage, processing, visualisation and sharing of various kinds and formats of data and information. The TBA-IMS is part of GGIS, which contains a variety of data information on groundwater worldwide.
The TBA-IMS is a map-based system with advanced user interactivity. For example, authorised user can directly upload (geo-referenced) map layers generated by the assessment. Additional information such as tables, figures, documents and other sources/forms of data can also be uploaded into the TBA-IMS or other parts of GGIS. The TBA-IMS is meant for storage of interpreted rather than row data because the main focus of the system is use of the assessment outcomes. The TBA-IMS also makes it possible generate new pieces of information by combining map layers and through the queries. Figure 8 shows a screenshot of the TBA-IMS viewer developed in the framework of the GGRETA project.
Figure 8 Example of the TBA-IMS viewer and different map layers
The ownership of the data stored in the TBA-IMS remains with the data providers (the aquifer states, and their national assessment teams). It is possible to make maps and other forms of data publically available, but it is also possible to make maps available only to authorized users; this is particularly useful for sharing draft maps. The assessment coordinator is authorized in TBA-IMS to publish project results hence made those available for the general public. The possibility of making the map layers available for download also in shape-file format will probably be included in the new version of TBA-IMS.
Lege
nd m
ade
unav
aila
ble
DATA MANAGEMENT

40. GUIDELINES FOR MULTIDISCIPLINARY TBA ASSESSMENT
6.1 THE TBA INFORMATION MANAGEMENT SYSTEM
The TBA-IMS is designed and maintained by IGRAC, in close cooperation with UNESCO-IHP and the national assessment teams. The information management system has been designed in such a way that it is easy to set up a dedicated workspace for new aquifers / projects. The database is accessible to the assessment teams and the government representatives during the assessment trajectory. They also decide on accessibility of the assessment results to the global groundwater community and public.
The information management system has two view modes:
1. In the public viewer, the general public is able to navigate using a map view and search for information related to transboundary aquifers by clicking directly on the geographical units of interest. Information such as attributes at aquifer level or indicators values derived from the assessment are displayed in an interactive map view. Meta information is accessible to facilitate interpretation of the assessment results.
2. The protected workspace is a password-protected part with access to the database - national experts, assessment and national coordinators, GIS experts and the system administrator have access to a password-protected workspace to manage the groundwater information related to the country or aquifer they are responsible for. The workspace facilitates uploading and updating of data. Data quality is user and the system controlled.
The following types of data can be uploaded in the TBA-IMS:
GIS data: map layers, rasters and TIFF images;
Tabular data and time series (xls);
Images (JPEG, PNG, PDF): cross sections, 3D diagrams or any type of graphically available information that could help with the visualisation of the aquifer / aquifer system characteristics;
Documents in PDF;
Metadata: all data and information are provided with metadata, describing aspects such as: data source, uncertainty range, method etc.
The TBA-IMS meets all the requirements of the OGC international data standards; therefore the data uploaded to the TBA-IMS can easily be shared and integrated with other external information systems. To allow this, the TBA-IMS uses Web Mapping Services (WMS) and Web Feature Services (WFS) to distribute maps and data. In the same way, data from external sources can easily be integrated in the TBA-IMS.
6.2 DATA COLLECTION AND PROCESSING FOR THE TBA-IMS
National expert teams have the main responsibility for the data collection. This process is facilitated and coordinated by the Assessment Coordinator and is based on the guidelines of this document. At country level, the National Coordinator provides support to the experts and lead cooperation with other aquifer state(s).
Data processing includes the steps required to transform raw data collected by the national experts into structured and harmonized products at aquifer level. Data from different sources needs to be structured into tables and databases which are consistent internationally. A significant part of the work is related to the processing of map information, including digitizing, reclassification of map information, merging of national segment information, creation of new maps and/or spatial calculations. To implement these tasks the assessment team needs a good knowledge of GIS or a GIS specialist is part of the assessment team. The assessment coordinator, with the assistance of a GIS specialist, should ensure that data meet the quality standards required (in terms of format, harmonisation etc.).
41.
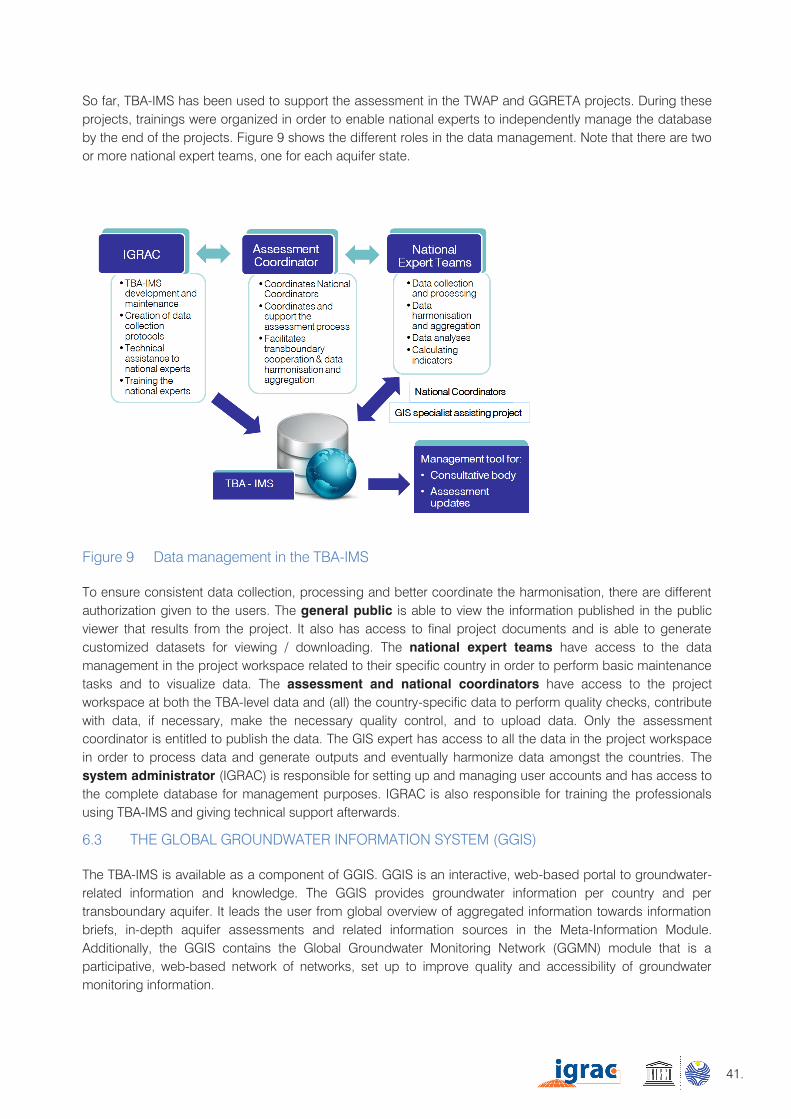
So far, TBA-IMS has been used to support the assessment in the TWAP and GGRETA projects. During these projects, trainings were organized in order to enable national experts to independently manage the database by the end of the projects. Figure 9 shows the different roles in the data management. Note that there are two or more national expert teams, one for each aquifer state.
Figure 9 Data management in the TBA-IMS
To ensure consistent data collection, processing and better coordinate the harmonisation, there are different authorization given to the users. The general public is able to view the information published in the public viewer that results from the project. It also has access to final project documents and is able to generate customized datasets for viewing / downloading. The national expert teams have access to the data management in the project workspace related to their specific country in order to perform basic maintenance tasks and to visualize data. The assessment and national coordinators have access to the project workspace at both the TBA-level data and (all) the country-specific data to perform quality checks, contribute with data, if necessary, make the necessary quality control, and to upload data. Only the assessment coordinator is entitled to publish the data. The GIS expert has access to all the data in the project workspace in order to process data and generate outputs and eventually harmonize data amongst the countries. The system administrator (IGRAC) is responsible for setting up and managing user accounts and has access to the complete database for management purposes. IGRAC is also responsible for training the professionals using TBA-IMS and giving technical support afterwards.
6.3 THE GLOBAL GROUNDWATER INFORMATION SYSTEM (GGIS)
The TBA-IMS is available as a component of GGIS. GGIS is an interactive, web-based portal to groundwater-related information and knowledge. The GGIS provides groundwater information per country and per transboundary aquifer. It leads the user from global overview of aggregated information towards information briefs, in-depth aquifer assessments and related information sources in the Meta-Information Module. Additionally, the GGIS contains the Global Groundwater Monitoring Network (GGMN) module that is a participative, web-based network of networks, set up to improve quality and accessibility of groundwater monitoring information.

42. GUIDELINES FOR MULTIDISCIPLINARY TBA ASSESSMENT
The GGIS has an open and extendable architecture that enables setting up dedicated workspaces for new aquifers/projects. The GGIS is meant for various categories of stakeholders, including both professionals and the general public. A snapshot of some of the GGIS components is shown below (Figure 10). The GGIS is accessible via https://ggis.un-igrac.org.
Figure 10 GGIS components: a snapshot
7.
45.
EEA. “DPSIR - Drivers, Pressure, State, Impact and Response Framework.” The European Environment - State and Outlook. Copenhagen: European Environment Agency, 2010.
JICA. The study on Groundwater Potential Evaluation and Management Plan in the Southeast Kalahari Artesian Basin in the Republic of Namibia. study, Tokyo: Japan International Cooperation Agency, 2002.
UNESCO-IHP. Internationally Shared (Transboundary) Aquifer Resources Management - Their significance and sustainable management. Framework document, Paris: UNESCO-IHP-VI, SERIES ON GROUNDWATER NO. 1, 2001.
UNESCO-IHP, IGRAC, WWAP. Transboundary Aquifers and SIDS Groundwater Systems. Methodology, Paris: GEF Transboundary Waters Assessment Programme (TWAP), 2012.
UNESCO-IHP, WWAP IGRAC,. Transboundary Aquifers and SIDS Groundwater Systems. Methodology, GEF Transboundary Waters Assessment Programme (TWAP), 2012.
UN-ILC. “Draft Articles on the Law of Transboundary Aquifers UN Doc. A/CN.4/L.724.” International Law Commission - UN. 2008.
USGS. “Floridan Aquifer System Groundwater Availability Study.” USGS. 2015. http://fl.water.usgs.gov/floridan/intro.html (accessed 07 16, 2015).
Wilson, Paul F. Root Cause Analysis: A Tool for Total Quality Management. Milwaukee: ASQ Quality Press, 1993.
WEB REFERENCES
GGIS: https://ggis.un-igrac.org
TWAP: https://ggis.un-igrac.org/ggis-viewer/viewer/twap/public/default
GGRETA: https://ggis.un-igrac.org/ggis-viewer/sdc
GGMN: https://ggmn.lizard.net
GRUMP (Population density): http://sedac.ciesin.columbia.edu/data/set/grump-v1-population-count/data-download
POP (Population density projections): http://www.iiasa.ac.at/web/home/research/researchPrograms/WorldPopulation/Wittgenstein_Centre_Data_Explorer.html
Globcover V2 (land cover 2009): http://due.esrin.esa.int/page_globcover.php
GLC 2000 (land cover 2000): http://www.glcn.org/dat_1_en.jsp
WorldClim Precipitation / Temperature (30 sec): http://www.worldclim.org/paleo-climate
Aquastat (water withdrawn): http://www.fao.org/nr/water/aquastat/sets/index.stm
ACE2 (digital elevation model): https://earth.esa.int/web/nest/downloads/sample-data
SRTM 90m Digital Elevation Data: http://srtm.csi.cgiar.org/
REFERENCES
APPENDIX 1.
47.
APPENDIXESAPPENDIX 1.DETAILED OVERVIEW OF DATA
TO BE COLLECTED
48. GUIDELINES FOR MULTIDISCIPLINARY TBA ASSESSMENT
A – PHYSIOGRAPHY AND CLIMATE
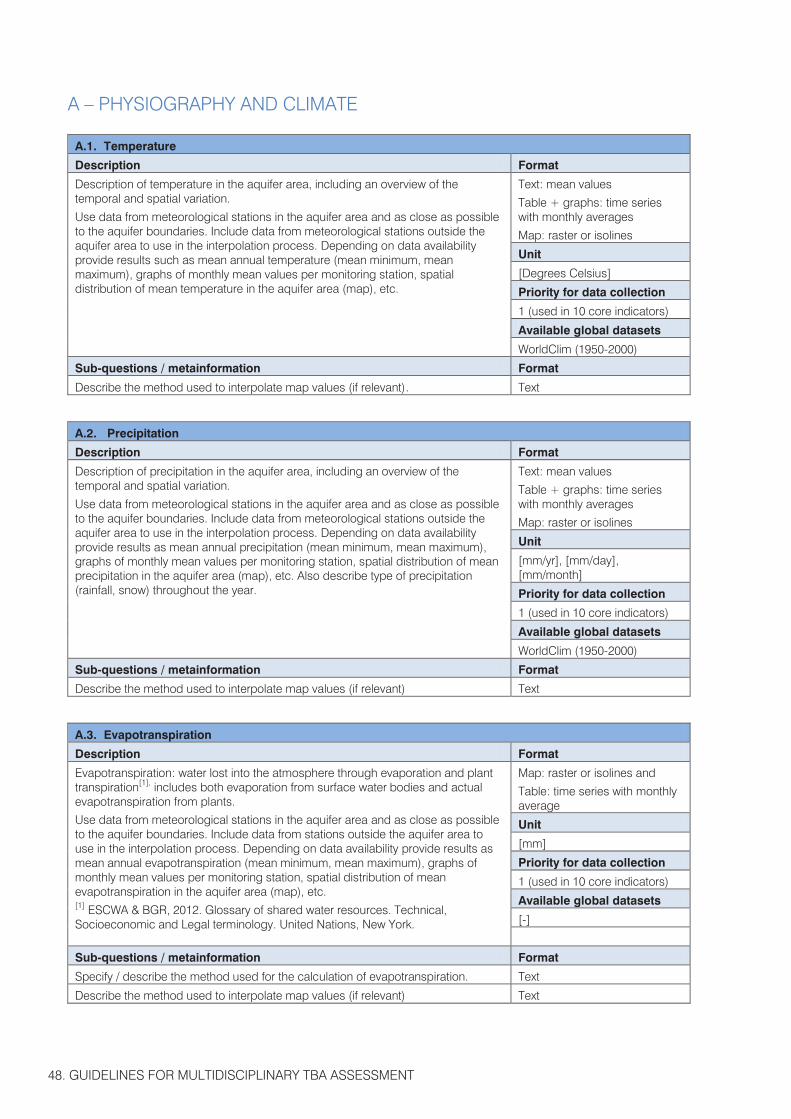
A.1. Temperature
Description Format
Description of temperature in the aquifer area, including an overview of the temporal and spatial variation.
Use data from meteorological stations in the aquifer area and as close as possible to the aquifer boundaries. Include data from meteorological stations outside the aquifer area to use in the interpolation process. Depending on data availability provide results such as mean annual temperature (mean minimum, mean maximum), graphs of monthly mean values per monitoring station, spatial distribution of mean temperature in the aquifer area (map), etc.
Text: mean values
Table + graphs: time series with monthly averages
Map: raster or isolines
Unit
[Degrees Celsius]
Priority for data collection
1 (used in 10 core indicators)
Available global datasets
WorldClim (1950-2000)
Sub-questions / metainformation Format
Describe the method used to interpolate map values (if relevant). Text
A.2. Precipitation
Description Format
Description of precipitation in the aquifer area, including an overview of the temporal and spatial variation.
Use data from meteorological stations in the aquifer area and as close as possible to the aquifer boundaries. Include data from meteorological stations outside the aquifer area to use in the interpolation process. Depending on data availability provide results as mean annual precipitation (mean minimum, mean maximum), graphs of monthly mean values per monitoring station, spatial distribution of mean precipitation in the aquifer area (map), etc. Also describe type of precipitation (rainfall, snow) throughout the year.
Text: mean values
Table + graphs: time series with monthly averages
Map: raster or isolines
Unit
[mm/yr], [mm/day], [mm/month]
Priority for data collection
1 (used in 10 core indicators)
Available global datasets
WorldClim (1950-2000)
Sub-questions / metainformation Format
Describe the method used to interpolate map values (if relevant) Text
A.3. Evapotranspiration
Description Format
Evapotranspiration: water lost into the atmosphere through evaporation and plant transpiration[1], includes both evaporation from surface water bodies and actual evapotranspiration from plants.
Use data from meteorological stations in the aquifer area and as close as possible to the aquifer boundaries. Include data from stations outside the aquifer area to use in the interpolation process. Depending on data availability provide results as mean annual evapotranspiration (mean minimum, mean maximum), graphs of monthly mean values per monitoring station, spatial distribution of mean evapotranspiration in the aquifer area (map), etc. [1] ESCWA & BGR, 2012. Glossary of shared water resources. Technical, Socioeconomic and Legal terminology. United Nations, New York.
Map: raster or isolines and
Table: time series with monthly average
Unit
[mm]
Priority for data collection
1 (used in 10 core indicators)
Available global datasets
[-]
Sub-questions / metainformation Format
Specify / describe the method used for the calculation of evapotranspiration. Text
Describe the method used to interpolate map values (if relevant) Text
49.
A – PHYSIOGRAPHY AND CLIMATE
A.1. Temperature
Description Format
Description of temperature in the aquifer area, including an overview of the temporal and spatial variation.
Use data from meteorological stations in the aquifer area and as close as possible to the aquifer boundaries. Include data from meteorological stations outside the aquifer area to use in the interpolation process. Depending on data availability provide results such as mean annual temperature (mean minimum, mean maximum), graphs of monthly mean values per monitoring station, spatial distribution of mean temperature in the aquifer area (map), etc.
Text: mean values
Table + graphs: time series with monthly averages
Map: raster or isolines
Unit
[Degrees Celsius]
Priority for data collection
1 (used in 10 core indicators)
Available global datasets
WorldClim (1950-2000)
Sub-questions / metainformation Format
Describe the method used to interpolate map values (if relevant). Text
A.2. Precipitation
Description Format
Description of precipitation in the aquifer area, including an overview of the temporal and spatial variation.
Use data from meteorological stations in the aquifer area and as close as possible to the aquifer boundaries. Include data from meteorological stations outside the aquifer area to use in the interpolation process. Depending on data availability provide results as mean annual precipitation (mean minimum, mean maximum), graphs of monthly mean values per monitoring station, spatial distribution of mean precipitation in the aquifer area (map), etc. Also describe type of precipitation (rainfall, snow) throughout the year.
Text: mean values
Table + graphs: time series with monthly averages
Map: raster or isolines
Unit
[mm/yr], [mm/day], [mm/month]
Priority for data collection
1 (used in 10 core indicators)
Available global datasets
WorldClim (1950-2000)
Sub-questions / metainformation Format
Describe the method used to interpolate map values (if relevant) Text
A.3. Evapotranspiration
Description Format
Evapotranspiration: water lost into the atmosphere through evaporation and plant transpiration[1], includes both evaporation from surface water bodies and actual evapotranspiration from plants.
Use data from meteorological stations in the aquifer area and as close as possible to the aquifer boundaries. Include data from stations outside the aquifer area to use in the interpolation process. Depending on data availability provide results as mean annual evapotranspiration (mean minimum, mean maximum), graphs of monthly mean values per monitoring station, spatial distribution of mean evapotranspiration in the aquifer area (map), etc. [1] ESCWA & BGR, 2012. Glossary of shared water resources. Technical, Socioeconomic and Legal terminology. United Nations, New York.
Map: raster or isolines and
Table: time series with monthly average
Unit
[mm]
Priority for data collection
1 (used in 10 core indicators)
Available global datasets
[-]
Sub-questions / metainformation Format
Specify / describe the method used for the calculation of evapotranspiration. Text
Describe the method used to interpolate map values (if relevant) Text
A.4. Land use / land cover
Description Format
Land use is characterised by the arrangements, activities and inputs that people undertake in a certain land cover type to produce, change or maintain it.
Information on land use in the aquifer area is a key element to understanding the processes and context affecting the aquifer, e.g. to identify the locations of land use with the potential to pollute groundwater. Another example is to know which part of agricultural land is rainwater-fed, or irrigated with groundwater, or irrigated with surface water.
Usually land use maps are based on specific classifications at national level. As much as possible this classification should be standardised between aquifer states, in order to produce a harmonised map for the transboundary aquifer. If applicable and if sufficient information is available, make a differentiation in the maps for the following land uses:
Groundwater-fed agricultural land, differentiating between non-irrigated (rainwater-fed or groundwater-fed) and irrigated (irrigated by groundwater or irrigated by surface water);
Groundwater-supported wetlands and ecosystems; Areas with land subsidence.
Text: Describing land use including topics such as water needs, potential threats to (ground) water etc.
Map: polygon features
Unit
[-]
Priority for data collection
3 (general characterisation)
Available global datasets
ESA, Globcover V2 (2009)
EC/JRC, GLC 2000 (2000)
Sub-questions / metainformation Format
If harmonisation between countries has led to new or different classifications, provide an overview (‘translation key’) describing how national classifications match the harmonised transboundary classification.
Text
A.5. Topography and elevation
Description Format
A suitable topographical map is needed which can be used as a background map to present thematic maps.
In addition it is useful to have a map of the elevation of the land surface with respect to mean sea level. The map is preferably be available as a digital elevation model for the whole aquifer area and its vicinities.
The interval between the curves needs to be agreed upon by all the aquifer states and to take into consideration the different geographical features.
Map: raster
Unit
[m] above mean sea level
Priority for data collection
2 (used in 10 additional indicators)
Available global datasets
EAPRS Lab, ACE2 v31 (2009)
SRTM, CGIAR
Sub-questions / metainformation Format
A.6. Surface water network
Description Format
Network of rivers, lakes, swamps and water reservoirs present in the aquifer's area. Often this data is available at national level.
Map: line and polygon features
Unit
[-]
Priority for data collection
3 (general characterisation)
Available global datasets
[-]
Sub-questions / metainformation Format
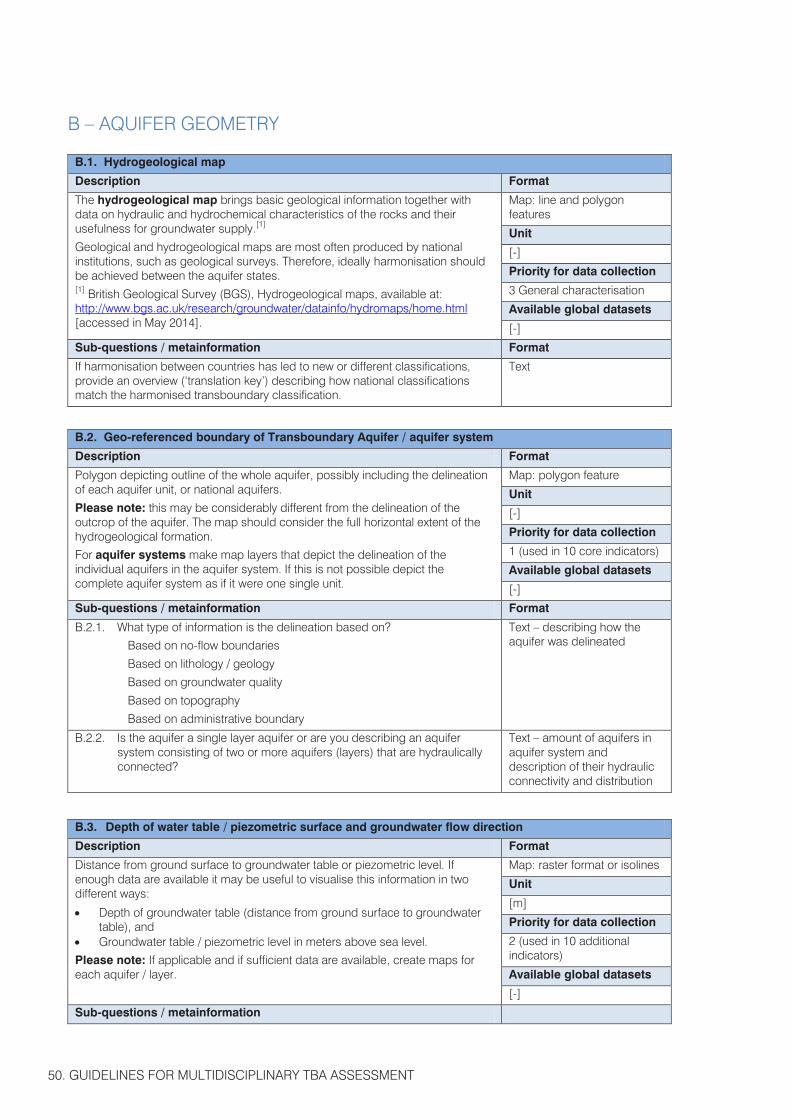
50. GUIDELINES FOR MULTIDISCIPLINARY TBA ASSESSMENT
B – AQUIFER GEOMETRY
B.1. Hydrogeological map
Description Format
The hydrogeological map brings basic geological information together with data on hydraulic and hydrochemical characteristics of the rocks and their usefulness for groundwater supply.[1]
Geological and hydrogeological maps are most often produced by national institutions, such as geological surveys. Therefore, ideally harmonisation should be achieved between the aquifer states. [1] British Geological Survey (BGS), Hydrogeological maps, available at: http://www.bgs.ac.uk/research/groundwater/datainfo/hydromaps/home.html [accessed in May 2014].
Map: line and polygon features
Unit
[-]
Priority for data collection
3 General characterisation
Available global datasets
[-]
Sub-questions / metainformation Format
If harmonisation between countries has led to new or different classifications, provide an overview (‘translation key’) describing how national classifications match the harmonised transboundary classification.
Text
B.2. Geo-referenced boundary of Transboundary Aquifer / aquifer system
Description Format
Polygon depicting outline of the whole aquifer, possibly including the delineation of each aquifer unit, or national aquifers.
Please note: this may be considerably different from the delineation of the outcrop of the aquifer. The map should consider the full horizontal extent of the hydrogeological formation.
For aquifer systems make map layers that depict the delineation of the individual aquifers in the aquifer system. If this is not possible depict the complete aquifer system as if it were one single unit.
Map: polygon feature
Unit
[-]
Priority for data collection
1 (used in 10 core indicators)
Available global datasets
[-]
Sub-questions / metainformation Format
B.2.1. What type of information is the delineation based on?
Based on no-flow boundaries
Based on lithology / geology
Based on groundwater quality
Based on topography
Based on administrative boundary
Text – describing how the aquifer was delineated
B.2.2. Is the aquifer a single layer aquifer or are you describing an aquifer system consisting of two or more aquifers (layers) that are hydraulically connected?
Text – amount of aquifers in aquifer system and description of their hydraulic connectivity and distribution
B.3. Depth of water table / piezometric surface and groundwater flow direction
Description Format
Distance from ground surface to groundwater table or piezometric level. If enough data are available it may be useful to visualise this information in two different ways:
Depth of groundwater table (distance from ground surface to groundwater table), and
Groundwater table / piezometric level in meters above sea level.
Please note: If applicable and if sufficient data are available, create maps for each aquifer / layer.
Map: raster format or isolines
Unit
[m]
Priority for data collection
2 (used in 10 additional indicators)
Available global datasets
[-]
Sub-questions / metainformation
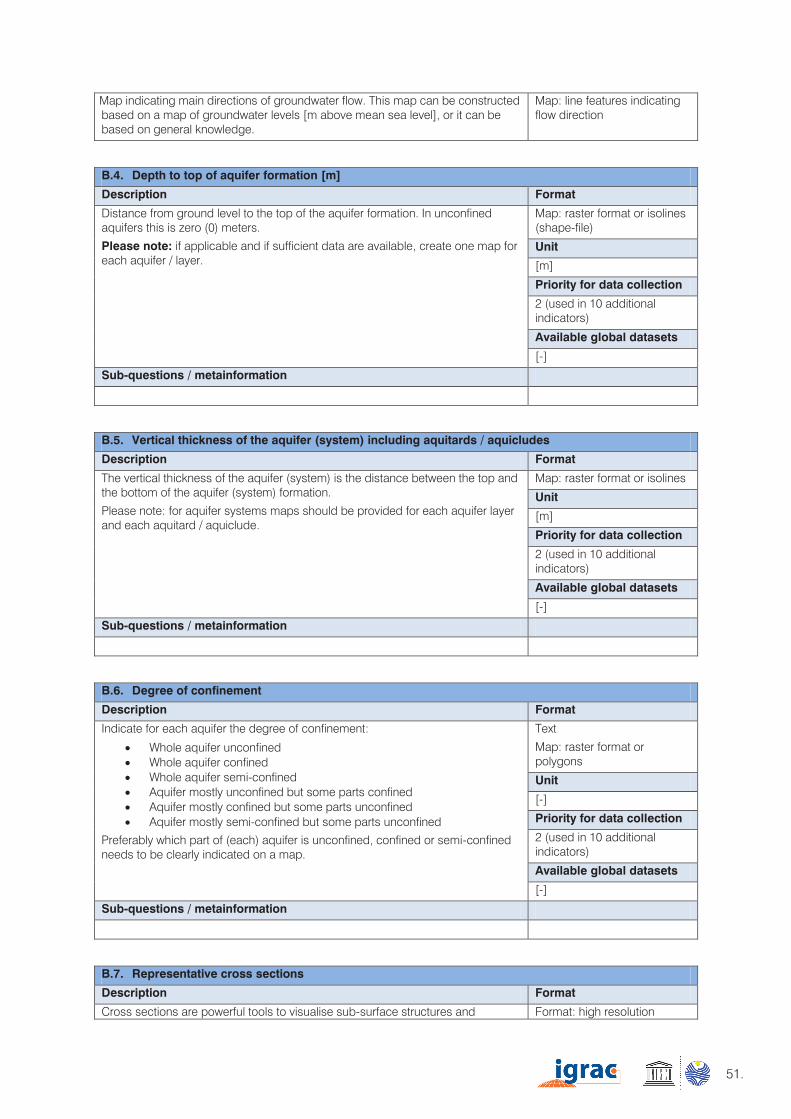
51.
B – AQUIFER GEOMETRY
B.1. Hydrogeological map
Description Format
The hydrogeological map brings basic geological information together with data on hydraulic and hydrochemical characteristics of the rocks and their usefulness for groundwater supply.[1]
Geological and hydrogeological maps are most often produced by national institutions, such as geological surveys. Therefore, ideally harmonisation should be achieved between the aquifer states. [1] British Geological Survey (BGS), Hydrogeological maps, available at: http://www.bgs.ac.uk/research/groundwater/datainfo/hydromaps/home.html [accessed in May 2014].
Map: line and polygon features
Unit
[-]
Priority for data collection
3 General characterisation
Available global datasets
[-]
Sub-questions / metainformation Format
If harmonisation between countries has led to new or different classifications, provide an overview (‘translation key’) describing how national classifications match the harmonised transboundary classification.
Text
B.2. Geo-referenced boundary of Transboundary Aquifer / aquifer system
Description Format
Polygon depicting outline of the whole aquifer, possibly including the delineation of each aquifer unit, or national aquifers.
Please note: this may be considerably different from the delineation of the outcrop of the aquifer. The map should consider the full horizontal extent of the hydrogeological formation.
For aquifer systems make map layers that depict the delineation of the individual aquifers in the aquifer system. If this is not possible depict the complete aquifer system as if it were one single unit.
Map: polygon feature
Unit
[-]
Priority for data collection
1 (used in 10 core indicators)
Available global datasets
[-]
Sub-questions / metainformation Format
B.2.1. What type of information is the delineation based on?
Based on no-flow boundaries
Based on lithology / geology
Based on groundwater quality
Based on topography
Based on administrative boundary
Text – describing how the aquifer was delineated
B.2.2. Is the aquifer a single layer aquifer or are you describing an aquifer system consisting of two or more aquifers (layers) that are hydraulically connected?
Text – amount of aquifers in aquifer system and description of their hydraulic connectivity and distribution
B.3. Depth of water table / piezometric surface and groundwater flow direction
Description Format
Distance from ground surface to groundwater table or piezometric level. If enough data are available it may be useful to visualise this information in two different ways:
Depth of groundwater table (distance from ground surface to groundwater table), and
Groundwater table / piezometric level in meters above sea level.
Please note: If applicable and if sufficient data are available, create maps for each aquifer / layer.
Map: raster format or isolines
Unit
[m]
Priority for data collection
2 (used in 10 additional indicators)
Available global datasets
[-]
Sub-questions / metainformation
Map indicating main directions of groundwater flow. This map can be constructed based on a map of groundwater levels [m above mean sea level], or it can be based on general knowledge.
Map: line features indicating flow direction
B.4. Depth to top of aquifer formation [m]
Description Format
Distance from ground level to the top of the aquifer formation. In unconfined aquifers this is zero (0) meters.
Please note: if applicable and if sufficient data are available, create one map for each aquifer / layer.
Map: raster format or isolines (shape-file)
Unit
[m]
Priority for data collection
2 (used in 10 additional indicators)
Available global datasets
[-]
Sub-questions / metainformation
B.5. Vertical thickness of the aquifer (system) including aquitards / aquicludes
Description Format
The vertical thickness of the aquifer (system) is the distance between the top and the bottom of the aquifer (system) formation.
Please note: for aquifer systems maps should be provided for each aquifer layer and each aquitard / aquiclude.
Map: raster format or isolines
Unit
[m]
Priority for data collection
2 (used in 10 additional indicators)
Available global datasets
[-]
Sub-questions / metainformation
B.6. Degree of confinement
Description Format
Indicate for each aquifer the degree of confinement:
Whole aquifer unconfined Whole aquifer confined Whole aquifer semi-confined Aquifer mostly unconfined but some parts confined Aquifer mostly confined but some parts unconfined Aquifer mostly semi-confined but some parts unconfined
Preferably which part of (each) aquifer is unconfined, confined or semi-confined needs to be clearly indicated on a map.
Text
Map: raster format or polygons
Unit
[-]
Priority for data collection
2 (used in 10 additional indicators)
Available global datasets
[-]
Sub-questions / metainformation
B.7. Representative cross sections
Description Format
Cross sections are powerful tools to visualise sub-surface structures and Format: high resolution
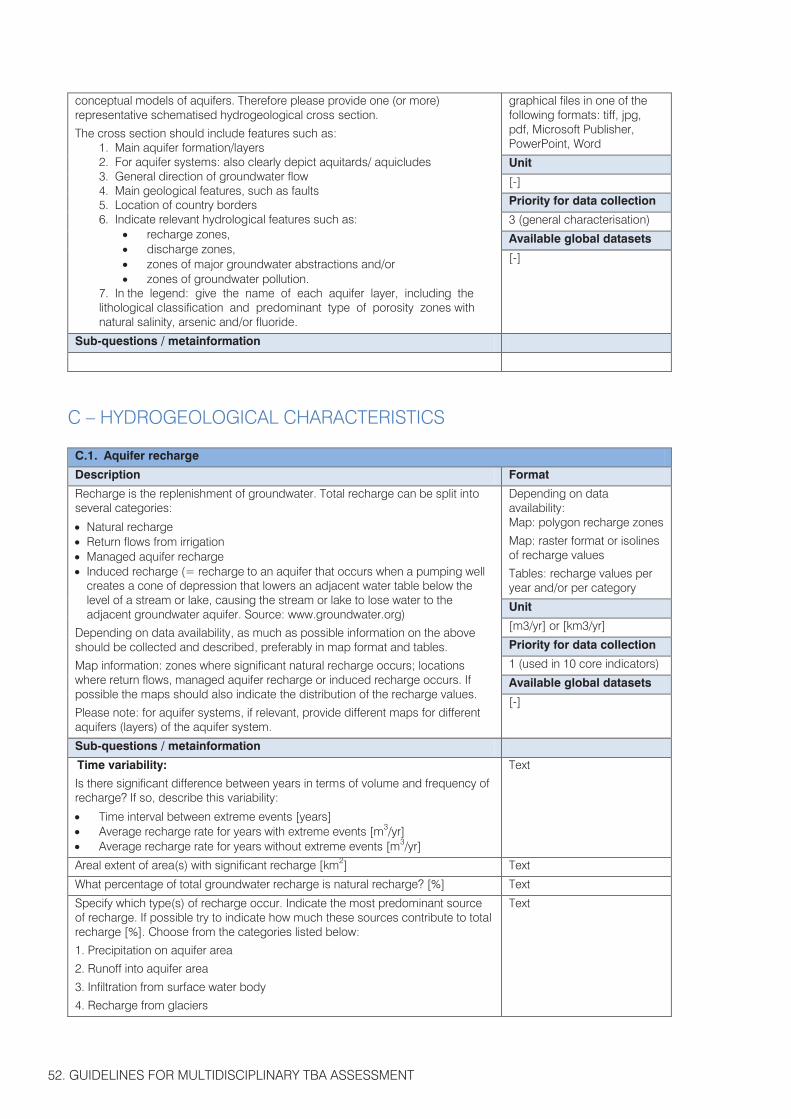
52. GUIDELINES FOR MULTIDISCIPLINARY TBA ASSESSMENT
conceptual models of aquifers. Therefore please provide one (or more) representative schematised hydrogeological cross section.
The cross section should include features such as: 1. Main aquifer formation/layers 2. For aquifer systems: also clearly depict aquitards/ aquicludes 3. General direction of groundwater flow 4. Main geological features, such as faults 5. Location of country borders 6. Indicate relevant hydrological features such as:
recharge zones, discharge zones, zones of major groundwater abstractions and/or zones of groundwater pollution.
7. In the legend: give the name of each aquifer layer, including the lithological classification and predominant type of porosity zones with natural salinity, arsenic and/or fluoride.
graphical files in one of the following formats: tiff, jpg, pdf, Microsoft Publisher, PowerPoint, Word
Unit
[-]
Priority for data collection
3 (general characterisation)
Available global datasets
[-]
Sub-questions / metainformation
C – HYDROGEOLOGICAL CHARACTERISTICS
C.1. Aquifer recharge
Description Format
Recharge is the replenishment of groundwater. Total recharge can be split into several categories:
Natural recharge Return flows from irrigation Managed aquifer recharge Induced recharge (= recharge to an aquifer that occurs when a pumping well
creates a cone of depression that lowers an adjacent water table below the level of a stream or lake, causing the stream or lake to lose water to the adjacent groundwater aquifer. Source: www.groundwater.org)
Depending on data availability, as much as possible information on the above should be collected and described, preferably in map format and tables.
Map information: zones where significant natural recharge occurs; locations where return flows, managed aquifer recharge or induced recharge occurs. If possible the maps should also indicate the distribution of the recharge values.
Please note: for aquifer systems, if relevant, provide different maps for different aquifers (layers) of the aquifer system.
Depending on data availability: Map: polygon recharge zones
Map: raster format or isolines of recharge values
Tables: recharge values per year and/or per category
Unit
[m3/yr] or [km3/yr]
Priority for data collection
1 (used in 10 core indicators)
Available global datasets
[-]
Sub-questions / metainformation
Time variability:
Is there significant difference between years in terms of volume and frequency of recharge? If so, describe this variability:
Time interval between extreme events [years] Average recharge rate for years with extreme events [m3/yr] Average recharge rate for years without extreme events [m3/yr]
Text
Areal extent of area(s) with significant recharge [km2] Text
What percentage of total groundwater recharge is natural recharge? [%] Text
Specify which type(s) of recharge occur. Indicate the most predominant source of recharge. If possible try to indicate how much these sources contribute to total recharge [%]. Choose from the categories listed below:
1. Precipitation on aquifer area
2. Runoff into aquifer area
3. Infiltration from surface water body
4. Recharge from glaciers
Text
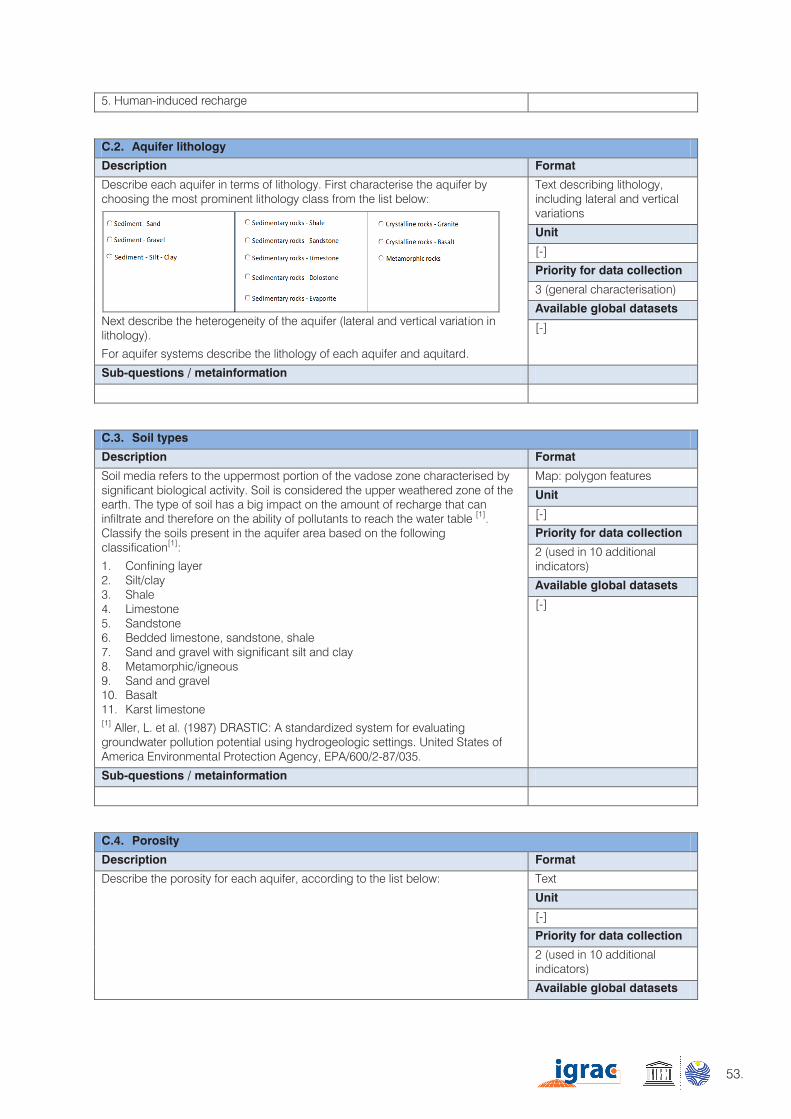
53.
conceptual models of aquifers. Therefore please provide one (or more) representative schematised hydrogeological cross section.
The cross section should include features such as: 1. Main aquifer formation/layers 2. For aquifer systems: also clearly depict aquitards/ aquicludes 3. General direction of groundwater flow 4. Main geological features, such as faults 5. Location of country borders 6. Indicate relevant hydrological features such as:
recharge zones, discharge zones, zones of major groundwater abstractions and/or zones of groundwater pollution.
7. In the legend: give the name of each aquifer layer, including the lithological classification and predominant type of porosity zones with natural salinity, arsenic and/or fluoride.
graphical files in one of the following formats: tiff, jpg, pdf, Microsoft Publisher, PowerPoint, Word
Unit
[-]
Priority for data collection
3 (general characterisation)
Available global datasets
[-]
Sub-questions / metainformation
C – HYDROGEOLOGICAL CHARACTERISTICS
C.1. Aquifer recharge
Description Format
Recharge is the replenishment of groundwater. Total recharge can be split into several categories:
Natural recharge Return flows from irrigation Managed aquifer recharge Induced recharge (= recharge to an aquifer that occurs when a pumping well
creates a cone of depression that lowers an adjacent water table below the level of a stream or lake, causing the stream or lake to lose water to the adjacent groundwater aquifer. Source: www.groundwater.org)
Depending on data availability, as much as possible information on the above should be collected and described, preferably in map format and tables.
Map information: zones where significant natural recharge occurs; locations where return flows, managed aquifer recharge or induced recharge occurs. If possible the maps should also indicate the distribution of the recharge values.
Please note: for aquifer systems, if relevant, provide different maps for different aquifers (layers) of the aquifer system.
Depending on data availability: Map: polygon recharge zones
Map: raster format or isolines of recharge values
Tables: recharge values per year and/or per category
Unit
[m3/yr] or [km3/yr]
Priority for data collection
1 (used in 10 core indicators)
Available global datasets
[-]
Sub-questions / metainformation
Time variability:
Is there significant difference between years in terms of volume and frequency of recharge? If so, describe this variability:
Time interval between extreme events [years] Average recharge rate for years with extreme events [m3/yr] Average recharge rate for years without extreme events [m3/yr]
Text
Areal extent of area(s) with significant recharge [km2] Text
What percentage of total groundwater recharge is natural recharge? [%] Text
Specify which type(s) of recharge occur. Indicate the most predominant source of recharge. If possible try to indicate how much these sources contribute to total recharge [%]. Choose from the categories listed below:
1. Precipitation on aquifer area
2. Runoff into aquifer area
3. Infiltration from surface water body
4. Recharge from glaciers
Text
5. Human-induced recharge
C.2. Aquifer lithology
Description Format
Describe each aquifer in terms of lithology. First characterise the aquifer by choosing the most prominent lithology class from the list below:
Next describe the heterogeneity of the aquifer (lateral and vertical variation in lithology).
For aquifer systems describe the lithology of each aquifer and aquitard.
Text describing lithology, including lateral and vertical variations
Unit
[-]
Priority for data collection
3 (general characterisation)
Available global datasets
[-]
Sub-questions / metainformation
C.3. Soil types
Description Format
Soil media refers to the uppermost portion of the vadose zone characterised by significant biological activity. Soil is considered the upper weathered zone of the earth. The type of soil has a big impact on the amount of recharge that can infiltrate and therefore on the ability of pollutants to reach the water table [1]. Classify the soils present in the aquifer area based on the following classification[1]:
1. Confining layer 2. Silt/clay 3. Shale 4. Limestone 5. Sandstone 6. Bedded limestone, sandstone, shale 7. Sand and gravel with significant silt and clay 8. Metamorphic/igneous 9. Sand and gravel 10. Basalt 11. Karst limestone [1] Aller, L. et al. (1987) DRASTIC: A standardized system for evaluating groundwater pollution potential using hydrogeologic settings. United States of America Environmental Protection Agency, EPA/600/2-87/035.
Map: polygon features
Unit
[-]
Priority for data collection
2 (used in 10 additional indicators)
Available global datasets
[-]
Sub-questions / metainformation
C.4. Porosity
Description Format
Describe the porosity for each aquifer, according to the list below: Text
Unit
[-]
Priority for data collection
2 (used in 10 additional indicators)
Available global datasets
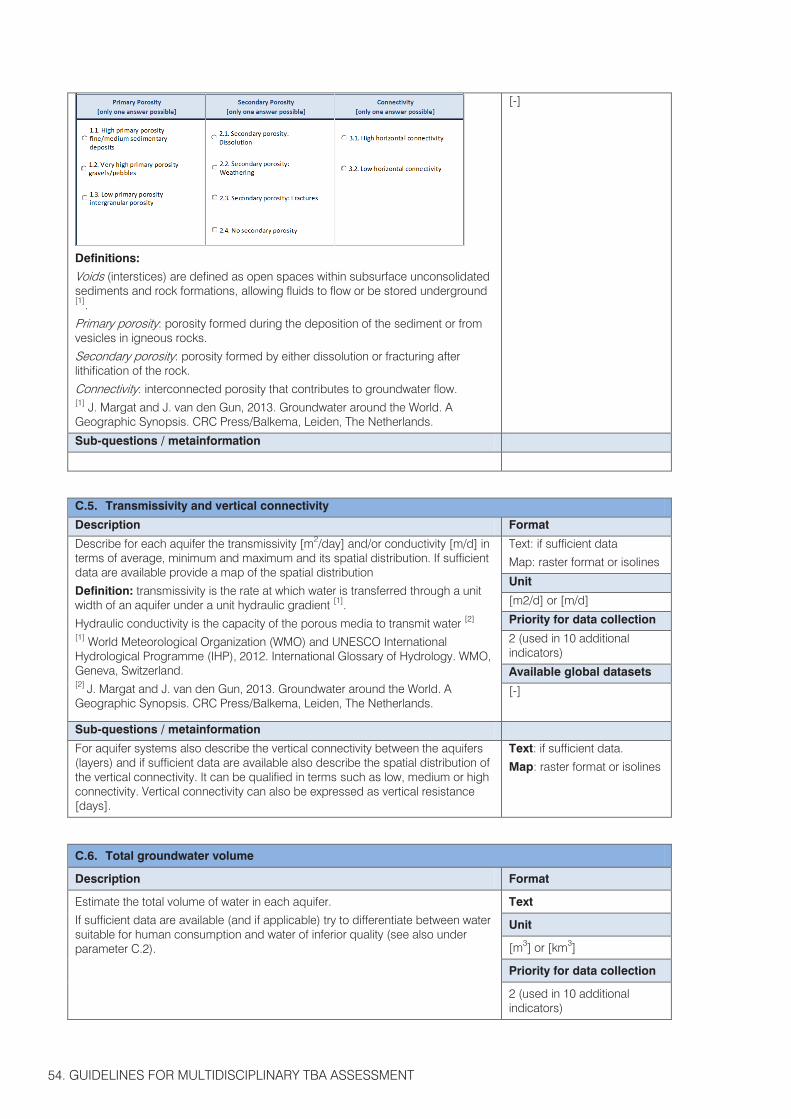
54. GUIDELINES FOR MULTIDISCIPLINARY TBA ASSESSMENT
Definitions:
Voids (interstices) are defined as open spaces within subsurface unconsolidated sediments and rock formations, allowing fluids to flow or be stored underground [1].
Primary porosity: porosity formed during the deposition of the sediment or from vesicles in igneous rocks.
Secondary porosity: porosity formed by either dissolution or fracturing after lithification of the rock.
Connectivity: interconnected porosity that contributes to groundwater flow. [1] J. Margat and J. van den Gun, 2013. Groundwater around the World. A Geographic Synopsis. CRC Press/Balkema, Leiden, The Netherlands.
[-]
Sub-questions / metainformation
C.5. Transmissivity and vertical connectivity
Description Format
Describe for each aquifer the transmissivity [m2/day] and/or conductivity [m/d] in terms of average, minimum and maximum and its spatial distribution. If sufficient data are available provide a map of the spatial distribution
Definition: transmissivity is the rate at which water is transferred through a unit width of an aquifer under a unit hydraulic gradient [1].
Hydraulic conductivity is the capacity of the porous media to transmit water [2] [1] World Meteorological Organization (WMO) and UNESCO International Hydrological Programme (IHP), 2012. International Glossary of Hydrology. WMO, Geneva, Switzerland. [2] J. Margat and J. van den Gun, 2013. Groundwater around the World. A Geographic Synopsis. CRC Press/Balkema, Leiden, The Netherlands.
Text: if sufficient data
Map: raster format or isolines
Unit
[m2/d] or [m/d]
Priority for data collection
2 (used in 10 additional indicators)
Available global datasets
[-]
Sub-questions / metainformation
For aquifer systems also describe the vertical connectivity between the aquifers (layers) and if sufficient data are available also describe the spatial distribution of the vertical connectivity. It can be qualified in terms such as low, medium or high connectivity. Vertical connectivity can also be expressed as vertical resistance [days].
Text: if sufficient data.
Map: raster format or isolines
C.6. Total groundwater volume
Description Format
Estimate the total volume of water in each aquifer.
If sufficient data are available (and if applicable) try to differentiate between water suitable for human consumption and water of inferior quality (see also under parameter C.2).
Text
Unit
[m3] or [km3]
Priority for data collection
2 (used in 10 additional indicators)
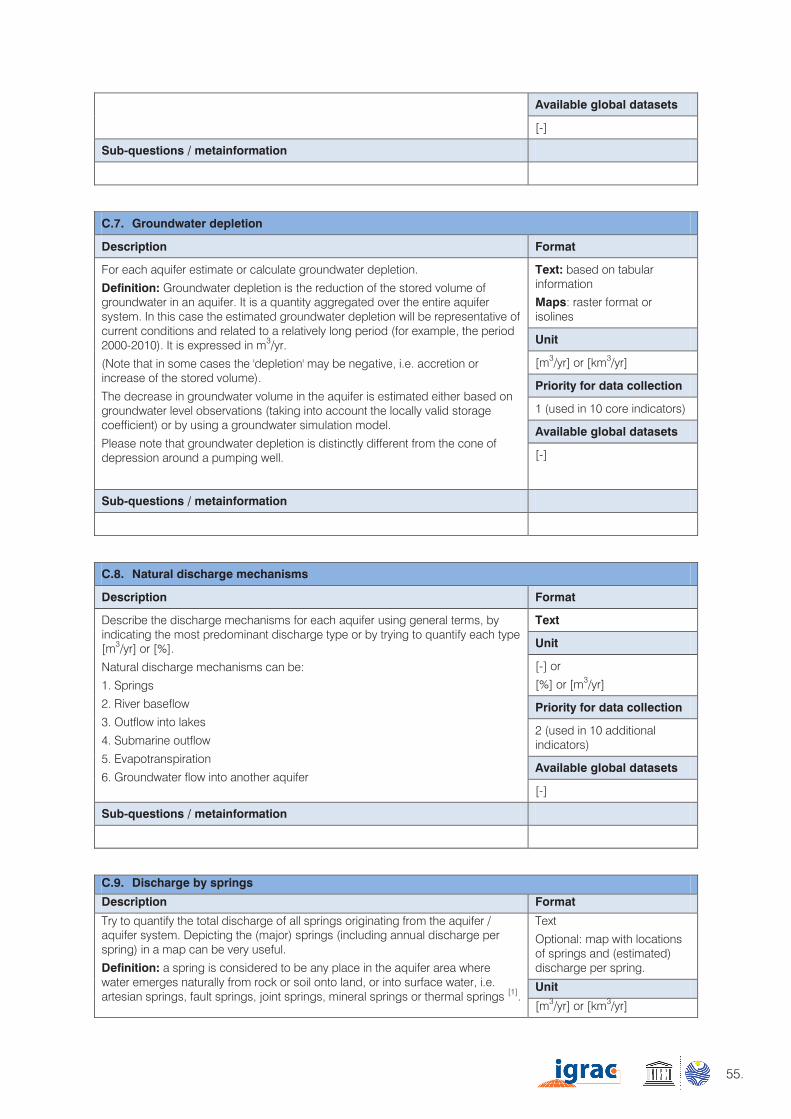
55.
Definitions:
Voids (interstices) are defined as open spaces within subsurface unconsolidated sediments and rock formations, allowing fluids to flow or be stored underground [1].
Primary porosity: porosity formed during the deposition of the sediment or from vesicles in igneous rocks.
Secondary porosity: porosity formed by either dissolution or fracturing after lithification of the rock.
Connectivity: interconnected porosity that contributes to groundwater flow. [1] J. Margat and J. van den Gun, 2013. Groundwater around the World. A Geographic Synopsis. CRC Press/Balkema, Leiden, The Netherlands.
[-]
Sub-questions / metainformation
C.5. Transmissivity and vertical connectivity
Description Format
Describe for each aquifer the transmissivity [m2/day] and/or conductivity [m/d] in terms of average, minimum and maximum and its spatial distribution. If sufficient data are available provide a map of the spatial distribution
Definition: transmissivity is the rate at which water is transferred through a unit width of an aquifer under a unit hydraulic gradient [1].
Hydraulic conductivity is the capacity of the porous media to transmit water [2] [1] World Meteorological Organization (WMO) and UNESCO International Hydrological Programme (IHP), 2012. International Glossary of Hydrology. WMO, Geneva, Switzerland. [2] J. Margat and J. van den Gun, 2013. Groundwater around the World. A Geographic Synopsis. CRC Press/Balkema, Leiden, The Netherlands.
Text: if sufficient data
Map: raster format or isolines
Unit
[m2/d] or [m/d]
Priority for data collection
2 (used in 10 additional indicators)
Available global datasets
[-]
Sub-questions / metainformation
For aquifer systems also describe the vertical connectivity between the aquifers (layers) and if sufficient data are available also describe the spatial distribution of the vertical connectivity. It can be qualified in terms such as low, medium or high connectivity. Vertical connectivity can also be expressed as vertical resistance [days].
Text: if sufficient data.
Map: raster format or isolines
C.6. Total groundwater volume
Description Format
Estimate the total volume of water in each aquifer.
If sufficient data are available (and if applicable) try to differentiate between water suitable for human consumption and water of inferior quality (see also under parameter C.2).
Text
Unit
[m3] or [km3]
Priority for data collection
2 (used in 10 additional indicators)
Available global datasets
[-]
Sub-questions / metainformation
C.7. Groundwater depletion
Description Format
For each aquifer estimate or calculate groundwater depletion.
Definition: Groundwater depletion is the reduction of the stored volume of groundwater in an aquifer. It is a quantity aggregated over the entire aquifer system. In this case the estimated groundwater depletion will be representative of current conditions and related to a relatively long period (for example, the period 2000-2010). It is expressed in m3/yr.
(Note that in some cases the 'depletion' may be negative, i.e. accretion or increase of the stored volume).
The decrease in groundwater volume in the aquifer is estimated either based on groundwater level observations (taking into account the locally valid storage coefficient) or by using a groundwater simulation model.
Please note that groundwater depletion is distinctly different from the cone of depression around a pumping well.
Text: based on tabular information
Maps: raster format or isolines
Unit
[m3/yr] or [km3/yr]
Priority for data collection
1 (used in 10 core indicators)
Available global datasets
[-]
Sub-questions / metainformation
C.8. Natural discharge mechanisms
Description Format
Describe the discharge mechanisms for each aquifer using general terms, by indicating the most predominant discharge type or by trying to quantify each type [m3/yr] or [%].
Natural discharge mechanisms can be:
1. Springs
2. River baseflow
3. Outflow into lakes
4. Submarine outflow
5. Evapotranspiration
6. Groundwater flow into another aquifer
Text
Unit
[-] or
[%] or [m3/yr]
Priority for data collection
2 (used in 10 additional indicators)
Available global datasets
[-]
Sub-questions / metainformation
C.9. Discharge by springs
Description Format
Try to quantify the total discharge of all springs originating from the aquifer / aquifer system. Depicting the (major) springs (including annual discharge per spring) in a map can be very useful.
Definition: a spring is considered to be any place in the aquifer area where water emerges naturally from rock or soil onto land, or into surface water, i.e. artesian springs, fault springs, joint springs, mineral springs or thermal springs [1].
Text
Optional: map with locations of springs and (estimated) discharge per spring.
Unit
[m3/yr] or [km3/yr]
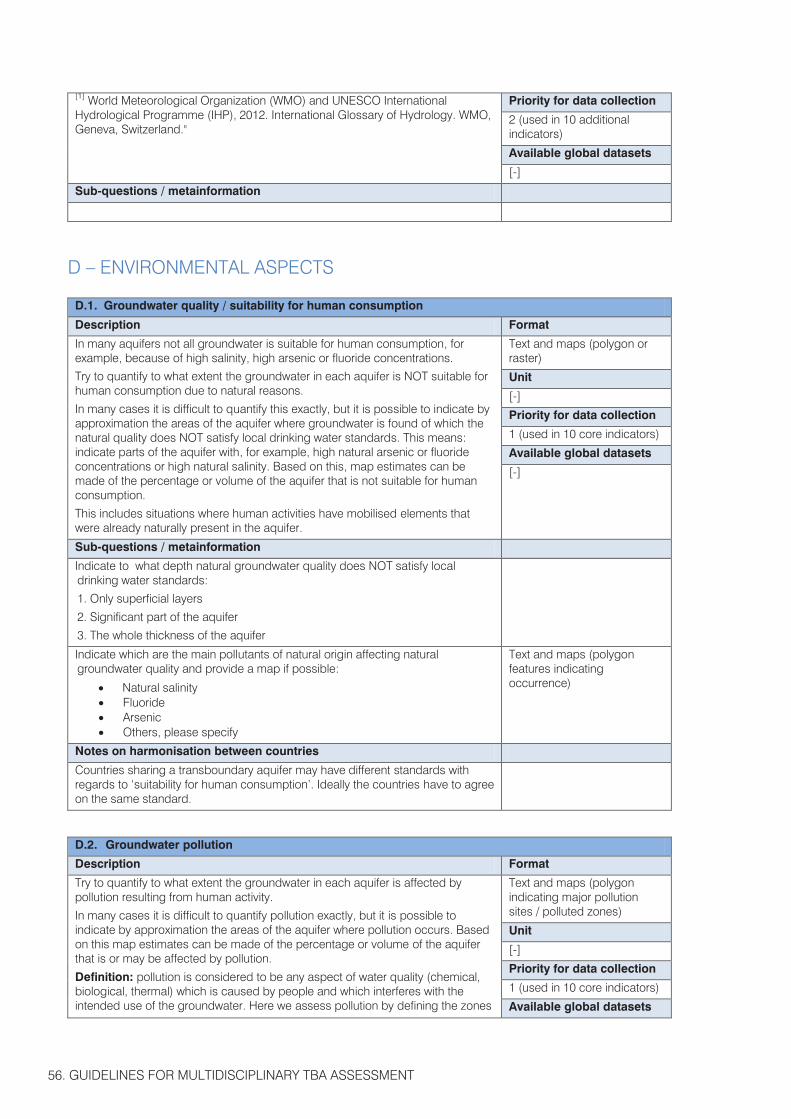
56. GUIDELINES FOR MULTIDISCIPLINARY TBA ASSESSMENT
[1] World Meteorological Organization (WMO) and UNESCO International Hydrological Programme (IHP), 2012. International Glossary of Hydrology. WMO, Geneva, Switzerland."
Priority for data collection
2 (used in 10 additional indicators)
Available global datasets
[-]
Sub-questions / metainformation
D – ENVIRONMENTAL ASPECTS
D.1. Groundwater quality / suitability for human consumption
Description Format
In many aquifers not all groundwater is suitable for human consumption, for example, because of high salinity, high arsenic or fluoride concentrations.
Try to quantify to what extent the groundwater in each aquifer is NOT suitable for human consumption due to natural reasons.
In many cases it is difficult to quantify this exactly, but it is possible to indicate by approximation the areas of the aquifer where groundwater is found of which the natural quality does NOT satisfy local drinking water standards. This means: indicate parts of the aquifer with, for example, high natural arsenic or fluoride concentrations or high natural salinity. Based on this, map estimates can be made of the percentage or volume of the aquifer that is not suitable for human consumption.
This includes situations where human activities have mobilised elements that were already naturally present in the aquifer.
Text and maps (polygon or raster)
Unit
[-]
Priority for data collection
1 (used in 10 core indicators)
Available global datasets
[-]
Sub-questions / metainformation
Indicate to what depth natural groundwater quality does NOT satisfy local drinking water standards:
1. Only superficial layers
2. Significant part of the aquifer
3. The whole thickness of the aquifer
Indicate which are the main pollutants of natural origin affecting natural groundwater quality and provide a map if possible:
Natural salinity Fluoride Arsenic Others, please specify
Text and maps (polygon features indicating occurrence)
Notes on harmonisation between countries
Countries sharing a transboundary aquifer may have different standards with regards to ‘suitability for human consumption’. Ideally the countries have to agree on the same standard.
D.2. Groundwater pollution
Description Format
Try to quantify to what extent the groundwater in each aquifer is affected by pollution resulting from human activity.
In many cases it is difficult to quantify pollution exactly, but it is possible to indicate by approximation the areas of the aquifer where pollution occurs. Based on this map estimates can be made of the percentage or volume of the aquifer that is or may be affected by pollution.
Definition: pollution is considered to be any aspect of water quality (chemical, biological, thermal) which is caused by people and which interferes with the intended use of the groundwater. Here we assess pollution by defining the zones
Text and maps (polygon indicating major pollution sites / polluted zones)
Unit
[-]
Priority for data collection
1 (used in 10 core indicators)
Available global datasets
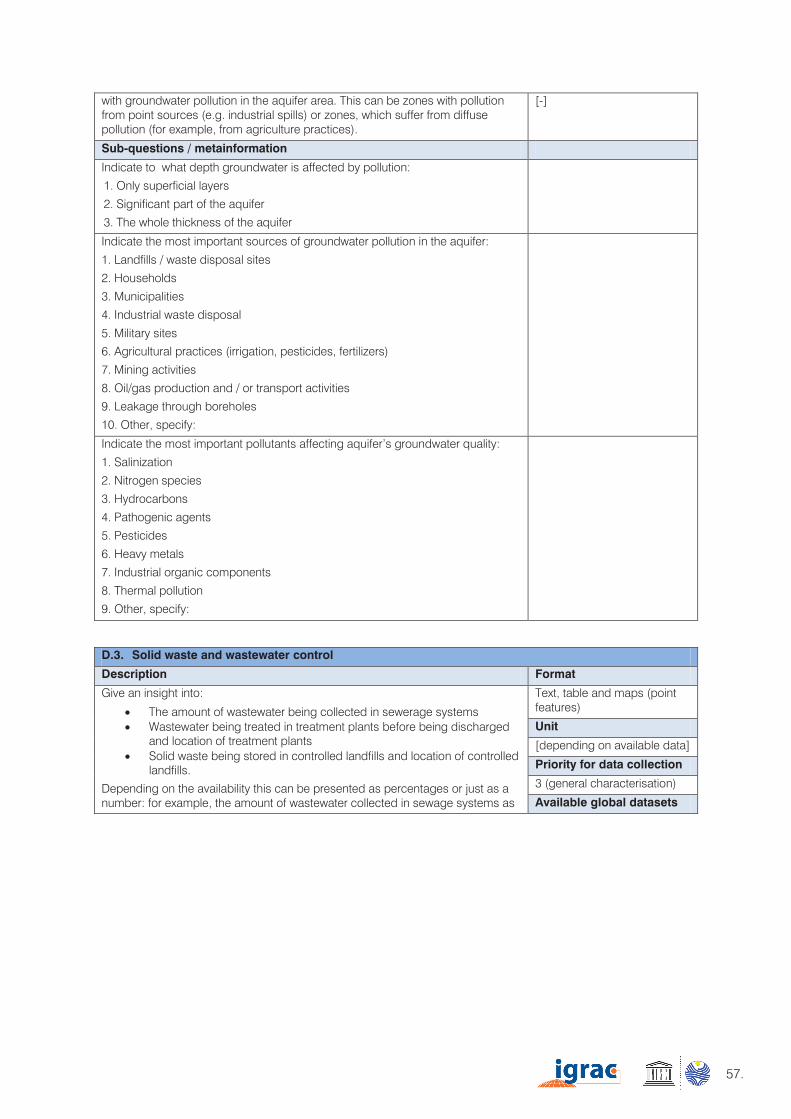
57.
[1] World Meteorological Organization (WMO) and UNESCO International Hydrological Programme (IHP), 2012. International Glossary of Hydrology. WMO, Geneva, Switzerland."
Priority for data collection
2 (used in 10 additional indicators)
Available global datasets
[-]
Sub-questions / metainformation
D – ENVIRONMENTAL ASPECTS
D.1. Groundwater quality / suitability for human consumption
Description Format
In many aquifers not all groundwater is suitable for human consumption, for example, because of high salinity, high arsenic or fluoride concentrations.
Try to quantify to what extent the groundwater in each aquifer is NOT suitable for human consumption due to natural reasons.
In many cases it is difficult to quantify this exactly, but it is possible to indicate by approximation the areas of the aquifer where groundwater is found of which the natural quality does NOT satisfy local drinking water standards. This means: indicate parts of the aquifer with, for example, high natural arsenic or fluoride concentrations or high natural salinity. Based on this, map estimates can be made of the percentage or volume of the aquifer that is not suitable for human consumption.
This includes situations where human activities have mobilised elements that were already naturally present in the aquifer.
Text and maps (polygon or raster)
Unit
[-]
Priority for data collection
1 (used in 10 core indicators)
Available global datasets
[-]
Sub-questions / metainformation
Indicate to what depth natural groundwater quality does NOT satisfy local drinking water standards:
1. Only superficial layers
2. Significant part of the aquifer
3. The whole thickness of the aquifer
Indicate which are the main pollutants of natural origin affecting natural groundwater quality and provide a map if possible:
Natural salinity Fluoride Arsenic Others, please specify
Text and maps (polygon features indicating occurrence)
Notes on harmonisation between countries
Countries sharing a transboundary aquifer may have different standards with regards to ‘suitability for human consumption’. Ideally the countries have to agree on the same standard.
D.2. Groundwater pollution
Description Format
Try to quantify to what extent the groundwater in each aquifer is affected by pollution resulting from human activity.
In many cases it is difficult to quantify pollution exactly, but it is possible to indicate by approximation the areas of the aquifer where pollution occurs. Based on this map estimates can be made of the percentage or volume of the aquifer that is or may be affected by pollution.
Definition: pollution is considered to be any aspect of water quality (chemical, biological, thermal) which is caused by people and which interferes with the intended use of the groundwater. Here we assess pollution by defining the zones
Text and maps (polygon indicating major pollution sites / polluted zones)
Unit
[-]
Priority for data collection
1 (used in 10 core indicators)
Available global datasets
with groundwater pollution in the aquifer area. This can be zones with pollution from point sources (e.g. industrial spills) or zones, which suffer from diffuse pollution (for example, from agriculture practices).
[-]
Sub-questions / metainformation
Indicate to what depth groundwater is affected by pollution:
1. Only superficial layers
2. Significant part of the aquifer
3. The whole thickness of the aquifer
Indicate the most important sources of groundwater pollution in the aquifer:
1. Landfills / waste disposal sites
2. Households
3. Municipalities
4. Industrial waste disposal
5. Military sites
6. Agricultural practices (irrigation, pesticides, fertilizers)
7. Mining activities
8. Oil/gas production and / or transport activities
9. Leakage through boreholes
10. Other, specify:
Indicate the most important pollutants affecting aquifer’s groundwater quality:
1. Salinization
2. Nitrogen species
3. Hydrocarbons
4. Pathogenic agents
5. Pesticides
6. Heavy metals
7. Industrial organic components
8. Thermal pollution
9. Other, specify:
D.3. Solid waste and wastewater control
Description Format
Give an insight into:
The amount of wastewater being collected in sewerage systems Wastewater being treated in treatment plants before being discharged
and location of treatment plants Solid waste being stored in controlled landfills and location of controlled
landfills.
Depending on the availability this can be presented as percentages or just as a number: for example, the amount of wastewater collected in sewage systems as
Text, table and maps (point features)
Unit
[depending on available data]
Priority for data collection
3 (general characterisation)
Available global datasets
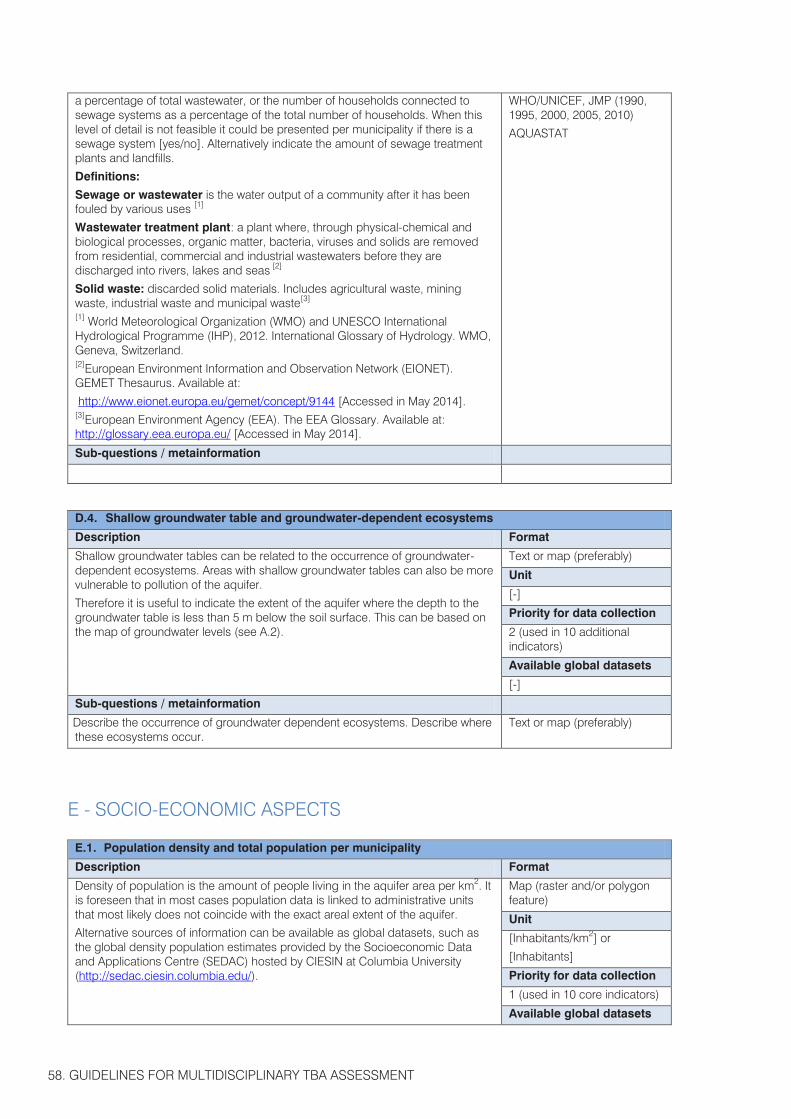
58. GUIDELINES FOR MULTIDISCIPLINARY TBA ASSESSMENT
a percentage of total wastewater, or the number of households connected to sewage systems as a percentage of the total number of households. When this level of detail is not feasible it could be presented per municipality if there is a sewage system [yes/no]. Alternatively indicate the amount of sewage treatment plants and landfills.
Definitions:
Sewage or wastewater is the water output of a community after it has been fouled by various uses [1]
Wastewater treatment plant: a plant where, through physical-chemical and biological processes, organic matter, bacteria, viruses and solids are removed from residential, commercial and industrial wastewaters before they are discharged into rivers, lakes and seas [2]
Solid waste: discarded solid materials. Includes agricultural waste, mining waste, industrial waste and municipal waste[3] [1] World Meteorological Organization (WMO) and UNESCO International Hydrological Programme (IHP), 2012. International Glossary of Hydrology. WMO, Geneva, Switzerland. [2]European Environment Information and Observation Network (EIONET). GEMET Thesaurus. Available at:
http://www.eionet.europa.eu/gemet/concept/9144 [Accessed in May 2014]. [3]European Environment Agency (EEA). The EEA Glossary. Available at: http://glossary.eea.europa.eu/ [Accessed in May 2014].
WHO/UNICEF, JMP (1990, 1995, 2000, 2005, 2010)
AQUASTAT
Sub-questions / metainformation
D.4. Shallow groundwater table and groundwater-dependent ecosystems
Description Format
Shallow groundwater tables can be related to the occurrence of groundwater-dependent ecosystems. Areas with shallow groundwater tables can also be more vulnerable to pollution of the aquifer.
Therefore it is useful to indicate the extent of the aquifer where the depth to the groundwater table is less than 5 m below the soil surface. This can be based on the map of groundwater levels (see A.2).
Text or map (preferably)
Unit
[-]
Priority for data collection
2 (used in 10 additional indicators)
Available global datasets
[-]
Sub-questions / metainformation
Describe the occurrence of groundwater dependent ecosystems. Describe where these ecosystems occur.
Text or map (preferably)
E - SOCIO-ECONOMIC ASPECTS
E.1. Population density and total population per municipality
Description Format
Density of population is the amount of people living in the aquifer area per km2. It is foreseen that in most cases population data is linked to administrative units that most likely does not coincide with the exact areal extent of the aquifer.
Alternative sources of information can be available as global datasets, such as the global density population estimates provided by the Socioeconomic Data and Applications Centre (SEDAC) hosted by CIESIN at Columbia University (http://sedac.ciesin.columbia.edu/).
Map (raster and/or polygon feature)
Unit
[Inhabitants/km2] or
[Inhabitants]
Priority for data collection
1 (used in 10 core indicators)
Available global datasets
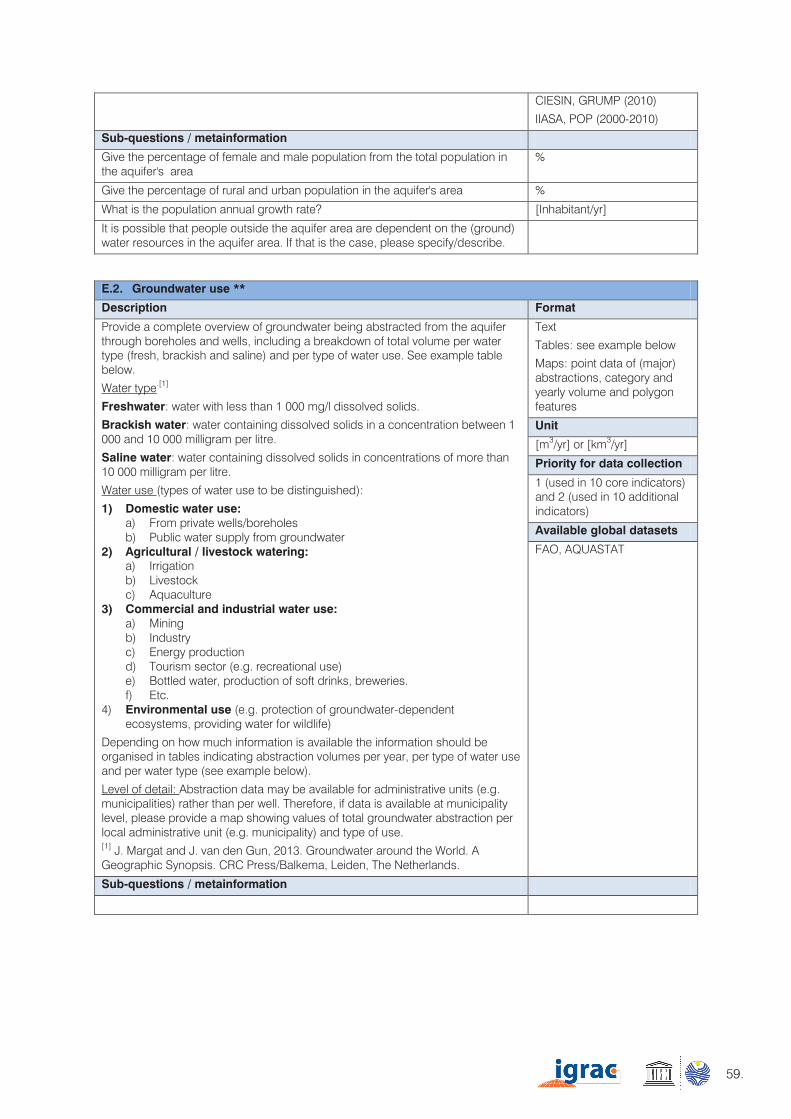
59.
a percentage of total wastewater, or the number of households connected to sewage systems as a percentage of the total number of households. When this level of detail is not feasible it could be presented per municipality if there is a sewage system [yes/no]. Alternatively indicate the amount of sewage treatment plants and landfills.
Definitions:
Sewage or wastewater is the water output of a community after it has been fouled by various uses [1]
Wastewater treatment plant: a plant where, through physical-chemical and biological processes, organic matter, bacteria, viruses and solids are removed from residential, commercial and industrial wastewaters before they are discharged into rivers, lakes and seas [2]
Solid waste: discarded solid materials. Includes agricultural waste, mining waste, industrial waste and municipal waste[3] [1] World Meteorological Organization (WMO) and UNESCO International Hydrological Programme (IHP), 2012. International Glossary of Hydrology. WMO, Geneva, Switzerland. [2]European Environment Information and Observation Network (EIONET). GEMET Thesaurus. Available at:
http://www.eionet.europa.eu/gemet/concept/9144 [Accessed in May 2014]. [3]European Environment Agency (EEA). The EEA Glossary. Available at: http://glossary.eea.europa.eu/ [Accessed in May 2014].
WHO/UNICEF, JMP (1990, 1995, 2000, 2005, 2010)
AQUASTAT
Sub-questions / metainformation
D.4. Shallow groundwater table and groundwater-dependent ecosystems
Description Format
Shallow groundwater tables can be related to the occurrence of groundwater-dependent ecosystems. Areas with shallow groundwater tables can also be more vulnerable to pollution of the aquifer.
Therefore it is useful to indicate the extent of the aquifer where the depth to the groundwater table is less than 5 m below the soil surface. This can be based on the map of groundwater levels (see A.2).
Text or map (preferably)
Unit
[-]
Priority for data collection
2 (used in 10 additional indicators)
Available global datasets
[-]
Sub-questions / metainformation
Describe the occurrence of groundwater dependent ecosystems. Describe where these ecosystems occur.
Text or map (preferably)
E - SOCIO-ECONOMIC ASPECTS
E.1. Population density and total population per municipality
Description Format
Density of population is the amount of people living in the aquifer area per km2. It is foreseen that in most cases population data is linked to administrative units that most likely does not coincide with the exact areal extent of the aquifer.
Alternative sources of information can be available as global datasets, such as the global density population estimates provided by the Socioeconomic Data and Applications Centre (SEDAC) hosted by CIESIN at Columbia University (http://sedac.ciesin.columbia.edu/).
Map (raster and/or polygon feature)
Unit
[Inhabitants/km2] or
[Inhabitants]
Priority for data collection
1 (used in 10 core indicators)
Available global datasets
CIESIN, GRUMP (2010)
IIASA, POP (2000-2010)
Sub-questions / metainformation
Give the percentage of female and male population from the total population in the aquifer's area
%
Give the percentage of rural and urban population in the aquifer's area %
What is the population annual growth rate? [Inhabitant/yr]
It is possible that people outside the aquifer area are dependent on the (ground) water resources in the aquifer area. If that is the case, please specify/describe.
E.2. Groundwater use **
Description Format
Provide a complete overview of groundwater being abstracted from the aquifer through boreholes and wells, including a breakdown of total volume per water type (fresh, brackish and saline) and per type of water use. See example table below.
Water type.[1]
Freshwater: water with less than 1 000 mg/l dissolved solids.
Brackish water: water containing dissolved solids in a concentration between 1 000 and 10 000 milligram per litre.
Saline water: water containing dissolved solids in concentrations of more than 10 000 milligram per litre.
Water use (types of water use to be distinguished):
1) Domestic water use: a) From private wells/boreholes b) Public water supply from groundwater
2) Agricultural / livestock watering: a) Irrigation b) Livestock c) Aquaculture
3) Commercial and industrial water use: a) Mining b) Industry c) Energy production d) Tourism sector (e.g. recreational use) e) Bottled water, production of soft drinks, breweries. f) Etc.
4) Environmental use (e.g. protection of groundwater-dependent ecosystems, providing water for wildlife)
Depending on how much information is available the information should be organised in tables indicating abstraction volumes per year, per type of water use and per water type (see example below).
Level of detail: Abstraction data may be available for administrative units (e.g. municipalities) rather than per well. Therefore, if data is available at municipality level, please provide a map showing values of total groundwater abstraction per local administrative unit (e.g. municipality) and type of use. [1] J. Margat and J. van den Gun, 2013. Groundwater around the World. A Geographic Synopsis. CRC Press/Balkema, Leiden, The Netherlands.
Text
Tables: see example below
Maps: point data of (major) abstractions, category and yearly volume and polygon features
Unit
[m3/yr] or [km3/yr]
Priority for data collection
1 (used in 10 core indicators) and 2 (used in 10 additional indicators)
Available global datasets
FAO, AQUASTAT
Sub-questions / metainformation
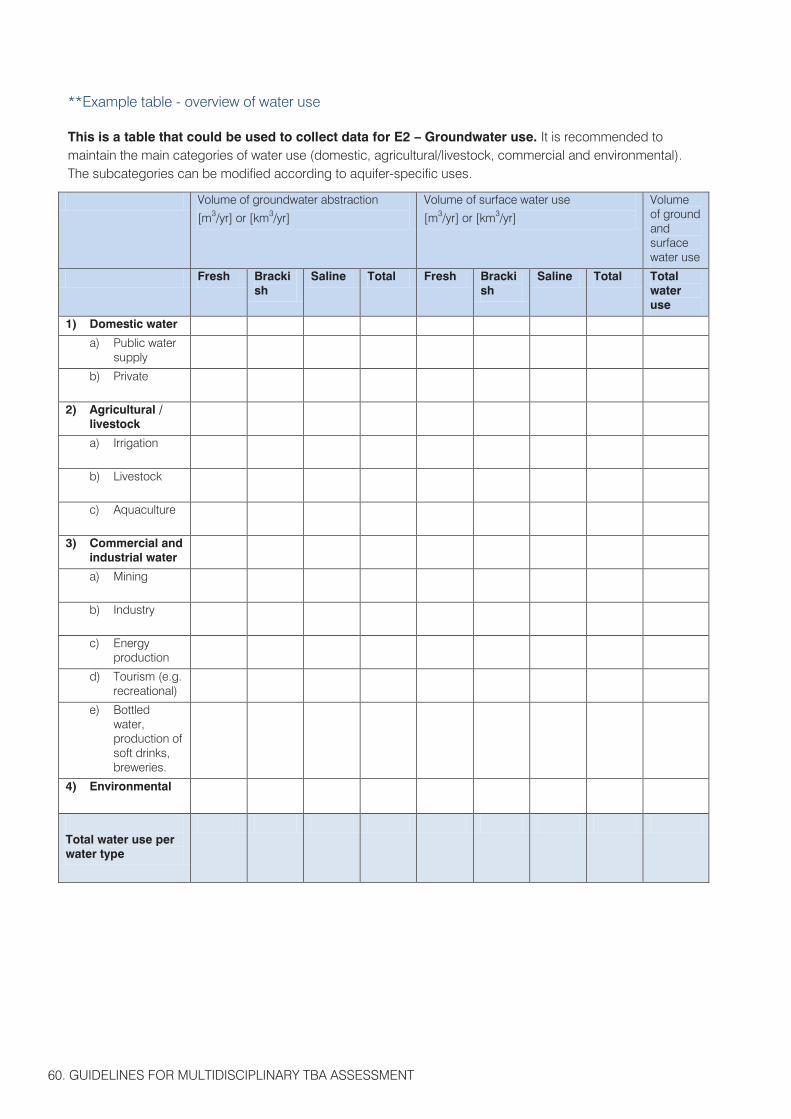
60. GUIDELINES FOR MULTIDISCIPLINARY TBA ASSESSMENT
**Example table - overview of water use
This is a table that could be used to collect data for E2 – Groundwater use. It is recommended to maintain the main categories of water use (domestic, agricultural/livestock, commercial and environmental). The subcategories can be modified according to aquifer-specific uses.
Volume of groundwater abstraction
[m3/yr] or [km3/yr]
Volume of surface water use
[m3/yr] or [km3/yr]
Volume of ground and surface water use
Fresh Brackish
Saline Total Fresh Brackish
Saline Total Total water use
1) Domestic water
a) Public water supply
b) Private
2) Agricultural / livestock
a) Irrigation
b) Livestock
c) Aquaculture
3) Commercial and industrial water
a) Mining
b) Industry
c) Energy production
d) Tourism (e.g. recreational)
e) Bottled water, production of soft drinks, breweries.
4) Environmental
Total water use per water type
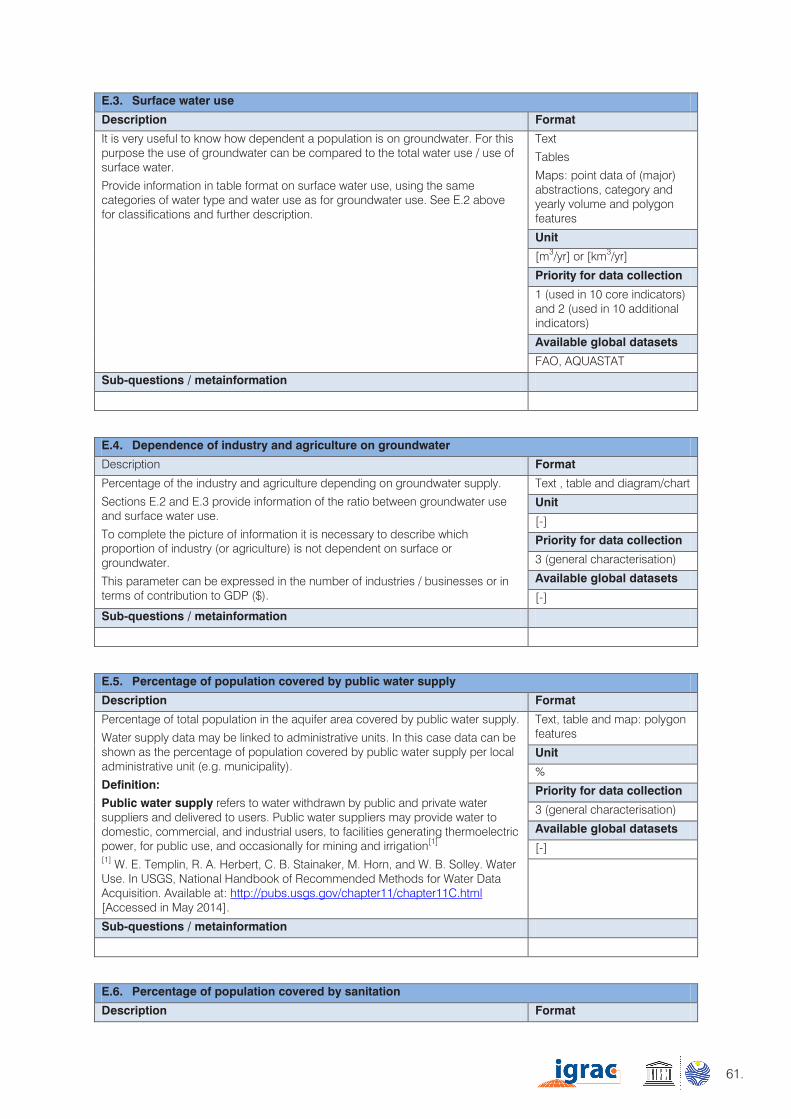
61.
**Example table - overview of water use
This is a table that could be used to collect data for E2 – Groundwater use. It is recommended to maintain the main categories of water use (domestic, agricultural/livestock, commercial and environmental). The subcategories can be modified according to aquifer-specific uses.
Volume of groundwater abstraction
[m3/yr] or [km3/yr]
Volume of surface water use
[m3/yr] or [km3/yr]
Volume of ground and surface water use
Fresh Brackish
Saline Total Fresh Brackish
Saline Total Total water use
1) Domestic water
a) Public water supply
b) Private
2) Agricultural / livestock
a) Irrigation
b) Livestock
c) Aquaculture
3) Commercial and industrial water
a) Mining
b) Industry
c) Energy production
d) Tourism (e.g. recreational)
e) Bottled water, production of soft drinks, breweries.
4) Environmental
Total water use per water type
E.3. Surface water use
Description Format
It is very useful to know how dependent a population is on groundwater. For this purpose the use of groundwater can be compared to the total water use / use of surface water.
Provide information in table format on surface water use, using the same categories of water type and water use as for groundwater use. See E.2 above for classifications and further description.
Text
Tables
Maps: point data of (major) abstractions, category and yearly volume and polygon features
Unit
[m3/yr] or [km3/yr]
Priority for data collection
1 (used in 10 core indicators) and 2 (used in 10 additional indicators)
Available global datasets
FAO, AQUASTAT
Sub-questions / metainformation
E.4. Dependence of industry and agriculture on groundwater
Description Format
Percentage of the industry and agriculture depending on groundwater supply.
Sections E.2 and E.3 provide information of the ratio between groundwater use and surface water use.
To complete the picture of information it is necessary to describe which proportion of industry (or agriculture) is not dependent on surface or groundwater.
This parameter can be expressed in the number of industries / businesses or in terms of contribution to GDP ($).
Text , table and diagram/chart
Unit
[-]
Priority for data collection
3 (general characterisation)
Available global datasets
[-]
Sub-questions / metainformation
E.5. Percentage of population covered by public water supply
Description Format
Percentage of total population in the aquifer area covered by public water supply.
Water supply data may be linked to administrative units. In this case data can be shown as the percentage of population covered by public water supply per local administrative unit (e.g. municipality).
Definition:
Public water supply refers to water withdrawn by public and private water suppliers and delivered to users. Public water suppliers may provide water to domestic, commercial, and industrial users, to facilities generating thermoelectric power, for public use, and occasionally for mining and irrigation[1]
[1] W. E. Templin, R. A. Herbert, C. B. Stainaker, M. Horn, and W. B. Solley. Water Use. In USGS, National Handbook of Recommended Methods for Water Data Acquisition. Available at: http://pubs.usgs.gov/chapter11/chapter11C.html [Accessed in May 2014].
Text, table and map: polygon features
Unit
%
Priority for data collection
3 (general characterisation)
Available global datasets
[-]
Sub-questions / metainformation
E.6. Percentage of population covered by sanitation
Description Format
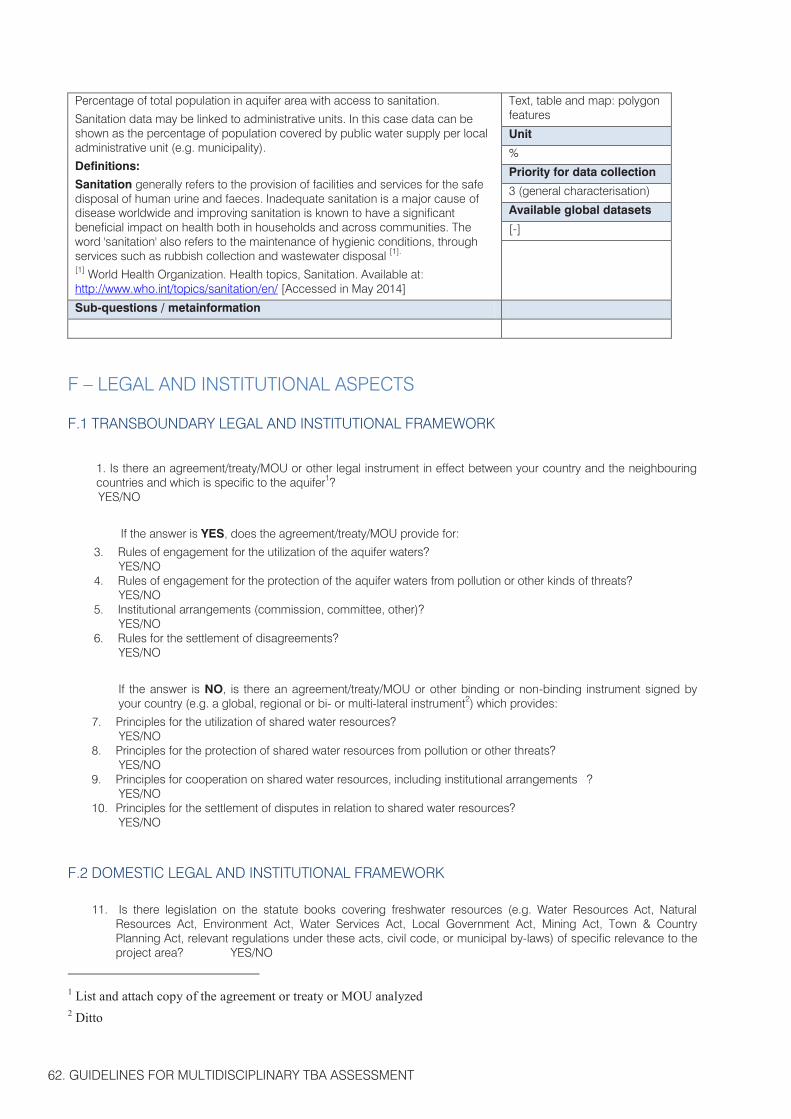
62. GUIDELINES FOR MULTIDISCIPLINARY TBA ASSESSMENT
Percentage of total population in aquifer area with access to sanitation.
Sanitation data may be linked to administrative units. In this case data can be shown as the percentage of population covered by public water supply per local administrative unit (e.g. municipality).
Definitions:
Sanitation generally refers to the provision of facilities and services for the safe disposal of human urine and faeces. Inadequate sanitation is a major cause of disease worldwide and improving sanitation is known to have a significant beneficial impact on health both in households and across communities. The word 'sanitation' also refers to the maintenance of hygienic conditions, through services such as rubbish collection and wastewater disposal [1]. [1] World Health Organization. Health topics, Sanitation. Available at: http://www.who.int/topics/sanitation/en/ [Accessed in May 2014]
Text, table and map: polygon features
Unit
%
Priority for data collection
3 (general characterisation)
Available global datasets
[-]
Sub-questions / metainformation
F – LEGAL AND INSTITUTIONAL ASPECTS
F.1 TRANSBOUNDARY LEGAL AND INSTITUTIONAL FRAMEWORK
1. Is there an agreement/treaty/MOU or other legal instrument in effect between your country and the neighbouring countries and which is specific to the aquifer1? YES/NO
If the answer is YES, does the agreement/treaty/MOU provide for:
3. Rules of engagement for the utilization of the aquifer waters? YES/NO
4. Rules of engagement for the protection of the aquifer waters from pollution or other kinds of threats? YES/NO
5. Institutional arrangements (commission, committee, other)? YES/NO
6. Rules for the settlement of disagreements? YES/NO
If the answer is NO, is there an agreement/treaty/MOU or other binding or non-binding instrument signed by your country (e.g. a global, regional or bi- or multi-lateral instrument2) which provides:
7. Principles for the utilization of shared water resources? YES/NO
8. Principles for the protection of shared water resources from pollution or other threats? YES/NO
9. Principles for cooperation on shared water resources, including institutional arrangements ? YES/NO
10. Principles for the settlement of disputes in relation to shared water resources? YES/NO
F.2 DOMESTIC LEGAL AND INSTITUTIONAL FRAMEWORK
11. Is there legislation on the statute books covering freshwater resources (e.g. Water Resources Act, Natural Resources Act, Environment Act, Water Services Act, Local Government Act, Mining Act, Town & Country Planning Act, relevant regulations under these acts, civil code, or municipal by-laws) of specific relevance to the project area? YES/NO
1 List and attach copy of the agreement or treaty or MOU analyzed 2 Ditto
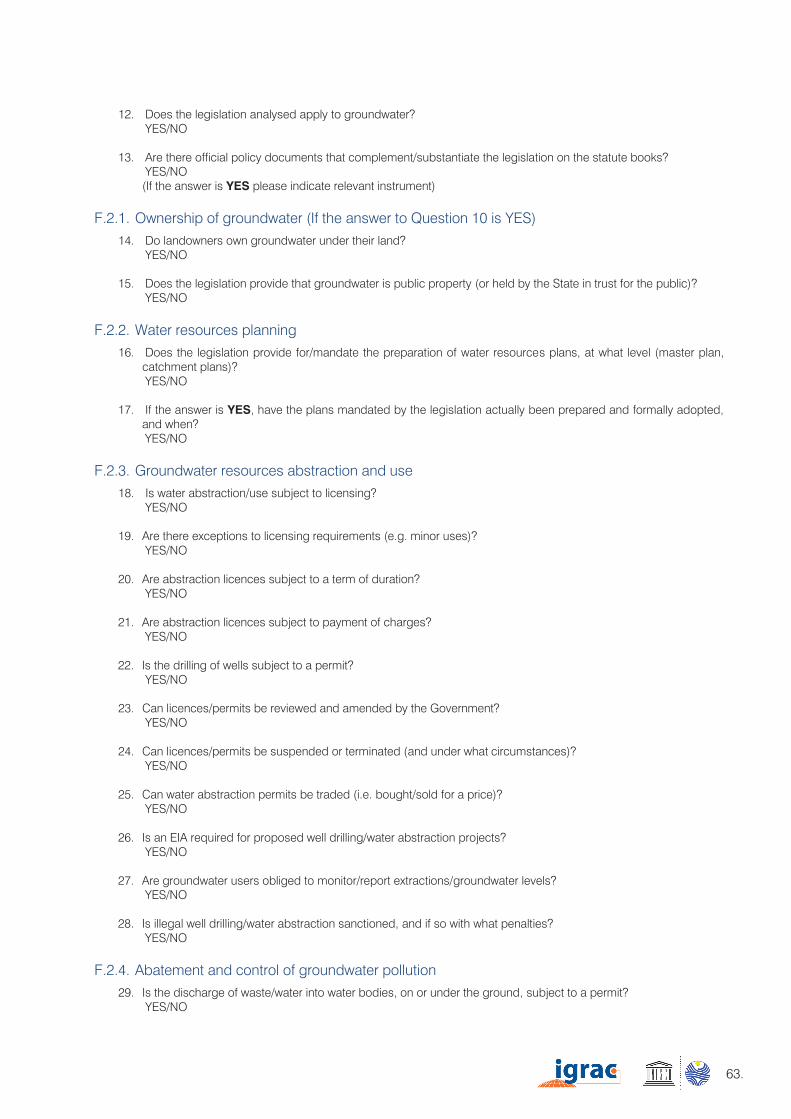
63.
Percentage of total population in aquifer area with access to sanitation.
Sanitation data may be linked to administrative units. In this case data can be shown as the percentage of population covered by public water supply per local administrative unit (e.g. municipality).
Definitions:
Sanitation generally refers to the provision of facilities and services for the safe disposal of human urine and faeces. Inadequate sanitation is a major cause of disease worldwide and improving sanitation is known to have a significant beneficial impact on health both in households and across communities. The word 'sanitation' also refers to the maintenance of hygienic conditions, through services such as rubbish collection and wastewater disposal [1]. [1] World Health Organization. Health topics, Sanitation. Available at: http://www.who.int/topics/sanitation/en/ [Accessed in May 2014]
Text, table and map: polygon features
Unit
%
Priority for data collection
3 (general characterisation)
Available global datasets
[-]
Sub-questions / metainformation
F – LEGAL AND INSTITUTIONAL ASPECTS
F.1 TRANSBOUNDARY LEGAL AND INSTITUTIONAL FRAMEWORK
1. Is there an agreement/treaty/MOU or other legal instrument in effect between your country and the neighbouring countries and which is specific to the aquifer1? YES/NO
If the answer is YES, does the agreement/treaty/MOU provide for:
3. Rules of engagement for the utilization of the aquifer waters? YES/NO
4. Rules of engagement for the protection of the aquifer waters from pollution or other kinds of threats? YES/NO
5. Institutional arrangements (commission, committee, other)? YES/NO
6. Rules for the settlement of disagreements? YES/NO
If the answer is NO, is there an agreement/treaty/MOU or other binding or non-binding instrument signed by your country (e.g. a global, regional or bi- or multi-lateral instrument2) which provides:
7. Principles for the utilization of shared water resources? YES/NO
8. Principles for the protection of shared water resources from pollution or other threats? YES/NO
9. Principles for cooperation on shared water resources, including institutional arrangements ? YES/NO
10. Principles for the settlement of disputes in relation to shared water resources? YES/NO
F.2 DOMESTIC LEGAL AND INSTITUTIONAL FRAMEWORK
11. Is there legislation on the statute books covering freshwater resources (e.g. Water Resources Act, Natural Resources Act, Environment Act, Water Services Act, Local Government Act, Mining Act, Town & Country Planning Act, relevant regulations under these acts, civil code, or municipal by-laws) of specific relevance to the project area? YES/NO
1 List and attach copy of the agreement or treaty or MOU analyzed 2 Ditto
12. Does the legislation analysed apply to groundwater?
YES/NO
13. Are there official policy documents that complement/substantiate the legislation on the statute books? YES/NO (If the answer is YES please indicate relevant instrument)
F.2.1. Ownership of groundwater (If the answer to Question 10 is YES) 14. Do landowners own groundwater under their land?
YES/NO
15. Does the legislation provide that groundwater is public property (or held by the State in trust for the public)? YES/NO
F.2.2. Water resources planning 16. Does the legislation provide for/mandate the preparation of water resources plans, at what level (master plan,
catchment plans)? YES/NO
17. If the answer is YES, have the plans mandated by the legislation actually been prepared and formally adopted, and when? YES/NO
F.2.3. Groundwater resources abstraction and use 18. Is water abstraction/use subject to licensing?
YES/NO
19. Are there exceptions to licensing requirements (e.g. minor uses)? YES/NO
20. Are abstraction licences subject to a term of duration? YES/NO
21. Are abstraction licences subject to payment of charges? YES/NO
22. Is the drilling of wells subject to a permit? YES/NO
23. Can licences/permits be reviewed and amended by the Government? YES/NO
24. Can licences/permits be suspended or terminated (and under what circumstances)? YES/NO
25. Can water abstraction permits be traded (i.e. bought/sold for a price)? YES/NO
26. Is an EIA required for proposed well drilling/water abstraction projects? YES/NO
27. Are groundwater users obliged to monitor/report extractions/groundwater levels? YES/NO
28. Is illegal well drilling/water abstraction sanctioned, and if so with what penalties? YES/NO
F.2.4. Abatement and control of groundwater pollution 29. Is the discharge of waste/water into water bodies, on or under the ground, subject to a permit?
YES/NO
64. GUIDELINES FOR MULTIDISCIPLINARY TBA ASSESSMENT
30. Are permits subject to a term of duration? YES/NO
31. Are standards of effluent quality provided for/in effect? YES/NO
32. Are ambient water quality standards for receiving waters provided for/in effect? YES/NO
33. Are wastewater discharge permits subject to payment of charges? YES/NO
34. Can permits be reviewed and amended by the Government? YES/NO
35. Can permits be suspended or terminated (under what circumstances)? YES/NO
36. Is an EIA required for proposed waste/water discharge projects? YES/NO
37. Is monitoring/reporting of groundwater quality the obligation of dischargers? YES/NO
38. Is contamination from closed/disused wells regulated, and if so how? YES/NO
39. Is the use/control/disposal of hazardous substances regulated, and if so how? YES/NO
40. Is illegal discharging of waste/water sanctioned, and if so with what penalties? YES/NO
F.2.5. Other water resources protection measures 41. Does the legislation regulate land cultivation practices that can result in pollution of groundwater?
YES/NO
42. Does the legislation require that the impact of urban and rural land development projects on water resources be taken into account in the context of land development permit procedures? YES/NO
F.2.6. Government and non-government (including informal) water institutions 43. Is there a government institution at national/central level responsible for the administration of the legislation
analyzed? YES/NO
44. Is there a government institution at intermediate (i.e. provincial, river basin, other) level responsible for the administration of the legislation analyzed? YES/NO
45. Are government institutions at the local level responsible for the administration of the legislation analyzed? YES/NO
46. Are water user organizations (WUO’s) provided for in the legislation? YES/NO
If the answer is YES, are there any operational, and with what tasks?
47. Are specialized water courts provided to adjudicate water disputes and if so, are they operational?
YES/NO
48. Are informal groups (water users, conservation bodies, local government bodies) in existence on the ground? YES/NO
65.
30. Are permits subject to a term of duration? YES/NO
31. Are standards of effluent quality provided for/in effect? YES/NO
32. Are ambient water quality standards for receiving waters provided for/in effect? YES/NO
33. Are wastewater discharge permits subject to payment of charges? YES/NO
34. Can permits be reviewed and amended by the Government? YES/NO
35. Can permits be suspended or terminated (under what circumstances)? YES/NO
36. Is an EIA required for proposed waste/water discharge projects? YES/NO
37. Is monitoring/reporting of groundwater quality the obligation of dischargers? YES/NO
38. Is contamination from closed/disused wells regulated, and if so how? YES/NO
39. Is the use/control/disposal of hazardous substances regulated, and if so how? YES/NO
40. Is illegal discharging of waste/water sanctioned, and if so with what penalties? YES/NO
F.2.5. Other water resources protection measures 41. Does the legislation regulate land cultivation practices that can result in pollution of groundwater?
YES/NO
42. Does the legislation require that the impact of urban and rural land development projects on water resources be taken into account in the context of land development permit procedures? YES/NO
F.2.6. Government and non-government (including informal) water institutions 43. Is there a government institution at national/central level responsible for the administration of the legislation
analyzed? YES/NO
44. Is there a government institution at intermediate (i.e. provincial, river basin, other) level responsible for the administration of the legislation analyzed? YES/NO
45. Are government institutions at the local level responsible for the administration of the legislation analyzed? YES/NO
46. Are water user organizations (WUO’s) provided for in the legislation? YES/NO
If the answer is YES, are there any operational, and with what tasks?
47. Are specialized water courts provided to adjudicate water disputes and if so, are they operational?
YES/NO
48. Are informal groups (water users, conservation bodies, local government bodies) in existence on the ground? YES/NO
If the answer is YES, please provide (and document) the following information:
rules about access, use, storage, and exchange of water among group members, rules about membership (who can belong to, and who decides about who can belong and how), rules about decision-making (who decides what, and how), rules about monitoring of compliance with the rules, and about enforcement of the rules, rules about information sharing among group members.
F.2.7. Implementation, administration and enforcement of the legislation on the statute books 49. Have any of the acts of parliament listed under Q10 been implemented (through implementing regulations)?
YES/NO
If the answer is YES please list the implementing regulations.
50. Are records of actual administrative action taken by the competent government authorities under any of the
legislative provisions covered by headings F.2.3, F.2.4 and F.2.5 available and accessible? YES/NO
If the answer is YES, please indicate which legislative provisions have actually been acted upon by which arm of government and at which level (central, intermediate, local).
51. Are records of enforcement action by the competent law enforcement authorities of the legislative provisions covered by questions 27, 37, 38 and 39 available and accessible? YES/NO
If the answer is YES, please indicate which legislative provisions have actually been enforced, and what the outcome of the law enforcement process has been.
68
APPENDIX 2.
67.68
APPENDIXESAPPENDIX 2. INDICATORS
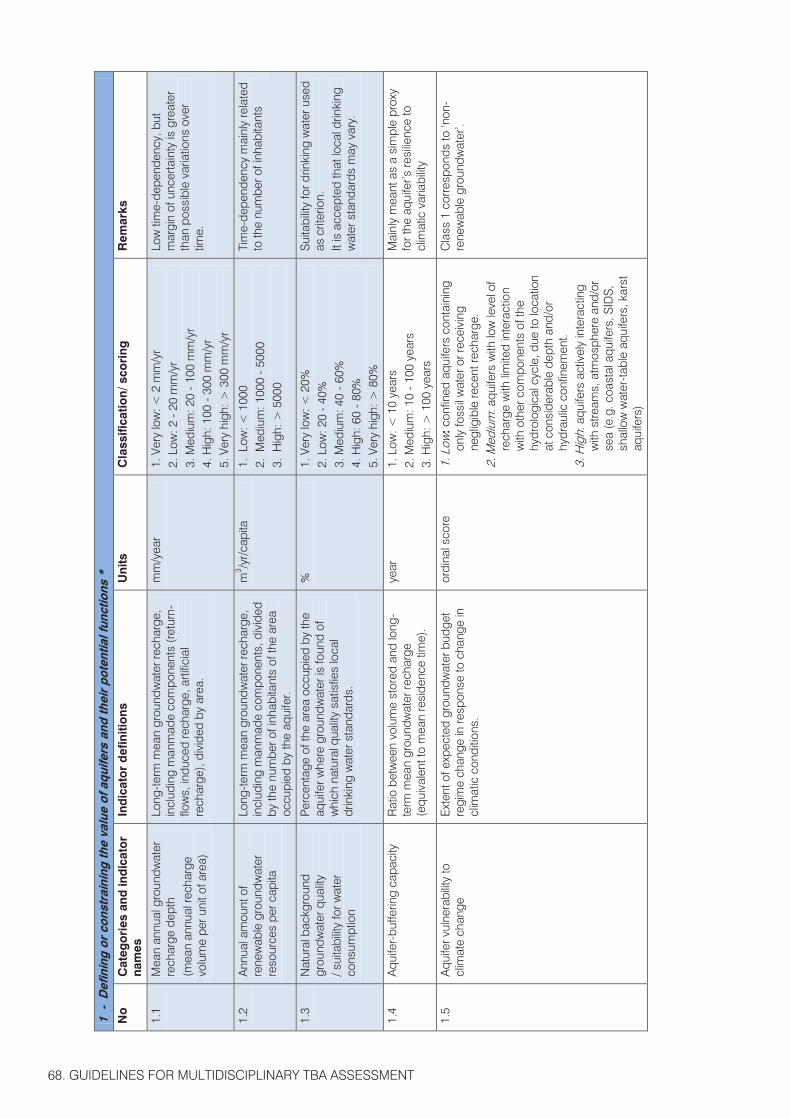
68. GUIDELINES FOR MULTIDISCIPLINARY TBA ASSESSMENT
1 -
Def
inin
g or
con
stra
inin
g th
e va
lue
of a
quife
rs a
nd th
eir
pote
ntia
l fun
ctio
ns *
No
C
ateg
ori
es a
nd in
dic
ato
r na
mes
In
dic
ato
r d
efin
itio
ns
Uni
ts
Cla
ssifi
catio
n/ s
cori
ng
Rem
arks
1.1
Mea
n an
nual
gro
undw
ater
re
char
ge d
epth
(m
ean
annu
al re
char
ge
volu
me
per u
nit o
f are
a)
Long
-ter
m m
ean
grou
ndw
ater
rech
arge
, in
clud
ing
man
mad
e co
mpo
nent
s (r
etur
n-flo
ws,
indu
ced
rech
arge
, arti
ficia
l re
char
ge),
divi
ded
by a
rea.
mm
/yea
r 1.
Ver
y lo
w: <
2 m
m/y
r 2.
Low
: 2 -
20
mm
/yr
3. M
ediu
m: 2
0 -
100
mm
/yr
4. H
igh:
100
- 3
00 m
m/y
r 5.
Ver
y hi
gh: >
300
mm
/yr
Low
tim
e-de
pend
ency
, but
m
argi
n of
unc
erta
inty
is g
reat
er
than
pos
sibl
e va
riatio
ns o
ver
time.
1.2
Ann
ual a
mou
nt o
f re
new
able
gro
undw
ater
re
sour
ces
per c
apita
Long
-ter
m m
ean
grou
ndw
ater
rech
arge
, in
clud
ing
man
mad
e co
mpo
nent
s, d
ivid
ed
by th
e nu
mbe
r of i
nhab
itant
s of
the
area
oc
cupi
ed b
y th
e aq
uife
r.
m3 /y
r/cap
ita
1. L
ow: <
100
0 2.
Med
ium
: 100
0 -
5000
3.
Hig
h: >
500
0
Tim
e-de
pend
ency
mai
nly
rela
ted
to th
e nu
mbe
r of i
nhab
itant
s
1.3
Nat
ural
bac
kgro
und
grou
ndw
ater
qua
lity
/ sui
tabi
lity
for w
ater
co
nsum
ptio
n
Per
cent
age
of th
e ar
ea o
ccup
ied
by th
e aq
uife
r whe
re g
roun
dwat
er is
foun
d of
w
hich
nat
ural
qua
lity
satis
fies
loca
l dr
inki
ng w
ater
sta
ndar
ds.
%
1. V
ery
low
: < 2
0%
2. L
ow: 2
0 -
40%
3.
Med
ium
: 40
- 60
%
4. H
igh:
60
- 80
%
5. V
ery
high
: > 8
0%
Sui
tabi
lity
for d
rinki
ng w
ater
use
d as
crit
erio
n.
It is
acc
epte
d th
at lo
cal d
rinki
ng
wat
er s
tand
ards
may
var
y.
1.4
Aqu
ifer-
buffe
ring
capa
city
R
atio
bet
wee
n vo
lum
e st
ored
and
long
-te
rm m
ean
grou
ndw
ater
rech
arge
(e
quiv
alen
t to
mea
n re
side
nce
time)
.
year
1.
Low
: < 1
0 ye
ars
2. M
ediu
m: 1
0 -
100
year
s 3.
Hig
h: >
100
yea
rs
Mai
nly
mea
nt a
s a
sim
ple
prox
y fo
r the
aqu
ifer’s
resi
lienc
e to
cl
imat
ic v
aria
bilit
y
1.5
Aqu
ifer v
ulne
rabi
lity
to
clim
ate
chan
ge
Ext
ent o
f exp
ecte
d gr
ound
wat
er b
udge
t re
gim
e ch
ange
in re
spon
se to
cha
nge
in
clim
atic
con
ditio
ns.
ordi
nal s
core
1.
Low
: con
fined
aqu
ifers
con
tain
ing
only
foss
il w
ater
or r
ecei
ving
ne
glig
ible
rece
nt re
char
ge.
2. M
ediu
m: a
quife
rs w
ith lo
w le
vel o
f re
char
ge w
ith li
mite
d in
tera
ctio
n w
ith o
ther
com
pone
nts
of th
e hy
drol
ogic
al c
ycle
, due
to lo
catio
n at
con
side
rabl
e de
pth
and/
or
hydr
aulic
con
finem
ent.
3.
Hig
h: a
quife
rs a
ctiv
ely
inte
ract
ing
with
stre
ams,
atm
osph
ere
and/
or
sea
(e.g
. coa
stal
aqu
ifers
, SID
S,
shal
low
wat
er-t
able
aqu
ifers
, kar
st
aqui
fers
)
Cla
ss 1
cor
resp
onds
to ‘n
on-
rene
wab
le g
roun
dwat
er’.
1.6
Aqu
ifer v
ulne
rabi
lity
to
pollu
tion
Per
cent
age
of it
s ho
rizon
tal a
rea
whe
re
the
aqui
fer i
s co
nsid
ered
mod
erat
ely
to
high
ly v
ulne
rabl
e to
pol
lutio
n.
%
1. V
ery
low
: < 2
0%
2. L
ow: 2
0 -
40%
3.
Med
ium
: 40
- 60
%
4. H
igh:
60
- 80
%
5. V
ery
high
: > 8
0%
App
roxi
mat
e cr
iteria
for
Mod
erat
ely
to h
ighl
y vu
lner
able
: >
100
in D
RA
STIC
met
hod
If da
ta a
vaila
bilit
y is
lim
ited
mak
e us
e of
GO
D m
etho
d w
here
> 0
,3
wou
ld b
e th
e th
resh
old.
2 -
Rol
e an
d im
port
ance
of g
roun
dwat
er fo
r hu
man
s an
d th
e en
viro
nmen
t
No
C
ateg
ori
es a
nd in
dic
ato
r na
mes
In
dic
ato
r d
efin
itio
ns
Uni
ts
Cla
ssifi
catio
n/ s
cori
ng
Rem
arks
2.1
Hum
an d
epen
denc
y on
gr
ound
wat
er
Per
cent
age
of g
roun
dwat
er in
tota
l wat
er
abst
ract
ion
for a
ll hu
man
wat
er u
ses.
%
1. V
ery
low
: < 2
0%
2. L
ow: 2
0 -
40%
3.
Med
ium
: 40
- 60
%
4. H
igh:
60
- 80
%
5. V
ery
high
: > 8
0%
Abs
tract
ion
of w
ater
incl
udes
the
quan
tity
used
and
all
loss
es.
2.2
Hum
an d
epen
denc
y on
gr
ound
wat
er fo
r dom
estic
w
ater
sup
ply
Per
cent
age
of g
roun
dwat
er in
wat
er
abst
ract
ion
for d
omes
tic w
ater
use
.
%
1. V
ery
low
: < 2
0%
2. L
ow: 2
0 -
40%
3.
Med
ium
: 40
- 60
%
4. H
igh:
60
- 80
%
5. V
ery
high
: > 8
0%
Abs
tract
ion
of w
ater
incl
udes
the
quan
tity
used
and
all
loss
es.
2.3
Hum
an d
epen
denc
y on
gr
ound
wat
er fo
r agr
icul
tura
l w
ater
sup
ply
Per
cent
age
of g
roun
dwat
er in
wat
er
abst
ract
ion
for a
gric
ultu
ral w
ater
use
(m
ainl
y irr
igat
ion)
.
%
1. V
ery
low
: < 2
0%
2. L
ow: 2
0 -
40%
3.
Med
ium
: 40
- 60
%
4. H
igh:
60
- 80
%
5. V
ery
high
: > 8
0%
Abs
tract
ion
of w
ater
incl
udes
the
quan
tity
used
and
all
loss
es.
2.4
Hum
an d
epen
denc
y on
gr
ound
wat
er fo
r ind
ustri
al
wat
er s
uppl
y
Per
cent
age
of g
roun
dwat
er in
tota
l wat
er
abst
ract
ion
for i
ndus
trial
wat
er u
se.
%
1. V
ery
low
: < 2
0%
2. L
ow: 2
0 -
40%
3.
Med
ium
: 40
- 60
%
4. H
igh:
60
- 80
%
5. V
ery
high
: > 8
0%
Abs
tract
ion
of w
ater
incl
udes
the
quan
tity
used
and
all
loss
es.
2.5
Eco
syst
em d
epen
denc
y on
gr
ound
wat
er
Per
cent
age
of th
e aq
uife
r’s a
rea
whe
re th
e aq
uife
r has
a p
hrea
tic w
ater
leve
l sh
allo
wer
than
5 m
bel
ow s
urfa
ce.
%
1. V
ery
low
: < 5
%
2. L
ow: 5
- 1
0%
3. M
ediu
m: 1
0 -
25%
4.
Hig
h: 2
5 -
50%
Phr
eatic
wat
er le
vel t
aken
as
a pr
oxy
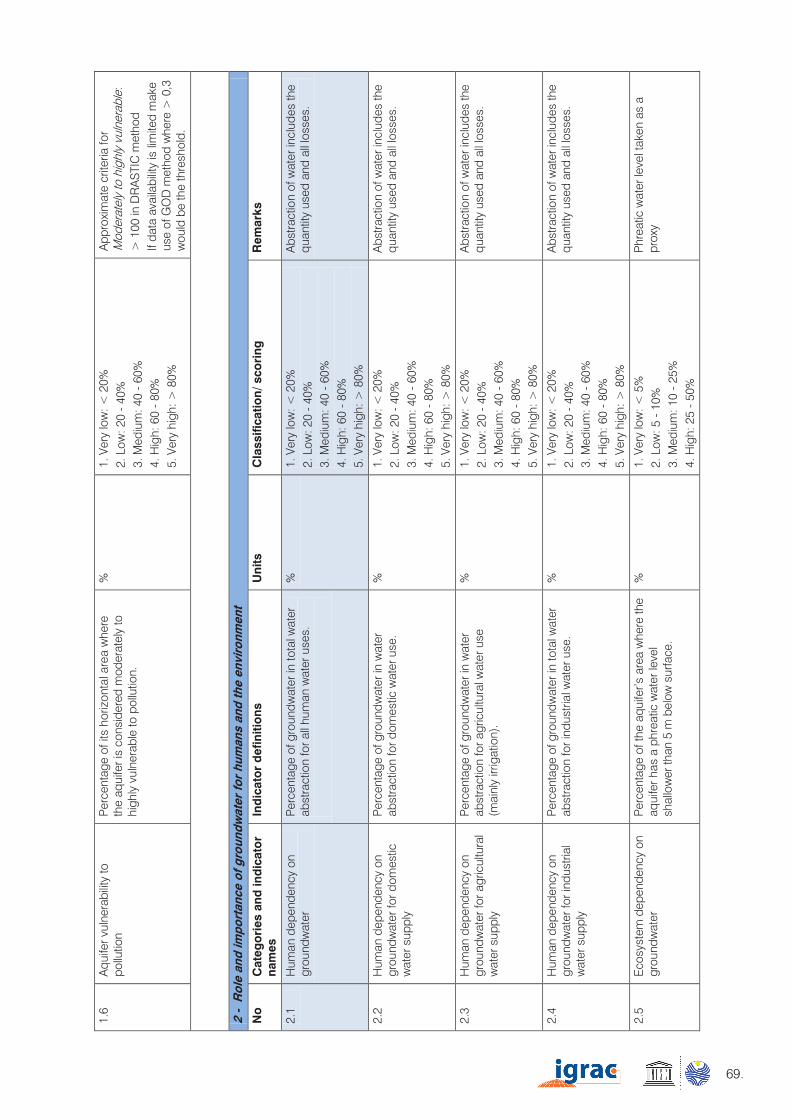
69.
1 -
Def
inin
g or
con
stra
inin
g th
e va
lue
of a
quife
rs a
nd th
eir
pote
ntia
l fun
ctio
ns *
No
C
ateg
ori
es a
nd in
dic
ato
r na
mes
In
dic
ato
r d
efin
itio
ns
Uni
ts
Cla
ssifi
catio
n/ s
cori
ng
Rem
arks
1.1
Mea
n an
nual
gro
undw
ater
re
char
ge d
epth
(m
ean
annu
al re
char
ge
volu
me
per u
nit o
f are
a)
Long
-ter
m m
ean
grou
ndw
ater
rech
arge
, in
clud
ing
man
mad
e co
mpo
nent
s (r
etur
n-flo
ws,
indu
ced
rech
arge
, arti
ficia
l re
char
ge),
divi
ded
by a
rea.
mm
/yea
r 1.
Ver
y lo
w: <
2 m
m/y
r 2.
Low
: 2 -
20
mm
/yr
3. M
ediu
m: 2
0 -
100
mm
/yr
4. H
igh:
100
- 3
00 m
m/y
r 5.
Ver
y hi
gh: >
300
mm
/yr
Low
tim
e-de
pend
ency
, but
m
argi
n of
unc
erta
inty
is g
reat
er
than
pos
sibl
e va
riatio
ns o
ver
time.
1.2
Ann
ual a
mou
nt o
f re
new
able
gro
undw
ater
re
sour
ces
per c
apita
Long
-ter
m m
ean
grou
ndw
ater
rech
arge
, in
clud
ing
man
mad
e co
mpo
nent
s, d
ivid
ed
by th
e nu
mbe
r of i
nhab
itant
s of
the
area
oc
cupi
ed b
y th
e aq
uife
r.
m3 /y
r/cap
ita
1. L
ow: <
100
0 2.
Med
ium
: 100
0 -
5000
3.
Hig
h: >
500
0
Tim
e-de
pend
ency
mai
nly
rela
ted
to th
e nu
mbe
r of i
nhab
itant
s
1.3
Nat
ural
bac
kgro
und
grou
ndw
ater
qua
lity
/ sui
tabi
lity
for w
ater
co
nsum
ptio
n
Per
cent
age
of th
e ar
ea o
ccup
ied
by th
e aq
uife
r whe
re g
roun
dwat
er is
foun
d of
w
hich
nat
ural
qua
lity
satis
fies
loca
l dr
inki
ng w
ater
sta
ndar
ds.
%
1. V
ery
low
: < 2
0%
2. L
ow: 2
0 -
40%
3.
Med
ium
: 40
- 60
%
4. H
igh:
60
- 80
%
5. V
ery
high
: > 8
0%
Sui
tabi
lity
for d
rinki
ng w
ater
use
d as
crit
erio
n.
It is
acc
epte
d th
at lo
cal d
rinki
ng
wat
er s
tand
ards
may
var
y.
1.4
Aqu
ifer-
buffe
ring
capa
city
R
atio
bet
wee
n vo
lum
e st
ored
and
long
-te
rm m
ean
grou
ndw
ater
rech
arge
(e
quiv
alen
t to
mea
n re
side
nce
time)
.
year
1.
Low
: < 1
0 ye
ars
2. M
ediu
m: 1
0 -
100
year
s 3.
Hig
h: >
100
yea
rs
Mai
nly
mea
nt a
s a
sim
ple
prox
y fo
r the
aqu
ifer’s
resi
lienc
e to
cl
imat
ic v
aria
bilit
y
1.5
Aqu
ifer v
ulne
rabi
lity
to
clim
ate
chan
ge
Ext
ent o
f exp
ecte
d gr
ound
wat
er b
udge
t re
gim
e ch
ange
in re
spon
se to
cha
nge
in
clim
atic
con
ditio
ns.
ordi
nal s
core
1.
Low
: con
fined
aqu
ifers
con
tain
ing
only
foss
il w
ater
or r
ecei
ving
ne
glig
ible
rece
nt re
char
ge.
2. M
ediu
m: a
quife
rs w
ith lo
w le
vel o
f re
char
ge w
ith li
mite
d in
tera
ctio
n w
ith o
ther
com
pone
nts
of th
e hy
drol
ogic
al c
ycle
, due
to lo
catio
n at
con
side
rabl
e de
pth
and/
or
hydr
aulic
con
finem
ent.
3.
Hig
h: a
quife
rs a
ctiv
ely
inte
ract
ing
with
stre
ams,
atm
osph
ere
and/
or
sea
(e.g
. coa
stal
aqu
ifers
, SID
S,
shal
low
wat
er-t
able
aqu
ifers
, kar
st
aqui
fers
)
Cla
ss 1
cor
resp
onds
to ‘n
on-
rene
wab
le g
roun
dwat
er’.
1.6
Aqu
ifer v
ulne
rabi
lity
to
pollu
tion
Per
cent
age
of it
s ho
rizon
tal a
rea
whe
re
the
aqui
fer i
s co
nsid
ered
mod
erat
ely
to
high
ly v
ulne
rabl
e to
pol
lutio
n.
%
1. V
ery
low
: < 2
0%
2. L
ow: 2
0 -
40%
3.
Med
ium
: 40
- 60
%
4. H
igh:
60
- 80
%
5. V
ery
high
: > 8
0%
App
roxi
mat
e cr
iteria
for
Mod
erat
ely
to h
ighl
y vu
lner
able
: >
100
in D
RA
STIC
met
hod
If da
ta a
vaila
bilit
y is
lim
ited
mak
e us
e of
GO
D m
etho
d w
here
> 0
,3
wou
ld b
e th
e th
resh
old.
2 -
Rol
e an
d im
port
ance
of g
roun
dwat
er fo
r hu
man
s an
d th
e en
viro
nmen
t
No
C
ateg
ori
es a
nd in
dic
ato
r na
mes
In
dic
ato
r d
efin
itio
ns
Uni
ts
Cla
ssifi
catio
n/ s
cori
ng
Rem
arks
2.1
Hum
an d
epen
denc
y on
gr
ound
wat
er
Per
cent
age
of g
roun
dwat
er in
tota
l wat
er
abst
ract
ion
for a
ll hu
man
wat
er u
ses.
%
1. V
ery
low
: < 2
0%
2. L
ow: 2
0 -
40%
3.
Med
ium
: 40
- 60
%
4. H
igh:
60
- 80
%
5. V
ery
high
: > 8
0%
Abs
tract
ion
of w
ater
incl
udes
the
quan
tity
used
and
all
loss
es.
2.2
Hum
an d
epen
denc
y on
gr
ound
wat
er fo
r dom
estic
w
ater
sup
ply
Per
cent
age
of g
roun
dwat
er in
wat
er
abst
ract
ion
for d
omes
tic w
ater
use
.
%
1. V
ery
low
: < 2
0%
2. L
ow: 2
0 -
40%
3.
Med
ium
: 40
- 60
%
4. H
igh:
60
- 80
%
5. V
ery
high
: > 8
0%
Abs
tract
ion
of w
ater
incl
udes
the
quan
tity
used
and
all
loss
es.
2.3
Hum
an d
epen
denc
y on
gr
ound
wat
er fo
r agr
icul
tura
l w
ater
sup
ply
Per
cent
age
of g
roun
dwat
er in
wat
er
abst
ract
ion
for a
gric
ultu
ral w
ater
use
(m
ainl
y irr
igat
ion)
.
%
1. V
ery
low
: < 2
0%
2. L
ow: 2
0 -
40%
3.
Med
ium
: 40
- 60
%
4. H
igh:
60
- 80
%
5. V
ery
high
: > 8
0%
Abs
tract
ion
of w
ater
incl
udes
the
quan
tity
used
and
all
loss
es.
2.4
Hum
an d
epen
denc
y on
gr
ound
wat
er fo
r ind
ustri
al
wat
er s
uppl
y
Per
cent
age
of g
roun
dwat
er in
tota
l wat
er
abst
ract
ion
for i
ndus
trial
wat
er u
se.
%
1. V
ery
low
: < 2
0%
2. L
ow: 2
0 -
40%
3.
Med
ium
: 40
- 60
%
4. H
igh:
60
- 80
%
5. V
ery
high
: > 8
0%
Abs
tract
ion
of w
ater
incl
udes
the
quan
tity
used
and
all
loss
es.
2.5
Eco
syst
em d
epen
denc
y on
gr
ound
wat
er
Per
cent
age
of th
e aq
uife
r’s a
rea
whe
re th
e aq
uife
r has
a p
hrea
tic w
ater
leve
l sh
allo
wer
than
5 m
bel
ow s
urfa
ce.
%
1. V
ery
low
: < 5
%
2. L
ow: 5
- 1
0%
3. M
ediu
m: 1
0 -
25%
4.
Hig
h: 2
5 -
50%
Phr
eatic
wat
er le
vel t
aken
as
a pr
oxy
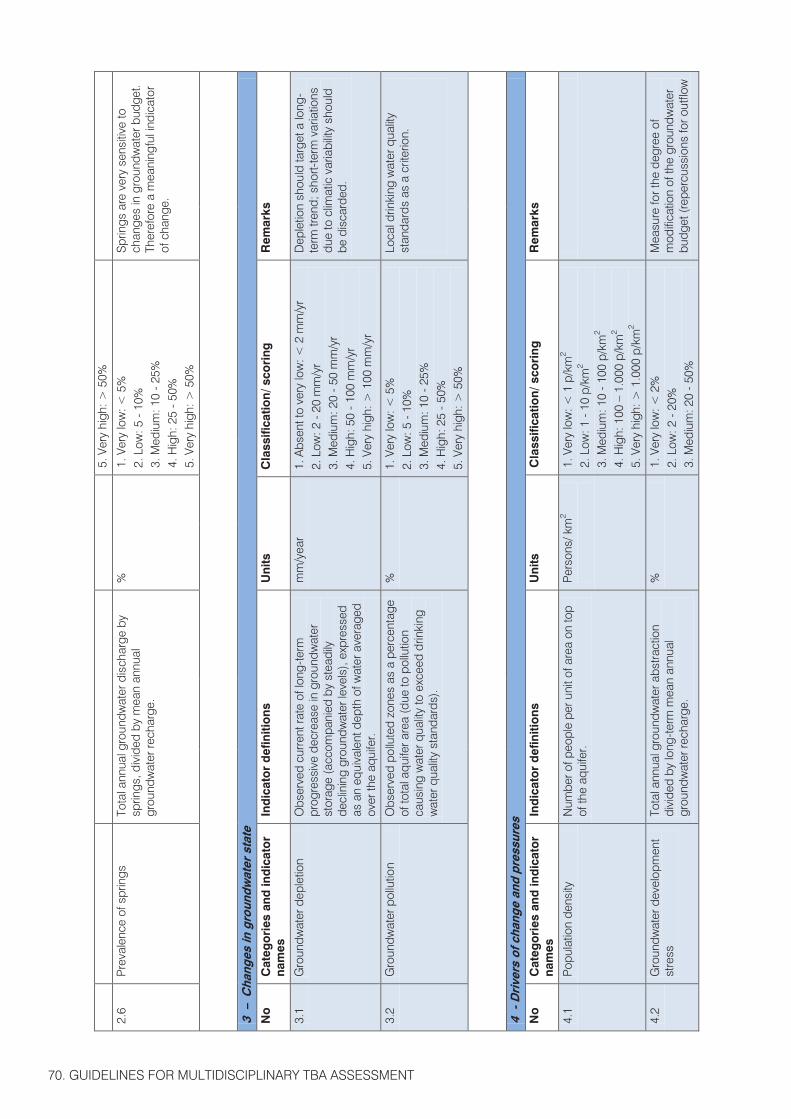
70. GUIDELINES FOR MULTIDISCIPLINARY TBA ASSESSMENT
5. V
ery
high
: > 5
0%
2.6
Pre
vale
nce
of s
prin
gs
Tota
l ann
ual g
roun
dwat
er d
isch
arge
by
sprin
gs, d
ivid
ed b
y m
ean
annu
al
grou
ndw
ater
rech
arge
.
%
1. V
ery
low
: < 5
%
2. L
ow: 5
- 1
0%
3. M
ediu
m: 1
0 -
25%
4.
Hig
h: 2
5 -
50%
5.
Ver
y hi
gh: >
50%
Spr
ings
are
ver
y se
nsiti
ve to
ch
ange
s in
gro
undw
ater
bud
get.
Ther
efor
e a
mea
ning
ful i
ndic
ator
of
cha
nge.
3 –
Cha
nges
in g
roun
dwat
er s
tate
No
C
ateg
ori
es a
nd in
dic
ato
r na
mes
In
dic
ato
r d
efin
itio
ns
Uni
ts
Cla
ssifi
catio
n/ s
cori
ng
Rem
arks
3.1
Gro
undw
ater
dep
letio
n O
bser
ved
curr
ent r
ate
of lo
ng-t
erm
pr
ogre
ssiv
e de
crea
se in
gro
undw
ater
st
orag
e (a
ccom
pani
ed b
y st
eadi
ly
decl
inin
g gr
ound
wat
er le
vels
), ex
pres
sed
as a
n eq
uiva
lent
dep
th o
f wat
er a
vera
ged
over
the
aqui
fer.
mm
/yea
r 1.
Abs
ent t
o ve
ry lo
w: <
2 m
m/y
r 2.
Low
: 2 -
20
mm
/yr
3. M
ediu
m: 2
0 -
50 m
m/y
r 4.
Hig
h: 5
0 -
100
mm
/yr
5. V
ery
high
: > 1
00 m
m/y
r
Dep
letio
n sh
ould
targ
et a
long
-te
rm tr
end;
sho
rt-te
rm v
aria
tions
du
e to
clim
atic
var
iabi
lity
shou
ld
be d
isca
rded
.
3.2
Gro
undw
ater
pol
lutio
n O
bser
ved
pollu
ted
zone
s as
a p
erce
ntag
e of
tota
l aqu
ifer a
rea
(due
to p
ollu
tion
caus
ing
wat
er q
ualit
y to
exc
eed
drin
king
w
ater
qua
lity
stan
dard
s).
%
1. V
ery
low
: < 5
%
2. L
ow: 5
- 1
0%
3. M
ediu
m: 1
0 -
25%
4.
Hig
h: 2
5 -
50%
5.
Ver
y hi
gh: >
50%
Loca
l drin
king
wat
er q
ualit
y st
anda
rds
as a
crit
erio
n.
4 -
Dri
vers
of c
hang
e an
d pr
essu
res
No
C
ateg
ori
es a
nd in
dic
ato
r na
mes
In
dic
ato
r d
efin
itio
ns
Uni
ts
Cla
ssifi
catio
n/ s
cori
ng
Rem
arks
4.1
Pop
ulat
ion
dens
ity
Num
ber o
f peo
ple
per u
nit o
f are
a on
top
of th
e aq
uife
r. P
erso
ns/ k
m2
1.
Ver
y lo
w: <
1 p
/km
2 2.
Low
: 1 -
10
p/km
2 3.
Med
ium
: 10
- 10
0 p/
km2
4. H
igh:
100
– 1
.000
p/k
m2
5. V
ery
high
: > 1
.000
p/k
m2
4.2
Gro
undw
ater
dev
elop
men
t st
ress
To
tal a
nnua
l gro
undw
ater
abs
tract
ion
divi
ded
by lo
ng-t
erm
mea
n an
nual
gr
ound
wat
er re
char
ge.
%
1. V
ery
low
: < 2
%
2. L
ow: 2
- 2
0%
3. M
ediu
m: 2
0 -
50%
Mea
sure
for t
he d
egre
e of
m
odifi
catio
n of
the
grou
ndw
ater
bu
dget
(rep
ercu
ssio
ns fo
r out
flow
4. H
igh:
50
- 10
0%
5. V
ery
high
: > 1
00%
an
d st
orag
e)
LEG
AL
AN
D IN
STI
TUTI
ON
AL
AS
PE
CTS
5 –
Ena
blin
g en
viro
nmen
t for
tran
sbou
ndar
y aq
uife
r re
sour
ces
man
agem
ent (
at b
i- or
mul
ti-na
tiona
l lev
el)
No
C
ateg
ori
es a
nd in
dic
ato
r na
mes
In
dic
ato
r d
efin
itio
ns
Sco
ring
C
lass
ifica
tion/
sco
ring
R
emar
ks
5.1
Tran
sbou
ndar
y le
gal
fram
ewor
k
[Q1
thro
ugh
Q9]
A. E
xist
ence
and
com
preh
ensi
vene
ss o
f an
agr
eem
ent/t
reat
y/M
OU
in fo
rce,
sp
ecifi
c to
the
trans
boun
dary
aqu
ifer
(TB
A).
B. E
xist
ence
of a
non
TB
A-s
peci
fic
agre
emen
t/tre
aty/
MO
U in
forc
e, o
r oth
er
non-
bind
ing
inst
rum
ent,
of re
leva
nce
to
TBA
.
The
high
er th
e sc
ore
the
mor
e ar
ticul
ate
and
com
preh
ensi
ve th
e tra
nsbo
unda
ry
lega
l fra
mew
ork.
1. (N
o ag
reem
ent i
n ex
iste
nce
nor
unde
r pre
para
tion,
if k
now
n) [Q
1]
2. (N
on-b
indi
ng in
stru
men
t end
orse
d,
of re
leva
nce
to T
BA
) [Q
1]
3. (N
on T
BA
-spe
cific
agr
eem
ent
exis
ts)
Add
: +
1 if
it in
clud
es u
tiliz
atio
n of
TB
wat
ers
[Q6]
+
1 if
it in
clud
es p
rote
ctio
n of
TB
w
ater
s fro
m p
ollu
tion
[Q7]
+
1 if
it in
clud
es s
ettle
men
t of d
ispu
tes
[Q9]
+
1 if
it in
clud
es in
stitu
tiona
l ar
rang
emen
ts (c
omm
issi
on,
com
mitt
ee, o
ther
) [Q
8]
+1
if it
incl
udes
oth
er m
atte
rs (s
peci
fy)
4. (T
BA
-spe
cific
agr
eem
ent e
xist
s)
Add
: +
2 if
it in
clud
es u
tiliz
atio
n of
TB
A
wat
ers
[Q2]
+
2 if
it in
clud
es p
rote
ctio
n of
TB
A
wat
ers
from
pol
lutio
n [Q
3]
+2
if it
incl
udes
set
tlem
ent o
f dis
pute
s [Q
5]
+2
if it
incl
udes
inst
itutio
nal
arra
ngem
ents
(com
mis
sion
, co
mm
ittee
, oth
er) [
Q4]
+
2 if
it in
clud
es o
ther
mat
ters
(spe
cify
)
If no
agr
eem
ent/
treat
y/ M
OU
ex
ists
spe
cific
to th
e TB
A, o
ther
tre
atie
s or
agr
eem
ents
may
exi
st
(not
ably
at t
he re
gion
al le
vel),
an
d/or
non
-bin
ding
inst
rum
ents
(s
uch
as U
N re
solu
tions
, or
decl
arat
ions
) at
glo
bal o
r re
gion
al le
vel,
prov
idin
g fo
r tra
ns-
boun
dary
(TB
) wat
ers
in g
ener
al,
whi
ch a
re o
f rel
evan
ce to
the
TBA
, if o
nly
by im
plic
atio
n. T
hese
ne
ed to
be
acco
unte
d fo
r in
orde
r to
acc
urat
ely
char
acte
rize
this
in
dica
tor.
5.2
Tran
sbou
ndar
y in
stitu
tiona
l fra
mew
ork
Q4,
Q8]
Exi
sten
ce, m
anda
te (a
nd p
resu
med
ca
pabi
litie
s) o
f ins
titut
ions
or i
nstit
utio
nal
arra
ngem
ents
for m
anag
ing
the
TBA
.
The
high
er th
e sc
ore
the
mor
e ar
ticul
ate
and
com
preh
ensi
ve th
e
1. (N
o bi
- or
mul
ti-na
tiona
l tra
ns-
boun
dary
inst
itutio
n in
exi
sten
ce w
ith
man
date
for T
BA
) 2.
(Bi-
or m
ulti-
natio
nal t
rans
-bou
ndar
y
The
bi-
or m
ulti-
natio
nal T
BA
in
stitu
tion
is c
hara
cter
ized
by
the
natu
re a
nd e
xten
t of i
ts m
anda
te,
as s
pelt
out i
n th
e re
leva
nt le
gal
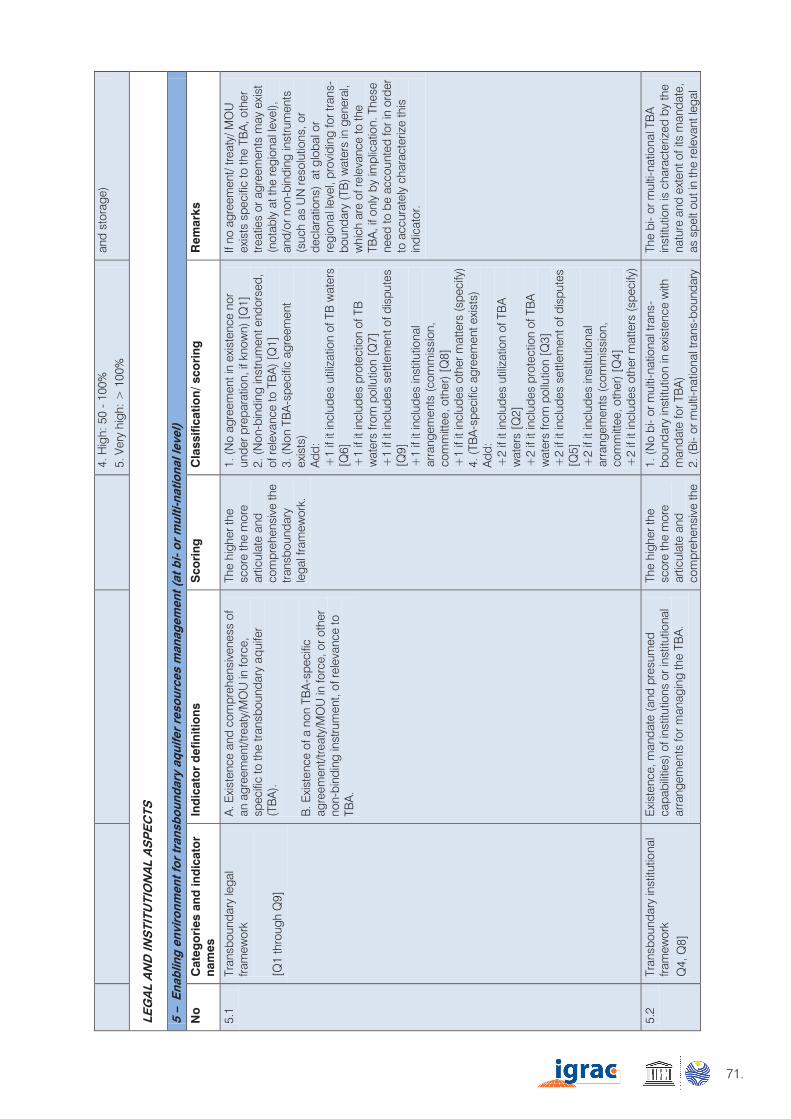
71.
5. V
ery
high
: > 5
0%
2.6
Pre
vale
nce
of s
prin
gs
Tota
l ann
ual g
roun
dwat
er d
isch
arge
by
sprin
gs, d
ivid
ed b
y m
ean
annu
al
grou
ndw
ater
rech
arge
.
%
1. V
ery
low
: < 5
%
2. L
ow: 5
- 1
0%
3. M
ediu
m: 1
0 -
25%
4.
Hig
h: 2
5 -
50%
5.
Ver
y hi
gh: >
50%
Spr
ings
are
ver
y se
nsiti
ve to
ch
ange
s in
gro
undw
ater
bud
get.
Ther
efor
e a
mea
ning
ful i
ndic
ator
of
cha
nge.
3 –
Cha
nges
in g
roun
dwat
er s
tate
No
C
ateg
ori
es a
nd in
dic
ato
r na
mes
In
dic
ato
r d
efin
itio
ns
Uni
ts
Cla
ssifi
catio
n/ s
cori
ng
Rem
arks
3.1
Gro
undw
ater
dep
letio
n O
bser
ved
curr
ent r
ate
of lo
ng-t
erm
pr
ogre
ssiv
e de
crea
se in
gro
undw
ater
st
orag
e (a
ccom
pani
ed b
y st
eadi
ly
decl
inin
g gr
ound
wat
er le
vels
), ex
pres
sed
as a
n eq
uiva
lent
dep
th o
f wat
er a
vera
ged
over
the
aqui
fer.
mm
/yea
r 1.
Abs
ent t
o ve
ry lo
w: <
2 m
m/y
r 2.
Low
: 2 -
20
mm
/yr
3. M
ediu
m: 2
0 -
50 m
m/y
r 4.
Hig
h: 5
0 -
100
mm
/yr
5. V
ery
high
: > 1
00 m
m/y
r
Dep
letio
n sh
ould
targ
et a
long
-te
rm tr
end;
sho
rt-te
rm v
aria
tions
du
e to
clim
atic
var
iabi
lity
shou
ld
be d
isca
rded
.
3.2
Gro
undw
ater
pol
lutio
n O
bser
ved
pollu
ted
zone
s as
a p
erce
ntag
e of
tota
l aqu
ifer a
rea
(due
to p
ollu
tion
caus
ing
wat
er q
ualit
y to
exc
eed
drin
king
w
ater
qua
lity
stan
dard
s).
%
1. V
ery
low
: < 5
%
2. L
ow: 5
- 1
0%
3. M
ediu
m: 1
0 -
25%
4.
Hig
h: 2
5 -
50%
5.
Ver
y hi
gh: >
50%
Loca
l drin
king
wat
er q
ualit
y st
anda
rds
as a
crit
erio
n.
4 -
Dri
vers
of c
hang
e an
d pr
essu
res
No
C
ateg
ori
es a
nd in
dic
ato
r na
mes
In
dic
ato
r d
efin
itio
ns
Uni
ts
Cla
ssifi
catio
n/ s
cori
ng
Rem
arks
4.1
Pop
ulat
ion
dens
ity
Num
ber o
f peo
ple
per u
nit o
f are
a on
top
of th
e aq
uife
r. P
erso
ns/ k
m2
1.
Ver
y lo
w: <
1 p
/km
2 2.
Low
: 1 -
10
p/km
2 3.
Med
ium
: 10
- 10
0 p/
km2
4. H
igh:
100
– 1
.000
p/k
m2
5. V
ery
high
: > 1
.000
p/k
m2
4.2
Gro
undw
ater
dev
elop
men
t st
ress
To
tal a
nnua
l gro
undw
ater
abs
tract
ion
divi
ded
by lo
ng-t
erm
mea
n an
nual
gr
ound
wat
er re
char
ge.
%
1. V
ery
low
: < 2
%
2. L
ow: 2
- 2
0%
3. M
ediu
m: 2
0 -
50%
Mea
sure
for t
he d
egre
e of
m
odifi
catio
n of
the
grou
ndw
ater
bu
dget
(rep
ercu
ssio
ns fo
r out
flow
4. H
igh:
50
- 10
0%
5. V
ery
high
: > 1
00%
an
d st
orag
e)
LEG
AL
AN
D IN
STI
TUTI
ON
AL
AS
PE
CTS
5 –
Ena
blin
g en
viro
nmen
t for
tran
sbou
ndar
y aq
uife
r re
sour
ces
man
agem
ent (
at b
i- or
mul
ti-na
tiona
l lev
el)
No
C
ateg
ori
es a
nd in
dic
ato
r na
mes
In
dic
ato
r d
efin
itio
ns
Sco
ring
C
lass
ifica
tion/
sco
ring
R
emar
ks
5.1
Tran
sbou
ndar
y le
gal
fram
ewor
k
[Q1
thro
ugh
Q9]
A. E
xist
ence
and
com
preh
ensi
vene
ss o
f an
agr
eem
ent/t
reat
y/M
OU
in fo
rce,
sp
ecifi
c to
the
trans
boun
dary
aqu
ifer
(TB
A).
B. E
xist
ence
of a
non
TB
A-s
peci
fic
agre
emen
t/tre
aty/
MO
U in
forc
e, o
r oth
er
non-
bind
ing
inst
rum
ent,
of re
leva
nce
to
TBA
.
The
high
er th
e sc
ore
the
mor
e ar
ticul
ate
and
com
preh
ensi
ve th
e tra
nsbo
unda
ry
lega
l fra
mew
ork.
1. (N
o ag
reem
ent i
n ex
iste
nce
nor
unde
r pre
para
tion,
if k
now
n) [Q
1]
2. (N
on-b
indi
ng in
stru
men
t end
orse
d,
of re
leva
nce
to T
BA
) [Q
1]
3. (N
on T
BA
-spe
cific
agr
eem
ent
exis
ts)
Add
: +
1 if
it in
clud
es u
tiliz
atio
n of
TB
wat
ers
[Q6]
+
1 if
it in
clud
es p
rote
ctio
n of
TB
w
ater
s fro
m p
ollu
tion
[Q7]
+
1 if
it in
clud
es s
ettle
men
t of d
ispu
tes
[Q9]
+
1 if
it in
clud
es in
stitu
tiona
l ar
rang
emen
ts (c
omm
issi
on,
com
mitt
ee, o
ther
) [Q
8]
+1
if it
incl
udes
oth
er m
atte
rs (s
peci
fy)
4. (T
BA
-spe
cific
agr
eem
ent e
xist
s)
Add
: +
2 if
it in
clud
es u
tiliz
atio
n of
TB
A
wat
ers
[Q2]
+
2 if
it in
clud
es p
rote
ctio
n of
TB
A
wat
ers
from
pol
lutio
n [Q
3]
+2
if it
incl
udes
set
tlem
ent o
f dis
pute
s [Q
5]
+2
if it
incl
udes
inst
itutio
nal
arra
ngem
ents
(com
mis
sion
, co
mm
ittee
, oth
er) [
Q4]
+
2 if
it in
clud
es o
ther
mat
ters
(spe
cify
)
If no
agr
eem
ent/
treat
y/ M
OU
ex
ists
spe
cific
to th
e TB
A, o
ther
tre
atie
s or
agr
eem
ents
may
exi
st
(not
ably
at t
he re
gion
al le
vel),
an
d/or
non
-bin
ding
inst
rum
ents
(s
uch
as U
N re
solu
tions
, or
decl
arat
ions
) at
glo
bal o
r re
gion
al le
vel,
prov
idin
g fo
r tra
ns-
boun
dary
(TB
) wat
ers
in g
ener
al,
whi
ch a
re o
f rel
evan
ce to
the
TBA
, if o
nly
by im
plic
atio
n. T
hese
ne
ed to
be
acco
unte
d fo
r in
orde
r to
acc
urat
ely
char
acte
rize
this
in
dica
tor.
5.2
Tran
sbou
ndar
y in
stitu
tiona
l fra
mew
ork
Q4,
Q8]
Exi
sten
ce, m
anda
te (a
nd p
resu
med
ca
pabi
litie
s) o
f ins
titut
ions
or i
nstit
utio
nal
arra
ngem
ents
for m
anag
ing
the
TBA
.
The
high
er th
e sc
ore
the
mor
e ar
ticul
ate
and
com
preh
ensi
ve th
e
1. (N
o bi
- or
mul
ti-na
tiona
l tra
ns-
boun
dary
inst
itutio
n in
exi
sten
ce w
ith
man
date
for T
BA
) 2.
(Bi-
or m
ulti-
natio
nal t
rans
-bou
ndar
y
The
bi-
or m
ulti-
natio
nal T
BA
in
stitu
tion
is c
hara
cter
ized
by
the
natu
re a
nd e
xten
t of i
ts m
anda
te,
as s
pelt
out i
n th
e re
leva
nt le
gal

72. GUIDELINES FOR MULTIDISCIPLINARY TBA ASSESSMENT
trans
boun
dary
in
stitu
tiona
l fra
mew
ork.
inst
itutio
n ex
ists
with
man
date
for T
BA
) [Q
4 or
Q8]
A
dd:
+
1 if
it co
vers
dat
a co
llect
ion
and
exch
ange
, and
mon
itorin
g +
1 if
it co
vers
util
izat
ion
of T
BA
wat
ers
(wat
er a
lloca
tion)
+
1 if
it co
vers
pro
tect
ion
of T
BA
w
ater
s fro
m p
ollu
tion
+1
if it
cove
rs th
e re
solu
tion
of
disp
utes
3.
(ins
titut
ion
has
staf
f and
a b
udge
t)
inst
rum
ent (
treat
y, a
gree
men
t, M
OU
). H
owev
er, t
he in
stitu
tion’
s ca
pabi
lity
- in
term
s of
sta
ffing
an
d bu
dget
- to
del
iver
on
its
assi
gned
man
date
is a
lso
rele
vant
. Whi
le th
e ta
ble
capt
ures
bo
th e
lem
ents
, the
ir ad
equa
cy
rela
tive
to th
e in
stitu
tion’
s as
sign
ed m
anda
te is
hig
hly
spec
ulat
ive,
and
impo
ssib
le to
ch
arac
teriz
e ob
ject
ivel
y. It
em N
o.
3 sh
ould
incl
ude
esta
blis
hed
post
s an
d po
sts
whi
ch a
re
actu
ally
enc
umbe
red.
6 –
Ena
blin
g en
viro
nmen
t for
tran
sbou
ndar
y aq
uife
r re
sour
ces
man
agem
ent a
t dom
estic
leve
l (fo
r na
tiona
l im
plem
enta
tion
of T
BA
trea
ty/a
gree
men
t/M
OU
)
No
C
ateg
ori
es a
nd in
dic
ato
r na
mes
In
dic
ato
r d
efin
itio
ns
Sco
ring
C
lass
ifica
tion/
sco
ring
R
emar
ks
6.1
Pol
icy
fram
ewor
k [Q
12]
Ext
ent o
f gro
undw
ater
-spe
cific
pol
icy
cove
rage
Th
e hi
gher
the
scor
e th
e m
ore
exte
nsiv
e th
e po
licy
cove
rage
0. (T
here
is n
o po
licy
expl
icitl
y or
im
plic
itly
cove
ring
grou
ndw
ater
) [Q
12]
1. (G
roun
dwat
er is
cov
ered
/touc
hed
upon
by
othe
r pol
icie
s) [Q
12]
2. (O
ffici
al g
roun
dwat
er p
olic
y ex
ists
) [Q
12]
6.2
Le
gisl
ativ
e/re
gula
tory
fra
mew
ork
[Q10
, Q11
]
Exi
sten
ce o
f gro
undw
ater
-spe
cific
le
gisl
atio
n an
d re
gula
tion
in th
e st
atut
e bo
oks
The
high
er th
e sc
ore
the
mor
e gr
ound
wat
er-
spec
ific
the
legi
slat
ion/
regu
lati
on o
n th
e st
atut
e bo
oks
0. (T
here
is n
o le
gisl
atio
n co
verin
g ex
plic
itly
or o
nly
impl
icitl
y gr
ound
wat
er)
[Q10
+Q
11]
1. (G
roun
dwat
er c
over
ed b
y no
n-gr
ound
wat
er-s
peci
fic le
gisl
atio
n)
[Q10
+Q
11]
2. (G
roun
dwat
er-s
peci
fic le
gisl
atio
n ex
ists
) [Q
10+
Q11
]
Legi
slat
ion
incl
udes
act
s of
pa
rliam
ent (
prim
ary
legi
slat
ion)
an
d go
vern
men
t reg
ulat
ions
(s
econ
dary
or s
ubor
dina
te
legi
slat
ion)
. If a
vaila
ble,
m
inis
teria
l ord
ers
and
circ
ular
s ar
e al
so re
leva
nt.
6.3
Lega
l sta
tus
of g
roun
dwat
er
[Q13
, Q14
]
Ow
ners
hip,
trus
tees
hip,
con
trol o
f gr
ound
wat
er
The
high
er th
e sc
ore
the
mor
e gr
ound
wat
er is
at
tract
ed in
the
sphe
re o
f pu
blic
/gov
ernm
ent
1. (G
roun
dwat
er is
ow
ned
by th
e ov
erly
ing
land
owne
r - p
rivat
e ow
ners
hip)
[Q13
] 2.
(Gro
undw
ater
is m
ixed
pub
lic/p
rivat
e pr
oper
ty) [
Q13
+Q
14]
3. (G
roun
dwat
er is
pub
lic p
rope
rty)
Gro
undw
ater
may
hav
e pu
blic
pr
oper
ty s
tatu
s un
der a
var
iety
of
lega
l con
stru
cts
(pub
lic
owne
rshi
p or
dom
ain,
pub
lic tr
ust
or g
uard
ians
hip,
sup
erio
r use
r an
d th
e rig
ht o
f con
trol v
este
d in
al c
ontro
l [Q
14]
the
stat
e).
6.4
Gro
undw
ater
pla
nnin
g fra
mew
ork
[Q15
]
Legi
slat
ion
on g
roun
dwat
er m
anag
emen
t pl
anni
ng
(inve
ntor
y/as
sess
men
t/mon
itorin
g,
allo
catio
n, p
ollu
tion
cont
rol)
on th
e st
atut
e bo
oks
The
high
er th
e sc
ore
the
mor
e gr
ound
wat
er-
spec
ific
plan
ning
m
echa
nism
s pr
ovid
ed fo
r in
legi
slat
ion/
regu
lati
on
1. (L
egis
latio
n pr
ovid
es fo
r wat
er
reso
urce
s pl
anni
ng) [
Q15
] 2.
(With
spe
cific
refe
renc
e to
gr
ound
wat
er) [
Q15
]
The
refe
renc
e he
re is
to
legi
slat
ion
prov
idin
g fo
r a n
atio
nal
wat
er m
aste
r pla
n, a
nd/o
r ba
sin/
aqui
fer m
anag
emen
t pla
ns,
and
asso
ciat
ed g
over
nmen
tal
func
tions
suc
h as
, not
ably
, in
vent
ory,
ass
essm
ent a
nd
mon
itorin
g.
6.5
Reg
ulat
ory
fram
ewor
k of
gr
ound
wat
er a
bstra
ctio
n an
d us
e [Q
17 th
roug
h Q
27]
Com
preh
ensi
vene
ss o
f gro
undw
ater
ab
stra
ctio
n/us
e le
gisl
atio
n/re
gula
tion
on
the
stat
ute
book
s
The
high
er th
e sc
ore
the
mor
e co
mpr
ehen
sive
the
cove
rage
of G
W
abst
ract
ion/
use
in
legi
slat
ion/
regu
lati
on
1. (G
W a
bstra
ctio
n re
quire
s a
licen
ce/p
erm
it/co
nces
sion
) [Q
17]
Add
: +
1 if
exce
ptio
ns a
re m
ade
to li
cenc
ing
requ
irem
ents
[Q
18]
+1
if lic
ence
s ar
e tim
e-re
stric
ted
[Q19
] +
1 if
char
ges
levi
ed o
n lic
ence
s in
re
spec
t of G
W [Q
20]
+1
if w
ell d
rillin
g re
quire
s a
perm
it/lic
ence
/aut
horiz
atio
n [Q
21]
+1
if lic
ence
s, e
tc. c
an b
e re
view
ed
and
amen
ded
by g
over
nmen
t [Q
22]
+1
if lic
ence
s, e
tc. c
an b
e su
spen
ded
or te
rmin
ated
by
gove
rnm
ent [
Q23
] +
1 if
licen
ces,
etc
. can
be
trade
d (b
ough
t and
sol
d) fo
r a p
rice
[Q24
] +
1 if
EIA
requ
ired
for w
ell d
rillin
g/G
W
abst
ract
ion
licen
ce, e
tc. a
pplic
atio
ns
[Q25
] +
1 if
GW
use
rs m
ust m
onito
r and
re
port
to g
over
nmen
t [Q
26]
+1
if un
law
ful b
ehav
iour
is s
anct
ione
d w
ith p
enal
ties
[Q27
]
Cha
rges
mus
t be
kept
dis
tinct
fro
m a
dmin
istra
tive
fees
. Cha
rges
re
flect
the
‘use
r pay
s’ p
rinci
ple,
an
d te
nd to
be
paya
ble
at re
gula
r in
terv
als
for t
he li
fe o
f the
lice
nce.
A
dmin
istra
tive
fees
tend
to b
e on
e-of
f, an
d ar
e le
vied
in
conn
ectio
n w
ith th
e ad
min
istra
tive
proc
essi
ng o
f lic
ence
app
licat
ions
, ren
ewal
s, o
r ot
her a
dmin
istra
tive
actio
ns. T
hey
are
not a
true
refle
ctio
n of
the
‘use
r pay
s’ p
rinci
ple.
6.6
Reg
ulat
ory
fram
ewor
k fo
r th
e pr
otec
tion
of G
W fr
om
poin
t sou
rce
pollu
tion
[Q28
thro
ugh
Q39
]
Com
preh
ensi
vene
ss o
f gro
undw
ater
po
llutio
n co
ntro
l leg
isla
tion/
regu
latio
n on
th
e st
atut
e bo
oks
(poi
nt s
ourc
e po
llutio
n)
The
high
er th
e sc
ore
the
mor
e co
mpr
ehen
sive
the
cove
rage
of G
W
pollu
tion
cont
rol
from
poi
nt s
ourc
es
in
legi
slat
ion/
regu
lati
on
1. (D
isch
argi
ng w
aste
/wat
er o
n th
e gr
ound
, und
er th
e gr
ound
requ
ires
a pe
rmit)
[Q28
] A
dd:
+1
if pe
rmits
are
tim
e-re
stric
ted
[Q29
] +
1 if
perm
its a
re s
ubje
ct to
ob
serv
ance
of s
tand
ards
of e
fflue
nt
qual
ity [
Q30
] +
1 if
perm
its a
re s
ubje
ct to
Cha
rges
are
a re
flect
ion
of th
e ‘p
ollu
ter p
ays’
prin
cipl
e. S
ee in
th
is re
gard
the
rem
arks
und
er 6
.5
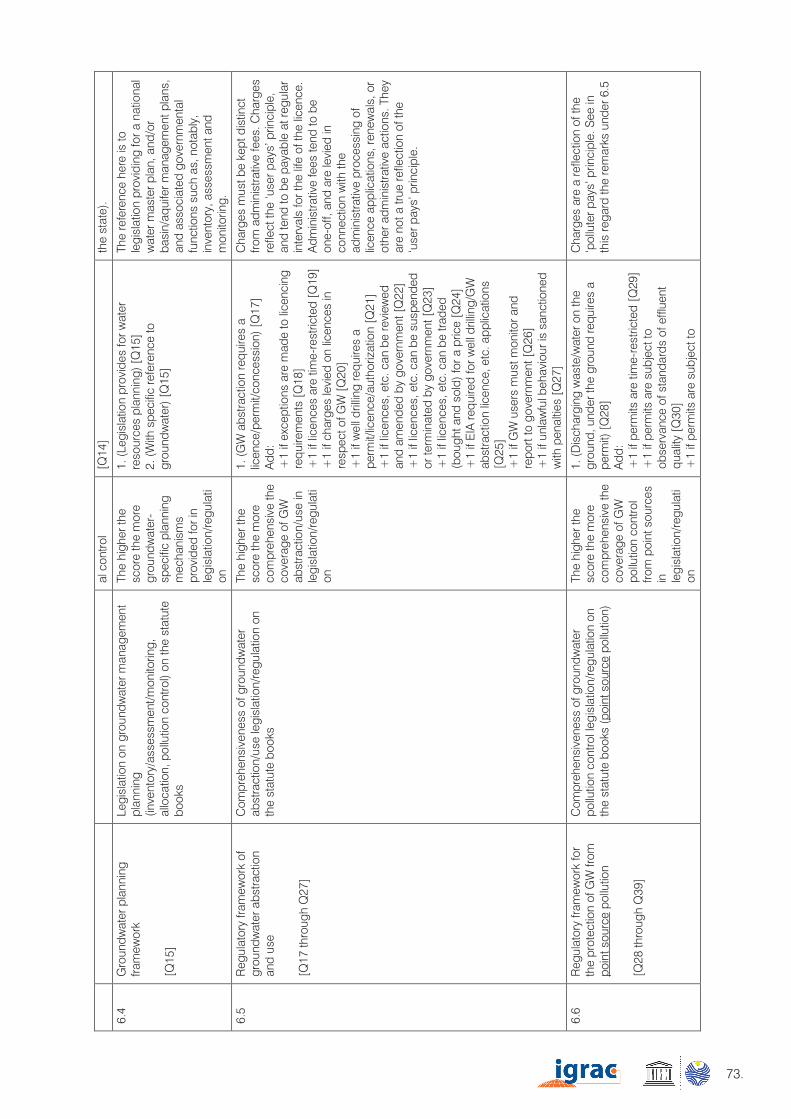
73.
trans
boun
dary
in
stitu
tiona
l fra
mew
ork.
inst
itutio
n ex
ists
with
man
date
for T
BA
) [Q
4 or
Q8]
A
dd:
+
1 if
it co
vers
dat
a co
llect
ion
and
exch
ange
, and
mon
itorin
g +
1 if
it co
vers
util
izat
ion
of T
BA
wat
ers
(wat
er a
lloca
tion)
+
1 if
it co
vers
pro
tect
ion
of T
BA
w
ater
s fro
m p
ollu
tion
+1
if it
cove
rs th
e re
solu
tion
of
disp
utes
3.
(ins
titut
ion
has
staf
f and
a b
udge
t)
inst
rum
ent (
treat
y, a
gree
men
t, M
OU
). H
owev
er, t
he in
stitu
tion’
s ca
pabi
lity
- in
term
s of
sta
ffing
an
d bu
dget
- to
del
iver
on
its
assi
gned
man
date
is a
lso
rele
vant
. Whi
le th
e ta
ble
capt
ures
bo
th e
lem
ents
, the
ir ad
equa
cy
rela
tive
to th
e in
stitu
tion’
s as
sign
ed m
anda
te is
hig
hly
spec
ulat
ive,
and
impo
ssib
le to
ch
arac
teriz
e ob
ject
ivel
y. It
em N
o.
3 sh
ould
incl
ude
esta
blis
hed
post
s an
d po
sts
whi
ch a
re
actu
ally
enc
umbe
red.
6 –
Ena
blin
g en
viro
nmen
t for
tran
sbou
ndar
y aq
uife
r re
sour
ces
man
agem
ent a
t dom
estic
leve
l (fo
r na
tiona
l im
plem
enta
tion
of T
BA
trea
ty/a
gree
men
t/M
OU
)
No
C
ateg
ori
es a
nd in
dic
ato
r na
mes
In
dic
ato
r d
efin
itio
ns
Sco
ring
C
lass
ifica
tion/
sco
ring
R
emar
ks
6.1
Pol
icy
fram
ewor
k [Q
12]
Ext
ent o
f gro
undw
ater
-spe
cific
pol
icy
cove
rage
Th
e hi
gher
the
scor
e th
e m
ore
exte
nsiv
e th
e po
licy
cove
rage
0. (T
here
is n
o po
licy
expl
icitl
y or
im
plic
itly
cove
ring
grou
ndw
ater
) [Q
12]
1. (G
roun
dwat
er is
cov
ered
/touc
hed
upon
by
othe
r pol
icie
s) [Q
12]
2. (O
ffici
al g
roun
dwat
er p
olic
y ex
ists
) [Q
12]
6.2
Le
gisl
ativ
e/re
gula
tory
fra
mew
ork
[Q10
, Q11
]
Exi
sten
ce o
f gro
undw
ater
-spe
cific
le
gisl
atio
n an
d re
gula
tion
in th
e st
atut
e bo
oks
The
high
er th
e sc
ore
the
mor
e gr
ound
wat
er-
spec
ific
the
legi
slat
ion/
regu
lati
on o
n th
e st
atut
e bo
oks
0. (T
here
is n
o le
gisl
atio
n co
verin
g ex
plic
itly
or o
nly
impl
icitl
y gr
ound
wat
er)
[Q10
+Q
11]
1. (G
roun
dwat
er c
over
ed b
y no
n-gr
ound
wat
er-s
peci
fic le
gisl
atio
n)
[Q10
+Q
11]
2. (G
roun
dwat
er-s
peci
fic le
gisl
atio
n ex
ists
) [Q
10+
Q11
]
Legi
slat
ion
incl
udes
act
s of
pa
rliam
ent (
prim
ary
legi
slat
ion)
an
d go
vern
men
t reg
ulat
ions
(s
econ
dary
or s
ubor
dina
te
legi
slat
ion)
. If a
vaila
ble,
m
inis
teria
l ord
ers
and
circ
ular
s ar
e al
so re
leva
nt.
6.3
Lega
l sta
tus
of g
roun
dwat
er
[Q13
, Q14
]
Ow
ners
hip,
trus
tees
hip,
con
trol o
f gr
ound
wat
er
The
high
er th
e sc
ore
the
mor
e gr
ound
wat
er is
at
tract
ed in
the
sphe
re o
f pu
blic
/gov
ernm
ent
1. (G
roun
dwat
er is
ow
ned
by th
e ov
erly
ing
land
owne
r - p
rivat
e ow
ners
hip)
[Q13
] 2.
(Gro
undw
ater
is m
ixed
pub
lic/p
rivat
e pr
oper
ty) [
Q13
+Q
14]
3. (G
roun
dwat
er is
pub
lic p
rope
rty)
Gro
undw
ater
may
hav
e pu
blic
pr
oper
ty s
tatu
s un
der a
var
iety
of
lega
l con
stru
cts
(pub
lic
owne
rshi
p or
dom
ain,
pub
lic tr
ust
or g
uard
ians
hip,
sup
erio
r use
r an
d th
e rig
ht o
f con
trol v
este
d in
al c
ontro
l [Q
14]
the
stat
e).
6.4
Gro
undw
ater
pla
nnin
g fra
mew
ork
[Q15
]
Legi
slat
ion
on g
roun
dwat
er m
anag
emen
t pl
anni
ng
(inve
ntor
y/as
sess
men
t/mon
itorin
g,
allo
catio
n, p
ollu
tion
cont
rol)
on th
e st
atut
e bo
oks
The
high
er th
e sc
ore
the
mor
e gr
ound
wat
er-
spec
ific
plan
ning
m
echa
nism
s pr
ovid
ed fo
r in
legi
slat
ion/
regu
lati
on
1. (L
egis
latio
n pr
ovid
es fo
r wat
er
reso
urce
s pl
anni
ng) [
Q15
] 2.
(With
spe
cific
refe
renc
e to
gr
ound
wat
er) [
Q15
]
The
refe
renc
e he
re is
to
legi
slat
ion
prov
idin
g fo
r a n
atio
nal
wat
er m
aste
r pla
n, a
nd/o
r ba
sin/
aqui
fer m
anag
emen
t pla
ns,
and
asso
ciat
ed g
over
nmen
tal
func
tions
suc
h as
, not
ably
, in
vent
ory,
ass
essm
ent a
nd
mon
itorin
g.
6.5
Reg
ulat
ory
fram
ewor
k of
gr
ound
wat
er a
bstra
ctio
n an
d us
e [Q
17 th
roug
h Q
27]
Com
preh
ensi
vene
ss o
f gro
undw
ater
ab
stra
ctio
n/us
e le
gisl
atio
n/re
gula
tion
on
the
stat
ute
book
s
The
high
er th
e sc
ore
the
mor
e co
mpr
ehen
sive
the
cove
rage
of G
W
abst
ract
ion/
use
in
legi
slat
ion/
regu
lati
on
1. (G
W a
bstra
ctio
n re
quire
s a
licen
ce/p
erm
it/co
nces
sion
) [Q
17]
Add
: +
1 if
exce
ptio
ns a
re m
ade
to li
cenc
ing
requ
irem
ents
[Q
18]
+1
if lic
ence
s ar
e tim
e-re
stric
ted
[Q19
] +
1 if
char
ges
levi
ed o
n lic
ence
s in
re
spec
t of G
W [Q
20]
+1
if w
ell d
rillin
g re
quire
s a
perm
it/lic
ence
/aut
horiz
atio
n [Q
21]
+1
if lic
ence
s, e
tc. c
an b
e re
view
ed
and
amen
ded
by g
over
nmen
t [Q
22]
+1
if lic
ence
s, e
tc. c
an b
e su
spen
ded
or te
rmin
ated
by
gove
rnm
ent [
Q23
] +
1 if
licen
ces,
etc
. can
be
trade
d (b
ough
t and
sol
d) fo
r a p
rice
[Q24
] +
1 if
EIA
requ
ired
for w
ell d
rillin
g/G
W
abst
ract
ion
licen
ce, e
tc. a
pplic
atio
ns
[Q25
] +
1 if
GW
use
rs m
ust m
onito
r and
re
port
to g
over
nmen
t [Q
26]
+1
if un
law
ful b
ehav
iour
is s
anct
ione
d w
ith p
enal
ties
[Q27
]
Cha
rges
mus
t be
kept
dis
tinct
fro
m a
dmin
istra
tive
fees
. Cha
rges
re
flect
the
‘use
r pay
s’ p
rinci
ple,
an
d te
nd to
be
paya
ble
at re
gula
r in
terv
als
for t
he li
fe o
f the
lice
nce.
A
dmin
istra
tive
fees
tend
to b
e on
e-of
f, an
d ar
e le
vied
in
conn
ectio
n w
ith th
e ad
min
istra
tive
proc
essi
ng o
f lic
ence
app
licat
ions
, ren
ewal
s, o
r ot
her a
dmin
istra
tive
actio
ns. T
hey
are
not a
true
refle
ctio
n of
the
‘ use
r pay
s’ p
rinci
ple.
6.6
Reg
ulat
ory
fram
ewor
k fo
r th
e pr
otec
tion
of G
W fr
om
poin
t sou
rce
pollu
tion
[Q28
thro
ugh
Q39
]
Com
preh
ensi
vene
ss o
f gro
undw
ater
po
llutio
n co
ntro
l leg
isla
tion/
regu
latio
n on
th
e st
atut
e bo
oks
(poi
nt s
ourc
e po
llutio
n)
The
high
er th
e sc
ore
the
mor
e co
mpr
ehen
sive
the
cove
rage
of G
W
pollu
tion
cont
rol
from
poi
nt s
ourc
es
in
legi
slat
ion/
regu
lati
on
1. (D
isch
argi
ng w
aste
/wat
er o
n th
e gr
ound
, und
er th
e gr
ound
requ
ires
a pe
rmit)
[Q28
] A
dd:
+1
if pe
rmits
are
tim
e-re
stric
ted
[Q29
] +
1 if
perm
its a
re s
ubje
ct to
ob
serv
ance
of s
tand
ards
of e
fflue
nt
qual
ity [
Q30
] +
1 if
perm
its a
re s
ubje
ct to
Cha
rges
are
a re
flect
ion
of th
e ‘p
ollu
ter p
ays’
prin
cipl
e. S
ee in
th
is re
gard
the
rem
arks
und
er 6
.5
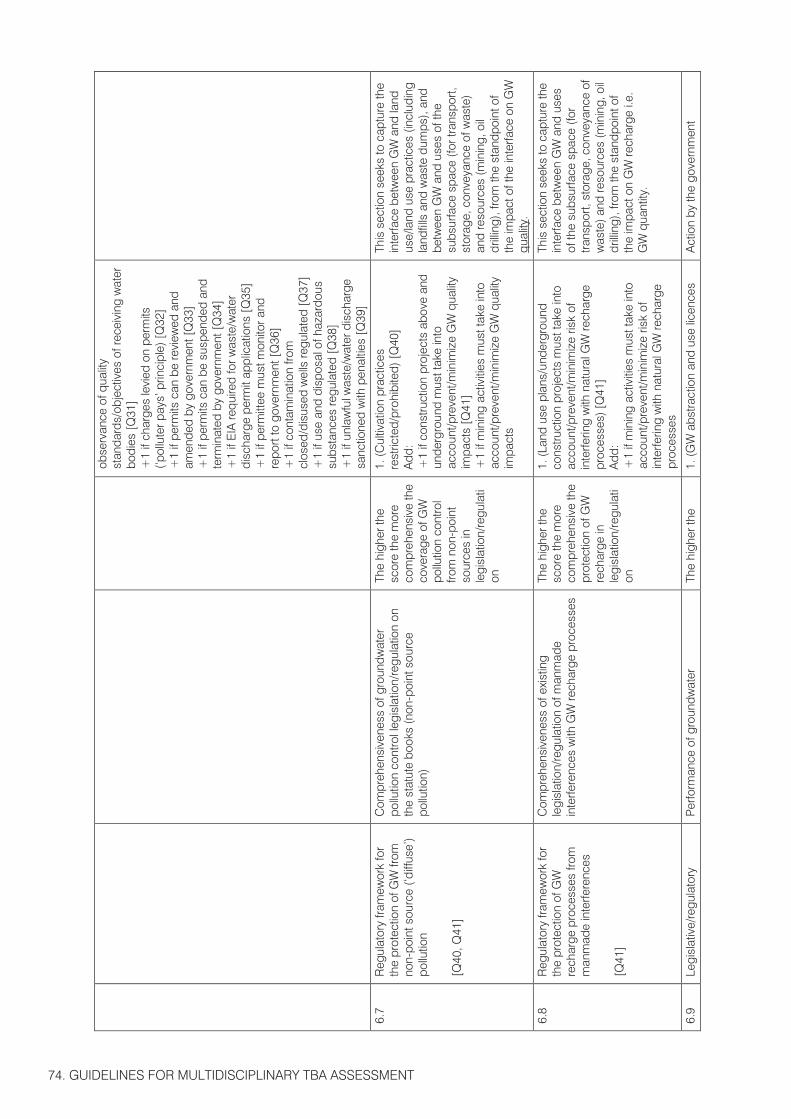
74. GUIDELINES FOR MULTIDISCIPLINARY TBA ASSESSMENT
obse
rvan
ce o
f qua
lity
stan
dard
s/ob
ject
ives
of r
ecei
ving
wat
er
bodi
es [
Q31
] +
1 if
char
ges
levi
ed o
n pe
rmits
(‘p
ollu
ter p
ays’
prin
cipl
e) [Q
32]
+1
if pe
rmits
can
be
revi
ewed
and
am
ende
d by
gov
ernm
ent [
Q33
] +
1 if
perm
its c
an b
e su
spen
ded
and
term
inat
ed b
y go
vern
men
t [Q
34]
+1
if E
IA re
quire
d fo
r was
te/w
ater
di
scha
rge
perm
it ap
plic
atio
ns [
Q35
] +
1 if
perm
ittee
mus
t mon
itor a
nd
repo
rt to
gov
ernm
ent [
Q36
] +
1 if
cont
amin
atio
n fro
m
clos
ed/d
isus
ed w
ells
regu
late
d [Q
37]
+1
if us
e an
d di
spos
al o
f haz
ardo
us
subs
tanc
es re
gula
ted
[Q38
] +
1 if
unla
wfu
l was
te/w
ater
dis
char
ge
sanc
tione
d w
ith p
enal
ties
[Q39
]
6.7
Reg
ulat
ory
fram
ewor
k fo
r th
e pr
otec
tion
of G
W fr
om
non-
poin
t sou
rce
(‘diff
use’
) po
llutio
n [Q
40, Q
41]
Com
preh
ensi
vene
ss o
f gro
undw
ater
po
llutio
n co
ntro
l leg
isla
tion/
regu
latio
n on
th
e st
atut
e bo
oks
(non
-poi
nt s
ourc
e po
llutio
n)
The
high
er th
e sc
ore
the
mor
e co
mpr
ehen
sive
the
cove
rage
of G
W
pollu
tion
cont
rol
from
non
-poi
nt
sour
ces
in
legi
slat
ion/
regu
lati
on
1. (C
ultiv
atio
n pr
actic
es
rest
ricte
d/pr
ohib
ited)
[Q40
] A
dd:
+1
if co
nstru
ctio
n pr
ojec
ts a
bove
and
un
derg
roun
d m
ust t
ake
into
ac
coun
t/pre
vent
/min
imiz
e G
W q
ualit
y im
pact
s [Q
41]
+1
if m
inin
g ac
tiviti
es m
ust t
ake
into
ac
coun
t/pre
vent
/min
imiz
e G
W q
ualit
y im
pact
s
This
sec
tion
seek
s to
cap
ture
the
inte
rface
bet
wee
n G
W a
nd la
nd
use/
land
use
pra
ctic
es (i
nclu
ding
la
ndfil
ls a
nd w
aste
dum
ps),
and
betw
een
GW
and
use
s of
the
subs
urfa
ce s
pace
(for
tran
spor
t, st
orag
e, c
onve
yanc
e of
was
te)
and
reso
urce
s (m
inin
g, o
il dr
illin
g), f
rom
the
stan
dpoi
nt o
f th
e im
pact
of t
he in
terfa
ce o
n G
W
qual
ity.
6.8
Reg
ulat
ory
fram
ewor
k fo
r th
e pr
otec
tion
of G
W
rech
arge
pro
cess
es fr
om
man
mad
e in
terfe
renc
es
[Q41
]
Com
preh
ensi
vene
ss o
f exi
stin
g le
gisl
atio
n/re
gula
tion
of m
anm
ade
inte
rfere
nces
with
GW
rech
arge
pro
cess
es
The
high
er th
e sc
ore
the
mor
e co
mpr
ehen
sive
the
prot
ectio
n of
GW
re
char
ge in
le
gisl
atio
n/re
gula
tion
1. (L
and
use
plan
s/un
derg
roun
d co
nstru
ctio
n pr
ojec
ts m
ust t
ake
into
ac
coun
t/pre
vent
/min
imiz
e ris
k of
in
terfe
ring
with
nat
ural
GW
rech
arge
pr
oces
ses)
[Q41
] A
dd:
+1
if m
inin
g ac
tiviti
es m
ust t
ake
into
ac
coun
t/pre
vent
/min
imiz
e ris
k of
in
terfe
ring
with
nat
ural
GW
rech
arge
pr
oces
ses
This
sec
tion
seek
s to
cap
ture
the
inte
rface
bet
wee
n G
W a
nd u
ses
of th
e su
bsur
face
spa
ce (f
or
trans
port,
sto
rage
, con
veya
nce
of
was
te) a
nd re
sour
ces
(min
ing,
oil
drill
ing)
, fro
m th
e st
andp
oint
of
the
impa
ct o
n G
W re
char
ge i.
e.
GW
qua
ntity
.
6.9
Legi
slat
ive/
regu
lato
ry
Per
form
ance
of g
roun
dwat
er
The
high
er th
e 1.
(GW
abs
tract
ion
and
use
licen
ces
Act
ion
by th
e go
vern
men
t
fram
ewor
k im
plem
ente
d
[Q16
, Q49
]
legi
slat
ion/
regu
latio
n in
forc
e sc
ore
the
mor
e ef
fect
ive
the
legi
slat
ion/
regu
lati
on (i
s pr
esum
ed to
be
)
gran
ted
(and
revi
ewed
, sus
pend
ed,
term
inat
ed) a
nd re
leva
nt re
cord
s av
aila
ble
and
acce
ssib
le) [
Q49
] A
dd:
+1
if w
aste
/wat
er d
isch
arge
per
mits
gr
ante
d (a
nd re
view
ed, s
uspe
nded
, te
rmin
ated
) and
rele
vant
reco
rds
avai
labl
e an
d ac
cess
ible
[Q49
]
+1
if ad
min
istra
tive
actio
n ta
ken
by
gove
rnm
ent u
nder
regu
lato
ry
fram
ewor
k fo
r the
pro
tect
ion
of G
W
from
non
poi
nt-s
ourc
e (d
iffus
e)
pollu
tion,
and
rele
vant
reco
rds
or o
ther
ev
iden
ce a
vaila
ble
and
acce
ssib
le
[Q49
] +
1 if
adm
inis
trativ
e ac
tion
take
n by
go
vern
men
t und
er re
gula
tory
fra
mew
ork
for t
he p
rote
ctio
n of
GW
re
char
ge p
roce
sses
from
man
mad
e in
terfe
renc
es, a
nd re
leva
nt re
cord
s or
ot
her e
vide
nce
avai
labl
e an
d ac
cess
ible
[Q49
] +
1 if
wat
er p
lans
man
date
d by
the
legi
slat
ion
are
in e
ffect
[Q16
]
auth
oriti
es re
spon
sibl
e fo
r the
ad
min
istra
tion
of th
e le
gisl
atio
n is
ev
iden
ced
by th
e nu
mbe
r and
ki
nds
of a
dmin
istra
tive
licen
ces/
perm
its is
sued
, re
view
ed, r
enew
ed, s
uspe
nded
, or
term
inat
ed, a
nd b
y th
e re
leva
nt
reco
rds.
A
wat
er p
lan
‘in e
ffect
’ is
a pl
an
that
(a) h
as b
een
prep
ared
and
(b
) for
mal
ly a
ppro
ved,
und
er th
e re
leva
nt p
lann
ing
prov
isio
ns o
f th
e la
w.
6.10
Le
gisl
ativ
e/re
gula
tory
fra
mew
ork
enfo
rced
[Q
50]
Per
form
ance
of g
roun
dwat
er
legi
slat
ion/
regu
latio
n in
forc
e Th
e hi
gher
the
scor
e th
e m
ore
effe
ctiv
e th
e le
gisl
atio
n/re
gula
tion
(is
pres
umed
to
be)
1. (V
iola
tions
of G
W a
bstra
ctio
n an
d us
e re
gula
tion
puni
shed
, and
rele
vant
ev
iden
ce/re
cord
s av
aila
ble
and
acce
ssib
le) [
Q50
] A
dd:
+1
if vi
olat
ions
of w
aste
/wat
er
disc
harg
e re
gula
tion
(for t
he p
rote
ctio
n of
GW
from
poi
nt-s
ourc
e po
llutio
n)
puni
shed
, and
rele
vant
ev
iden
ce/re
cord
s av
aila
ble
and
acce
ssib
le [Q
50]
+1
if vi
olat
ions
of r
egul
ator
y fra
mew
ork
for t
he p
rote
ctio
n of
GW
from
non
po
int-
sour
ce (d
iffus
e) p
ollu
tion
puni
shed
, and
rele
vant
ev
iden
ce/re
cord
s av
aila
ble
and
acce
ssib
le [Q
50]
+1
if vi
olat
ions
of r
egul
ator
y fra
mew
ork
(a) T
he m
onito
ring
and
insp
ectio
n pr
actic
e an
d re
cord
s of
the
gove
rnm
ent w
ater
adm
inis
tratio
n,
(b) t
he re
cord
of f
ines
and
oth
er
adm
inis
trativ
e pe
nalti
es m
eted
ou
t by
the
gove
rnm
ent w
ater
ad
min
istra
tion,
and
(c) t
he re
cord
of
crim
inal
pro
secu
tions
, su
cces
sful
or n
ot, i
n th
e ca
se o
f cr
imin
al b
ehav
iour
, all
prov
ide
usef
ul e
vide
nce
of th
e en
forc
emen
t of w
ater
legi
slat
ion.

75.
obse
rvan
ce o
f qua
lity
stan
dard
s/ob
ject
ives
of r
ecei
ving
wat
er
bodi
es [
Q31
] +
1 if
char
ges
levi
ed o
n pe
rmits
(‘p
ollu
ter p
ays’
prin
cipl
e) [Q
32]
+1
if pe
rmits
can
be
revi
ewed
and
am
ende
d by
gov
ernm
ent [
Q33
] +
1 if
perm
its c
an b
e su
spen
ded
and
term
inat
ed b
y go
vern
men
t [Q
34]
+1
if E
IA re
quire
d fo
r was
te/w
ater
di
scha
rge
perm
it ap
plic
atio
ns [
Q35
] +
1 if
perm
ittee
mus
t mon
itor a
nd
repo
rt to
gov
ernm
ent [
Q36
] +
1 if
cont
amin
atio
n fro
m
clos
ed/d
isus
ed w
ells
regu
late
d [Q
37]
+1
if us
e an
d di
spos
al o
f haz
ardo
us
subs
tanc
es re
gula
ted
[Q38
] +
1 if
unla
wfu
l was
te/w
ater
dis
char
ge
sanc
tione
d w
ith p
enal
ties
[Q39
]
6.7
Reg
ulat
ory
fram
ewor
k fo
r th
e pr
otec
tion
of G
W fr
om
non-
poin
t sou
rce
(‘diff
use’
) po
llutio
n [Q
40, Q
41]
Com
preh
ensi
vene
ss o
f gro
undw
ater
po
llutio
n co
ntro
l leg
isla
tion/
regu
latio
n on
th
e st
atut
e bo
oks
(non
-poi
nt s
ourc
e po
llutio
n)
The
high
er th
e sc
ore
the
mor
e co
mpr
ehen
sive
the
cove
rage
of G
W
pollu
tion
cont
rol
from
non
-poi
nt
sour
ces
in
legi
slat
ion/
regu
lati
on
1. (C
ultiv
atio
n pr
actic
es
rest
ricte
d/pr
ohib
ited)
[Q40
] A
dd:
+1
if co
nstru
ctio
n pr
ojec
ts a
bove
and
un
derg
roun
d m
ust t
ake
into
ac
coun
t/pre
vent
/min
imiz
e G
W q
ualit
y im
pact
s [Q
41]
+1
if m
inin
g ac
tiviti
es m
ust t
ake
into
ac
coun
t/pre
vent
/min
imiz
e G
W q
ualit
y im
pact
s
This
sec
tion
seek
s to
cap
ture
the
inte
rface
bet
wee
n G
W a
nd la
nd
use/
land
use
pra
ctic
es (i
nclu
ding
la
ndfil
ls a
nd w
aste
dum
ps),
and
betw
een
GW
and
use
s of
the
subs
urfa
ce s
pace
(for
tran
spor
t, st
orag
e, c
onve
yanc
e of
was
te)
and
reso
urce
s (m
inin
g, o
il dr
illin
g), f
rom
the
stan
dpoi
nt o
f th
e im
pact
of t
he in
terfa
ce o
n G
W
qual
ity.
6.8
Reg
ulat
ory
fram
ewor
k fo
r th
e pr
otec
tion
of G
W
rech
arge
pro
cess
es fr
om
man
mad
e in
terfe
renc
es
[Q41
]
Com
preh
ensi
vene
ss o
f exi
stin
g le
gisl
atio
n/re
gula
tion
of m
anm
ade
inte
rfere
nces
with
GW
rech
arge
pro
cess
es
The
high
er th
e sc
ore
the
mor
e co
mpr
ehen
sive
the
prot
ectio
n of
GW
re
char
ge in
le
gisl
atio
n/re
gula
tion
1. (L
and
use
plan
s/un
derg
roun
d co
nstru
ctio
n pr
ojec
ts m
ust t
ake
into
ac
coun
t/pre
vent
/min
imiz
e ris
k of
in
terfe
ring
with
nat
ural
GW
rech
arge
pr
oces
ses)
[Q41
] A
dd:
+1
if m
inin
g ac
tiviti
es m
ust t
ake
into
ac
coun
t/pre
vent
/min
imiz
e ris
k of
in
terfe
ring
with
nat
ural
GW
rech
arge
pr
oces
ses
This
sec
tion
seek
s to
cap
ture
the
inte
rface
bet
wee
n G
W a
nd u
ses
of th
e su
bsur
face
spa
ce (f
or
trans
port,
sto
rage
, con
veya
nce
of
was
te) a
nd re
sour
ces
(min
ing,
oil
drill
ing)
, fro
m th
e st
andp
oint
of
the
impa
ct o
n G
W re
char
ge i.
e.
GW
qua
ntity
.
6.9
Legi
slat
ive/
regu
lato
ry
Per
form
ance
of g
roun
dwat
er
The
high
er th
e 1.
(GW
abs
tract
ion
and
use
licen
ces
Act
ion
by th
e go
vern
men
t
fram
ewor
k im
plem
ente
d
[Q16
, Q49
]
legi
slat
ion/
regu
latio
n in
forc
e sc
ore
the
mor
e ef
fect
ive
the
legi
slat
ion/
regu
lati
on (i
s pr
esum
ed to
be
)
gran
ted
(and
revi
ewed
, sus
pend
ed,
term
inat
ed) a
nd re
leva
nt re
cord
s av
aila
ble
and
acce
ssib
le) [
Q49
] A
dd:
+1
if w
aste
/wat
er d
isch
arge
per
mits
gr
ante
d (a
nd re
view
ed, s
uspe
nded
, te
rmin
ated
) and
rele
vant
reco
rds
avai
labl
e an
d ac
cess
ible
[Q49
]
+1
if ad
min
istra
tive
actio
n ta
ken
by
gove
rnm
ent u
nder
regu
lato
ry
fram
ewor
k fo
r the
pro
tect
ion
of G
W
from
non
poi
nt-s
ourc
e (d
iffus
e)
pollu
tion,
and
rele
vant
reco
rds
or o
ther
ev
iden
ce a
vaila
ble
and
acce
ssib
le
[Q49
] +
1 if
adm
inis
trativ
e ac
tion
take
n by
go
vern
men
t und
er re
gula
tory
fra
mew
ork
for t
he p
rote
ctio
n of
GW
re
char
ge p
roce
sses
from
man
mad
e in
terfe
renc
es, a
nd re
leva
nt re
cord
s or
ot
her e
vide
nce
avai
labl
e an
d ac
cess
ible
[Q49
] +
1 if
wat
er p
lans
man
date
d by
the
legi
slat
ion
are
in e
ffect
[Q16
]
auth
oriti
es re
spon
sibl
e fo
r the
ad
min
istra
tion
of th
e le
gisl
atio
n is
ev
iden
ced
by th
e nu
mbe
r and
ki
nds
of a
dmin
istra
tive
licen
ces/
perm
its is
sued
, re
view
ed, r
enew
ed, s
uspe
nded
, or
term
inat
ed, a
nd b
y th
e re
leva
nt
reco
rds.
A
wat
er p
lan
‘in e
ffect
’ is
a pl
an
that
(a) h
as b
een
prep
ared
and
(b
) for
mal
ly a
ppro
ved,
und
er th
e re
leva
nt p
lann
ing
prov
isio
ns o
f th
e la
w.
6.10
Le
gisl
ativ
e/re
gula
tory
fra
mew
ork
enfo
rced
[Q
50]
Per
form
ance
of g
roun
dwat
er
legi
slat
ion/
regu
latio
n in
forc
e Th
e hi
gher
the
scor
e th
e m
ore
effe
ctiv
e th
e le
gisl
atio
n/re
gula
tion
(is
pres
umed
to
be)
1. (V
iola
tions
of G
W a
bstra
ctio
n an
d us
e re
gula
tion
puni
shed
, and
rele
vant
ev
iden
ce/re
cord
s av
aila
ble
and
acce
ssib
le) [
Q50
] A
dd:
+1
if vi
olat
ions
of w
aste
/wat
er
disc
harg
e re
gula
tion
(for t
he p
rote
ctio
n of
GW
from
poi
nt-s
ourc
e po
llutio
n)
puni
shed
, and
rele
vant
ev
iden
ce/re
cord
s av
aila
ble
and
acce
ssib
le [Q
50]
+1
if vi
olat
ions
of r
egul
ator
y fra
mew
ork
for t
he p
rote
ctio
n of
GW
from
non
po
int-
sour
ce (d
iffus
e) p
ollu
tion
puni
shed
, and
rele
vant
ev
iden
ce/re
cord
s av
aila
ble
and
acce
ssib
le [Q
50]
+1
if vi
olat
ions
of r
egul
ator
y fra
mew
ork
(a) T
he m
onito
ring
and
insp
ectio
n pr
actic
e an
d re
cord
s of
the
gove
rnm
ent w
ater
adm
inis
tratio
n,
(b) t
he re
cord
of f
ines
and
oth
er
adm
inis
trativ
e pe
nalti
es m
eted
ou
t by
the
gove
rnm
ent w
ater
ad
min
istra
tion,
and
(c) t
he re
cord
of
crim
inal
pro
secu
tions
, su
cces
sful
or n
ot, i
n th
e ca
se o
f cr
imin
al b
ehav
iour
, all
prov
ide
usef
ul e
vide
nce
of th
e en
forc
emen
t of w
ater
legi
slat
ion.
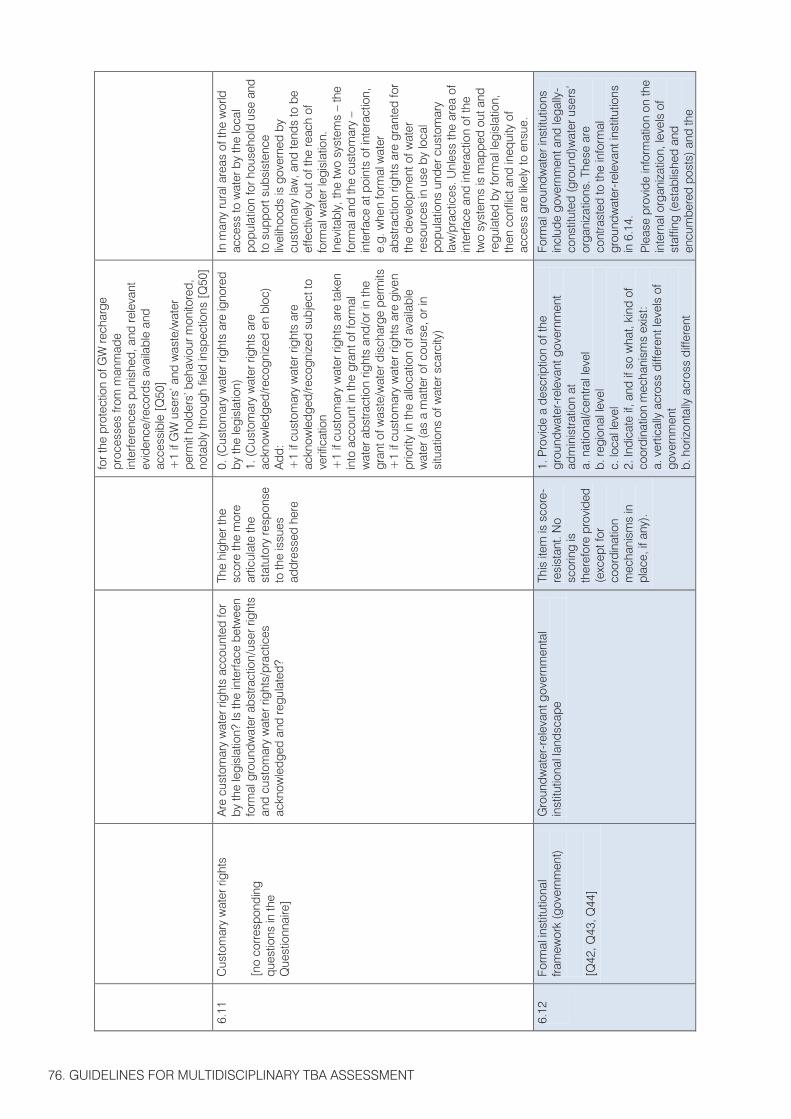
76. GUIDELINES FOR MULTIDISCIPLINARY TBA ASSESSMENT
for t
he p
rote
ctio
n of
GW
rech
arge
pr
oces
ses
from
man
mad
e in
terfe
renc
es p
unis
hed,
and
rele
vant
ev
iden
ce/re
cord
s av
aila
ble
and
acce
ssib
le [Q
50]
+1
if G
W u
sers
’ and
was
te/w
ater
pe
rmit
hold
ers’
beh
avio
ur m
onito
red,
no
tabl
y th
roug
h fie
ld in
spec
tions
[Q
50]
6.11
C
usto
mar
y w
ater
righ
ts
[no
corr
espo
ndin
g qu
estio
ns in
the
Que
stio
nnai
re]
Are
cus
tom
ary
wat
er ri
ghts
acc
ount
ed fo
r by
the
legi
slat
ion?
Is th
e in
terfa
ce b
etw
een
form
al g
roun
dwat
er a
bstra
ctio
n/us
er ri
ghts
an
d cu
stom
ary
wat
er ri
ghts
/pra
ctic
es
ackn
owle
dged
and
regu
late
d?
The
high
er th
e sc
ore
the
mor
e ar
ticul
ate
the
stat
utor
y re
spon
se
to th
e is
sues
ad
dres
sed
here
0. (C
usto
mar
y w
ater
righ
ts a
re ig
nore
d by
the
legi
slat
ion)
1.
(Cus
tom
ary
wat
er ri
ghts
are
ac
know
ledg
ed/re
cogn
ized
en
bloc
) A
dd:
+1
if cu
stom
ary
wat
er ri
ghts
are
ac
know
ledg
ed/re
cogn
ized
sub
ject
to
verif
icat
ion
+1
if cu
stom
ary
wat
er ri
ghts
are
take
n in
to a
ccou
nt in
the
gran
t of f
orm
al
wat
er a
bstra
ctio
n rig
hts
and/
or in
the
gran
t of w
aste
/wat
er d
isch
arge
per
mits
+
1 if
cust
omar
y w
ater
righ
ts a
re g
iven
pr
iorit
y in
the
allo
catio
n of
ava
ilabl
e w
ater
(as
a m
atte
r of c
ours
e, o
r in
situ
atio
ns o
f wat
er s
carc
ity)
In m
any
rura
l are
as o
f the
wor
ld
acce
ss to
wat
er b
y th
e lo
cal
popu
latio
n fo
r hou
seho
ld u
se a
nd
to s
uppo
rt su
bsis
tenc
e liv
elih
oods
is g
over
ned
by
cust
omar
y la
w, a
nd te
nds
to b
e ef
fect
ivel
y ou
t of t
he re
ach
of
form
al w
ater
legi
slat
ion.
In
evita
bly,
the
two
syst
ems
– th
e fo
rmal
and
the
cust
omar
y –
inte
rface
at p
oint
s of
inte
ract
ion,
e.
g. w
hen
form
al w
ater
ab
stra
ctio
n rig
hts
are
gran
ted
for
the
deve
lopm
ent o
f wat
er
reso
urce
s in
use
by
loca
l po
pula
tions
und
er c
usto
mar
y la
w/p
ract
ices
. Unl
ess
the
area
of
inte
rface
and
inte
ract
ion
of th
e tw
o sy
stem
s is
map
ped
out a
nd
regu
late
d by
form
al le
gisl
atio
n,
then
con
flict
and
ineq
uity
of
acce
ss a
re li
kely
to e
nsue
.
6.12
Form
al in
stitu
tiona
l fra
mew
ork
(gov
ernm
ent)
[Q42
, Q43
, Q44
]
Gro
undw
ater
-rel
evan
t gov
ernm
enta
l in
stitu
tiona
l lan
dsca
pe
This
item
is s
core
-re
sist
ant.
No
scor
ing
is
ther
efor
e pr
ovid
ed
(exc
ept f
or
coor
dina
tion
mec
hani
sms
in
plac
e, if
any
).
1. P
rovi
de a
des
crip
tion
of th
e
grou
ndw
ater
-rel
evan
t gov
ernm
ent
adm
inis
tratio
n at
a.
nat
iona
l/cen
tral l
evel
b.
regi
onal
leve
l c.
loca
l lev
el
2. In
dica
te if
, and
if s
o w
hat,
kind
of
coor
dina
tion
mec
hani
sms
exis
t: a.
ver
tical
ly a
cros
s di
ffere
nt le
vels
of
gove
rnm
ent
b. h
oriz
onta
lly a
cros
s di
ffere
nt
Form
al g
roun
dwat
er in
stitu
tions
in
clud
e go
vern
men
t and
lega
lly-
cons
titut
ed (g
roun
d)w
ater
use
rs’
orga
niza
tions
. The
se a
re
cont
rast
ed to
the
info
rmal
gr
ound
wat
er-r
elev
ant i
nstit
utio
ns
in 6
.14.
P
leas
e pr
ovid
e in
form
atio
n on
the
inte
rnal
org
aniz
atio
n, le
vels
of
staf
fing
(est
ablis
hed
and
encu
mbe
red
post
s) a
nd th
e
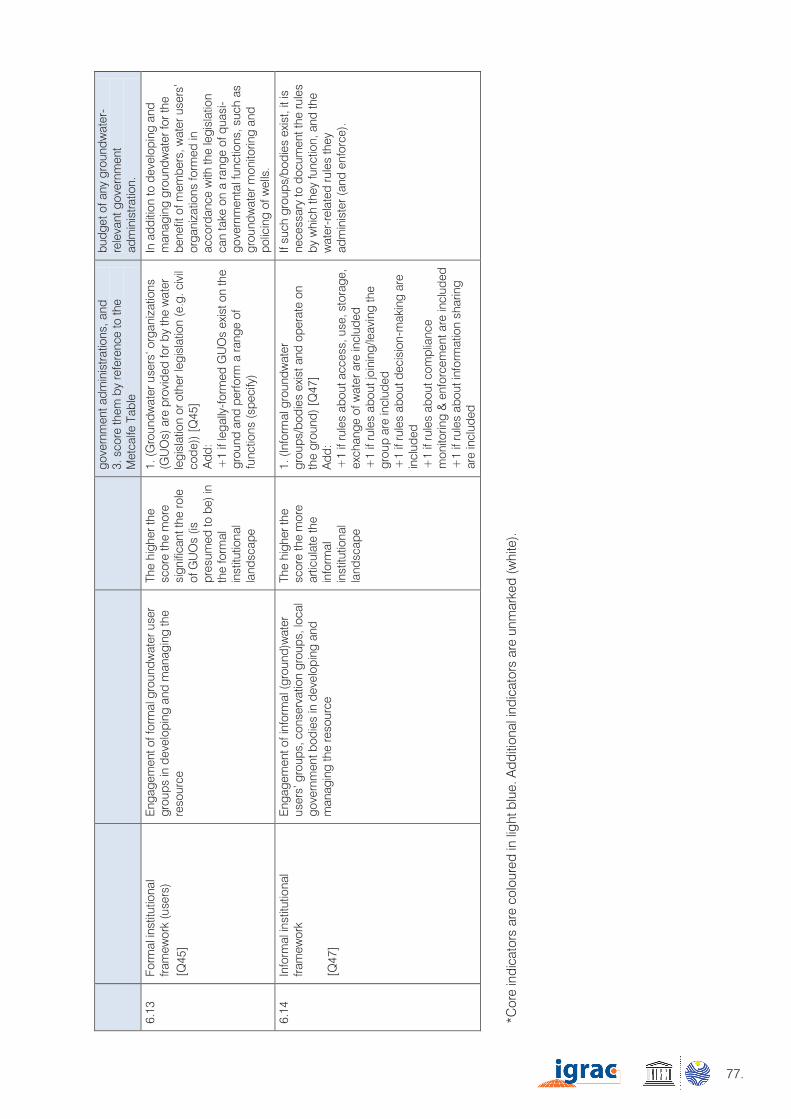
77.
for t
he p
rote
ctio
n of
GW
rech
arge
pr
oces
ses
from
man
mad
e in
terfe
renc
es p
unis
hed,
and
rele
vant
ev
iden
ce/re
cord
s av
aila
ble
and
acce
ssib
le [Q
50]
+1
if G
W u
sers
’ and
was
te/w
ater
pe
rmit
hold
ers’
beh
avio
ur m
onito
red,
no
tabl
y th
roug
h fie
ld in
spec
tions
[Q
50]
6.11
C
usto
mar
y w
ater
righ
ts
[no
corr
espo
ndin
g qu
estio
ns in
the
Que
stio
nnai
re]
Are
cus
tom
ary
wat
er ri
ghts
acc
ount
ed fo
r by
the
legi
slat
ion?
Is th
e in
terfa
ce b
etw
een
form
al g
roun
dwat
er a
bstra
ctio
n/us
er ri
ghts
an
d cu
stom
ary
wat
er ri
ghts
/pra
ctic
es
ackn
owle
dged
and
regu
late
d?
The
high
er th
e sc
ore
the
mor
e ar
ticul
ate
the
stat
utor
y re
spon
se
to th
e is
sues
ad
dres
sed
here
0. (C
usto
mar
y w
ater
righ
ts a
re ig
nore
d by
the
legi
slat
ion)
1.
(Cus
tom
ary
wat
er ri
ghts
are
ac
know
ledg
ed/re
cogn
ized
en
bloc
) A
dd:
+1
if cu
stom
ary
wat
er ri
ghts
are
ac
know
ledg
ed/re
cogn
ized
sub
ject
to
verif
icat
ion
+1
if cu
stom
ary
wat
er ri
ghts
are
take
n in
to a
ccou
nt in
the
gran
t of f
orm
al
wat
er a
bstra
ctio
n rig
hts
and/
or in
the
gran
t of w
aste
/wat
er d
isch
arge
per
mits
+
1 if
cust
omar
y w
ater
righ
ts a
re g
iven
pr
iorit
y in
the
allo
catio
n of
ava
ilabl
e w
ater
(as
a m
atte
r of c
ours
e, o
r in
situ
atio
ns o
f wat
er s
carc
ity)
In m
any
rura
l are
as o
f the
wor
ld
acce
ss to
wat
er b
y th
e lo
cal
popu
latio
n fo
r hou
seho
ld u
se a
nd
to s
uppo
rt su
bsis
tenc
e liv
elih
oods
is g
over
ned
by
cust
omar
y la
w, a
nd te
nds
to b
e ef
fect
ivel
y ou
t of t
he re
ach
of
form
al w
ater
legi
slat
ion.
In
evita
bly,
the
two
syst
ems
– th
e fo
rmal
and
the
cust
omar
y –
inte
rface
at p
oint
s of
inte
ract
ion,
e.
g. w
hen
form
al w
ater
ab
stra
ctio
n rig
hts
are
gran
ted
for
the
deve
lopm
ent o
f wat
er
reso
urce
s in
use
by
loca
l po
pula
tions
und
er c
usto
mar
y la
w/p
ract
ices
. Unl
ess
the
area
of
inte
rface
and
inte
ract
ion
of th
e tw
o sy
stem
s is
map
ped
out a
nd
regu
late
d by
form
al le
gisl
atio
n,
then
con
flict
and
ineq
uity
of
acce
ss a
re li
kely
to e
nsue
.
6.12
Form
al in
stitu
tiona
l fra
mew
ork
(gov
ernm
ent)
[Q42
, Q43
, Q44
]
Gro
undw
ater
-rel
evan
t gov
ernm
enta
l in
stitu
tiona
l lan
dsca
pe
This
item
is s
core
-re
sist
ant.
No
scor
ing
is
ther
efor
e pr
ovid
ed
(exc
ept f
or
coor
dina
tion
mec
hani
sms
in
plac
e, if
any
).
1. P
rovi
de a
des
crip
tion
of th
e
grou
ndw
ater
-rel
evan
t gov
ernm
ent
adm
inis
tratio
n at
a.
nat
iona
l/cen
tral l
evel
b.
regi
onal
leve
l c.
loca
l lev
el
2. In
dica
te if
, and
if s
o w
hat,
kind
of
coor
dina
tion
mec
hani
sms
exis
t: a.
ver
tical
ly a
cros
s di
ffere
nt le
vels
of
gove
rnm
ent
b. h
oriz
onta
lly a
cros
s di
ffere
nt
Form
al g
roun
dwat
er in
stitu
tions
in
clud
e go
vern
men
t and
lega
lly-
cons
titut
ed (g
roun
d)w
ater
use
rs’
orga
niza
tions
. The
se a
re
cont
rast
ed to
the
info
rmal
gr
ound
wat
er-r
elev
ant i
nstit
utio
ns
in 6
.14.
P
leas
e pr
ovid
e in
form
atio
n on
the
inte
rnal
org
aniz
atio
n, le
vels
of
staf
fing
(est
ablis
hed
and
encu
mbe
red
post
s) a
nd th
e
gove
rnm
ent a
dmin
istra
tions
, and
3.
sco
re th
em b
y re
fere
nce
to th
e M
etca
lfe T
able
budg
et o
f any
gro
undw
ater
-re
leva
nt g
over
nmen
t ad
min
istra
tion.
6.13
Fo
rmal
inst
itutio
nal
fram
ewor
k (u
sers
) [Q
45]
Eng
agem
ent o
f for
mal
gro
undw
ater
use
r gr
oups
in d
evel
opin
g an
d m
anag
ing
the
reso
urce
The
high
er th
e sc
ore
the
mor
e si
gnifi
cant
the
role
of
GU
Os
(is
pres
umed
to b
e) in
th
e fo
rmal
in
stitu
tiona
l la
ndsc
ape
1. (G
roun
dwat
er u
sers
’ org
aniz
atio
ns
(GU
Os)
are
pro
vide
d fo
r by
the
wat
er
legi
slat
ion
or o
ther
legi
slat
ion
(e.g
. civ
il co
de))
[Q45
] A
dd:
+1
if le
gally
-form
ed G
UO
s ex
ist o
n th
e gr
ound
and
per
form
a ra
nge
of
func
tions
(spe
cify
)
In a
dditi
on to
dev
elop
ing
and
man
agin
g gr
ound
wat
er fo
r the
be
nefit
of m
embe
rs, w
ater
use
rs’
orga
niza
tions
form
ed in
ac
cord
ance
with
the
legi
slat
ion
can
take
on
a ra
nge
of q
uasi
-go
vern
men
tal f
unct
ions
, suc
h as
gr
ound
wat
er m
onito
ring
and
polic
ing
of w
ells
.
6.14
In
form
al in
stitu
tiona
l fra
mew
ork
[Q47
]
Eng
agem
ent o
f inf
orm
al (g
roun
d)w
ater
us
ers’
gro
ups,
con
serv
atio
n gr
oups
, loc
al
gove
rnm
ent b
odie
s in
dev
elop
ing
and
man
agin
g th
e re
sour
ce
The
high
er th
e sc
ore
the
mor
e ar
ticul
ate
the
info
rmal
in
stitu
tiona
l la
ndsc
ape
1. (I
nfor
mal
gro
undw
ater
gr
oups
/bod
ies
exis
t and
ope
rate
on
the
grou
nd) [
Q47
] A
dd:
+1
if ru
les
abou
t acc
ess,
use
, sto
rage
, ex
chan
ge o
f wat
er a
re in
clud
ed
+1
if ru
les
abou
t joi
ning
/leav
ing
the
grou
p ar
e in
clud
ed
+1
if ru
les
abou
t dec
isio
n-m
akin
g ar
e in
clud
ed
+1
if ru
les
abou
t com
plia
nce
mon
itorin
g &
enf
orce
men
t are
incl
uded
+
1 if
rule
s ab
out i
nfor
mat
ion
shar
ing
are
incl
uded
If su
ch g
roup
s/bo
dies
exi
st, i
t is
nece
ssar
y to
doc
umen
t the
rule
s by
whi
ch th
ey fu
nctio
n, a
nd th
e w
ater
-rel
ated
rule
s th
ey
adm
inis
ter (
and
enfo
rce)
.
*Cor
e in
dica
tors
are
col
oure
d in
lig
ht b
lue.
Add
ition
al in
dica
tors
are
unm
arke
d (w
hite
).
80
APPENDIX 3.
79.
80
FORMULAS TO CALCULATE INDICATORS
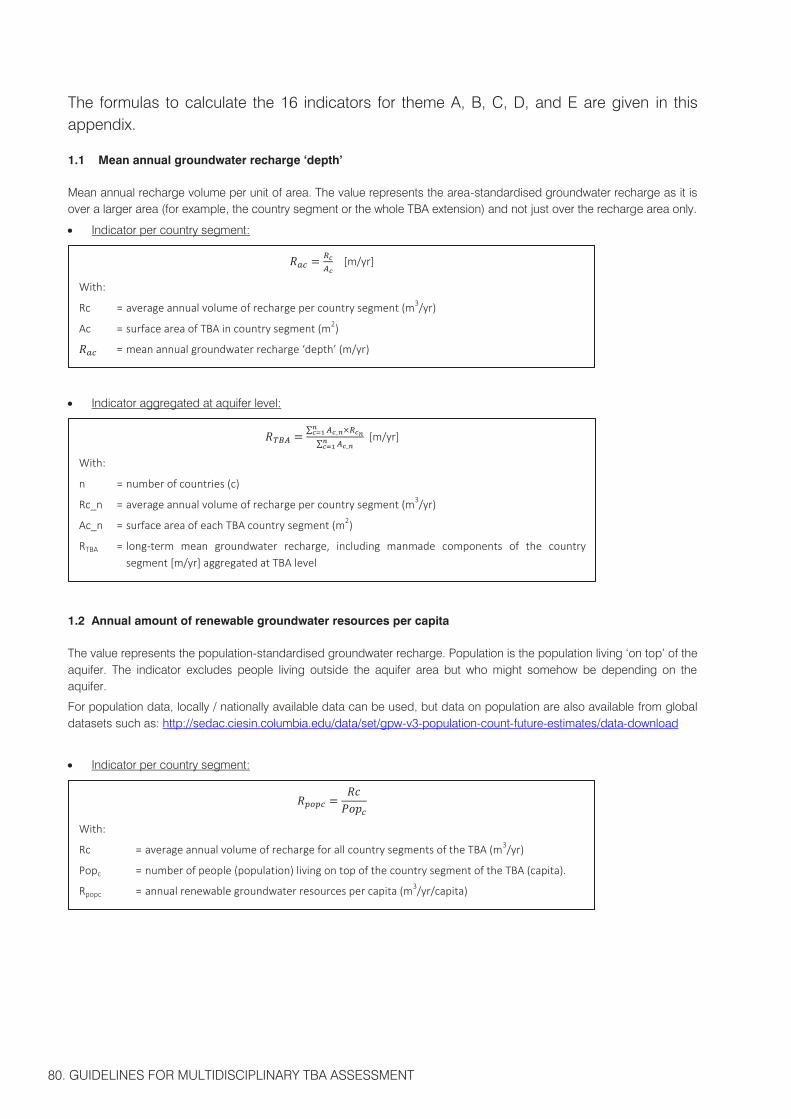
80. GUIDELINES FOR MULTIDISCIPLINARY TBA ASSESSMENT
The formulas to calculate the 16 indicators for theme A, B, C, D, and E are given in this appendix.
1.1 Mean annual groundwater recharge ‘depth’
Mean annual recharge volume per unit of area. The value represents the area-standardised groundwater recharge as it is over a larger area (for example, the country segment or the whole TBA extension) and not just over the recharge area only.
Indicator per country segment:
Indicator aggregated at aquifer level:
1.2 Annual amount of renewable groundwater resources per capita
The value represents the population-standardised groundwater recharge. Population is the population living ‘on top’ of the aquifer. The indicator excludes people living outside the aquifer area but who might somehow be depending on the aquifer.
For population data, locally / nationally available data can be used, but data on population are also available from global datasets such as: http://sedac.ciesin.columbia.edu/data/set/gpw-v3-population-count-future-estimates/data-download
Indicator per country segment:
[m/yr]
With:
Rc = average annual volume of recharge per country segment (m3/yr)
Ac = surface area of TBA in country segment (m2)
= mean annual groundwater recharge ‘depth’ (m/yr)
∑ ∑
[m/yr]
With:
n = number of countries (c)
Rc_n = average annual volume of recharge per country segment (m3/yr)
Ac_n = surface area of each TBA country segment (m2)
RTBA = long-term mean groundwater recharge, including manmade components of the country segment [m/yr] aggregated at TBA level
With:
Rc = average annual volume of recharge for all country segments of the TBA (m3/yr)
Popc = number of people (population) living on top of the country segment of the TBA (capita).
Rpopc = annual renewable groundwater resources per capita (m3/yr/capita)
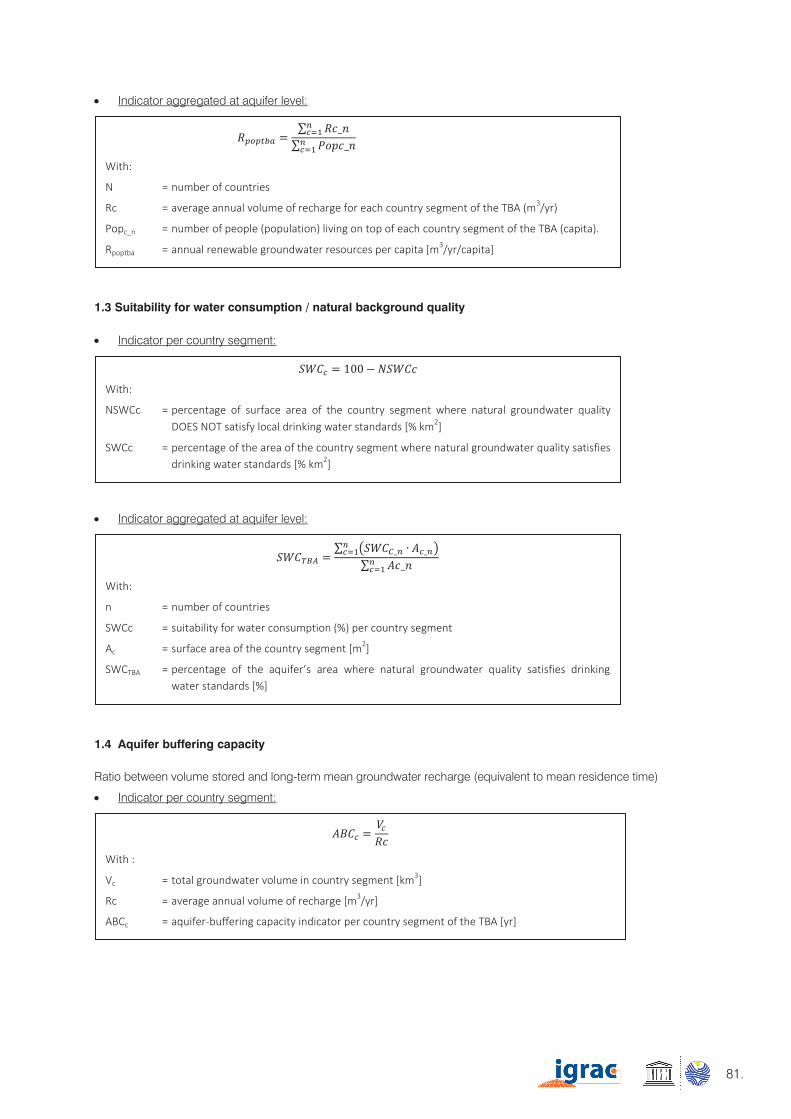
81.
The formulas to calculate the 16 indicators for theme A, B, C, D, and E are given in this appendix.
1.1 Mean annual groundwater recharge ‘depth’
Mean annual recharge volume per unit of area. The value represents the area-standardised groundwater recharge as it is over a larger area (for example, the country segment or the whole TBA extension) and not just over the recharge area only.
Indicator per country segment:
Indicator aggregated at aquifer level:
1.2 Annual amount of renewable groundwater resources per capita
The value represents the population-standardised groundwater recharge. Population is the population living ‘on top’ of the aquifer. The indicator excludes people living outside the aquifer area but who might somehow be depending on the aquifer.
For population data, locally / nationally available data can be used, but data on population are also available from global datasets such as: http://sedac.ciesin.columbia.edu/data/set/gpw-v3-population-count-future-estimates/data-download
Indicator per country segment:
[m/yr]
With:
Rc = average annual volume of recharge per country segment (m3/yr)
Ac = surface area of TBA in country segment (m2)
= mean annual groundwater recharge ‘depth’ (m/yr)
∑ ∑
[m/yr]
With:
n = number of countries (c)
Rc_n = average annual volume of recharge per country segment (m3/yr)
Ac_n = surface area of each TBA country segment (m2)
RTBA = long-term mean groundwater recharge, including manmade components of the country segment [m/yr] aggregated at TBA level
With:
Rc = average annual volume of recharge for all country segments of the TBA (m3/yr)
Popc = number of people (population) living on top of the country segment of the TBA (capita).
Rpopc = annual renewable groundwater resources per capita (m3/yr/capita)
Indicator aggregated at aquifer level:
1.3 Suitability for water consumption / natural background quality
Indicator per country segment:
Indicator aggregated at aquifer level:
1.4 Aquifer buffering capacity
Ratio between volume stored and long-term mean groundwater recharge (equivalent to mean residence time)
Indicator per country segment:
∑
∑
With:
N = number of countries
Rc = average annual volume of recharge for each country segment of the TBA (m3/yr)
Popc_n = number of people (population) living on top of each country segment of the TBA (capita).
Rpoptba = annual renewable groundwater resources per capita [m3/yr/capita]
With:
NSWCc = percentage of surface area of the country segment where natural groundwater quality DOES NOT satisfy local drinking water standards [% km2]
SWCc = percentage of the area of the country segment where natural groundwater quality satisfies drinking water standards [% km2]
∑ ( )
∑
With:
n = number of countries
SWCc = suitability for water consumption (%) per country segment
Ac = surface area of the country segment [m2]
SWCTBA = percentage of the aquifer’s area where natural groundwater quality satisfies drinking water standards [%]
With :
Vc = total groundwater volume in country segment [km3]
Rc = average annual volume of recharge [m3/yr]
ABCc = aquifer-buffering capacity indicator per country segment of the TBA [yr]
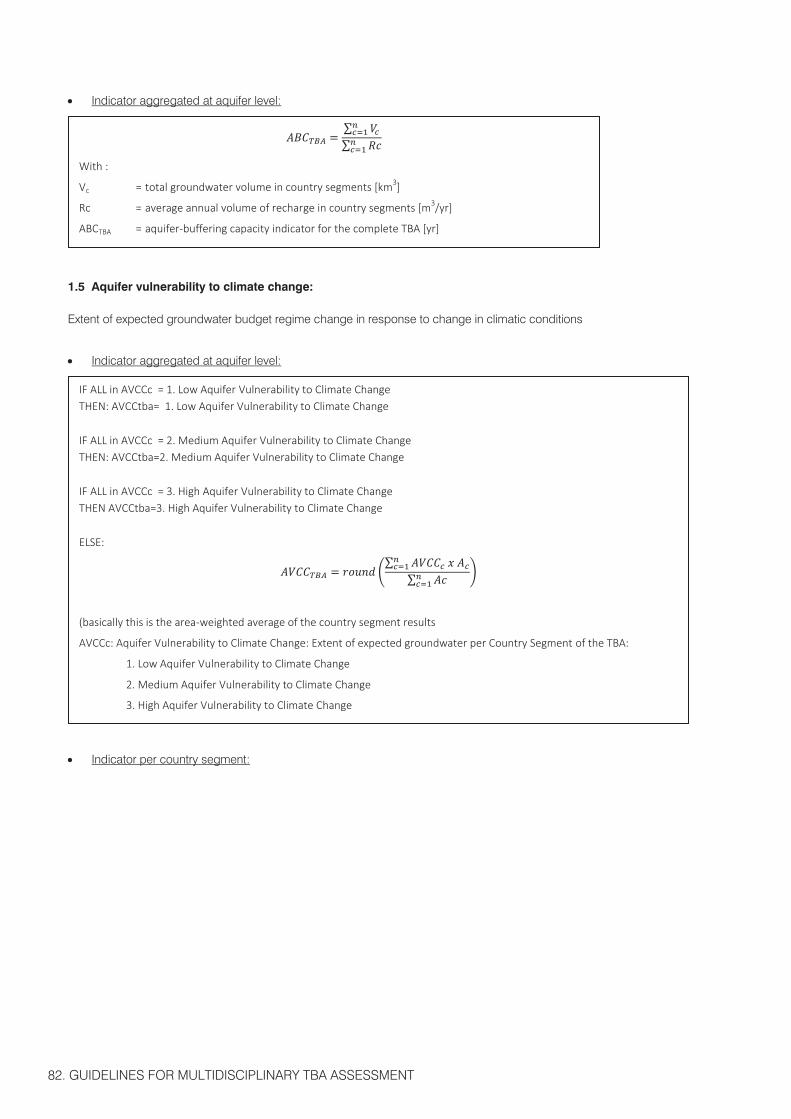
82. GUIDELINES FOR MULTIDISCIPLINARY TBA ASSESSMENT
Indicator aggregated at aquifer level:
1.5 Aquifer vulnerability to climate change:
Extent of expected groundwater budget regime change in response to change in climatic conditions
Indicator aggregated at aquifer level:
Indicator per country segment:
∑
∑
With :
Vc = total groundwater volume in country segments [km3]
Rc = average annual volume of recharge in country segments [m3/yr]
ABCTBA = aquifer-buffering capacity indicator for the complete TBA [yr]
(∑ ∑
)
IF ALL in AVCCc = 1. Low Aquifer Vulnerability to Climate Change THEN: AVCCtba= 1. Low Aquifer Vulnerability to Climate Change
IF ALL in AVCCc = 2. Medium Aquifer Vulnerability to Climate Change THEN: AVCCtba=2. Medium Aquifer Vulnerability to Climate Change
IF ALL in AVCCc = 3. High Aquifer Vulnerability to Climate Change THEN AVCCtba=3. High Aquifer Vulnerability to Climate Change
ELSE:
(basically this is the area-weighted average of the country segment results
AVCCc: Aquifer Vulnerability to Climate Change: Extent of expected groundwater per Country Segment of the TBA:
1. Low Aquifer Vulnerability to Climate Change
2. Medium Aquifer Vulnerability to Climate Change
3. High Aquifer Vulnerability to Climate Change
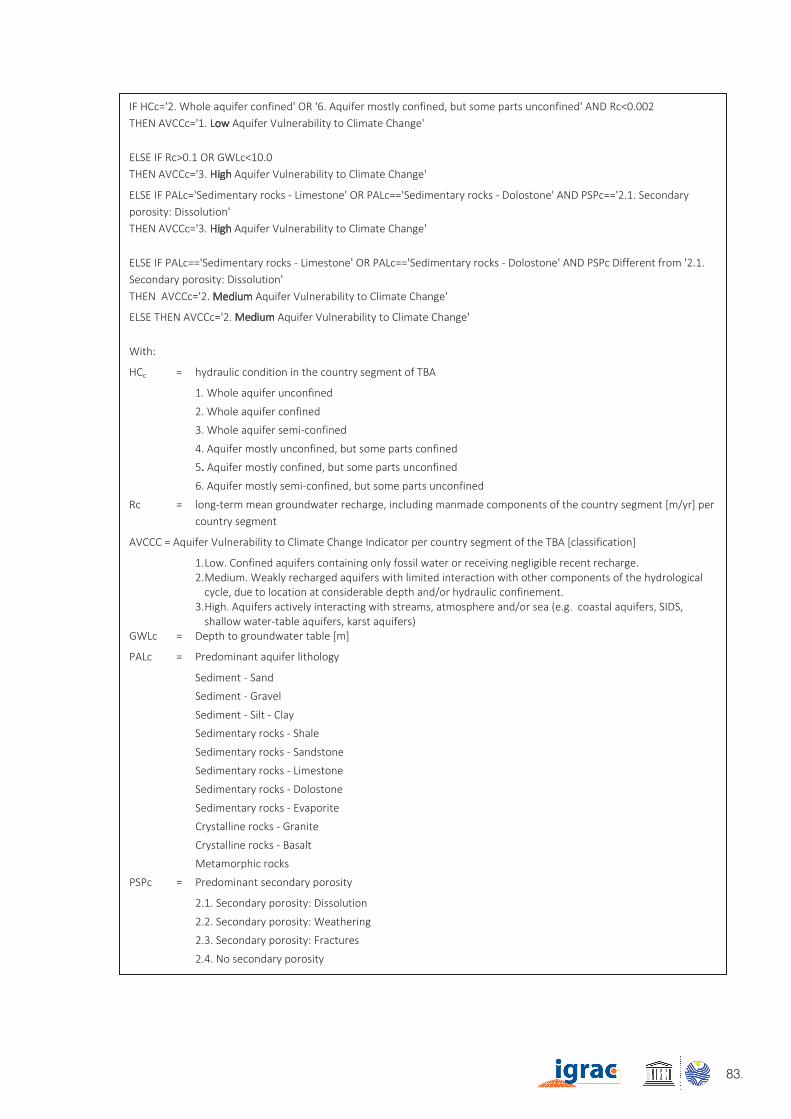
83.
Indicator aggregated at aquifer level:
1.5 Aquifer vulnerability to climate change:
Extent of expected groundwater budget regime change in response to change in climatic conditions
Indicator aggregated at aquifer level:
Indicator per country segment:
∑
∑
With :
Vc = total groundwater volume in country segments [km3]
Rc = average annual volume of recharge in country segments [m3/yr]
ABCTBA = aquifer-buffering capacity indicator for the complete TBA [yr]
(∑ ∑
)
IF ALL in AVCCc = 1. Low Aquifer Vulnerability to Climate Change THEN: AVCCtba= 1. Low Aquifer Vulnerability to Climate Change
IF ALL in AVCCc = 2. Medium Aquifer Vulnerability to Climate Change THEN: AVCCtba=2. Medium Aquifer Vulnerability to Climate Change
IF ALL in AVCCc = 3. High Aquifer Vulnerability to Climate Change THEN AVCCtba=3. High Aquifer Vulnerability to Climate Change
ELSE:
(basically this is the area-weighted average of the country segment results
AVCCc: Aquifer Vulnerability to Climate Change: Extent of expected groundwater per Country Segment of the TBA:
1. Low Aquifer Vulnerability to Climate Change
2. Medium Aquifer Vulnerability to Climate Change
3. High Aquifer Vulnerability to Climate Change
IF HCc='2. Whole aquifer confined' OR '6. Aquifer mostly confined, but some parts unconfined' AND Rc<0.002 THEN AVCCc='1. Low Aquifer Vulnerability to Climate Change'
ELSE IF Rc>0.1 OR GWLc<10.0 THEN AVCCc='3. High Aquifer Vulnerability to Climate Change'
ELSE IF PALc='Sedimentary rocks - Limestone' OR PALc=='Sedimentary rocks - Dolostone' AND PSPc=='2.1. Secondary porosity: Dissolution' THEN AVCCc='3. High Aquifer Vulnerability to Climate Change'
ELSE IF PALc=='Sedimentary rocks - Limestone' OR PALc=='Sedimentary rocks - Dolostone' AND PSPc Different from '2.1. Secondary porosity: Dissolution' THEN AVCCc='2. Medium Aquifer Vulnerability to Climate Change'
ELSE THEN AVCCc='2. Medium Aquifer Vulnerability to Climate Change'
With:
HCc = hydraulic condition in the country segment of TBA
1. Whole aquifer unconfined
2. Whole aquifer confined
3. Whole aquifer semi-confined
4. Aquifer mostly unconfined, but some parts confined
5. Aquifer mostly confined, but some parts unconfined
6. Aquifer mostly semi-confined, but some parts unconfined
Rc = long-term mean groundwater recharge, including manmade components of the country segment [m/yr] per country segment
AVCCC = Aquifer Vulnerability to Climate Change Indicator per country segment of the TBA [classification]
1. Low. Confined aquifers containing only fossil water or receiving negligible recent recharge. 2. Medium. Weakly recharged aquifers with limited interaction with other components of the hydrological
cycle, due to location at considerable depth and/or hydraulic confinement. 3. High. Aquifers actively interacting with streams, atmosphere and/or sea (e.g. coastal aquifers, SIDS,
shallow water-table aquifers, karst aquifers) GWLc = Depth to groundwater table [m]
PALc = Predominant aquifer lithology
Sediment - Sand
Sediment - Gravel
Sediment - Silt - Clay
Sedimentary rocks - Shale
Sedimentary rocks - Sandstone
Sedimentary rocks - Limestone
Sedimentary rocks - Dolostone
Sedimentary rocks - Evaporite
Crystalline rocks - Granite
Crystalline rocks - Basalt
Metamorphic rocks
PSPc = Predominant secondary porosity
2.1. Secondary porosity: Dissolution
2.2. Secondary porosity: Weathering
2.3. Secondary porosity: Fractures
2.4. No secondary porosity
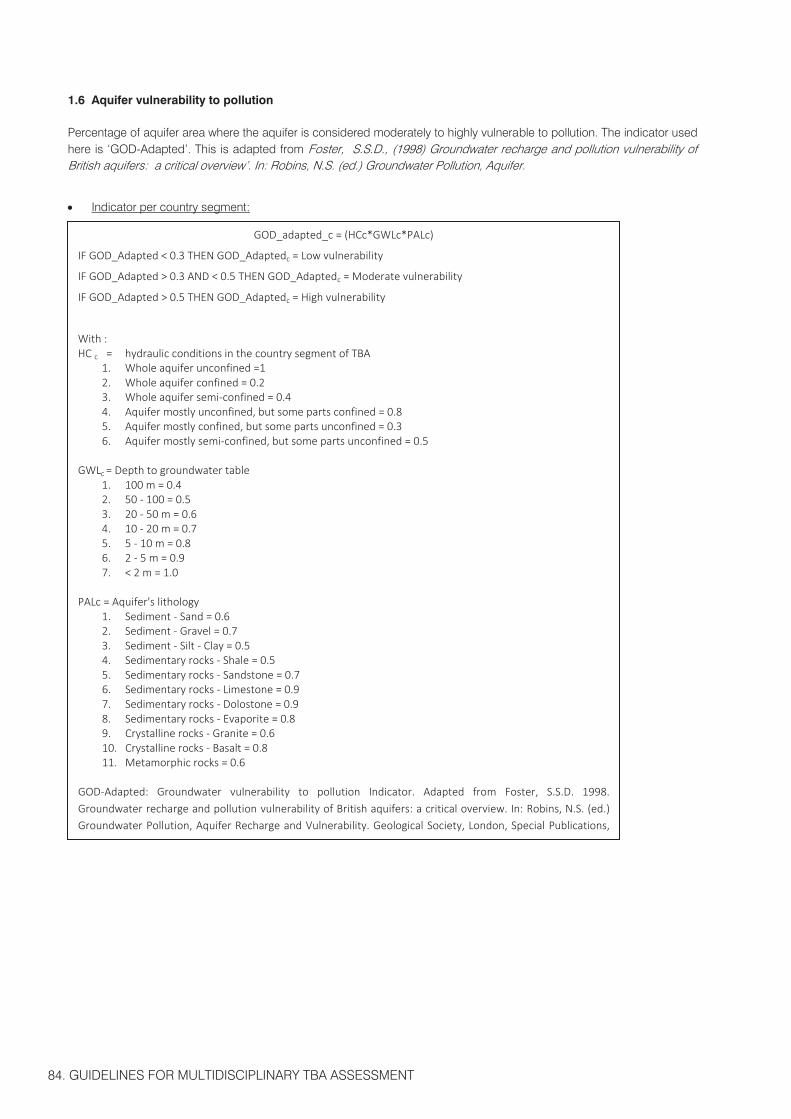
84. GUIDELINES FOR MULTIDISCIPLINARY TBA ASSESSMENT
1.6 Aquifer vulnerability to pollution
Percentage of aquifer area where the aquifer is considered moderately to highly vulnerable to pollution. The indicator used here is ‘GOD-Adapted’. This is adapted from Foster, S.S.D., (1998) Groundwater recharge and pollution vulnerability of British aquifers: a critical overview’. In: Robins, N.S. (ed.) Groundwater Pollution, Aquifer.
Indicator per country segment:
GOD_adapted_c = (HCc*GWLc*PALc)
IF GOD_Adapted < 0.3 THEN GOD_Adaptedc = Low vulnerability
IF GOD_Adapted > 0.3 AND < 0.5 THEN GOD_Adaptedc = Moderate vulnerability
IF GOD_Adapted > 0.5 THEN GOD_Adaptedc = High vulnerability
With : HC c = hydraulic conditions in the country segment of TBA
1. Whole aquifer unconfined =1 2. Whole aquifer confined = 0.2 3. Whole aquifer semi-confined = 0.4 4. Aquifer mostly unconfined, but some parts confined = 0.8 5. Aquifer mostly confined, but some parts unconfined = 0.3 6. Aquifer mostly semi-confined, but some parts unconfined = 0.5
GWLc = Depth to groundwater table
1. 100 m = 0.4 2. 50 - 100 = 0.5 3. 20 - 50 m = 0.6 4. 10 - 20 m = 0.7 5. 5 - 10 m = 0.8 6. 2 - 5 m = 0.9 7. < 2 m = 1.0
PALc = Aquifer's lithology
1. Sediment - Sand = 0.6 2. Sediment - Gravel = 0.7 3. Sediment - Silt - Clay = 0.5 4. Sedimentary rocks - Shale = 0.5 5. Sedimentary rocks - Sandstone = 0.7 6. Sedimentary rocks - Limestone = 0.9 7. Sedimentary rocks - Dolostone = 0.9 8. Sedimentary rocks - Evaporite = 0.8 9. Crystalline rocks - Granite = 0.6 10. Crystalline rocks - Basalt = 0.8 11. Metamorphic rocks = 0.6
GOD-Adapted: Groundwater vulnerability to pollution Indicator. Adapted from Foster, S.S.D. 1998. Groundwater recharge and pollution vulnerability of British aquifers: a critical overview. In: Robins, N.S. (ed.) Groundwater Pollution, Aquifer Recharge and Vulnerability. Geological Society, London, Special Publications, 130, 7-22.
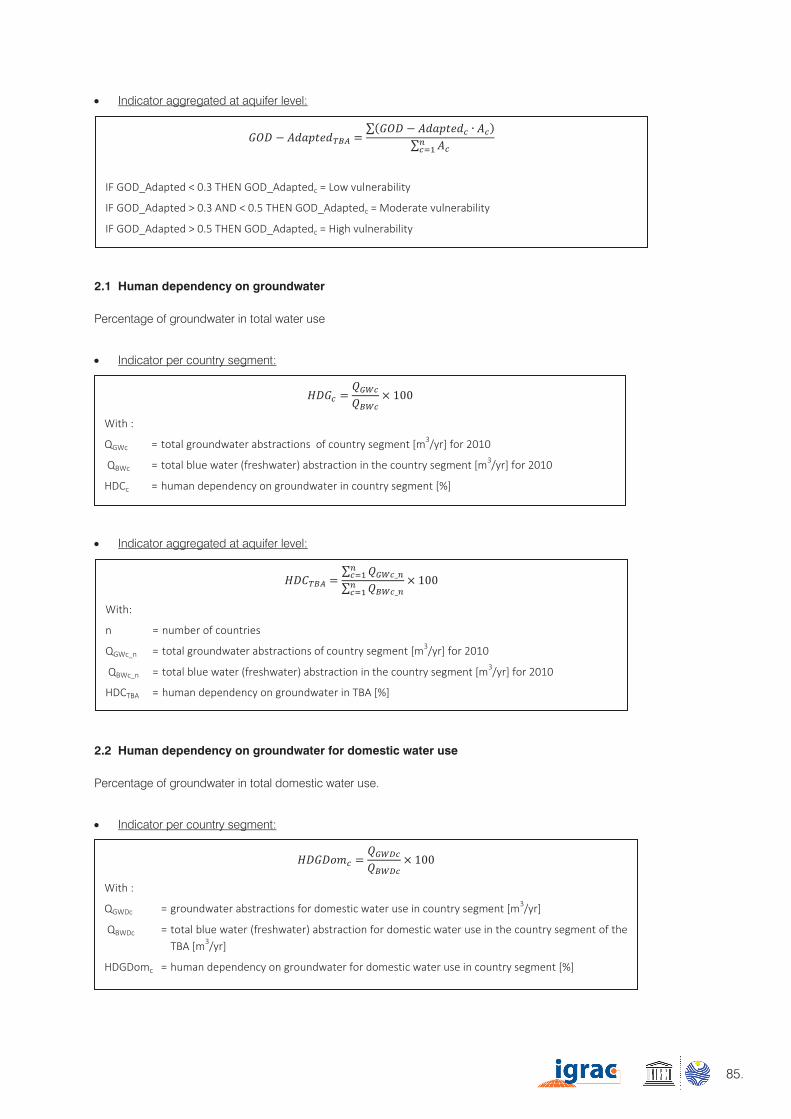
85.
1.6 Aquifer vulnerability to pollution
Percentage of aquifer area where the aquifer is considered moderately to highly vulnerable to pollution. The indicator used here is ‘GOD-Adapted’. This is adapted from Foster, S.S.D., (1998) Groundwater recharge and pollution vulnerability of British aquifers: a critical overview’. In: Robins, N.S. (ed.) Groundwater Pollution, Aquifer.
Indicator per country segment:
GOD_adapted_c = (HCc*GWLc*PALc)
IF GOD_Adapted < 0.3 THEN GOD_Adaptedc = Low vulnerability
IF GOD_Adapted > 0.3 AND < 0.5 THEN GOD_Adaptedc = Moderate vulnerability
IF GOD_Adapted > 0.5 THEN GOD_Adaptedc = High vulnerability
With : HC c = hydraulic conditions in the country segment of TBA
1. Whole aquifer unconfined =1 2. Whole aquifer confined = 0.2 3. Whole aquifer semi-confined = 0.4 4. Aquifer mostly unconfined, but some parts confined = 0.8 5. Aquifer mostly confined, but some parts unconfined = 0.3 6. Aquifer mostly semi-confined, but some parts unconfined = 0.5
GWLc = Depth to groundwater table
1. 100 m = 0.4 2. 50 - 100 = 0.5 3. 20 - 50 m = 0.6 4. 10 - 20 m = 0.7 5. 5 - 10 m = 0.8 6. 2 - 5 m = 0.9 7. < 2 m = 1.0
PALc = Aquifer's lithology
1. Sediment - Sand = 0.6 2. Sediment - Gravel = 0.7 3. Sediment - Silt - Clay = 0.5 4. Sedimentary rocks - Shale = 0.5 5. Sedimentary rocks - Sandstone = 0.7 6. Sedimentary rocks - Limestone = 0.9 7. Sedimentary rocks - Dolostone = 0.9 8. Sedimentary rocks - Evaporite = 0.8 9. Crystalline rocks - Granite = 0.6 10. Crystalline rocks - Basalt = 0.8 11. Metamorphic rocks = 0.6
GOD-Adapted: Groundwater vulnerability to pollution Indicator. Adapted from Foster, S.S.D. 1998. Groundwater recharge and pollution vulnerability of British aquifers: a critical overview. In: Robins, N.S. (ed.) Groundwater Pollution, Aquifer Recharge and Vulnerability. Geological Society, London, Special Publications, 130, 7-22.
Indicator aggregated at aquifer level:
2.1 Human dependency on groundwater
Percentage of groundwater in total water use
Indicator per country segment:
Indicator aggregated at aquifer level:
2.2 Human dependency on groundwater for domestic water use
Percentage of groundwater in total domestic water use.
Indicator per country segment:
∑( )
∑
IF GOD_Adapted < 0.3 THEN GOD_Adaptedc = Low vulnerability
IF GOD_Adapted > 0.3 AND < 0.5 THEN GOD_Adaptedc = Moderate vulnerability
IF GOD_Adapted > 0.5 THEN GOD_Adaptedc = High vulnerability
With :
QGWc = total groundwater abstractions of country segment [m3/yr] for 2010
QBWc = total blue water (freshwater) abstraction in the country segment [m3/yr] for 2010
HDCc = human dependency on groundwater in country segment [%]
∑
∑
With:
n = number of countries
QGWc_n = total groundwater abstractions of country segment [m3/yr] for 2010
QBWc_n = total blue water (freshwater) abstraction in the country segment [m3/yr] for 2010
HDCTBA = human dependency on groundwater in TBA [%]
With :
QGWDc = groundwater abstractions for domestic water use in country segment [m3/yr]
QBWDc = total blue water (freshwater) abstraction for domestic water use in the country segment of the TBA [m3/yr]
HDGDomc = human dependency on groundwater for domestic water use in country segment [%]
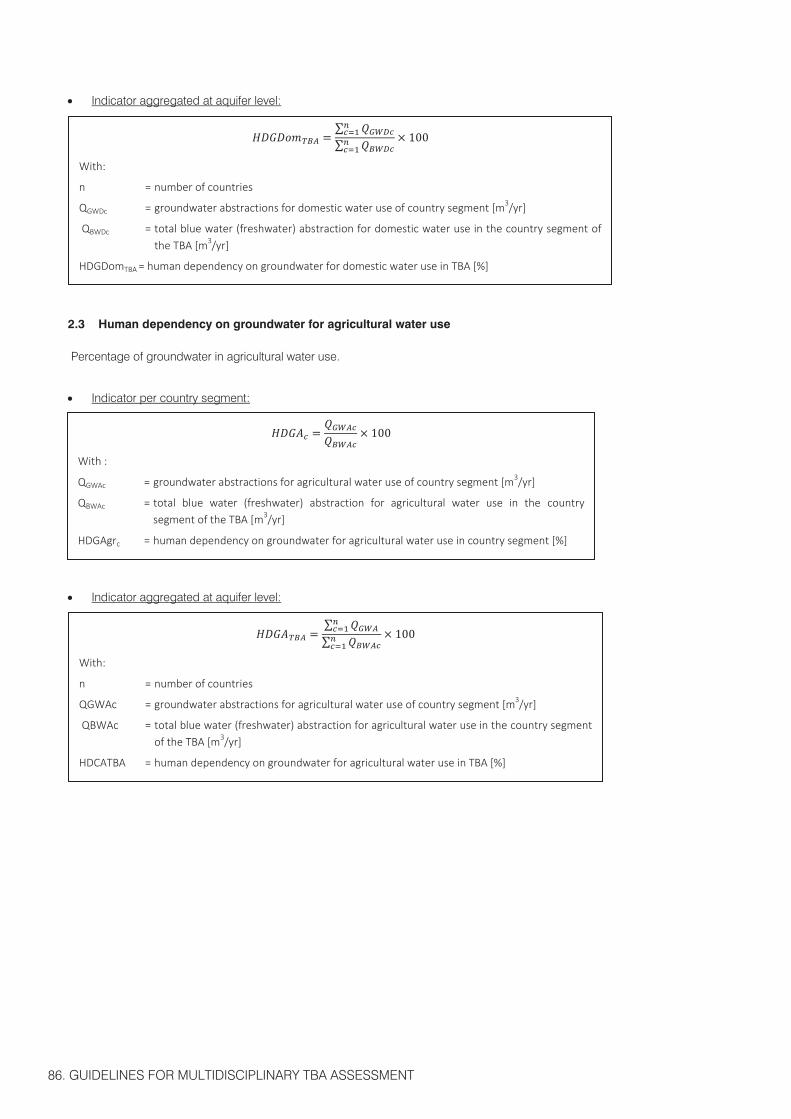
86. GUIDELINES FOR MULTIDISCIPLINARY TBA ASSESSMENT
Indicator aggregated at aquifer level:
2.3 Human dependency on groundwater for agricultural water use
Percentage of groundwater in agricultural water use.
Indicator per country segment:
Indicator aggregated at aquifer level:
∑
∑
With:
n = number of countries
QGWDc = groundwater abstractions for domestic water use of country segment [m3/yr]
QBWDc = total blue water (freshwater) abstraction for domestic water use in the country segment of the TBA [m3/yr]
HDGDomTBA = human dependency on groundwater for domestic water use in TBA [%]
With :
QGWAc = groundwater abstractions for agricultural water use of country segment [m3/yr]
QBWAc = total blue water (freshwater) abstraction for agricultural water use in the country segment of the TBA [m3/yr]
HDGAgrc = human dependency on groundwater for agricultural water use in country segment [%]
∑
∑
With:
n = number of countries
QGWAc = groundwater abstractions for agricultural water use of country segment [m3/yr]
QBWAc = total blue water (freshwater) abstraction for agricultural water use in the country segment of the TBA [m3/yr]
HDCATBA = human dependency on groundwater for agricultural water use in TBA [%]

87.
Indicator aggregated at aquifer level:
2.3 Human dependency on groundwater for agricultural water use
Percentage of groundwater in agricultural water use.
Indicator per country segment:
Indicator aggregated at aquifer level:
∑
∑
With:
n = number of countries
QGWDc = groundwater abstractions for domestic water use of country segment [m3/yr]
QBWDc = total blue water (freshwater) abstraction for domestic water use in the country segment of the TBA [m3/yr]
HDGDomTBA = human dependency on groundwater for domestic water use in TBA [%]
With :
QGWAc = groundwater abstractions for agricultural water use of country segment [m3/yr]
QBWAc = total blue water (freshwater) abstraction for agricultural water use in the country segment of the TBA [m3/yr]
HDGAgrc = human dependency on groundwater for agricultural water use in country segment [%]
∑
∑
With:
n = number of countries
QGWAc = groundwater abstractions for agricultural water use of country segment [m3/yr]
QBWAc = total blue water (freshwater) abstraction for agricultural water use in the country segment of the TBA [m3/yr]
HDCATBA = human dependency on groundwater for agricultural water use in TBA [%]
2.4 Human dependency on groundwater for industrial water use
Percentage of groundwater in industrial water use.
Indicator per country segment:
Indicator aggregated at aquifer level:
2.5 Ecosystem dependency on groundwater
Indicator per country segment:
Indicator aggregated at aquifer level:
With :
QGWIc = groundwater abstractions for industrial water use of country segment [m3/yr]
QBWIc = total blue water (freshwater) abstraction for industrial water use in the country segment of the TBA [m3/yr]
HDCDc = human dependency on groundwater for industrial water use in country segment [%]
∑
∑
With:
n = number of countries
QGWIc = groundwater abstractions for industrial water use of country segment [m3/yr]
QBWIc = total blue water (freshwater) abstraction for industrial water use in the country segment of the TBA [m3/yr]
HDGITBA = human dependency on groundwater for industrial water use in TBA [%]
EDGc = percentage of country segment with groundwater-dependent ecosystems.
If groundwater-dependent ecosystems have not been mapped: report percentage of aquifer area where depth to groundwater table is less than 5 m below soil surface.
EDGC = ecosystem-dependency on groundwater Indicator per country segment [%]
∑ ( ) ∑
With:
N = number of countries
Ac = surface are of the country segment [km2]
EDGc = percentage of the country segment with groundwater-dependent ecosystems or if these data are not available: area with a phreatic water level shallower than 5m below surface [%]
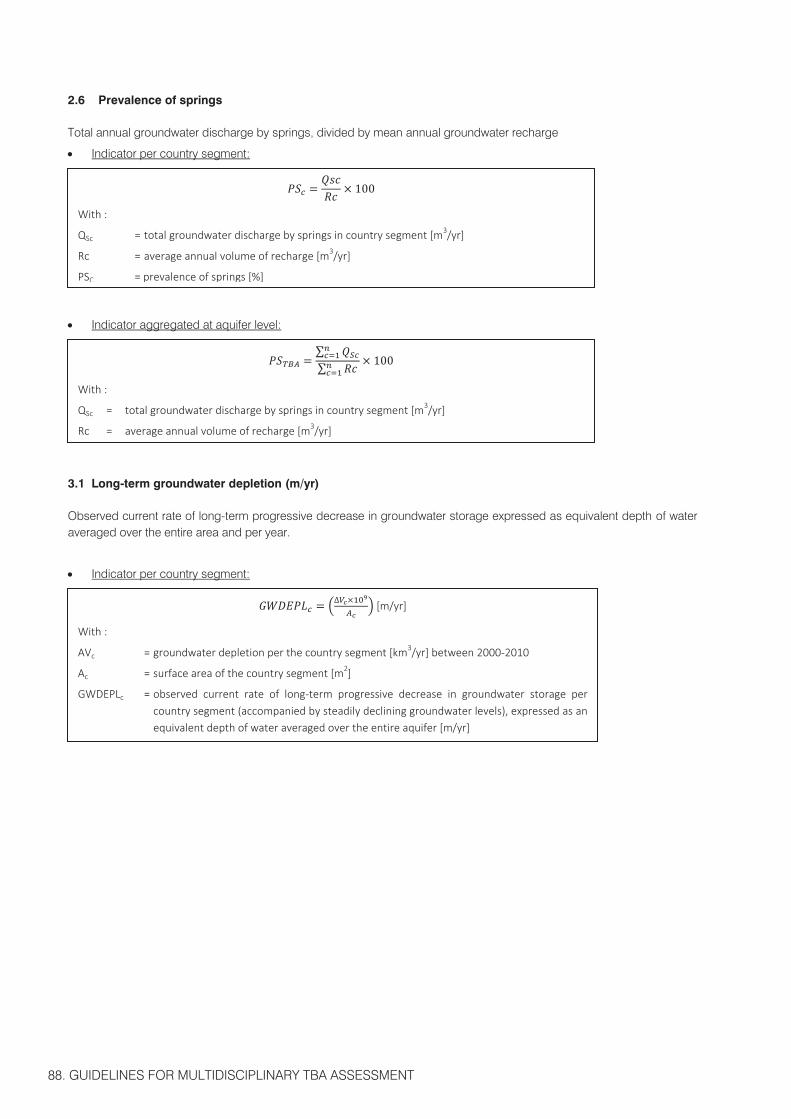
88. GUIDELINES FOR MULTIDISCIPLINARY TBA ASSESSMENT
2.6 Prevalence of springs
Total annual groundwater discharge by springs, divided by mean annual groundwater recharge
Indicator per country segment:
Indicator aggregated at aquifer level:
3.1 Long-term groundwater depletion (m/yr)
Observed current rate of long-term progressive decrease in groundwater storage expressed as equivalent depth of water averaged over the entire area and per year.
Indicator per country segment:
With :
QSc = total groundwater discharge by springs in country segment [m3/yr]
Rc = average annual volume of recharge [m3/yr]
PSC = prevalence of springs [%]
∑ ∑
With :
QSc = total groundwater discharge by springs in country segment [m3/yr]
Rc = average annual volume of recharge [m3/yr]
(
) [m/yr]
With :
AVc = groundwater depletion per the country segment [km3/yr] between 2000-2010
Ac = surface area of the country segment [m2]
GWDEPLc = observed current rate of long-term progressive decrease in groundwater storage per country segment (accompanied by steadily declining groundwater levels), expressed as an equivalent depth of water averaged over the entire aquifer [m/yr]
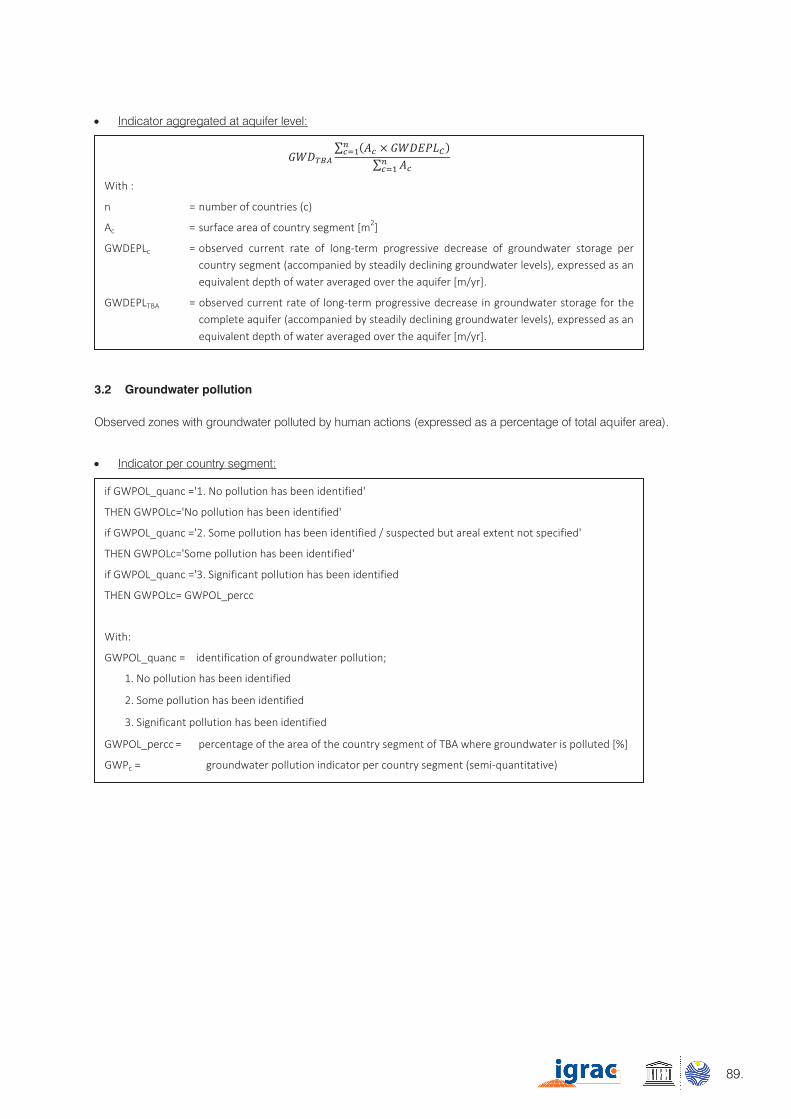
89.
2.6 Prevalence of springs
Total annual groundwater discharge by springs, divided by mean annual groundwater recharge
Indicator per country segment:
Indicator aggregated at aquifer level:
3.1 Long-term groundwater depletion (m/yr)
Observed current rate of long-term progressive decrease in groundwater storage expressed as equivalent depth of water averaged over the entire area and per year.
Indicator per country segment:
With :
QSc = total groundwater discharge by springs in country segment [m3/yr]
Rc = average annual volume of recharge [m3/yr]
PSC = prevalence of springs [%]
∑ ∑
With :
QSc = total groundwater discharge by springs in country segment [m3/yr]
Rc = average annual volume of recharge [m3/yr]
(
) [m/yr]
With :
AVc = groundwater depletion per the country segment [km3/yr] between 2000-2010
Ac = surface area of the country segment [m2]
GWDEPLc = observed current rate of long-term progressive decrease in groundwater storage per country segment (accompanied by steadily declining groundwater levels), expressed as an equivalent depth of water averaged over the entire aquifer [m/yr]
Indicator aggregated at aquifer level:
3.2 Groundwater pollution
Observed zones with groundwater polluted by human actions (expressed as a percentage of total aquifer area).
Indicator per country segment:
∑ ( )
∑
With :
n = number of countries (c)
Ac = surface area of country segment [m2]
GWDEPLc = observed current rate of long-term progressive decrease of groundwater storage per country segment (accompanied by steadily declining groundwater levels), expressed as an equivalent depth of water averaged over the aquifer [m/yr].
GWDEPLTBA = observed current rate of long-term progressive decrease in groundwater storage for the complete aquifer (accompanied by steadily declining groundwater levels), expressed as an equivalent depth of water averaged over the aquifer [m/yr].
if GWPOL_quanc ='1. No pollution has been identified'
THEN GWPOLc='No pollution has been identified'
if GWPOL_quanc ='2. Some pollution has been identified / suspected but areal extent not specified'
THEN GWPOLc='Some pollution has been identified'
if GWPOL_quanc ='3. Significant pollution has been identified
THEN GWPOLc= GWPOL_percc
With:
GWPOL_quanc = identification of groundwater pollution;
1. No pollution has been identified
2. Some pollution has been identified
3. Significant pollution has been identified
GWPOL_percc = percentage of the area of the country segment of TBA where groundwater is polluted [%]
GWPc = groundwater pollution indicator per country segment (semi-quantitative)
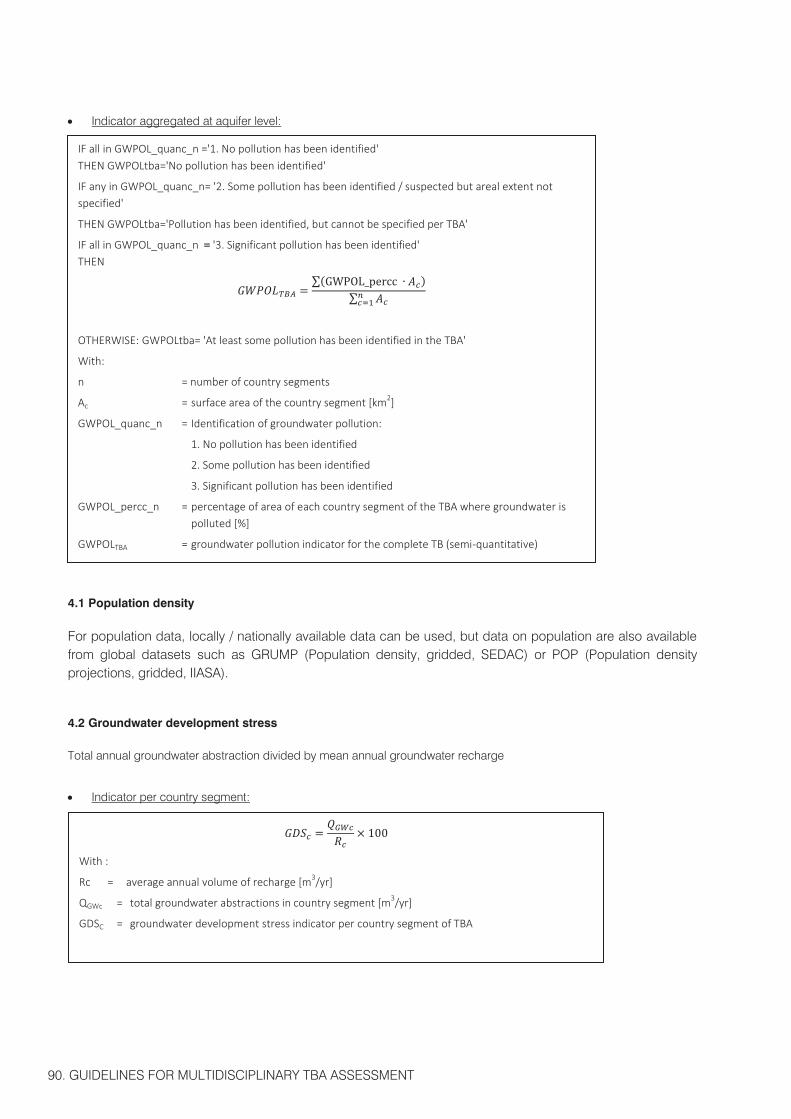
90. GUIDELINES FOR MULTIDISCIPLINARY TBA ASSESSMENT
Indicator aggregated at aquifer level:
4.1 Population density
For population data, locally / nationally available data can be used, but data on population are also available from global datasets such as GRUMP (Population density, gridded, SEDAC) or POP (Population density projections, gridded, IIASA).
4.2 Groundwater development stress
Total annual groundwater abstraction divided by mean annual groundwater recharge
Indicator per country segment:
∑( )
∑
IF all in GWPOL_quanc_n ='1. No pollution has been identified' THEN GWPOLtba='No pollution has been identified'
IF any in GWPOL_quanc_n= '2. Some pollution has been identified / suspected but areal extent not specified'
THEN GWPOLtba='Pollution has been identified, but cannot be specified per TBA'
IF all in GWPOL_quanc_n = '3. Significant pollution has been identified' THEN
OTHERWISE: GWPOLtba= 'At least some pollution has been identified in the TBA'
With:
n = number of country segments
Ac = surface area of the country segment [km2]
GWPOL_quanc_n = Identification of groundwater pollution:
1. No pollution has been identified
2. Some pollution has been identified
3. Significant pollution has been identified
GWPOL_percc_n = percentage of area of each country segment of the TBA where groundwater is polluted [%]
GWPOLTBA = groundwater pollution indicator for the complete TB (semi-quantitative)
With :
Rc = average annual volume of recharge [m3/yr]
QGWc = total groundwater abstractions in country segment [m3/yr]
GDSC = groundwater development stress indicator per country segment of TBA
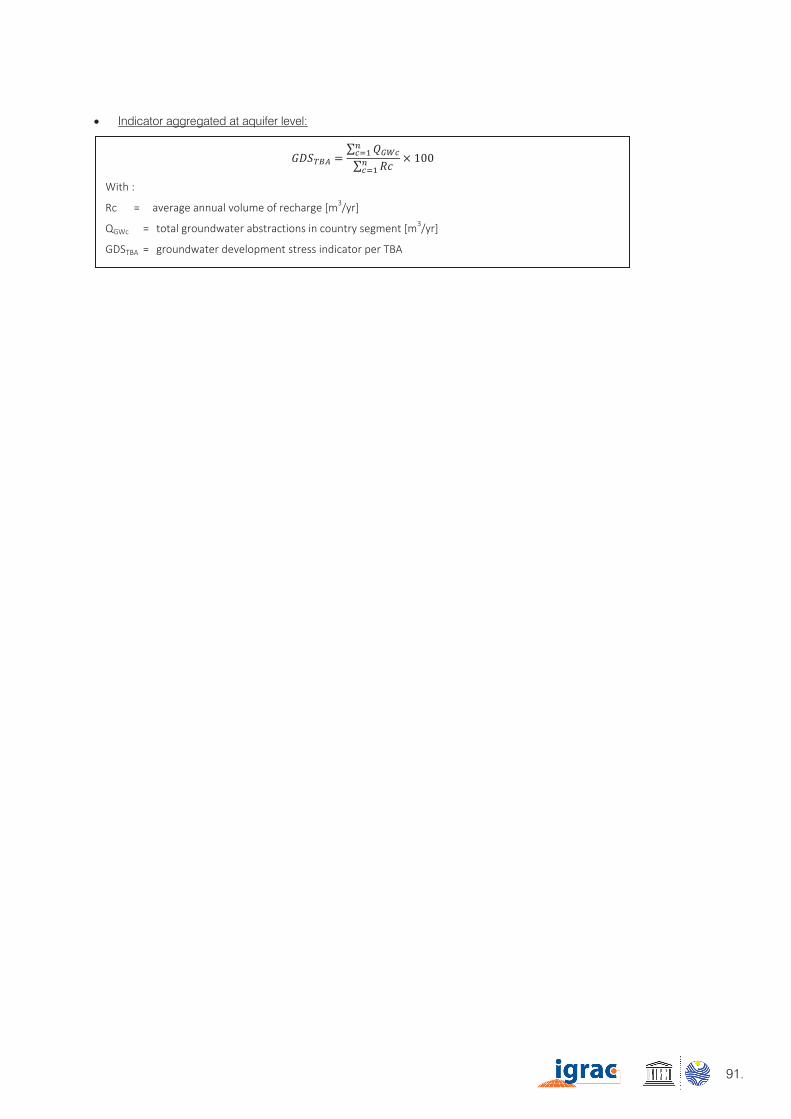
91.
Indicator aggregated at aquifer level:
4.1 Population density
For population data, locally / nationally available data can be used, but data on population are also available from global datasets such as GRUMP (Population density, gridded, SEDAC) or POP (Population density projections, gridded, IIASA).
4.2 Groundwater development stress
Total annual groundwater abstraction divided by mean annual groundwater recharge
Indicator per country segment:
∑( )
∑
IF all in GWPOL_quanc_n ='1. No pollution has been identified' THEN GWPOLtba='No pollution has been identified'
IF any in GWPOL_quanc_n= '2. Some pollution has been identified / suspected but areal extent not specified'
THEN GWPOLtba='Pollution has been identified, but cannot be specified per TBA'
IF all in GWPOL_quanc_n = '3. Significant pollution has been identified' THEN
OTHERWISE: GWPOLtba= 'At least some pollution has been identified in the TBA'
With:
n = number of country segments
Ac = surface area of the country segment [km2]
GWPOL_quanc_n = Identification of groundwater pollution:
1. No pollution has been identified
2. Some pollution has been identified
3. Significant pollution has been identified
GWPOL_percc_n = percentage of area of each country segment of the TBA where groundwater is polluted [%]
GWPOLTBA = groundwater pollution indicator for the complete TB (semi-quantitative)
With :
Rc = average annual volume of recharge [m3/yr]
QGWc = total groundwater abstractions in country segment [m3/yr]
GDSC = groundwater development stress indicator per country segment of TBA
Indicator aggregated at aquifer level:
∑ ∑
With :
Rc = average annual volume of recharge [m3/yr]
QGWc = total groundwater abstractions in country segment [m3/yr]
GDSTBA = groundwater development stress indicator per TBA
IGRACWestvest 72611AX Delft The Netherlands
T:+31 15 215 2325E: [email protected]: www.un-igrac.org
International Hydrological Programme
United NationsEducational, Scientific and
Cultural Organization
IGRAC is the UNESCO Global Groundwater Centre, it also works under the auspices of WMO, it is a corporate IAH partner and it is financially supported by the Government of the Netherlands.
The International Hydrological Programme (IHP) is the only intergovernmental programme of the UN system devoted to water research, water resources management, and education and capacity building.
GUIDELINES FOR MULTIDISCIPLINARY ASSESSMENT OF TRANSBOUNDARY AQUIFERDRAFT VERSION SEPTEMBER 2015
Transboundary aquifer or transboundary aquifer system means respective-ly, an aquifer or aquifer system, part of which are situated in different States. The international aspect of a transboundary aquifer makes its management more complex than in a case of an aquifer located within the State borders. An informed and sustainable management of commonly shared aquifer asks for adequate knowledge of its characteristics, present state and trends. In order to acquire this knowledge, regular monitoring and assessment of the transboundary aquifer need to be performed. This document describes a methodology for multidisciplinary assessment of transboundary aquifers and gives the guidelines for its implementation.