Guidelines for Implementing the ISO 19100 Geographic … · 2017-10-17 · the ISO 19100 standards...
69
Guidelines for Implementing the ISO 19100 Geographic Information Quality Standards in National Mapping and Cadastral Agencies edited by Antti Jakobsson, Jørgen Giversen www.eurogeographics.org
Transcript of Guidelines for Implementing the ISO 19100 Geographic … · 2017-10-17 · the ISO 19100 standards...

Guidelines for Implementing the ISO 19100Geographic Information Quality Standards in National Mapping and Cadastral Agencies
edited byAntti Jakobsson, Jørgen Giversen
www.eurogeographics.org

1
INTRODUCTION 3 Background 5 Scope 5 Reasons to Implement Quality Standards 5 Reading Guide 10
INTERPRETATION OF THE QUALITY CONCEPT IN REFERENCE DATA SETS 11 1.1 Introduction 11 1.2 Cadastral Issues 13 1.3 Topographic issues 15
THE ISO 19100 QUALITY STANDARDS 17 2.1 Brief Introduction to the Quality Related Standards 17 2.2 EN ISO 19113 Geographic Information – Quality principles 18 2.2.1 Current status of the standard 18 2.2.2 Description of content 18 2.2.3 Usage 20 2.3 EN ISO 19114 Geographic Information – Quality evaluation procedures 20 2.3.1 Current status of the standard 20 2.3.2 Description of content 20 2.3.3 Usage 22 2.4 TS ISO 19138 Geographic information – Data quality measure 23 2.4.1 Current status of the technical specification 23 2.4.2 Description of content 23 2.5 EN ISO 19115 Geographic Information – Metadata 28 2.5.1 Current status of the standard 28 2.5.2 Description of content 29 2.5.3 Scope 31 2.5.4 Data quality overview elements 33 2.5.5 Data quality elements and data quality sub-elements 33 2.5.6 Usage 33 2.6 ISO 19131 Geographic information – Data product specifications 33 2.6.1 Current status 33 2.6.2 Description of content 33 2.6.3 Usage 34 2.7 ISO/TS 19139 Geographic Information – Metadata – XML schema Implementation Specification 34 2.7.1 Current status of the technical specification (TS) 34 2.7.2 Description of content 34 2.7.3 Usage 34
IMPLEMENTING THE QUALITY STANDARDS AT THE NMCAS 35 3.1 Identifying Your Needs 35 3.2 Understanding How to Address the Standards 36 3.3 Guidance on where to start the implementation 37 3.4 Implementing common quality phenomenon at the NMCAs 37 3.4.1 Where to find certain quality phenomenon in the standards 37
STRATEGIES FOR IMPLEMENTING STANDARDS 39 4.1 Common profile versus dataset profile 39 4.2 Quality models for datasets 41 4.3 Communication and Training (internal/external) 42 4.4 Need for Common EuroGeographics Profiles/Models or European profile 42
TABL
E OF C
ON
TEN
T
2
EXPERIENCES AT THE NMCAS 43 5.1 Summary of the current experiences 43 5.1.1 Approaches that NMCAs have adopted 43 5.2 NLS Finland 44 5.2.1 Background 44 5.2.2 Objectives 44 5.2.3 Methods for implementing 44 5.2.4 Related work 44 5.2.5 Future plans 46 5.2.4 Experience so far 46 5.3 IGN France 46 5.3.1 Background 46 5.3.2 Objectives 47 5.3.3 Experiences so far 48 5.4 KMS Denmark 49 5.4.1 Background 49 5.4.2 Objectives 49 5.4.3 Experiences from the Cadastre 49 5.4.4 Future plans 50 5.5 TD Netherlands 50 5.6 NLS Sweden 51 5.6.1 Background 51 5.6.2 Objectives 52 5.6.3 Methods for implementing 52 5.6.4 Future plans 53 5.6.5 Experience so far 54 5.7 AdV Germany 55 5.7.1 Background 55 5.7.2 Objectives 55 5.7.3 Future quality assurance 56 5.7.4 Experience so far 58
APPENDICES 62 Some example documents that are available: 62 Extract from IGN-F’s ISO 19131 profile (2004) 64 Extract from IGN-F’s ISO 19115 profile (2005) 65

3
In the 19100 Geographic Information standard series developed by the International Organization for Standardization (ISO), several standards are specifically dedicated to the quality of geographic Information:
ISO 19113 on the specific concepts, ISO 19114 on the principles for quality evaluation and, together with ISO 19138, on the description of quality assessment methodologies, ISO 19131 on specifications, ISO 19115 on the reporting of quality assessment results as metadata, and ISO 19139 on the implementation of metadata communication.
These indeed are domain-oriented standards, specific to Geographic Information, i.e. related to the following issue: in what measure is the geographic world well represented by the data?
Organisational or managerial quality, at a more general level, is the object of the ISO 9000 family on Quality Management Systems, which is not addressed per se in this document. However we discuss and mention some of the new quality related concepts that might be useful in the implementation process that are not currently covered by the ISO 19100 standards (e.g. quality auditing, accreditation, certification).
Several member organizations of the EuroGeographics Expert Group on Quality have both expertise in the content of the ISO 19100 standards, and experience regarding their implementation. The present guidelines give information for implementing the ISO 19100 data quality standards for National Mapping and Cadastral Agencies (NMCAs).
The guidelines give information for implementing the ISO 19100 data quality standards for National Mapping and Cadastral Agensies (NMCAs). However, it might also be useful for other organizations that produce geographic information, or for users who want to better understand the approaches taken by producers of geographic information, or who are invited to design specifications in collaboration with producers.
These guidelines are written by a group of experts from Finland, Sweden, the Netherlands, France, and Denmark. In addition, experts from Estonia and Germany have contributed to the work.
INTR
OD
UC
TIO
N

4
Authors of these guidelines are:
Mr. Heinz Bennat is head of the production unit for the Digital Landscape Models (DLM) at scales 1 : 250,000 (DLM250) and 1 : 1,000,000 (DLM1000) at the Federal Agency for Cartography and Geodesy, Germany. He was the Project Manager for the EuroGeographics project SABE (Seamless Administrative Boundaries of Europe, now named Euro Bounday Map, EBM). He has contributed to the German examples.
Dr. Manfred Endrullis is head of the Geodata Centre at the Federal Agency for Cartography and Geodesy of Germany. He has built up this Geodata Centre, which collects, checks, harmonizes and distributes all topographic basic geodata of Germany, since the beginning in 1996. He is member of several national working groups and has been the chair of some of them. He has contributed to the German examples.
Mr. Jørgen Giversen is Senior Advisor in the National Survey and Cadastre, Denmark. He is currently Project Manager for the Danish MGCP Quality Assurance project for the Nordic HRVD MGCP Project. He has been member of the Expert Group on Quality (ExGQ) in EuroGeographics since 1998 and has been a member of the Coordinating Committee since 2000. He has been head of the Cadastral System Section in the period 1998 to 2006 where one of his responsibilities was Quality Assurance of the Danish Cadastre. He has been the main author of Chapters 1.2, 3.1 and the Danish experiences. He has also acted as co-editor of these guidelines.
Mr. Wim Groenendaal is a member of the Expert Group on Quality and chairman of the ExGQ workgroup Quality Assurance. He is manager of the unit GEO Product- and Process Management at the Dutch Kadaster. The main goals of his unit are having control of product specifications and product quality; process efficiency; quality and risk management; knowledge banks. He has been the main author of Chapter 1.3 and the experiences from the Netherlands.
Dr. Jean-François Hangouët, currently positioned at the Quality Management Unit of IGN France, where he works on process engineering and data quality amelioration. He also teaches Geodata Quality, Map Design, and Cartographic generalization at IGN’s school (ENSG). He has been the main author of Chapter 2.6 and, 4.1 and con-tributed to many other Chapters and the French examples.
Dr. Antti Jakobsson is the chairman of the Expert Group on Quality in EuroGeographics. He works in the Development Centre of the National Land Survey of Finland (NLS). His doctoral thesis is related to quality and he has participated in the development of ISO 19113, ISO 19114 and ISO 19138. In NLS he has been developing the quality model of the Topographic Database and the quality management system for the NLS. He has given lectures on data quality in the Technical University of Helsinki. He is the main editor of these guidelines and the main author of the Introduction, Chapters 1.1, 2.2, 2.3, 2.4, 3.3, 3.4, 4.2, 4.3, 4.4 and the Finnish examples.
Ms. Gunhild Lönnberg is a senior adviser in standardisation at Lantmäteriet, the National Land Survey of Sweden. Her main business is system modelling and has expertise in standardisation processes, quality and metadata. She has been the main author of Chapters 2.5 and 2.7.
Dr. Erhard Pross works in the Leipzig branch office of the Federal Agency for Cartography and Geodesy (BKG) on the standardization field and he has participated in the development of ISO 19111, and ISO 19135. He has given lectures on geomatics at the University of Technology Dresden. He has contributed to the German examples.
Ms. Christina Wasström is a quality manager at Lantmäteriet, the National Land Survey of Sweden. Her main business is to develop and coordinate the quality activities regarding topographic data. She is a member in EuroGeographics expert group of quality. She has contributed to the Swedish examples.
In addition to the authors Jonathan Holmes (Ordnance Survey of Great Britain) and Dave Lovell (EuroGeographics) have improved the English text and given valuable comments.

5
Background EuroGeographics vision is to achieve interoperability of European mapping and other GI data. To achieve interoper-ability of geographic information the use of standards is an important tool.
To investigate, if member countries were using the ISO standards, the Expert Group on Quality made a survey, during 2004, about how the following standards were used:
ISO 19113 Quality principles ISO 19114 Quality evaluation procedures ISO 19115 Metadata
The purpose of the questionnaire was to get a quick overview of the situation. Therefore the questionnaire was sent only to the members of the Expert Group on Quality. The results revealed that just a few countries had implemented the ISO 19100 standards but several countries were planning on implementing them or trying to use part of the standards1.
In trying to find out how to help members to start using the standards, a workshop was held in October the same year. At the workshop it was suggested that the Expert Group on Quality should produce guidelines for using the ISO 19100.
In 2005 the expert group co-operated with EuroSDR and investigated the status of quality specifications, methods and software used in quality assurance. This work was chaired by Professor Anders Östman. All NMCAs had specified quality for positional accuracy; many had specifications for thematic accuracy and completeness and only a few for timeliness and logical consistency. In general quality management was considered mainly as a cost, not a driving force for change. It is considered as important but its strategic potential is less often discussed. Based on this investigation, there is a clear need for procedural development in quality assurance.
Scope The scope of these guidelines are the implementation of the ISO 19100 data quality standards for geographic information datasets in the National Mapping and Cadastral Agencies (NMCAs). The ISO 19100 standards that are discussed from the quality aspect in these guidelines are EN ISO 19113, EN ISO 19114, TS ISO 19138, EN ISO 19115, CD ISO 19115 Part 2, TS ISO 19139 and ISO 19131. Some of the standards are in draft form at the moment and it should be noted that these guidelines are intended to be used with the standard text. These guidelines will not discuss policy issues related to implementation of the standards. These guidelines describe why it is important to implement the standards and gives practical suggestions on how to read and understand the standards and how to carry out the actual implementation process. We also discuss some of the new quality concepts that are not cur-rently covered in the ISO 19100 standard series but might be useful in the implementation process. The guidelines are based on the experiences among NMCAs.
Reasons to Implement Quality Standards National Mapping and Cadastral Agencies (NMCAs) are important players in the development of National Spatial Data Infrastructures (NSDIs). The term Spatial Data Infrastructure has been described in the SDI cookbook2 as “the relevant base collection of technologies, policies and institutional arrangements that facilitate the availability of and access to spatial data.” Datasets collected by the NMCAs provide a reference framework for other spatial datasets. It is vital that these data sets have a known quality. The European Commission has initiated the development of a European Spatial Data Infrastructure by publishing a directive named INSPIRE. The Directive creates a legal frame-work for the establishment and operation of an SDI in Europe. INSPIRE focuses on environmental policy, but there is an intention to extend it to other sectors such as agriculture, transport and energy. It is also intended that the monitoring and improvement of the state of the environment should be implemented. The directive sets require-ments for metadata (Article 18) and recognizes spatial data quality as one of the key search criteria. Therefore NMCAs should have quality information reported in metadata. It is important that the quality information reported is reliable and a method for how this information is gathered is known. By using quality standards NMCAs can ensure this. 1 www.eurogeographics.org/eng/documents/Report_ISO_final.doc2 http://www.gsdi.org/docs2004/Cookbook/cookbookV2.0.pdf
6
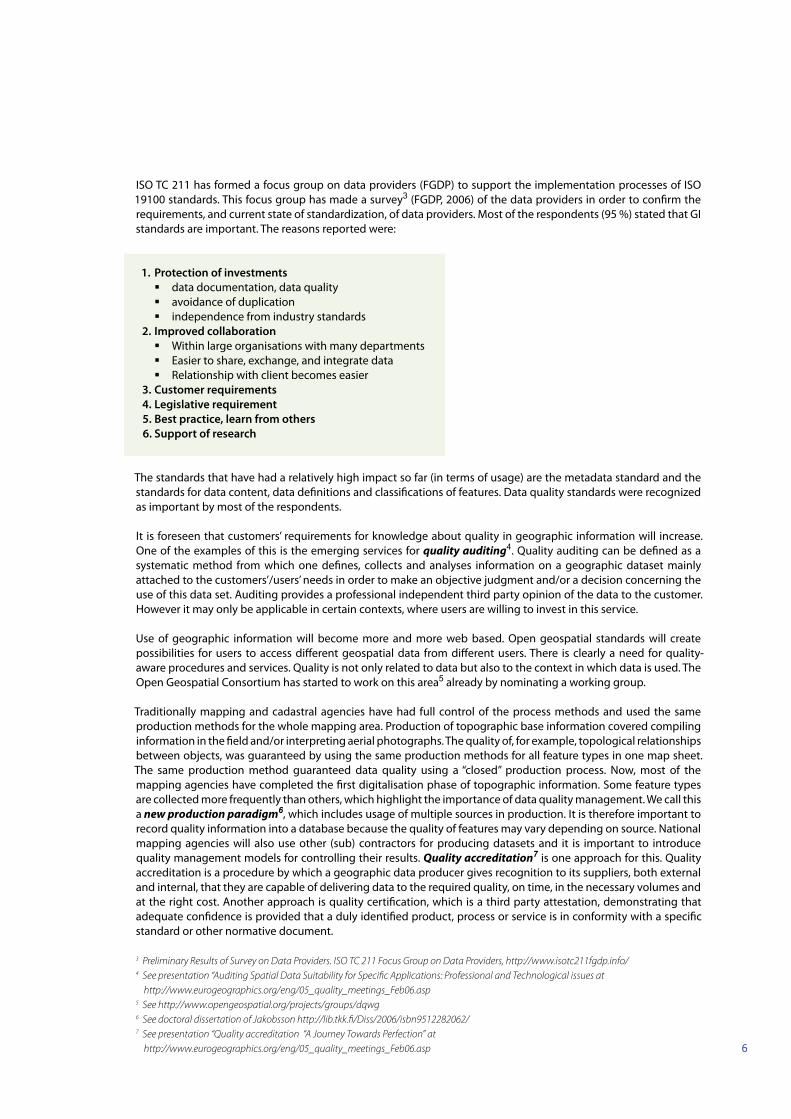
ISO TC 211 has formed a focus group on data providers (FGDP) to support the implementation processes of ISO 19100 standards. This focus group has made a survey3 (FGDP, 2006) of the data providers in order to confirm the requirements, and current state of standardization, of data providers. Most of the respondents (95 %) stated that GI standards are important. The reasons reported were:
1. Protection of investments data documentation, data quality avoidance of duplication independence from industry standards2. Improved collaboration Within large organisations with many departments Easier to share, exchange, and integrate data Relationship with client becomes easier3. Customer requirements4. Legislative requirement5. Best practice, learn from others6. Support of research
The standards that have had a relatively high impact so far (in terms of usage) are the metadata standard and the standards for data content, data definitions and classifications of features. Data quality standards were recognized as important by most of the respondents.
It is foreseen that customers’ requirements for knowledge about quality in geographic information will increase. One of the examples of this is the emerging services for quality auditing4. Quality auditing can be defined as a systematic method from which one defines, collects and analyses information on a geographic dataset mainly attached to the customers’/users’ needs in order to make an objective judgment and/or a decision concerning the use of this data set. Auditing provides a professional independent third party opinion of the data to the customer. However it may only be applicable in certain contexts, where users are willing to invest in this service.
Use of geographic information will become more and more web based. Open geospatial standards will create possibilities for users to access different geospatial data from different users. There is clearly a need for quality-aware procedures and services. Quality is not only related to data but also to the context in which data is used. The Open Geospatial Consortium has started to work on this area5 already by nominating a working group.
Traditionally mapping and cadastral agencies have had full control of the process methods and used the same production methods for the whole mapping area. Production of topographic base information covered compiling information in the field and/or interpreting aerial photographs. The quality of, for example, topological relationships between objects, was guaranteed by using the same production methods for all feature types in one map sheet. The same production method guaranteed data quality using a “closed” production process. Now, most of the mapping agencies have completed the first digitalisation phase of topographic information. Some feature types are collected more frequently than others, which highlight the importance of data quality management. We call this a new production paradigm6, which includes usage of multiple sources in production. It is therefore important to record quality information into a database because the quality of features may vary depending on source. National mapping agencies will also use other (sub) contractors for producing datasets and it is important to introduce quality management models for controlling their results. Quality accreditation7 is one approach for this. Quality accreditation is a procedure by which a geographic data producer gives recognition to its suppliers, both external and internal, that they are capable of delivering data to the required quality, on time, in the necessary volumes and at the right cost. Another approach is quality certification, which is a third party attestation, demonstrating that adequate confidence is provided that a duly identified product, process or service is in conformity with a specific standard or other normative document.
3 Preliminary Results of Survey on Data Providers. ISO TC 211 Focus Group on Data Providers, http://www.isotc211fgdp.info/4 See presentation “Auditing Spatial Data Suitability for Specific Applications: Professional and Technological issues at http://www.eurogeographics.org/eng/05_quality_meetings_Feb06.asp 5 See http://www.opengeospatial.org/projects/groups/dqwg 6 See doctoral dissertation of Jakobsson http://lib.tkk.fi/Diss/2006/isbn9512282062/7 See presentation “Quality accreditation “A Journey Towards Perfection” at http://www.eurogeographics.org/eng/05_quality_meetings_Feb06.asp

7
Other internal needs include:
Homogeneity in production It is important that for example different production units produce uniform quality or different regions have uniform quality. Homogeneity in diffusion Customers expect that quality is as specified and diffusion process is part of the total process. Homogeneity in automation of working flows Possible opportunity for restructuring processes Motivation of personnel
We have here covered some of the reasons to implement quality standards for a national mapping agency. Figure 1.1 illustrates the reasons presented. We can categorize reasons as legislative, technological, production and markets.
Figure 1.1 Reasons for Implementing Quality Standards
Quality ofGeographic information
Legislative
Interoperability
Technology
Metadata
Production
EUINSPIRE
NSDI
Competition
Markets
Customerrequirements
MultipleSources
8
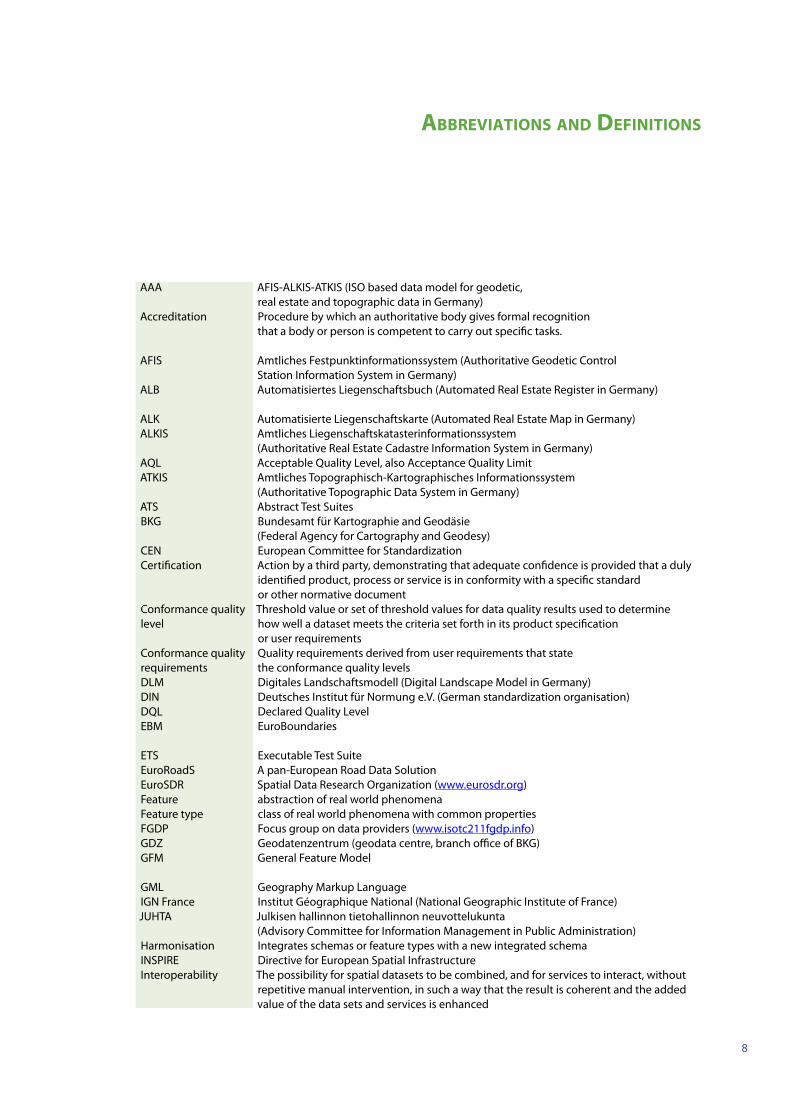
AAA AFIS-ALKIS-ATKIS (ISO based data model for geodetic, real estate and topographic data in Germany)
Accreditation Procedure by which an authoritative body gives formal recognition that a body or person is competent to carry out specific tasks.
AFIS Amtliches Festpunktinformationssystem (Authoritative Geodetic Control Station Information System in Germany)
ALB Automatisiertes Liegenschaftsbuch (Automated Real Estate Register in Germany)
ALK Automatisierte Liegenschaftskarte (Automated Real Estate Map in Germany)ALKIS Amtliches Liegenschaftskatasterinformationssystem
(Authoritative Real Estate Cadastre Information System in Germany)AQL Acceptable Quality Level, also Acceptance Quality LimitATKIS Amtliches Topographisch-Kartographisches Informationssystem
(Authoritative Topographic Data System in Germany)ATS Abstract Test SuitesBKG Bundesamt für Kartographie and Geodäsie
(Federal Agency for Cartography and Geodesy)CEN European Committee for StandardizationCertification Action by a third party, demonstrating that adequate confidence is provided that a duly
identified product, process or service is in conformity with a specific standard or other normative document
Conformance quality level
Threshold value or set of threshold values for data quality results used to determine how well a dataset meets the criteria set forth in its product specification or user requirements
Conformance quality requirements
Quality requirements derived from user requirements that state the conformance quality levels
DLM Digitales Landschaftsmodell (Digital Landscape Model in Germany)DIN Deutsches Institut für Normung e.V. (German standardization organisation)DQL Declared Quality LevelEBM EuroBoundaries
ETS Executable Test SuiteEuroRoadS A pan-European Road Data SolutionEuroSDR Spatial Data Research Organization (www.eurosdr.org)Feature abstraction of real world phenomenaFeature type class of real world phenomena with common propertiesFGDP Focus group on data providers (www.isotc211fgdp.info)GDZ Geodatenzentrum (geodata centre, branch office of BKG)GFM General Feature Model
GML Geography Markup LanguageIGN France Institut Géographique National (National Geographic Institute of France)JUHTA Julkisen hallinnon tietohallinnon neuvottelukunta
(Advisory Committee for Information Management in Public Administration)Harmonisation Integrates schemas or feature types with a new integrated schemaINSPIRE Directive for European Spatial InfrastructureInteroperability The possibility for spatial datasets to be combined, and for services to interact, without
repetitive manual intervention, in such a way that the result is coherent and the added value of the data sets and services is enhanced
ABBREVIATIONS AND DEFINITIONS
9
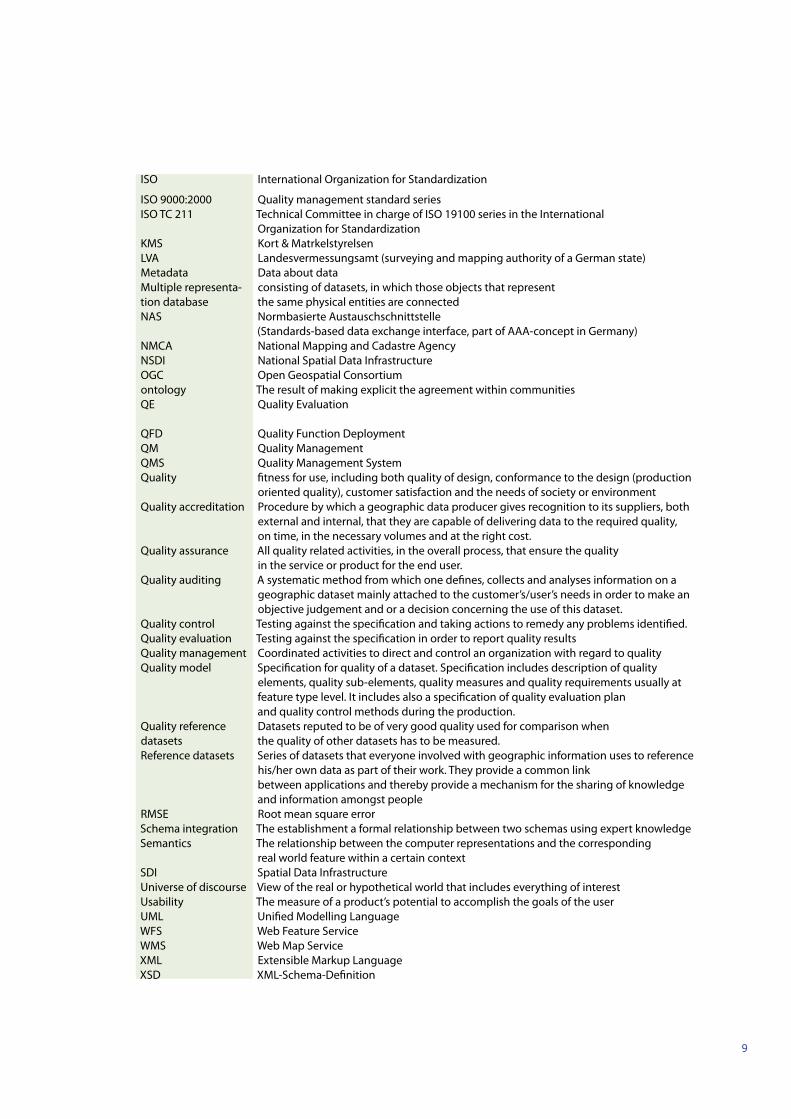
ISO International Organization for Standardization
ISO 9000:2000 Quality management standard seriesISO TC 211 Technical Committee in charge of ISO 19100 series in the International
Organization for StandardizationKMS Kort & MatrkelstyrelsenLVA Landesvermessungsamt (surveying and mapping authority of a German state)Metadata Data about dataMultiple representa-tion database
consisting of datasets, in which those objects that represent the same physical entities are connected
NAS Normbasierte Austauschschnittstelle (Standards-based data exchange interface, part of AAA-concept in Germany)
NMCA National Mapping and Cadastre AgencyNSDI National Spatial Data InfrastructureOGC Open Geospatial Consortiumontology The result of making explicit the agreement within communitiesQE Quality Evaluation
QFD Quality Function DeploymentQM Quality ManagementQMS Quality Management SystemQuality fitness for use, including both quality of design, conformance to the design (production
oriented quality), customer satisfaction and the needs of society or environmentQuality accreditation Procedure by which a geographic data producer gives recognition to its suppliers, both
external and internal, that they are capable of delivering data to the required quality, on time, in the necessary volumes and at the right cost.
Quality assurance All quality related activities, in the overall process, that ensure the quality in the service or product for the end user.
Quality auditing A systematic method from which one defines, collects and analyses information on a geographic dataset mainly attached to the customer’s/user’s needs in order to make an objective judgement and or a decision concerning the use of this dataset.
Quality control Testing against the specification and taking actions to remedy any problems identified.Quality evaluation Testing against the specification in order to report quality resultsQuality management Coordinated activities to direct and control an organization with regard to qualityQuality model Specification for quality of a dataset. Specification includes description of quality
elements, quality sub-elements, quality measures and quality requirements usually at feature type level. It includes also a specification of quality evaluation plan and quality control methods during the production.
Quality reference datasets
Datasets reputed to be of very good quality used for comparison when the quality of other datasets has to be measured.
Reference datasets Series of datasets that everyone involved with geographic information uses to reference his/her own data as part of their work. They provide a common link between applications and thereby provide a mechanism for the sharing of knowledge and information amongst people
RMSE Root mean square errorSchema integration The establishment a formal relationship between two schemas using expert knowledgeSemantics The relationship between the computer representations and the corresponding
real world feature within a certain contextSDI Spatial Data InfrastructureUniverse of discourse View of the real or hypothetical world that includes everything of interestUsability The measure of a product’s potential to accomplish the goals of the userUML Unified Modelling LanguageWFS Web Feature ServiceWMS Web Map ServiceXML Extensible Markup LanguageXSD XML-Schema-Definition

10
Reading Guide This document is aimed at technically experienced people with some knowledge about quality and quality evalua-tion of geographic information at the NMCAs. If you are a manager that is looking to identify how your organization should start implementing the ISO 19100 quality standards we recommend that you read the introduction, then Chapters 3 and 4 followed by Chapter 2. If you are not familiar with the quality concepts then we recommend that you start with Chapters 1 and 2 and then read the experiences from Chapter 5. We recommend that you also read some general books about quality.
The first Chapter focuses on the interpretation of quality concepts in reference data sets. It discusses the differences between cadastral data sets and topographic data sets.
Chapter 2 provides a brief description of the most important standards in the ISO 19100 series of quality standards. It also gives an overview of the current status of the standards. It should be used in connection with the standard text.
Chapter 3 gives implementation guidance. It introduces some overall information about how to describe and how to find your needs before implementing the standards. It also gives you information on how to address those needs using the standards and gives you suggestions on where to start. The chapter also gives information on how to implement common quality phenomenon using the standards.
Chapter 4 discusses different strategies for implementing the standards. In Chapter 5, we give experiences from 6 NMCAs describing how they are implementing the standards. The appendices give some examples of national profiles, organizational profiles, quality models and some software for quality assurance.

11
INTERPRETATION OF THE QUALITY CONCEPT IN REFERENCE DATA SETS
1.1 IntroductionQuality can have different interpretations depending on where in the production and usage life cycle the reference data is. Table 1.1 and Figure 1.2 illustrate three different phases of a reference data set (before production, produc-tion and after production, documentation of quality, goal for quality, quality methods and level). The ISO 19100 quality standards can be used in this process to specify and report data quality. Chapter 3 and Table 3.1 give more guidance on this.
TABLE 1.1 INTERPRETATION OF QUALITY IN DIFFERENT PHASES OF PRODUCTION
CHA
PTER
1Phase Quality
documentationGoal for quality Quality
methodsLevel
Before production
Specification -> quality model
Define quality requirements
Investigation of customer requirements
Feature type level
Production Database->Process history
Meet the specificationRecord expected quality to database
Inspection Feature instance (e.g. dates, positional accuracy)
After production MetadataTest reports
Measure conformance to quality requirements
EvaluationReporting
Dataset level

12
Before production it is important to specify quality requirements for data sets. This can be done by describing a quality model. In the quality model, quality elements should be specified including goals for quality (conform-ance quality) at feature type level. ISO 19100 series does not specify the content of a quality model but the same principles can be used to organize the content of a quality model. Examples of the national quality model can be found for example in Finland or Sweden and also in the EuroRoadS Quality model. Definition of a quality model is important for large reference data sets in order to report quality in metadata. Quality evaluation results will only confirm that quality requirements are met. After an update in the database evaluation results are no longer valid and therefore metadata of large reference data sets contain conformance quality levels and information about performed tests. Quality requirements should be investigated by utilizing user requirement studies.
Figure 1.2 Quality in General Production Process
During production quality management principles should be applied. Recommended methods include introducing a process management and ISO 9000 principles8. Organizations may also certificate quality management processes. During the production process, history should be recorded as lineage (including dates). Database may contain expected quality measures based on production methods (e.g. positional accuracy) at feature instance level. Here quality accreditation9 may be considered.
After production quality evaluation should be performed and metadata should be finalized. Quality evaluation should be made according to ISO 19114 standard. There are different strategies for how a quality evaluation may be performed. In order to analyse the reliability of a certain process, e.g. an information process, a reliability analysis might be performed. An example of such analysis can be found from EuroRoadS project10.
8 See Quality Management Guideline of the Expert Group on Quality9 At the moment no international standard of quality accreditation in geographic information is available. National example can be used
from Great Britain. 10 See document D2.3 Probabilistic model to describe and evaluate information quality. http://www.euroroads.org/php/Reports/D2.3.pdf. It
should be noted that this procedure is applicable only to a situation where reliability of a certain process is the main concern.

13
1.2 Cadastral Issues This chapter will introduce some quality issues related to cadastre. It is not meant to include a comprehensive list of quality issues. Legal status in countries may also vary so that the discussion here may not be applicable to all national cadastral data sets.
The interest of users may be different when compared with topographical data users. Users of cadastral information are interested in both the legal and spatial part of the information. However the legal part is mostly dominating.
European cadastre’s can be categorized as
Positionally-accurate cadastre In positionally-accurate type cadastres the attribute (ownership records) and the location are both up-to-date
and accurate. These can be found in Austria, the Netherlands and Finland (urban areas). Index map cadastre In index map type cadastres, the actual representation of the property units can be found either from legal
documents or in the field but the ownership records are accurate and up-to-date. Index maps present the topological relations between the cadastral units. Examples of these cadastres can be found in Sweden and Finland (outside urban areas).
Mosaic cadastre In mosaic type cadastres there in no legal requirement to register the ownership and therefore the cadastre
often covers only part of the country. The Cadastre contains information of individual ownerships, but there is no direct relationship with neighbouring parcels. Combinations of different title maps may be compiled or reproduced but the topological relations remain undefined. These cadastres exist in Great Britain, United States and Canada.
Table 1.2 depicts the categorization of different cadastral types and how quality is improved. Also the role of quality is different in each type. In positionally-accurate cadastre the quality management process is very important so that the information is not accidentally changed in the process steps.
In the real world physical features such as fences, hedges or the side of a building usually mark the ownership. The quality aspect of this is that the features must be kept in their correct location.
TABLE 1.2 DIFFERENT TYPES OF CADASTRES AND THE ROLE OF QUALITY
Cadastre Type Ownership data Location data Potential quality issues
Mosaic Ownership records Ownership maps (general boundaries)
Reliability No other quality information available
Index Ownership as attribute information
Uniform index map Positional AccuracyTopological consistencyProcess management
Positionally-accurate Ownership as attribute information
Accurate location of boundary points
Logical consistencySecurity issuesProcess management

14
In Finland and Sweden the National Land Surveys manage the land surveying process and the cadastre. Whilst, for example, in Denmark private surveyors have the responsibility of land surveying. In principle this should have no affect on how quality is managed but in practice there are differences in how organisations implement the process management. Traditionally organisations have not paid so much interest to contractor’s processes and only checked that the results are correct. This may have lead to some duplication and extra costs in the process. Also responsibility for quality might be different. In Finland and Sweden the National Land Survey has the responsibility for the quality concerning land survey results whilst in Denmark the surveyor’s have this responsibility.
Most cadastral data sets have a large variation in absolute and relative positional accuracy. The absolute accuracy of the neighbouring boundary points can vary between 10 cm to several metres, while relative accuracy of the neighbouring parcels is well defined. This means that it can be very difficult to make test procedures with a common conformance level for the whole data set. Instead new measured points can have a different conformance level compared with the average situation.
Lineage and historical data in cadastral data sets is very important. It is very important that you can go back and see what the cadastral situation was at any given point in time. Its part of the legislation for the cadastral data sets, that you are able to document the current situation at a given time.
Metadata for cadastral data is also a challenge, for two reasons:
1. The update frequency is continuous; this means that the metadata production should be integrated with the continuous update process.
2. The data quality will be improved/changed every day. Quality evaluation results are therefore not valid for a long period of time. Metadata should therefore contain quality information about conformance quality levels together with recorded quality measures from the database (e.g. expected mean values of positional uncertain-ties 0.1m and 0.2 m).
The most important quality elements are as follows:
Positional accuracy is important from the legal aspect. It is important that cadastral information has sufficient accuracy because it is important to know rather exactly the right owner e.g. when cadastral information is combined with different datasets. Estimation of positional accuracy is important because of the continuous change of features, adaptation of old information and new information.
Lineage information is important because an estimate of the positional accuracy can be derived from the source and production method.
Thematic accuracy Completeness. 100 % completeness Logical consistency Temporal validity
There is a need to report data quality at dataset and feature/instance levels. There is also a need to integrate new measurements to the existing data. Therefore it is important to know the estimated quality at the instance level.
Sampling may be used to check the quality when registering the cadastral updates. See example from The Netherlands.

15
1.3 Topographic issues The most common way of updating topographic features is through a periodic updating cycle. Generally speak-ing it is a full update, which means that all topographic features belonging to a dataset are updated at the same time (while the features in the dataset may have been surveyed or captured at different times). We notice that customers are more and more interested in the up-to-dateness of the topographic information. This leads to ways of continuous updating whereby customer needs are or should be leading to prioritisation of issues for continuous updating.
We frequently see a need for continuous updating in infrastructural features e.g. roads, railways, power lines and buildings. The problem is how to incorporate these features in existing datasets. Addition of new features is not the real problem; the real problem is it invariably leads to changes (updates) to features, which are not specified for continuous updating. For example, when roads are included in the continuous update plan and there is a change in that feature. Invariably the fields surrounding the road have to be changed as well (and possibly the unique identifiers).
The easiest way is by providing enough capacity to do a full continuous update. The other way is to create an object oriented database with unique identification codes for each topographic object/issue. Here the objects/issues exist in themselves and in object attributes you can show the update time and the temporality of the object.
Quality evaluation according to the ISO 19100 series provides the possibility to add quality aspects to each object in the database. Setting up the specifications for the different topographic objects or issues according to ISO 19100 provides a good start for evaluating quality. For each feature type conformance levels should be defined according to Table 2.1. “Quality elements and sub-elements in the ISO 19113 standard” giving a good start for evaluating quality.
Changing to continuous updating brings the need to co-operate with others who also produce topographic information. It is important and often difficult to gather information from others using the right unique identification codes. A universal identification code system for a country could be a solution. An intermediate solution might be to allocate your own unique identification codes for this information.
More difficult is the communication problem, especially communication about the specifications. What is provided by the co-operating company and in what way the information reaches the database specifications. There must be good agreement between the companies.
Providing clear specifications and quality items for the objects/issues can solve the quality management problem arising from using information from co-operating companies. The NMCAs should develop a way to evaluate the quality of the information from the co-operating companies in the same way they evaluate the quality of their own database.
The problem in updating can be divided in two questions:
Are customers’ needs for updating features consistent? Customer needs must be the input for continuous updating; do they require full or partly continuous updating?
Is it possible to get all information from different co-operating companies at the right time and in the same specifications and quality? It is important to investigate if the effort in getting information from co-operating companies is less expensive than getting the information by yourself. Also the logistics of getting the informa-tion from others is important, how true are co-operating companies in updating the information, is it possible to have influence on the their updating cycle? And, as mentioned before, how is to be assured that the quality of the information matches the specifications.

16
The interoperability problem exists when you start getting data from other providers. It can be solved in several ways:
Ontology-matching, data-matching Cope with the different specifications from the co-operating companies and transfer the objects/features
into your own specifications using ontology. It is applicable in some cases but you might end-up in gathering information again.
Data harmonization effort: Put a lot of effort in communication about specifications and try to reach with all co-operating companies the
same specifications, at least at the time they deliver the information. Put effort into creating a law for standardization of topographic information that must be used in all national
processes, developments and planning of the national topographic landscape.
In general, quality evaluation of the master database is important (most important may be the logical consistency). If you don’t know the quality of a master database it is very difficult or impossible to evaluate the quality of a derived database. Quality of a derived database is dependent on quality of a master database. ISO 19114 (Quality evaluation) standard can be used to evaluate the master database (original observation) data when completing further processing (i.e. generalization). Quality evaluation of derived datasets can consist of logical consistency checks that can be automated and based on generalization rules. If the quality of a master database has been evaluated then quality of a derived database is mostly dependent on generalization rules.
Printed maps and derived databases may be different at the same accuracy level. User requirements should be evaluated with different choices as well as cost benefits of applying manual cartographic generalization. Cartographic quality may not be important in certain application areas and it should be evaluated how many manual changes are needed for a derived database.
Management of object history (e.g. by using ids, time stamps and linking the current and history records) in the database to enable retrieval of change information (new, altered and deleted objects during a given period of time) is essential for in-house as well as possible customer needs.11
For European co-operation and interoperability NMCAs should start by describing ‘minimum’ specifications for topographic features. The INSPIRE process together with EuroGeographics projects (EuroSpec, EuroRoadS, EuroBoundaries, EuroGlobalMap and EuroRegionalMap) have already started this process. These specifications should be based on the ISO 19131 standard.
Handling of multi-source, multi-accuracy, multi-scale topographic information can be achieved using attributed information at a topographic feature level. This can be implemented by multi-resolution databases. Quality information should also cover attribute information, not only the feature type information.
11 See Benchmarking report on generalization, Expert Group on Quality, 2005 http://www.eurogeographics.org/eng/documents/Benchmarking_FR-2004_ver_09.doc

17
THE ISO 19100 QUALITY STANDARDS
2.1 Brief Introduction to the Quality Related StandardsOne of the most important goals for the ISO 19100 series of standards is to enable geospatial datasets to interact between different data models and different applications. The more geospatial datasets that exist with different data models and different levels of quality the more important it is that the user is aware of where and how the datasets can be used in an application.
The Quality-related standards in the ISO 19100 family are:
EN ISO 19113 Geographic Information – Quality principles EN ISO 19114 Geographic Information – Quality evaluation procedures TS ISO 19138 Geographic Information – Data quality measures EN ISO 19115 Geographic Information – Metadata CD ISO 19115 Geographic Information – Metadata –Part 2 : Extensions for imagery and gridded data TS ISO 19139 Geographic Information – Metadata – XML schema implementation ISO 19131 Geographic Information – Data product specifications
Note: These Guidelines will not discuss the specific aspects of the quality of imagery data, to which, of course, the general concepts and principles apply.
CHA
PTER
2

18
2.2 EN ISO 19113 Geographic Information – Quality principles
2.2.1 Current status of the standardISO 19113 was published in 2002 and CEN has published it as a European standard in January 2005. This standard will probably be revised in coming years12
2.2.2 Description of content
The purpose of EN ISO 19113 is to:
Establish principles for describing the quality of geographic data Specify components for reporting quality Organize information about data quality
It is applicable both to data producers and users.
Figure 2.1 represents the concept of data quality that is used in the standard. Data quality is a difference between universe of discourse, (i.e. a view on the real or hypothetical world), which is defined by a product specification, and a dataset. A data producer’s view on data quality and the users’ view on data quality may merge if the requirements are identical.
Data quality is the difference between a dataset and a universe of discourse. Producers and users may use different universes of discourse, and will thus assess differently the quality of the same dataset. The role of product specifications (if possible, including a priori known user requirements) in establishing a generic, or clearly structured, universe of discourse, is central and the subject of the ISO 19131 standard.
Figure 2.1 Concept of Data Quality in ISO 19113 standard
12 Usually the revision is expected after 5 years.

19
Data quality elementData quality sub-element
Description
Completeness Presence or absence of features, their attributes and relationshipsCommission Excess data present in a datasetOmission Data absent from a datasetLogical consistency Degree of adherence to logical rules of data structure,
attribution and relationshipsConceptual consistency Adherence to rules of the conceptual schemaDomain consistency Adherence of values to the value domainsFormat consistency Degree to which data is stored in accordance with the physical
structure of the data setTopological consistency Correctness of the explicitly encoded topological characteristics of a datasetPositional accuracy Accuracy of the position of featuresAbsolute or external accuracy Closeness of reported coordinate values to values accepted as or being trueRelative or internal accuracy Closeness of the relative positions of features in a dataset to their respective
relative positions accepted as or being trueGridded data position accuracy
Closeness of gridded data position values to values accepted as or being true
Temporal accuracy Accuracy of the temporal attributes and temporal relationships of featuresAccuracy of a time measurement
Correctness of the temporal references of an item (reporting of error in time measurement)
Temporal consistency Correctness of ordered events or sequences, if reportedTemporal validity Validity of data with respect to timeThematic accuracy Accuracy of quantitative attributes and the correctness of non-quantitative
attributes and of the classifications of features and their relationshipsClassification correctness Comparison of the classes assigned to features or their attributes to a
universe of discourse (e.g. ground truth or reference data set)Non-quantitative attribute correctness
Correctness of non-quantitative attributes
Quantitative attribute accuracy
Accuracy of quantitative attributes
The ISO 19113 standard does not specify how to measure the differences between a dataset and universe of discourse. It defines taxonomy of the various kinds of differences that are usually measured, those various kinds of differences being called quality elements and sub-elements. It also describes how to identify whether these elements and sub-elements apply to one given dataset, how to create additional elements and sub-elements, and how the reporting of quality assessment should be performed, in relation to the ISO 19114 standard.
Table 2.1 describes the quality elements and sub-elements that are defined in the standard.
TABLE 2.1 QUALITY ELEMENT AND SUB-ELEMENTS IN THE ISO 19113 STANDARD
The data quality elements and sub-elements presented in Table 2.1 should be used to structure the reporting of quality evaluation (see ISO 19114). Measurements are seen as metadata components, which are specified in the ISO 19115 standard.
Measurable quality of a dataset should be described using the data quality elements and sub-elements that are presented in Table 2.1. Data quality overview elements can be used to describe non-quantitative quality. Overview elements are purpose, usage and lineage. It should be noted that the standard doesn’t require the use of only the quality elements and sub-elements that are described in the standard. Users of a standard may define their own quality elements and sub-elements.

20
The standard defines how a data quality sub-element should be reported using quality descriptors. Those are:
Data quality scope Data quality measure Data quality evaluation procedure Data quality result Data quality value type Data quality value unit Data quality date
Quality of quality information may also be reported, but the standard gives no guidance on this.
2.2.3 UsageThe standard can be used to describe quality requirements for a dataset. Those quality requirements can be de-scribed by quality elements and sub-element. Using ISO 19114 the data can then be evaluated and the quality results can be reported in metadata according to ISO 19115 or in a separate quality report.
2.3 EN ISO 19114 Geographic Information – Quality evaluation procedures
2.3.1 Current status of the standardISO 19114 was published originally in 2003. Technical corrigendum was published in 2005 related to Annex G. CEN has published it as a European standard in January 2005 and the corrigendum in 2006.
2.3.2 Description of content
The purpose of the EN ISO 19114 is to:
Provide a framework of procedures for determining and evaluating quality of geographic datasets Establish a framework for evaluating and reporting data quality results, as part of metadata or as a data quality report
The standard describes a general process flow to guide the data quality evaluation process. Basically it is a 6-step procedure:
Step 1: Identify an applicable data quality element, sub-element and data quality scope Step 2: Identify, for each sub-element and scope, a suitable data quality measure Step 3: Select and apply a data quality evaluation method Step 4: Determine the data quality result Step 5: Determine conformance Step 6: Report on results and /or conformance
After step 4 results may be reported if a user of the procedure wants to report quantitative result and after step 5 conformances to quality requirements may be reported if product specifications include those.

21
Figure 2.2 Data Quality Evaluation Process
The standard classifies data quality evaluation methods as direct and indirect quality evaluation methods. Direct evaluation methods can be either internal or external. An example of internal direct quality evaluation is a logical consistency test that can be performed using a dataset by itself. External direct evaluation occurs when an external dataset or the real world is used as a reference against which the dataset is evaluated. Indirect evaluation methods use external knowledge such as usage, lineage and purpose.
Techniques for direct evaluation are full inspection or sampling. The standard suggests using general sampling standards such as ISO 2859 and ISO 3951. Informative annex of the standard provides information on how to select appropriate sampling strategy.
The standard specifies the fields to be filled in when reporting on assessment as a quality evaluation report (Annex I in the standard):
Identification of reporting document Scope observed Measure used (formula, resulting values, result unit, reliability, reliability unit) Confidence in conformance test (confidence value, confidence unit, documents explaining the method) Type of quality evaluation method used (direct external etc., inspection strategy applied) Description of quality method used (basic assumptions, processing algorithms, definition of parameters, parameter values for the specific test, parameter units Possible aggregation of results (unit for aggregated values, resulting values, statistics used for aggregation, computation date, pointer to aggregation report) Other descriptions may be provided if necessary

22
Table 2.2 provides an example of usage of the standard. DQ_elements and DQ_sub-elements are coming from the ISO 19113 standard (but they are also described in ISO 19114) see Table 2.1. DQ_measures have been discussed in ISO 19114 standard but the technical specification TS ISO 19138 should be used to describe those. Data producers should describe the conformance levels (e.g. in the data quality model). ISO 19114 does not describe the evaluation procedures so the producers should apply e.g. ISO 2859 standard for this. DQ_values are obtained from the evaluation process. If conformance quality levels have been described then the conformance result is either accepted or rejected.
TABLE 2.2 EXAMPLES HOW TO USE ISO 19114 STANDARD
DQ_element
DQ_subelement
DQ_measure
DQ_conformcelevel
DQ_EvalProcedureDesc
DQ_value
Completeness Omission Number of missing items
Declared Quality Level (DQL) 2,5% (based on ISO 2959-4 standard)
Stratified random sampling using inspection of items in the field. Sample size 32 items
Accepted (Number of missing items 1)
Logical consistency
Domain consistency
Number of items not in conformance with their value domain
0 Full inspection Rejected(Number of wrong items 1)
Positional Accuracy
Absolute of external accuracy
RMSE 2 m Random sample Accepted (RMSE 1,5 m)
2.3.3 UsageThe obvious use of quality evaluation process is during and after collection or maintenance of a dataset. Quality evaluation procedures can be used in a development process of product specifications. This means that a product specification should contain data quality requirements and quality evaluation is used to test the validity of require-ments.

23
2.4 TS ISO 19138 Geographic information - Data quality measure
2.4.1 Current status of the technical specificationTechnical specification has been published in 2006.
2.4.2 Description of contentThe objective of the technical specification is to guide the producer in choosing the right data quality measures for data quality reporting and the user in the evaluation of the usefulness of a dataset by standardising the components and structures of data quality measures and by defining commonly used data quality measures.
It defines a set of data quality measures that can be used when reporting data quality for the sub-elements in ISO 19113. The idea is to build a register of standardized quality measures. It does not limit users from defining their own quality measures.
Each quality measure is described by a set of components (see Table 2.3). Specification includes a list of data quality basic measures that can be used to describe quality measures (see Table 2.4)
TABLE 2.3 COMPONENTS OF QUALITY MEASURES (SUMMARIZED FROM TABLE B.1 ISO 19138)
Component Description ObligationM=mandatory, O=obligatory, C=conditional
Comments/Examples
Name Name of the data quality measure. M
Alias Other recognised name for the same data quality measure.
O
Data quality element
The name of the data quality element to which this data quality measure applies. See Chapter 2.2 on ISO 19113
M
Data quality sub-element
The name of the data quality sub-element to which this data quality measure applies. See Chapter 2.2 on ISO 19113
M
Data quality basic measure Name of data quality basic measure C Technical specification lists a set
of data quality basic measures that can be used. The user can define their own data quality basic measure. Its is typically based on counting of erroneous items, dealing with uncertainty or general statistical measures
Definition Statement of the fundamental concept of the data quality measure
M
Description Description of the data quality measure including method of calculation with all formulae and/or illustrations needed to establish the result of applying the measure.
CIf the definition is not sufficient to understand the data quality measure concept.Example: what is not measured, not counted, what other measures should be used to help interpret the results.

24
Component Description ObligationM=mandatory, O=obligatory, C=conditional
Comments/Examples
Parameter(s) Auxiliary variables used by the data quality measure including name, definition and description.
C There can be one or many parameters
Data quality value type
Value type for reporting a data quality result.
M Examples include Boolean, real, integer, ratio, percentage or measure(s) (values+ units)
Data quality value structure
Structure for reporting a complex data quality result
O Bag, Set, Sequence, Table, Matrix, Coverage
Source reference
Citation of the source of the data quality measure.
C If an external source exists
Example Example of applying the data quality measure or the result obtained for the data quality measure.
O
Identifier Integer number, uniquely identifying a data quality measure.
C If data quality measures are administered in a register
TABLE 2.4 BASIC DATA QUALITY MEASURES (SEE TABLE C.1 ISO 19138, EXAMPLES ARE MODIFIED FROM THE STANDARD)
Data quality basic measure name
Data quality basic measure definition
Examples
Error indicator Item is in error True (item is not correct)/False (item is correct)
Correctness indicator Item is not in error True (item is correct) / False (item is not correct)
Error count Total number of items that are subject to an error of a specified type
10 (number of incorrect items)
Correct items count Total number of items that are free of errors of a specified type
200 (number of correct items)
Error rate Number of the erroneous items with respect to the total number of items that should have been present
Error rate can be real, percentage or ratio. Note: Total number of items that should have been present should also be reported if real or percentage is used.
Correct items rate Number of the correct items with respect to the total number of items that should have been present
See above.

25
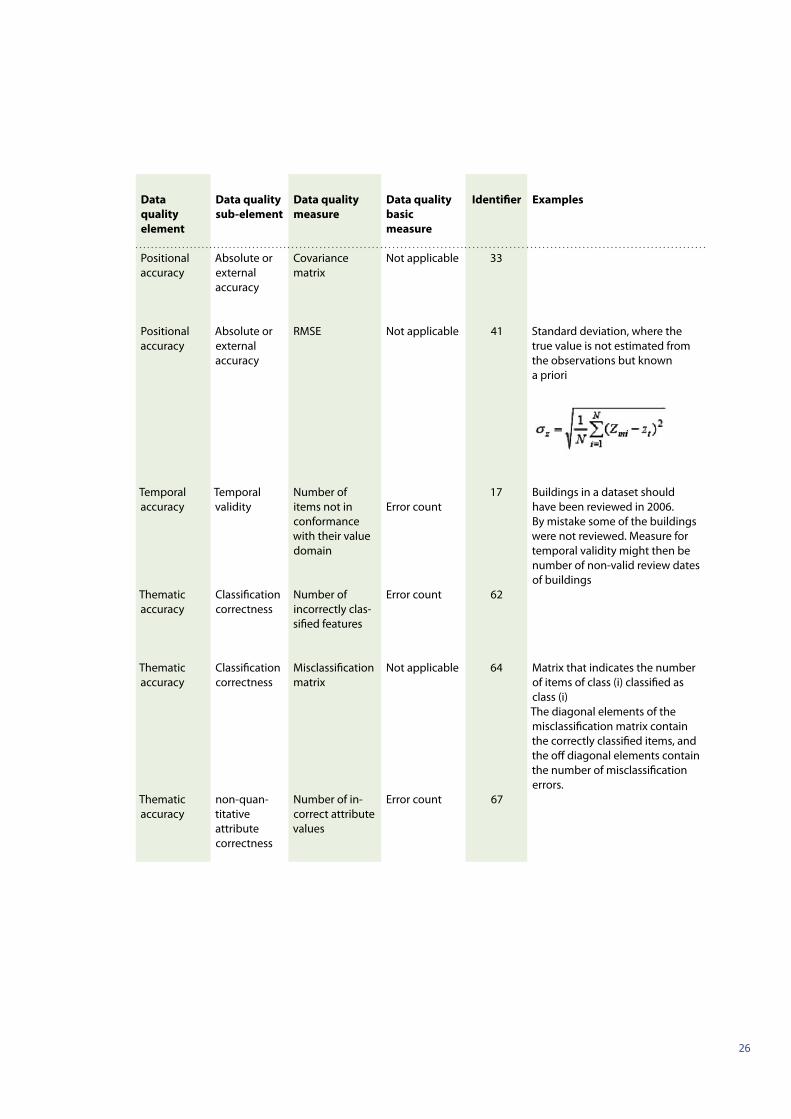
The technical specification includes a comprehensive list of the measures (currently 75). Table 2.5 describes some quality measures for the NMCAs that were currently identified in the standard. Some of the quality elements or sub-elements have no appropriate quality measures at the moment.
TABLE 2.5 SELECTED IMPORTANT QUALITY MEASURES FOR THE NMCAS
Data quality element
Data quality sub-element
Data quality measure
Data quality basic measure
Identifier Examples
Commission Commission Number of excess items
Error count 2
Commission Omission Number of missing items
Error count 7
Logical consistency
Conceptual consistency
Number of items noncompliant to the rules of the conceptual schema
Error count 11
Logical consistency
Domain consistency
Number of items not in conformance with their value domain
Error count 17
Logical consistency
Topological consistency
Number of faulty point-curve connections
Error count 22 Two roads in a junction don’t meet
Logical consistency
Topological consistency
Number of missing connection due to undershoots
Error count 24
Logical consistency
Topological consistency
Number of missing connections due to overshoots
Error count 25
Positional accuracy
Absolute or external accuracy
Mean value of positional uncertainties (1D, 2D and 3D)
Not applicable 29 This is applicable when a set of co-ordinates considered to be true exists.
Positional accuracy
Absolute or external accuracy
Mean value of positional uncertainties excluding outliers (2D)
Not applicable 30 Same as quality measure with identifier 29 except all positional uncertainties above a defined threshold are removed from the set.
26
Data quality element
Data quality sub-element
Data quality measure
Data quality basic measure
Identifier Examples
Positional accuracy
Absolute or external accuracy
Covariance matrix
Not applicable 33
Positional accuracy
Absolute or external accuracy
RMSE Not applicable 41 Standard deviation, where the true value is not estimated from the observations but known a priori
Temporal accuracy
Temporal validity
Number of items not in conformance with their value domain
Error count17 Buildings in a dataset should
have been reviewed in 2006. By mistake some of the buildings were not reviewed. Measure for temporal validity might then be number of non-valid review dates of buildings
Thematic accuracy
Classification correctness
Number of incorrectly clas-sified features
Error count 62
Thematic accuracy
Classification correctness
Misclassification matrix
Not applicable 64 Matrix that indicates the number of items of class (i) classified as class (i)The diagonal elements of the misclassification matrix contain the correctly classified items, and the off diagonal elements contain the number of misclassification errors.
Thematic accuracy
non-quan-titative attribute correctness
Number of in-correct attribute values
Error count 67

27
Table 2.6 identifies some of the existing measures used in NMCAs that are not currently included in the specification.
TABLE 2.6 QUALITY MEASURES USED IN NMCAS
Data Quality element
Data Quality sub element
Data quality measure
Data quality basic measure
Country Examples
Positional accuracy
Absolute or external accuracy
Mean normalized fluctuation of linear features
Database to Universe of discourse component of the Hausdorff distance between line in database and line in universe of discourse
France
Temporal accuracy
Accuracy of a time measurement
Mean value of date attributes
Difference between date in database and date in universe of discourse
France
28
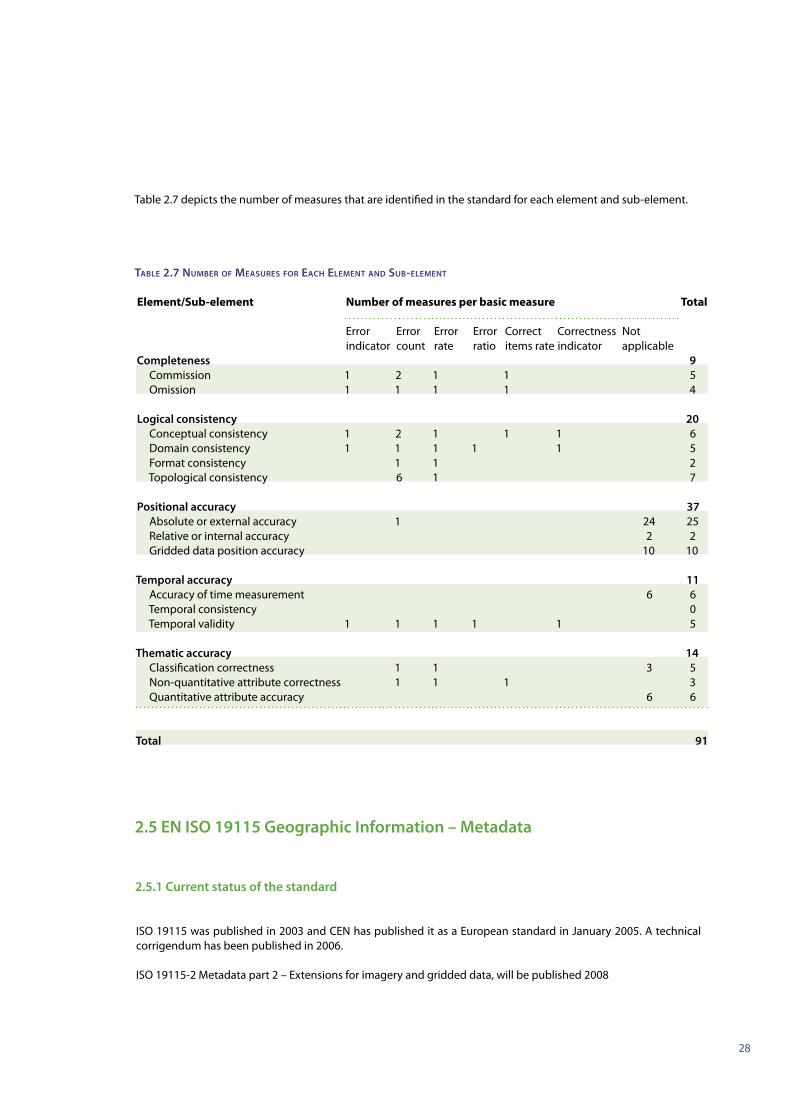
Table 2.7 depicts the number of measures that are identified in the standard for each element and sub-element.
TABLE 2.7 NUMBER OF MEASURES FOR EACH ELEMENT AND SUB-ELEMENT
Element/Sub-element Number of measures per basic measure Total
Error indicator
Error count
Error rate
Error ratio
Correct items rate
Correctness indicator
Not applicable
Completeness 9 Commission 1 2 1 1 5 Omission 1 1 1 1 4
Logical consistency 20 Conceptual consistency 1 2 1 1 1 6 Domain consistency 1 1 1 1 1 5 Format consistency 1 1 2 Topological consistency 6 1 7
Positional accuracy 37 Absolute or external accuracy 1 24 25 Relative or internal accuracy 2 2 Gridded data position accuracy 10 10
Temporal accuracy 11 Accuracy of time measurement 6 6 Temporal consistency 0 Temporal validity 1 1 1 1 1 5
Thematic accuracy 14 Classification correctness 1 1 3 5 Non-quantitative attribute correctness 1 1 1 3 Quantitative attribute accuracy 6 6
Total 91
2.5 EN ISO 19115 Geographic Information – Metadata
2.5.1 Current status of the standard
ISO 19115 was published in 2003 and CEN has published it as a European standard in January 2005. A technical corrigendum has been published in 2006.
ISO 19115-2 Metadata part 2 – Extensions for imagery and gridded data, will be published 2008
29
2.5.2 Description of contentThis international standard defines general-purpose metadata for digital geographic data and provides a structure for describing all metadata given in the ISO 19100 standards. More detailed metadata for geographic data types and services are defined in other ISO 19100 standards and user extensions. For the Data quality principles (ISO 19113) and Evaluation procedures (ISO 19114) the UML schema and data dictionary for documenting is a part of this document.
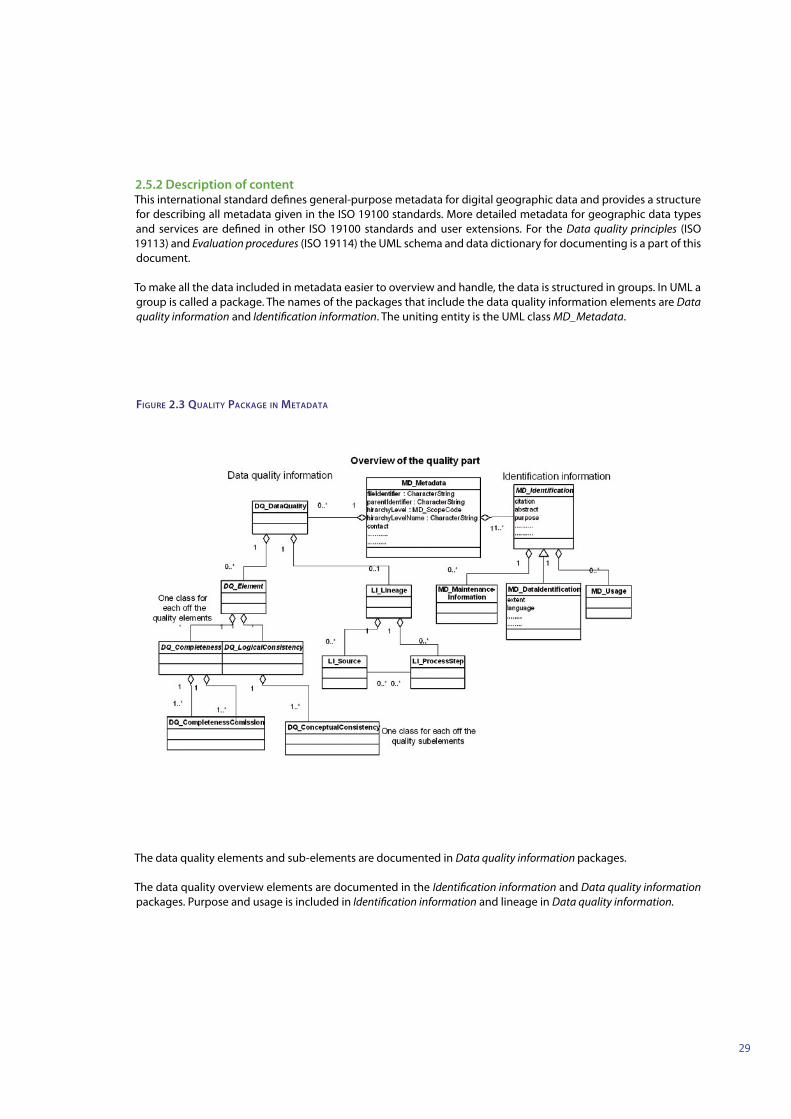
To make all the data included in metadata easier to overview and handle, the data is structured in groups. In UML a group is called a package. The names of the packages that include the data quality information elements are Data quality information and Identification information. The uniting entity is the UML class MD_Metadata.
FIGURE 2.3 QUALITY PACKAGE IN METADATA
The data quality elements and sub-elements are documented in Data quality information packages.
The data quality overview elements are documented in the Identification information and Data quality information packages. Purpose and usage is included in Identification information and lineage in Data quality information.

30
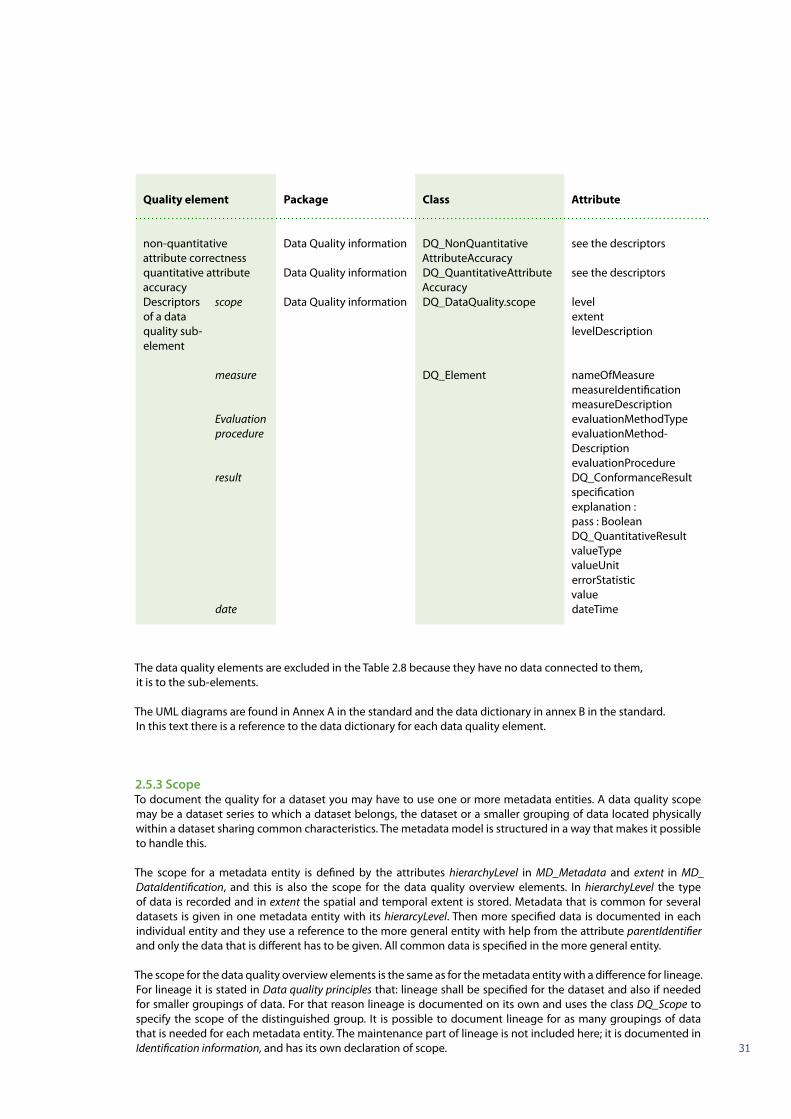
TABLE 2.8 WHERE TO DOCUMENT THE QUALITY ELEMENTS IN METADATA
Quality element Package Class Attribute
scope MD_Metadata hierarcyLevelscope Identification
informationMD_DataIdentification extent
purpose Identification information
MD_DataIdentification purpose
usage Identification information
MD_Usage specificUsage usageDateTime userDeterminedLimita-tions userContactInfo
lineage history Data Quality information LI_Lineage statementprocess step Data Quality information LI_ProcessStep description
rationale dateTime processor
source information
Data Quality information LI_Source description scaleDenominator sourceReferenceSystem sourceCitation sourceExtent
Scope Data Quality information DQ_DataQualityScope level extent levelDescription
maintenance Identification informa-tion
MD_MaintenanceInformation
maintenanceAndUpdate-Frequency dateOfNext-Update userDefinedMaintenance-Frequency updateScope updateScope-Description maintenanceNote contact
completeness commis-sion
Data Quality information DQ_CompletenessCommission
see the descriptors
completeness omission Data Quality information DQ_CompletenessOmission
see the descriptors
conceptual consistency Data Quality information DQ_ConceptualConsistency
see the descriptors
domain consistency Data Quality information DQ_DomainConsistency see the descriptorsformat consistency Data Quality information DQ_FormatConsistency see the descriptorstopological consistency Data Quality information DQ_
TopologicalConsistencysee the descriptors
absolute or external accuracy
Data Quality information DQ_AbsoluteExternalPositionalAccuracy
see the descriptors
relative or internal accuracy
Data Quality information DQ_RelativeInternal PositionalAccuracy
see the descriptors
gridded data positional accuracy
Data Quality information DQ_GriddedDataPositionalAccuracy
see the descriptors
accuracy of a time measurement
Data Quality information DQ_AccuracyOfATimeMeasurement
see the descriptors
Temporal consistency Data Quality information DQ_TemporalConsistency see the descriptorstemporal validity Data Quality information DQ_TemporalValidity see the descriptorsclassification correctness Data Quality information DQ_ThematicClassification
Correctnesssee the descriptors
31
Quality element Package Class Attribute
non-quantitative attribute correctness
Data Quality information DQ_NonQuantitativeAttributeAccuracy
see the descriptors
quantitative attribute accuracy
Data Quality information DQ_QuantitativeAttributeAccuracy
see the descriptors
Descriptors of a data quality sub-element
scope Data Quality information DQ_DataQuality.scope level extent levelDescription
measure DQ_Element nameOfMeasure measureIdentification measureDescription
Evaluation procedure
evaluationMethodType evaluationMethod-Description evaluationProcedure
result DQ_ConformanceResultspecification explanation : pass : BooleanDQ_QuantitativeResultvalueType valueUnit errorStatistic value
date dateTime
The data quality elements are excluded in the Table 2.8 because they have no data connected to them, it is to the sub-elements. The UML diagrams are found in Annex A in the standard and the data dictionary in annex B in the standard. In this text there is a reference to the data dictionary for each data quality element.
2.5.3 ScopeTo document the quality for a dataset you may have to use one or more metadata entities. A data quality scope may be a dataset series to which a dataset belongs, the dataset or a smaller grouping of data located physically within a dataset sharing common characteristics. The metadata model is structured in a way that makes it possible to handle this.
The scope for a metadata entity is defined by the attributes hierarchyLevel in MD_Metadata and extent in MD_DataIdentification, and this is also the scope for the data quality overview elements. In hierarchyLevel the type of data is recorded and in extent the spatial and temporal extent is stored. Metadata that is common for several datasets is given in one metadata entity with its hierarcyLevel. Then more specified data is documented in each individual entity and they use a reference to the more general entity with help from the attribute parentIdentifier and only the data that is different has to be given. All common data is specified in the more general entity.
The scope for the data quality overview elements is the same as for the metadata entity with a difference for lineage. For lineage it is stated in Data quality principles that: lineage shall be specified for the dataset and also if needed for smaller groupings of data. For that reason lineage is documented on its own and uses the class DQ_Scope to specify the scope of the distinguished group. It is possible to document lineage for as many groupings of data that is needed for each metadata entity. The maintenance part of lineage is not included here; it is documented in Identification information, and has its own declaration of scope.

32
For hierarchyLevel there is a list with permitted values documented in MD_ScopeCode, with the definitions located in section B.5.25 MD_ScopeCode <<CodeList>>. The data dictionary for the class MD_Metadata is located in section B.2.1 Metadata entity set information and for the spatial and temporal extent EX_Extent in section B.3.1 Extent information. The class DQ_Scope uses MD_ScopeCode, EX_Extent and levelDescription to make it possible to exactly describe the data that is intended, the data dictionary is located in section B.2.4.5 Scope information.
TABLE 2.9 METADATA ELEMENTS NEEDED TO DOCUMENT THE SCOPE
Name Definition Data type/Domain Example
MD_Metadata Root entity which defines metadata about a resource or resources
Class
FieldIdentifier Unique identifier for this metadata file
CharacterString def
ParentIdentifier File identifier of the metadata to which this metadata is a subset (child)
CharacterString abc
HierarchyLevel Scope to which the metadata applies
MD_ScopeCode attribute attributeType collectionHardware collectionSession dataset series nonGeographicDataset dimensionGroup feature featureType propertyType fieldSession software service model tile
dataset
HierarchyLevelName Name of the hierarchy levels for which the metadata is provided
CharacterString Transport
MD_DataIdentification
Information required to identify a dataset
Class
Extent Extent information including the bounding box, bounding polygon, vertical and temporal extent of the dataset
EX_Extent Sweden
DQ_Scope Quality information for the data specified by a data quality scope
Class
Level Hierarchical level of the data specified by the scope
MD_ScopeCode attributeType
Extent Information about spatial and temporal extent for the scope
EX_Extent SwedenAnm:As it is the same as in MD_DataIdentification (Table 3.8), it could be omitted
LevelDescription detailed description about the level of the data specified by the scope
MD_ScopeDescriptionName or description depending on what has been given for level
roads
33
2.5.4 Data quality overview elementsThe elements purpose, usage and the maintenance part of lineage are documented together with metadata for data and service identification. The description is found in section B.2.2 Identification information. For purpose and usage the scope is documented by the MD_Metadata entity and it is used to give the maintenance for the entire dataset. For the parts of the dataset with different maintenance it is possible to document one entity for each group that is needed, each with its own scope.
The purpose is defined as an attribute type in the identification part and is documented as text. The description is found in section B.2.2.1 General.
Usage and Maintenance are documented as classes that can be recorded a number of times. The descriptions are found in sections B.2.2.6 Usage information and B.2.5 Maintenance information
Lineage, except maintenance, is documented together with the data quality elements and data quality sub-elements in Data quality information. The description is found in section B.2.4 Data quality information. Lineage shall describe the history of a dataset and is documented with a text and the classes LI_Source and LI_ProcessStep. The description is found in section B.2.4.2 Lineage information. As a minimum a general explanation of the data producer’s knowledge about the lineage of a dataset shall be given as a text in the attribute type statement, and it is possible to document lineage for as many smaller groupings of data that is needed.
2.5.5 Data quality elements and data quality sub-elements The data quality elements are described in the metadata document, but it is the result of the evaluations that are stored, and that data is connected to the sub-elements. It is a class for each of the data quality sub-elements and all of them have the same structure defined by DQ_DataQuality and DQ_Element, see Table 3.8 and the description is found in section B.2.4 Data quality information,B.2.4.1 General and B.2.4.3 Data quality element information.
2.5.6 UsageThe standard shall be used to document the quality requirement and lineage for a dataset and the quality results for the quality evaluation using ISO 19114. The metadata can then be used to discover, retrieve and reuse datasets.
2.6 ISO 19131 Geographic information — Data product specifications
2.6.1 Current statusISO 19131 standard was published in 2007.
2.6.2 Description of contentThe purpose of ISO19131 is to help creators of GI product specifications to structure their documents in a way that is consistent with the other standards of the Geographic Information family. Product specifications are reference documents that state what kinds of geographical phenomena are intended to be covered by the dataset, and how these phenomena are represented. From a quality perspective, specifications play a key role in conveying to all users the universe of discourse that presided to the constitution of the geographical product (See Fig. 2.1). In addition, and more specifically, the specification of how far the data in the product is permitted to depart from the universe of discourse (in other words, the data quality elements and their usual measures).
34
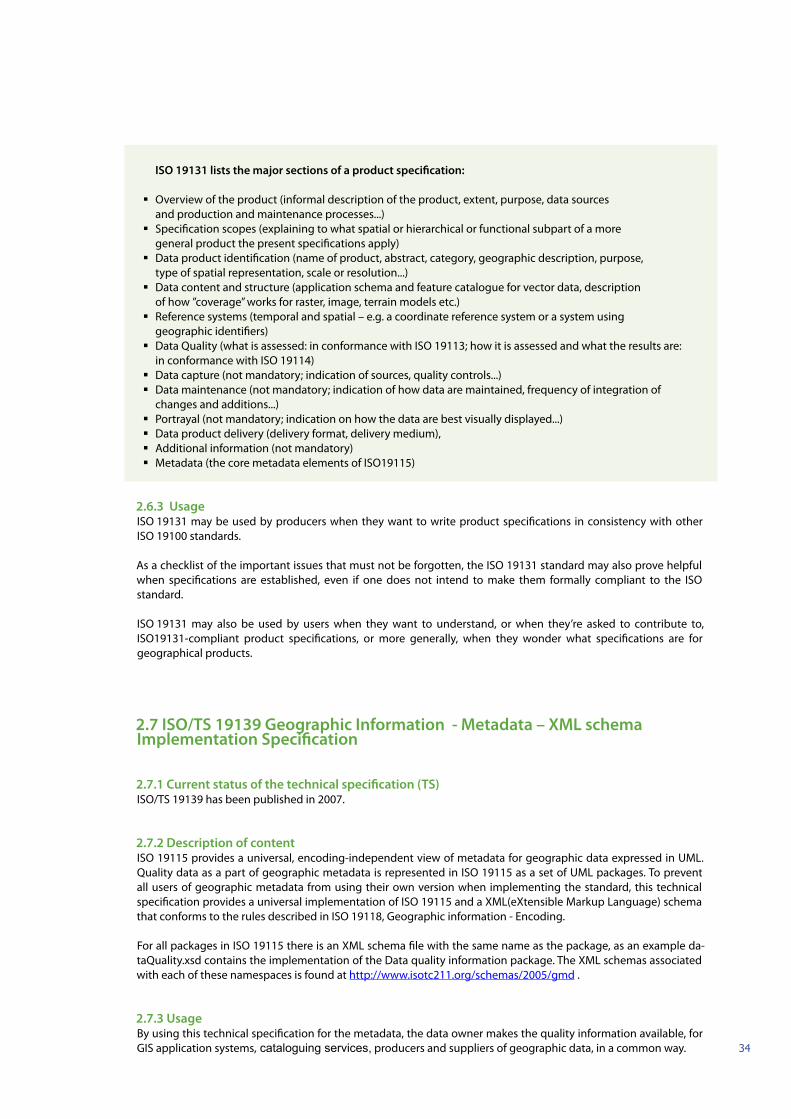
ISO 19131 lists the major sections of a product specification:
Overview of the product (informal description of the product, extent, purpose, data sources and production and maintenance processes...) Specification scopes (explaining to what spatial or hierarchical or functional subpart of a more general product the present specifications apply) Data product identification (name of product, abstract, category, geographic description, purpose, type of spatial representation, scale or resolution...) Data content and structure (application schema and feature catalogue for vector data, description of how ”coverage” works for raster, image, terrain models etc.) Reference systems (temporal and spatial – e.g. a coordinate reference system or a system using geographic identifiers) Data Quality (what is assessed: in conformance with ISO 19113; how it is assessed and what the results are: in conformance with ISO 19114) Data capture (not mandatory; indication of sources, quality controls...) Data maintenance (not mandatory; indication of how data are maintained, frequency of integration of changes and additions...) Portrayal (not mandatory; indication on how the data are best visually displayed...) Data product delivery (delivery format, delivery medium), Additional information (not mandatory) Metadata (the core metadata elements of ISO19115)
2.6.3 UsageISO 19131 may be used by producers when they want to write product specifications in consistency with other ISO 19100 standards.
As a checklist of the important issues that must not be forgotten, the ISO 19131 standard may also prove helpful when specifications are established, even if one does not intend to make them formally compliant to the ISO standard.
ISO 19131 may also be used by users when they want to understand, or when they’re asked to contribute to, ISO19131-compliant product specifications, or more generally, when they wonder what specifications are for geographical products.
2.7 ISO/TS 19139 Geographic Information - Metadata – XML schema Implementation Specification
2.7.1 Current status of the technical specification (TS)ISO/TS 19139 has been published in 2007.
2.7.2 Description of contentISO 19115 provides a universal, encoding-independent view of metadata for geographic data expressed in UML. Quality data as a part of geographic metadata is represented in ISO 19115 as a set of UML packages. To prevent all users of geographic metadata from using their own version when implementing the standard, this technical specification provides a universal implementation of ISO 19115 and a XML(eXtensible Markup Language) schema that conforms to the rules described in ISO 19118, Geographic information - Encoding.
For all packages in ISO 19115 there is an XML schema file with the same name as the package, as an example da-taQuality.xsd contains the implementation of the Data quality information package. The XML schemas associated with each of these namespaces is found at http://www.isotc211.org/schemas/2005/gmd .
2.7.3 UsageBy using this technical specification for the metadata, the data owner makes the quality information available, for GIS application systems, cataloguing services, producers and suppliers of geographic data, in a common way.

35
IMPLEMENTING THE QUALITY STANDARDS AT THE NMCAS
3.1 Identifying Your Needs This chapter can be used to create a position paper for introducing quality based on ISO standards for the manage-ment board of your organization. In Chapter 4 we introduce different strategies, which organizations could utilise to start the implementation process. Position papers should clearly identify the selected strategy. It should be noted that implementation of the standards is a long process and organizations normally have some existing parts. These should be utilized in the process. In general a pilot project that gives a success is a good strategy to follow.
It is very important, when starting to implement the ISO standards, to identify your needs. Customer requirements are in general the most important issue to take into account when you start implementing quality standards. There are several different viewpoints you should consider:
quality requirements (stated or implied) as conformance quality levels cost of quality evaluation reporting quality legal requirements.
Spatial data infrastructures should be taken into account when considering quality implementation. We have discussed this earlier in the Introduction Chapter.
Based on customer and other requirements you should first select a set of quality “elements” and “sub-elements” from the ISO 19113 standards.
Use the standards first not as rules to be followed without question, but as reminders of major issues that have to be tackled. Standards are helpful reminders of what may be desirable in general. Standards will also change over time.
ISO 19100 has been designed as a suite of standards supporting each other. Therefore one standard does not necessarily give the whole picture and may create problems if taken in isolation. These problems may be solved in other standards of the same family. A set of standards is usually needed to understand how to use one standard.
CHA
PTER
3

36
The ISO approach is implementation-oriented therefore it is relatively easy to implement a standard. However, most of the quality standards remain at a rather general descriptive level. Based on your inventory of needs ISO 19131 may be a good starting point to help you start the implementation process.
3.2 Understanding How to Address the Standards The implementation process should follow the normal procedure used internally for project management. You may also see the Expert Group on Quality report on project management13.
Identified methods are:
1. Getting the knowledge/information standards
Directives (INSPIRE) CEN technical report: Geographic Information – Standards, specifications, technical reports and guidelines, required to implement a Spatial Data Infrastructure National recommendations Textbooks (ISO 19100) Standards (ISO 19115, ISO 19114, ISO 19113, ISO 19131, ISO 19138)
2. Find out about success stories.
Some of the current experiences are explained in Chapter 5. ISO Focus group on data providers has produced information on the implementation14. ISO TC 211 also has information/presentations “standards in action”
available on its web pages15. Benchmarking is good way to extract the knowledge from other similar organizations.
3. Assess the benefit of ‘spirit-conformance’ versus ‘letter-conformance’
4. Assess the benefit of effective implementation vs. documented translation of your own activities into the standards’ terms.
13 See Expert Group Publications in http://www.eurogeographics.org/eng/05_quality.asp 14 http://www.isotc211fgdp.info/ 15 http://www.isotc211.org/
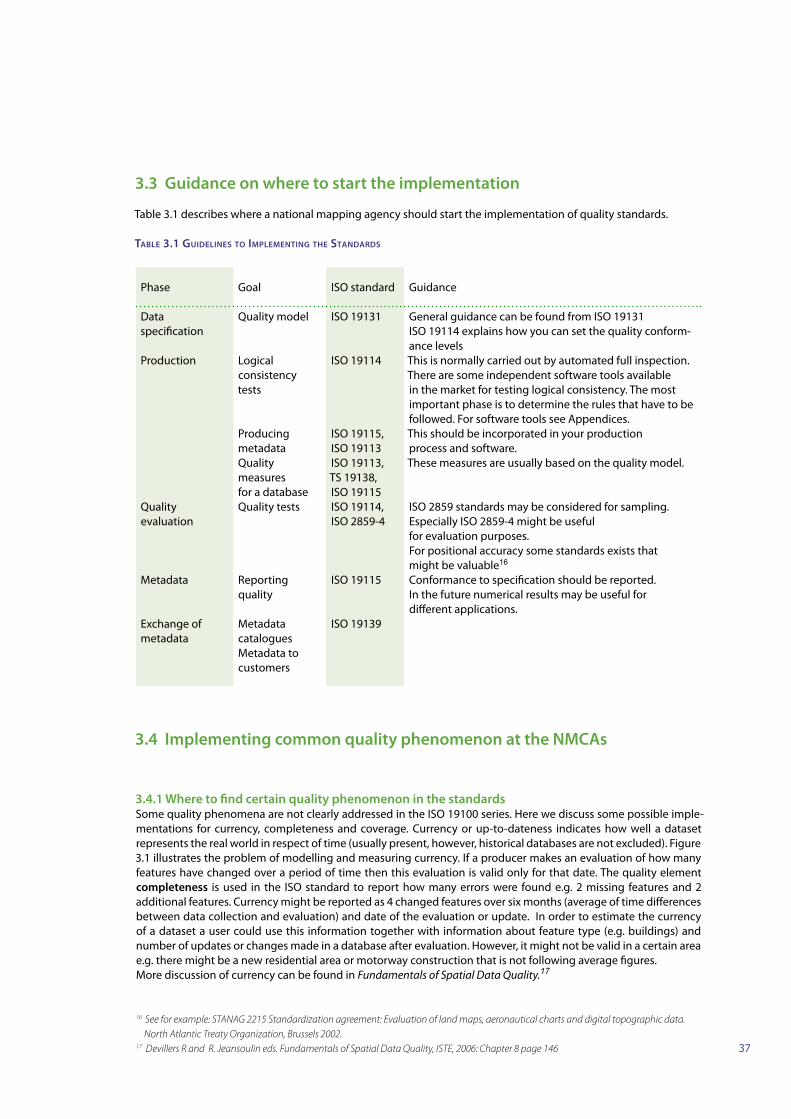
37
3.3 Guidance on where to start the implementation
Table 3.1 describes where a national mapping agency should start the implementation of quality standards.
TABLE 3.1 GUIDELINES TO IMPLEMENTING THE STANDARDS
Phase Goal ISO standard Guidance
Data specification
Quality model ISO 19131 General guidance can be found from ISO 19131ISO 19114 explains how you can set the quality conform-ance levels
Production Logical consistency tests
ISO 19114 This is normally carried out by automated full inspection. There are some independent software tools available in the market for testing logical consistency. The most important phase is to determine the rules that have to be followed. For software tools see Appendices.
Producing metadata
ISO 19115, ISO 19113
This should be incorporated in your production process and software.
Qualitymeasures for a database
ISO 19113, TS 19138, ISO 19115
These measures are usually based on the quality model.
Quality evaluation
Quality tests ISO 19114, ISO 2859-4
ISO 2859 standards may be considered for sampling. Especially ISO 2859-4 might be useful for evaluation purposes.For positional accuracy some standards exists that might be valuable16
Metadata Reporting quality
ISO 19115 Conformance to specification should be reported. In the future numerical results may be useful for different applications.
Exchange of metadata
Metadata cataloguesMetadata to customers
ISO 19139
3.4 Implementing common quality phenomenon at the NMCAs
3.4.1 Where to find certain quality phenomenon in the standardsSome quality phenomena are not clearly addressed in the ISO 19100 series. Here we discuss some possible imple-mentations for currency, completeness and coverage. Currency or up-to-dateness indicates how well a dataset represents the real world in respect of time (usually present, however, historical databases are not excluded). Figure 3.1 illustrates the problem of modelling and measuring currency. If a producer makes an evaluation of how many features have changed over a period of time then this evaluation is valid only for that date. The quality element completeness is used in the ISO standard to report how many errors were found e.g. 2 missing features and 2 additional features. Currency might be reported as 4 changed features over six months (average of time differences between data collection and evaluation) and date of the evaluation or update. In order to estimate the currency of a dataset a user could use this information together with information about feature type (e.g. buildings) and number of updates or changes made in a database after evaluation. However, it might not be valid in a certain area e.g. there might be a new residential area or motorway construction that is not following average figures. More discussion of currency can be found in Fundamentals of Spatial Data Quality.17
16 See for example: STANAG 2215 Standardization agreement: Evaluation of land maps, aeronautical charts and digital topographic data. North Atlantic Treaty Organization, Brussels 2002.
17 Devillers R and R. Jeansoulin eds. Fundamentals of Spatial Data Quality, ISTE, 2006: Chapter 8 page 146
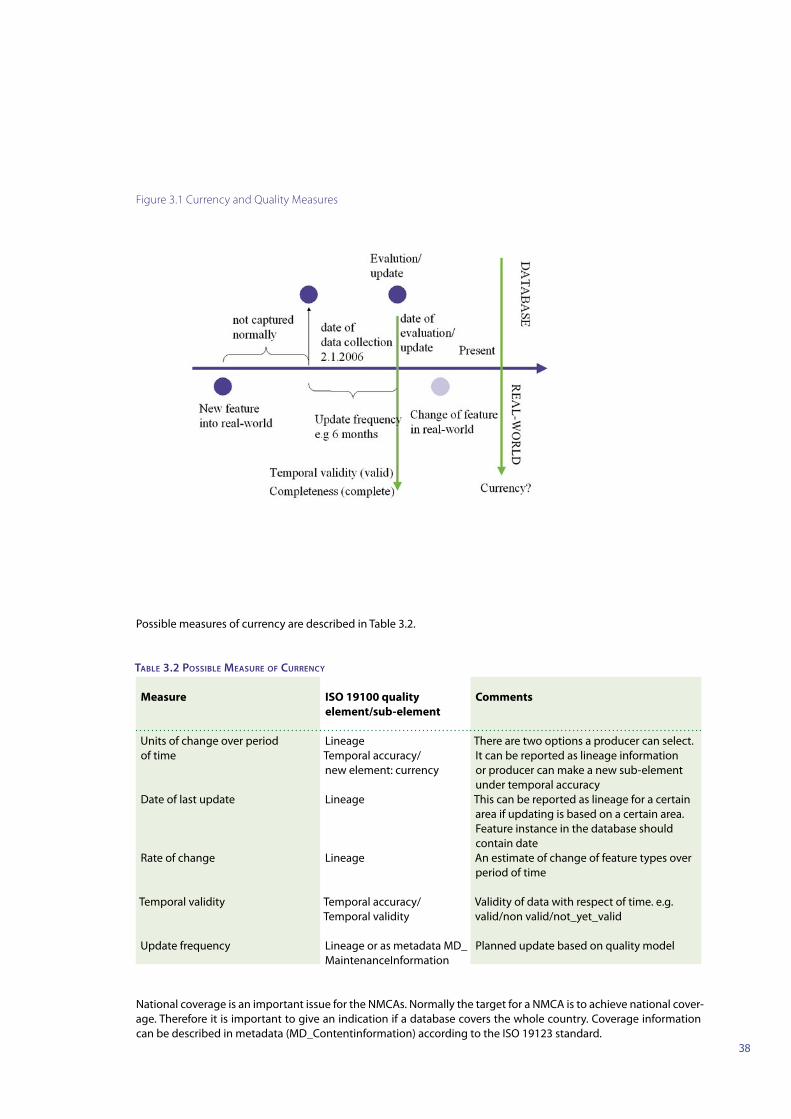
38
Figure 3.1 Currency and Quality Measures
Possible measures of currency are described in Table 3.2.
TABLE 3.2 POSSIBLE MEASURE OF CURRENCY
Measure ISO 19100 quality element/sub-element
Comments
Units of change over period of time
LineageTemporal accuracy/new element: currency
There are two options a producer can select. It can be reported as lineage information or producer can make a new sub-element under temporal accuracy
Date of last update Lineage This can be reported as lineage for a certain area if updating is based on a certain area. Feature instance in the database should contain date
Rate of change Lineage An estimate of change of feature types over period of time
Temporal validity Temporal accuracy/Temporal validity
Validity of data with respect of time. e.g. valid/non valid/not_yet_valid
Update frequency Lineage or as metadata MD_MaintenanceInformation
Planned update based on quality model
National coverage is an important issue for the NMCAs. Normally the target for a NMCA is to achieve national cover-age. Therefore it is important to give an indication if a database covers the whole country. Coverage information can be described in metadata (MD_Contentinformation) according to the ISO 19123 standard.

39
STRATEGIES FOR IMPLEMENTING STANDARDS
4.1 Common profile versus dataset profile Because standards, by definition, are meant to be of general application, they may prove too general for an organi-zation. For example, the organization may not produce all the kinds of geographical products addressed by the standards: the corresponding fields are thus useless for the organization.
Profiling a standard consists of making one’s own generality of the profile, before it is instantiated for application. An organization however cannot do whatever it pleases and pretend it has designed a standard profile.
Notably, concerning the information to be provided (i.e. the “requirements”, in standard terminology), there are mandatory fields and sections in the standards: these cannot be dispensed with in the profile. Conditional fields are obligatory fields, under certain logical conditions. The optional fields can be discarded, when irrelevant, or they can be systematized within the profile, if they are felt to be important for the organization. An organization may also add its own requirements (“additional requirements”), provided this is done with respect to what is allowed by the standards themselves (which usually describe how things may be added).
The resulting decisions make the profile. Also, the explanations for the choices should be documented.
From a management perspective, organizations may follow different strategies for profiling the standards they find relevant.
CHA
PTER
4
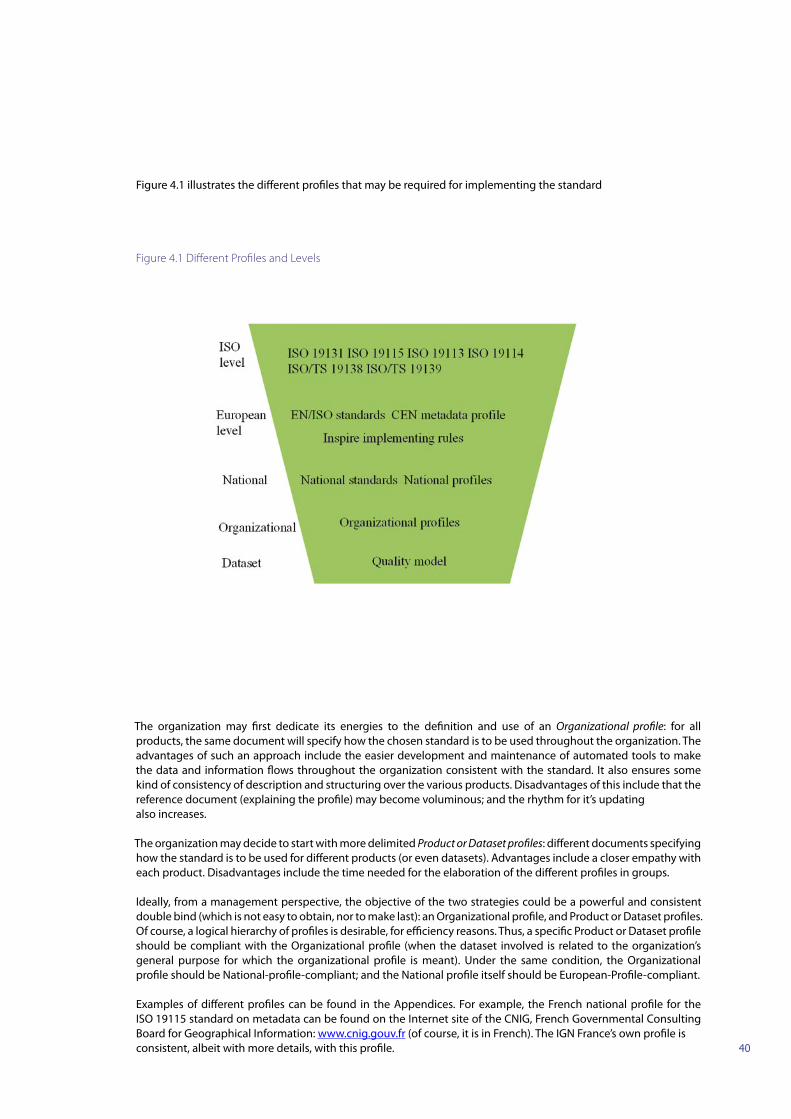
40
Figure 4.1 illustrates the different profiles that may be required for implementing the standard
Figure 4.1 Different Profiles and Levels
The organization may first dedicate its energies to the definition and use of an Organizational profile: for all products, the same document will specify how the chosen standard is to be used throughout the organization. The advantages of such an approach include the easier development and maintenance of automated tools to make the data and information flows throughout the organization consistent with the standard. It also ensures some kind of consistency of description and structuring over the various products. Disadvantages of this include that the reference document (explaining the profile) may become voluminous; and the rhythm for it’s updating also increases.
The organization may decide to start with more delimited Product or Dataset profiles: different documents specifying how the standard is to be used for different products (or even datasets). Advantages include a closer empathy with each product. Disadvantages include the time needed for the elaboration of the different profiles in groups.
Ideally, from a management perspective, the objective of the two strategies could be a powerful and consistent double bind (which is not easy to obtain, nor to make last): an Organizational profile, and Product or Dataset profiles. Of course, a logical hierarchy of profiles is desirable, for efficiency reasons. Thus, a specific Product or Dataset profile should be compliant with the Organizational profile (when the dataset involved is related to the organization’s general purpose for which the organizational profile is meant). Under the same condition, the Organizational profile should be National-profile-compliant; and the National profile itself should be European-Profile-compliant.
Examples of different profiles can be found in the Appendices. For example, the French national profile for the ISO 19115 standard on metadata can be found on the Internet site of the CNIG, French Governmental Consulting Board for Geographical Information: www.cnig.gouv.fr (of course, it is in French). The IGN France’s own profile is consistent, albeit with more details, with this profile.

41
4.2 Quality models for datasets A quality model has two purposes. It should follow the quality related standards and describe how an organization applies quality elements, quality sub-elements and quality measures for a certain dataset. Then it should set the quality requirements for that dataset. At the moment there are some examples of this approach for example in Finland and Sweden but there is no general guidance available in the standards.
Possible content of a quality model could include:
1. Descriptions of quality elements, quality sub-element and quality measures applicable for that dataset
2. Concepts for how quality requirements are set. This includes a methodology for how user requirements are turned into quality requirements. There are several methodologies available for this. One possible methodol-ogy is the Quality Function Deployment (QFD)
3. Setting quality requirements. Usually this should be done at feature level. It might include setting quality levels for a certain geographical areas. For example Quality Level A might indicate that the positional accuracy is higher than in quality level B. Feature types may be classified to different classes based on the ability to identify them in the field. For example man-made features and natural features. Then using these classes each feature type might have different conformance quality levels.
4. Setting the quality evaluation procedures. This includes setting the sampling plans and how rejected samples are treated.
5. Setting the metadata requirements. This includes describing what kind of metadata is produced for the customers.

42
4.3 Communication and Training (internal/external) Communication and training is a very important phase in the implementation of quality standards. Table 4.1 introduces different communication and training needs based on the idea of profiles.
TABLE 4.1 TARGETS FOR COMMUNICATIONS AND TRAINING
Goal Communication Training Role of these Guidelines
Target audience What
Common profiles/models between NMCAs
European Spatial Data Infrastructure
Interoperability between countries
These guidelines can be used in the process of making the profile.
National profile of quality
National Spatial Infrastructure players
Role of quality in reference datasets
People that will make this profile
These guidelines can be used to make a national profile. See also national examples
Students and per-sonnel in the field of geographic information
Basic knowledge of ISO standards and quality
These guidelines can be used in the training process
Organizational profile
Head of the organization
Benefits and cost of organizational profile
People that will make an organizational profile
These guidelines can be used to make a position paper.
Subcontractors How organizational profile will change contractors work
General knowledge of quality standards
Personnel Benefits for their work and how their work will be affected
Use guidelines to make an organizational profile
Dataset profile Department that is responsible for the dataset
Benefits and costs These guidelines can be used to make a dataset profile. Sometimes it is helpful to make a case before making an organiza-tional/national profile
Quality model Same as dataset profileCustomers Improvement of
communication of data quality
Use of data quality measures from the user aspect
Large customer organizations can use these guidelines to verify quality models
4.4 Need for Common EuroGeographics Profiles/Models or European profileThese guidelines can be considered as a starting point for the development of the common EuroGeographics profile and quality model. The Expert Group on Quality has set a target to develop this in the coming years. However this process is iterative. There is a need to have best practices from several countries before a common profile can be developed. These guidelines should help the NMCAs to develop their own quality models.
It is also recognised that the INSPIRE directive and its implementing rules should develop a common European profile. These guidelines can be used also in this process.
43
EXPERIENCES AT THE NMCAS
5.1 Summary of the current experiences
5.1.1 Approaches that NMCAs have adoptedThe approaches included here consist of three Nordic countries (Finland, Sweden and Denmark), the Netherlands, France and Germany.
In Finland the Council for Geoinformation has played a key role in making national profiles from the ISO 19100 standards. There is a national profile of metadata, quality and also a harmonisation profile. The NLS has a long experience with quality and there is a quality model for the topographic and cadastre production.
In IGN France the starting point has been an organization profile of ISO 19131 standard and the product speci-fications for orthophotos, paper base maps and road data. IGN France has produced an organizational profile of metadata and used it for the products mentioned.
In Denmark standardization group has analysed the ISO 19100 standards but lack of resources have stopped the work.
In Netherlands they have used standards in the development of topographic database but until now they have no experience of implementing ISO 19100 series.
In Sweden standardisation work has been organized in connection with the national standardization institute. A group is working to implement a national profile for metadata. There is a national framework for geographic information with Swedish profiles of the standards. There is a proposal for a new quality model for geographic data.
In Germany – as a federal state of 16 Lander – the work is handled by national committee (AdV) representing the federal states and the central government. The AdV has developed a national quality assurance system and there is a national quality model available. Lander and the BKG monitor the logical consistency and carry out the quality evaluation against the reality (phase Q5) and also state the conformity.
CHA
PTER
5

44
5.2 NLS Finland
5.2.1 BackgroundNLS Finland is representing the national standardisation body of Finland in ISO TC 211 and in CEN TC 287. Standardisation of the GI in Finland is based on a national geoinformation strategy, which was published in 2004. National Geoinformation Council (NGC) has started to implement the strategy. National standards will be published as public administration recommendations.
5.2.2 ObjectivesPromotion of geographic infrastructure is one of the tasks of the National Land Survey of Finland. Therefore they are participating in the standardisation work. In the national geoinformation strategy the following goals in standardisation are set:
Common public administration recommendations based on international standards Recommendations which should be followed in all GI-projects under public administration
5.2.3 Methods for implementing
Recommendation on Metadata profile and metadata directoryNational metadata profile has been published as national recommendation for public administration (Publication no. 158). It is generally available for other organizations as well. This profile is used in a forthcoming new metadata directory that will be published in 2007. Information will be available in English, Finnish and Swedish. UML diagrams are also available in the profile.
Recommendation on Quality principles and evaluationNational profile on quality principles and evaluation has been published as a national recommendation for public administration (Publication no. 160). It is available in Finnish
Data quality modelsNational Land Survey of Finland was the first organization to implement a data quality model for the Topographic Database in 1995. Because international standards were not in place at that time it will need to be updated in the future.
5.2.4 Related workThe National geoinformation council has described a harmonisation guideline for the producers of core datasets in Finland “Improving operational efficiency with geographic information, Ministry of Agriculture and Forestry 12a/2006”. It is available both in Finnish and English. This harmonisation guideline includes the following chapters:

45
SECTION I Basis 1. Introduction 1.1 National geographic information strategy objectives for harmonisation 2. Targeted outcome 2.1 Benefits of harmonisation 2.1.1 Integration and improvement of production processes 2.1.2 Making core geographic datasets available for society and commercial applications 2.1.3 Increasing productivity and decreasing costs 2.1.4 Legal basis 2.2 Scenarios 2.2.1 Common building data 2.2.2 Common address data 2.2.3 Common plan data 2.2.4 Common watercourse data 2.2.5 Common land parcel data 2.3 Targeted outcome 2.4 Phases in the realisation of target outcome 2.5 Requirements for harmonisation 3. Interoperability assessment levels 3.1 Interoperability globally 3.2 Europe 3.2.1 European situation 3.2.2 INSPIRE requirements 3.3 National projects 3.4 Regional scope 3.5 Local datasets used as the source for national datasetsSECTION II Technical requirements 4. Definition of harmonisation 5. Harmonisation areas 5.1 Requirements for semantic descriptions 5.1.1 Definition of features 5.1.2 Definition of processes 5.1.3 Definition of user requirements 5.1.4 Unique identification of features 5.1.5 Harmonising the definition of similar or same features between different data producers 5.2 Requirements for modelling and data transfer 5.2.1 Conceptual schema language 5.2.2 Data transfer schema 5.2.3 Data service 5.3. Quality requirements 5.3.1 Common data quality measures (ISO TS 19138) 5.3.2 Defined quality requirements based on customer needs using common data quality measures 5.3.3 Described and measurable quality management process 5.3.4 Datasets are tested by an independent party based on generally approved methods 5.3.5 Auditability of geographic information and production processes 5.3.6 Quality results in metadata 5.3.7 Trackability of geographic information 5.4 Development of legislation and regulationsSECTION III Implementation 6. Measures for the harmonisation of core datasets 6.1 Finnish Council for Geographic Information measures 6.2 Administrative body measures 6.2.1 Harmonisation preparations 6.2.2 Feature-specific harmonisation of core geographic datasets 6.2.3 Implementation of unique identifiers of features 6.2.4 Definition of feature quality requirements 6.2.5 Process standardisation 6.2.6 Definition of geographic information product specifications Annex 1: Projects promoting commonality in Finland and Europe Appendix 2: Concepts

46
5.2.5 Future plansImplementation of the INSPIRE directive is a major challenge in Finland. A new data quality model will be published in 2008-2009 for the Topographic Database.
5.2.4 Experience so farNational Land Survey of Finland has had a quality model since 1995. This model is based on the same concepts that ISO 19113, ISO 19114 describes. Their quality evaluation is based on both internal and external quality evaluation. Experiences have been discussed in a paper by Jakobsson, Marttinen (2003).
Experiences include:
Definition of the sample units is quite complex for the geographic datasets and it becomes more complex in the case where updates are not made based on aerial substitute e.g. This is a case in continuous updating where updating is done feature by feature.
Using a constant amount of features in a selection of sample is suggested. For example a road data is evaluated using this method. It is impossible to separate errors according to production date. Some quality elements may be overlapping each other and sometimes it is difficult to classify errors to the overlapping quality elements. Quality measures are mostly needed when something goes wrong in a process. Normally users don’t care about
quality measures. Quality measures can be seen as insurance to a producer that production has followed specification Normally quality measures that are given to users are not based on a test. Specifications should include a set of
quality indicators that the producer then evaluates after production.
Use of independent geo-audit is one option to ensure that production goals have been met.
5.3 IGN France
5.3.1 BackgroundSince its creation in the 1990’s IGN France has taken part to the CEN TC 211 works on standardisation of Quality of geographic information, now through a specific Standardization Department working mainly for the French Ministry of Defence. In 1997 IGN France wrote and published guidelines on the principles and measurement of quality of vector databases (Bulletin d’information de l’IGN n°67, 1997, “Qualité d’une base de données géographique: concepts et terminologie”, by David Benoît and Pascal Fasquel). These principles have been adopted and followed by IGN France in its production departments for quality controls. Specifications for specifications (i.e. How to write specifications) of paper maps and vector products were designed as early as 1994; fields identified were already akin to the ISO 19131 standard.
In other words, IGN France already had a culture of doing with precise in-house reference documents when standards of the ISO 19100 series came to be published. This background certainly helped IGN France in adopting the standards (it was more a matter of substitution than of revolution). Why adopt standards then? This was prompted by considerations related to general interoperability. It was realised however that, if the use of standards alleviate some conception tasks (the family of standards taking good care of the following question: How can all issues pertaining to geographical information be structured consistently?), it entails other conception issues (e.g. How can current practices be made standards-compliant?). This was tackled by the work reported here, started in 2004.

47
5.3.2 ObjectivesIGN France has started implementing the ISO 19100 series with ISO 19131, which is a “natural” entry point to the standards: both from a pragmatic perspective – since products are already well-defined in precise specifications – and for the familiarization with the standards – since it is a general standard.
In order to identify what the ISO 19131 standard meant for IGN France (technically & linguistically), internal workgroups were constituted, mixing experiences from Producers, Researchers, Sellers, Experts in Web diffusion of GI and Experts from IGN France’s Standardization Department. IGN France’s Quality Management unit organized the meetings.
The practical results of this collaborative work consist of:
1 ISO 19131 profile for IGN France, in French, which closely follows the ISO 19131 standard (it takes however a full 40-page long document to present and explain the choices made for the profile). A few general fields were pre-set (e.g. language in which the specifications are written); some optional fields were discarded as pointless; the possible values for other fields were constrained (e.g. the hierarchical levels for IGN France’s products); a few additional fields were created (e.g. for listing and describing the domain abbreviations used in the specification, or for indicating the tolerance thresholds for data quality). In addition, some organizational solutions were installed (e.g. general glossary, institutional e-mail addresses etc.);
1 analysis document (explaining the choices that were found relevant for IGN France, in French); 3 example specifications (in French, for orthophotos, paper base maps, and road-and street navigation vector product).
In addition to these objective results, beneficial side effects may be listed, such as increased collaborative spirit (for experts brought to work together on other issues), and increased individual competences (the experts discussing and complementing their view points, also possibly discovering the worlds of standards and of XML).
Work has continued with ISO 19115, again in collaborative working groups. The practical results amount to the following:
What the content of the ISO 19115 standard on metadata means for IGN France’s products has been defined (notably, what the general metadata are for IGN France’s products has been identified);
As best-conforming to IGN France’s variety of products and production lines, three levels of metadata have been identified: a) metadata for a product (including, e.g. the quality elements observed on all the datasets making the product), b) metadata for a group of datasets (gathering different datasets meant for one or more products), c) metadata for a dataset. A basic IGN France profile was elaborated as a consequence, distinguishing products from groups of datasets: The ISO 19115-compliant metadata were constituted for the three exemplary products already specified with ISO 19131 (see above); Test XML files were ISO 19139-compliantly structured for the reception of ISO 19115-compliant metadata of
products, groups, and datasets; interfaces were developed; test metadata were captured; life-like issues were thus assessed; Production plans for structured metadata capture were designed, involving: a) Analysis of the specificities of each product (in order to identify the specific data about it that that can be turned into the metadata expected by the profile; b) Analysis of existing production lines (in order to pump up the necessary metadata at the right time); c) Necessary software development; d) Cost analysis of these operations

48
Work on ISO 19115 is continuing, in order to achieve the following:
An IGN France officially validated profile, Guides of the “every day” kind, not of the ISO-expert kind, Metadata severs for different products, XML tools for automated production of brochures (specifications, quality reports, metadata descriptions) from ISO191xx-compliant information files on specifications, metadata and quality.
Also, in the production departments, additional tools are developed to capture the metadata more efficiently during production.
Production of ISO19115-compliant metadata is now expected from the production departments (imagery, vector databases, documentary and databases) and from the (commercial) diffusion departments as well, to make it easier for potential users to access and assess the available data and their quality.
The ISO 19139 standard was followed to structure the XML implementation of the ISO 19115 metadata.
The ISO 19113 was used to make sure that quality principles already followed at IGN France were similar indeed to what the standard requires. The ISO 19114 standard was used to understand how to structure the reporting of quality assessment as components for the more general ISO 19115 metadata and to understand how IGN-F quality reports on datasets and products could be integrated or referred to.
5.3.3 Experiences so far
The major difficulties so far have been met when it came to:
interpret both the English wording and the occasionally ambiguous technical meaning of the terms used in the standards; solve some inconsistencies proper to the standards (e.g. nowhere in the standards is there any place for the
description of specified conformance quality levels, nor of their compulsory – “this threshold will never be passed” – or indicative – “this threshold isn’t usually passed” – status); solve every issue consistently and “quite at the same time” (each standard opening the gates of wide worlds); make current practices and ISO-induced adaptations meet without crushing production departments with the
weight of ISO and XML and such-like UML abstruse and abstract vocabulary and concepts.
The INSPIRE directive, requiring wide-spread diffusion of spatial data and documentation of data through metadata, came as a renewed incentive for adopting the ISO 19115 standard on metadata. It is stimulating both for IGN-F as a producer of spatial data, and for the ministries and their partners in charge of their Institute.
Also, ISO19115-compliant metadata are meant to be at the core of the French “Géoportail” (www.geoportail.fr) opened in 2006 on the Internet, where IGN (and other French geodata producers) basic topographic data and public-service thematic data will be available for users to consult.
49
5.4 KMS Denmark
5.4.1 BackgroundThe initial work was initiated by the board of management in 1998. They formed a standardization group. At the end of 2000 the standardization group decided that they should investigate the use of the upcoming ISO 19100 standards. In 2001 they formed a group of ISO “experts” to do the investigation.
5.4.2 ObjectivesThe aim was to investigate the possibility of using a common standard for describing the data quality of their 3 major datasets. A group of domain experts was later added to the standard experts. The group worked for 5-6 month in 2001. The conclusion of the work was that it was possible to use the standards as a common tool for describing data quality in their datasets. The group made a recommendation paper that was accepted by the standardization group.
The profile
In the group there was a lot of discussion on the following issues:
Should they develop a common profile for KMS Should they develop a profile for each dataset Should they use the full implementation or just a profile that fits the needs at KMS.
The decisions were that they should try to develop a common profile for all 3 datasets. It was accepted by the standardization group. The work on the profile was never initiated because of a reorganization and refinancing process in 2002-2003.Since August 2004 they are starting to try to make a profile of the General Feature Model (GFM) for the cadastral and topographic data models. The lack of resources is at the moment stopping the work from progressing.
5.4.3 Experiences from the CadastreIn 2001 the Cadastre decided to go a bit further than the rest of the organization.
They were interested in a profile for cadastral data and developed a profile that could be used within this area. As a beginning they learnt the ISO standards, by studying literature:
Draft version ISO 19113 & 19114 GIS in Denmark, Balstrøm, Jacobi & Sørensen, 1994 Elements of spatial data quality, Guptill & Morrison, 1995
And getting help from KMS Product development Department.
They also studied information about the Cadastral map:
Guide for making digital Cadastral Maps, 1995. The Cadastral Map, User Guide 1997. Interviewing case officers (living encyclopedias).
After studying the ISO standard and the Cadastral map they filled out tables D1 ISO 19114.

50
Problems that they have encountered during the work:
A lot of resources have to be put into the work. The work has to be supported by the board of management throughout the process. Understanding the ISO standards. Understanding the concepts used. Defining test suits, spatial statistics etc. Sampling methods different in the datasets.
5.4.4 Future plansAt present they are working in many different areas. Both in the Cadastral area and the Topographic area to create new data models where they incorporate the ISO 19100 standards. They are working on a common GFM. Understanding concepts used within the 19100 series. Defining test suits, spatial statistics etc.
19103 Conceptual schema language (technical specification): is already in use, because they have decided to use UML.
ISO 19109: Rules for application schema: There are plans to establish a project to make a profile of the GFM in 19109 (Rules for application schema) and most likely also a standard for feature catalogues and applications schemas according to 19109 and 19110 (Feature cataloguing methodology).
ISO 19113 and 19114: Quality and Quality evaluation was used in the Cadastral area.
ISO 19115 and 19139: Metadata. The goal is to produce a homogenous description of KMS data and implementation has begun. They have created a profile of 19115 to be implemented with a new version of geodata-info (www.geodata-info.dk) in the near future. The XML-schemas of 19139 will be used in the implementation.
ISO 19117 Portrayal. The goal is that all of their products will have a standard layout when they are distributed from KMS in the future.
ISO 19131 Data product specification. It is the intention that all their product specifications will be following a common data product specification in the future.
5.5 TD NetherlandsFor the development of their new product TOP10NL, an object oriented database, they use 19115 to structure their metadata. The deliverance of this new product is in 19136 GML. Other work items from the 19100 series are looked at and they use what is most applicable to their product and customer wishes. Since they now are in a development stadium they do not have experiences so far with the ISO 19100 system.

51
5.6 NLS Sweden
5.6.1 BackgroundIn Sweden the work with standardisation in the area of Geographic Information is organised in a group called Stanli, where both government and private companies work together. It is a part of the Swedish Standards Institute SIS. There are a few persons that work full time in the secretariat. They organize the work and meetings in the working groups. So far NLS Sweden has been involved in all working groups.
When there is a need for a standard or a profile and there are sufficient members willing to take part, a working group is established. At this moment there is a need for a Metadata profile. Therefore a group is established to work out a Swedish profile.
Figure 5.1 Organization of Standardisation in Sweden
The chairman in the Steering Committee comes from the NLS.
A result of the work in Stanli is a GI technical framework, to guide those who develop interfaces for exchanging geographic information. It is based on ISO 19100. The framework consists of:
A handbook Framework standards (ISO 19100 series) Framework standards (Swedish standards) Templates Standard schema files Examples

52
5.6.2 ObjectivesThe overall main goal for the NLS information process is that the data are widely spread and used by many, to be a part of the building of SDI.
To reach that goal, there are two main reasons for producing and implementing standards; to be able to meet customer’s requirements and to make their own information process more effective.
Customers want to be able to combine data from several sources. If every supplier deliver data and metadata in different structure etc. it’s up to the customer to try adjust and change data so it fits together (harmonisation). The customer will also have trouble to know about the quality of the product when metadata are described in different ways.
The other reason is internal. For many years the NLS have been doing most of the production in-house, and they had had no or little use of standards. But now, when they are concentrating on updating and will receive data from different sources, the uses of standards are necessary.
5.6.3 Methods for implementingImplementing Metadata1992 the NLS of Sweden has the responsibility for establishing a national data set catalogue. The catalogue became incomplete, outdated and was based on an old version of European metadata standard.
In 1998 a project was created to create a more modern structure and to adapt to the standard ENV 12657 (CEN). The documents that the project had to consider were:
CEN TC 287 ERV 12657 1998-03. ISO / TC 211 WD15046-15 Geographic information Metadata version 2.0 The OpenGis Specification Model Topic 11: Metadata Version 3.1
In August 1998 the structure in the relational database was adopted to ENV 12657. Some parts of the standard were not used; thesaurus and classification. Ellipsoid, projection, geodetic date and thematic accuracy were not included in the first version.
The manual routines to update the metadata did not function. Due to updating problems the national dataset catalogue (Megi) had to close down.
A large pilot study looked into the need for metadata. Unfortunately the work did not continue, except for that one of the NLS’s metadata system was developed into a web based system (GeoLex).
This system was created before CEN and ISO started work in this area. Therefore this system was built without using any standard. This is available at the NLS’s web. For the moment this site is only available in Swedish.
Some of the NLS’s largest customers, e.g. the military and the Swedish road administration, had a request that standardised metadata should be delivered with geographic information.
To meet that request, a pilot study was started in 2004 to see how NLS could produce, store and deliver metadata according to ISO 19115. It was clear that it would be rather simple to fulfil the minimum (core) demands in the standard. In that pilot study it was described how metadata for the Topographic map could be delivered using the XML schema in ISO 19139.
The NLS is planning to develop and implement a new system for metadata. It is going to start with analyses of the processes involved. They are going to use as much as possible from ISO 19100 with help of the GI technical framework. At the national level a profile of 19115 will be created, see chapter “Forum for standardisation”.
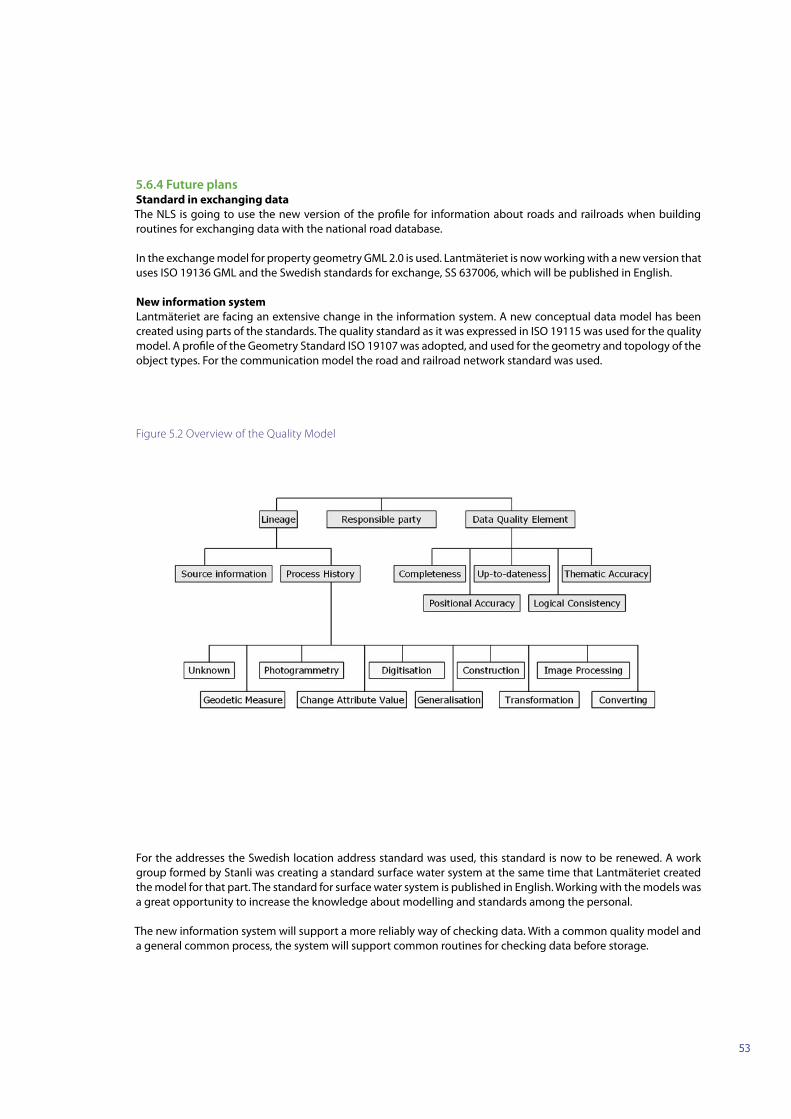
53
5.6.4 Future plansStandard in exchanging dataThe NLS is going to use the new version of the profile for information about roads and railroads when building routines for exchanging data with the national road database.
In the exchange model for property geometry GML 2.0 is used. Lantmäteriet is now working with a new version that uses ISO 19136 GML and the Swedish standards for exchange, SS 637006, which will be published in English.
New information systemLantmäteriet are facing an extensive change in the information system. A new conceptual data model has been created using parts of the standards. The quality standard as it was expressed in ISO 19115 was used for the quality model. A profile of the Geometry Standard ISO 19107 was adopted, and used for the geometry and topology of the object types. For the communication model the road and railroad network standard was used.
Figure 5.2 Overview of the Quality Model
For the addresses the Swedish location address standard was used, this standard is now to be renewed. A work group formed by Stanli was creating a standard surface water system at the same time that Lantmäteriet created the model for that part. The standard for surface water system is published in English. Working with the models was a great opportunity to increase the knowledge about modelling and standards among the personal.
The new information system will support a more reliably way of checking data. With a common quality model and a general common process, the system will support common routines for checking data before storage.

54
Figure 5.3 Checking Quality of Data from Different Sources
5.6.5 Experience so farMost people who use geographic data understand the profit with using standards, but few organisations implement standards, the NLS included.
The experience the NLS has so far has come from people who have been involved in producing standards. They are specialists in modelling and are accustomed to the ISO “language” but those who are specialist in the actual production have not been involved. This has created a gap between the knowledge about standards and knowledge about how to use (implement) the standards.
If you haven’t been involved in creating a standard it is hard to read and understand how to use standards,it is not just about the fact that it is written in a foreign language.
To fill the gap between standardisation specialists and productions specialist it is important to have seminars and other kind of forums to educate and increase the knowledge about implementing standards.
It is important that there are people in an organisation that have competence both in standards and in the daily work in the processes. These persons are used as a link between the standards and the process experts.
To improve the information provision process, a major project is ongoing. One main objective is to make the exchange of data, national and international, more efficient. In that project working with standards has been a natural part. This has been possible with help from people with competence both in standards and processes.
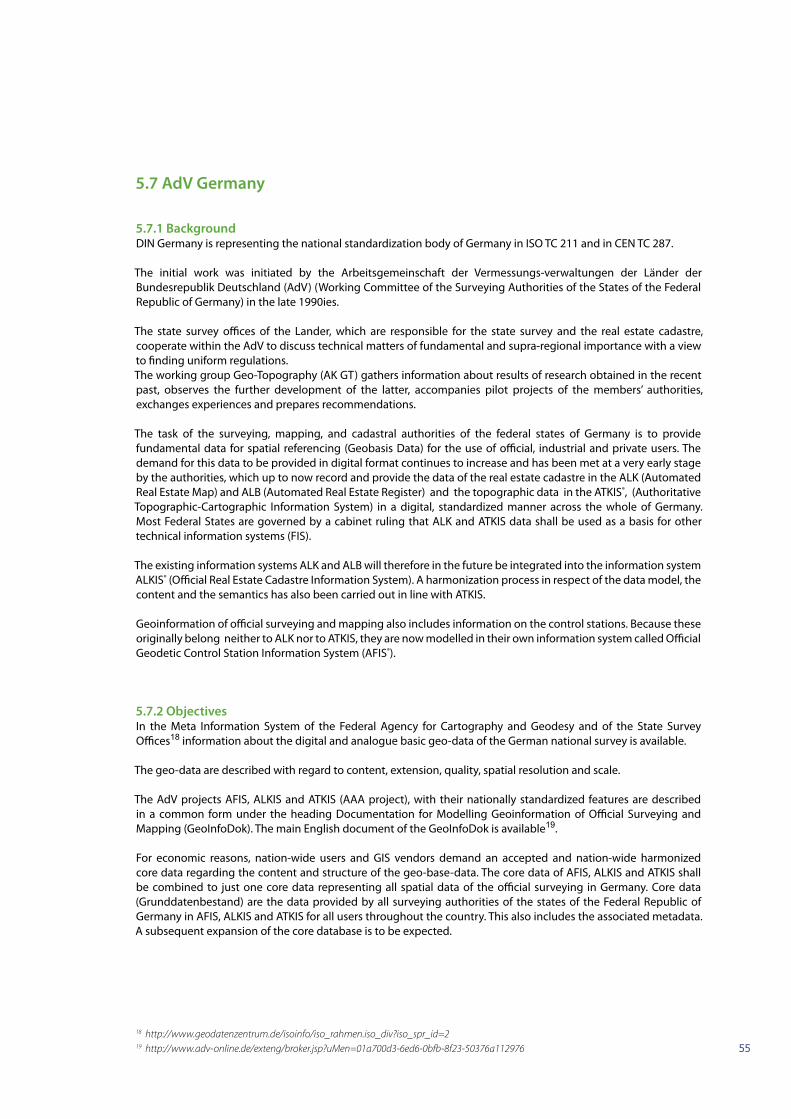
55
5.7 AdV Germany
5.7.1 BackgroundDIN Germany is representing the national standardization body of Germany in ISO TC 211 and in CEN TC 287.
The initial work was initiated by the Arbeitsgemeinschaft der Vermessungs-verwaltungen der Länder der Bundesrepublik Deutschland (AdV) (Working Committee of the Surveying Authorities of the States of the Federal Republic of Germany) in the late 1990ies.
The state survey offices of the Lander, which are responsible for the state survey and the real estate cadastre, cooperate within the AdV to discuss technical matters of fundamental and supra-regional importance with a view to finding uniform regulations. The working group Geo-Topography (AK GT) gathers information about results of research obtained in the recent past, observes the further development of the latter, accompanies pilot projects of the members’ authorities, exchanges experiences and prepares recommendations.
The task of the surveying, mapping, and cadastral authorities of the federal states of Germany is to provide fundamental data for spatial referencing (Geobasis Data) for the use of official, industrial and private users. The demand for this data to be provided in digital format continues to increase and has been met at a very early stage by the authorities, which up to now record and provide the data of the real estate cadastre in the ALK (Automated Real Estate Map) and ALB (Automated Real Estate Register) and the topographic data in the ATKIS®, (Authoritative Topographic-Cartographic Information System) in a digital, standardized manner across the whole of Germany. Most Federal States are governed by a cabinet ruling that ALK and ATKIS data shall be used as a basis for other technical information systems (FIS).
The existing information systems ALK and ALB will therefore in the future be integrated into the information system ALKIS® (Official Real Estate Cadastre Information System). A harmonization process in respect of the data model, the content and the semantics has also been carried out in line with ATKIS.
Geoinformation of official surveying and mapping also includes information on the control stations. Because these originally belong neither to ALK nor to ATKIS, they are now modelled in their own information system called Official Geodetic Control Station Information System (AFIS®).
5.7.2 ObjectivesIn the Meta Information System of the Federal Agency for Cartography and Geodesy and of the State Survey Offices18 information about the digital and analogue basic geo-data of the German national survey is available.
The geo-data are described with regard to content, extension, quality, spatial resolution and scale.
The AdV projects AFIS, ALKIS and ATKIS (AAA project), with their nationally standardized features are described in a common form under the heading Documentation for Modelling Geoinformation of Official Surveying and Mapping (GeoInfoDok). The main English document of the GeoInfoDok is available19.
For economic reasons, nation-wide users and GIS vendors demand an accepted and nation-wide harmonized core data regarding the content and structure of the geo-base-data. The core data of AFIS, ALKIS and ATKIS shall be combined to just one core data representing all spatial data of the official surveying in Germany. Core data (Grunddatenbestand) are the data provided by all surveying authorities of the states of the Federal Republic of Germany in AFIS, ALKIS and ATKIS for all users throughout the country. This also includes the associated metadata. A subsequent expansion of the core database is to be expected.
18 http://www.geodatenzentrum.de/isoinfo/iso_rahmen.iso_div?iso_spr_id=219 http://www.adv-online.de/exteng/broker.jsp?uMen=01a700d3-6ed6-0bfb-8f23-50376a112976

56
A concept for versioning features is being introduced in connection with the description of the procedure for user-specific updating of secondary databases (NBA - Nutzerbezogene Bestandsdatenaktualisierung). States that use history management within the meaning of the stage solution defined by the AdV for ALKIS base their modelling and the functionalities of a history management precisely on this application schema expanded by the version concept. For ATKIS, a periodical storing of the whole data inventories is considered adequate and sufficient.
A fundamental procedure in the form of a stage concept is proposed for the migration from established inventories. The details of the migration concept shall be defined specifically for each state. A re-migration into the interfaces of the previous systems for an interim supply of data to the users would be practicable for a prolonged transitional period.
In the qualification process, the digital, object-structured collection data are transferred to updating data following qualification. This is a method of quality assurance and ensures that the updating data satisfies the quality requirements. The target data of the qualification process are the updating data.
5.7.3 Future quality assurance
AdV quality assurance systemThe AdV has agreed the following key points of the quality assurance system for the geodata of official surveying and mapping:
Through national regulation, designation and descriptive, quantitative quality features, the AdV identifies and guarantees the quality of the geotopograpical and real-estate descriptive products of official surveying and mapping. National topicality, uniformity, completeness and availability of the products are essential character-istics in this regard. The surveying authorities guarantee compliance with AdV product quality by standardised test procedures and declare conformity with the AdV standards.
The objective is a comprehensive quality assurance for the geodata of official surveying and mapping as a result of the conception and production process. The conception (AAA-basic schema, AAA-technical schema) is task of the state communities represented by the AdV, during which production of the data inventories in harmony with the AAA-application schema is the task of the surveying authority of each individual state.
Quality assurance modelThe relationship structure of the aspects to be quality tested is shown in the following quality assurance model for the AAA-application schema:
Figure 5.4 The Quality Assurance Model of the AFIS-ALKIS-ATKIS Project

57
Q1 measures the AAA basic schema against the strategic and technical stipulations of the AdV, Q2 measures the AAA technical schema against the technical stipulations of the AdV. Q3 determines whether the AAA technical schema corresponds to the regulations of the AAA basic schema. Q1, Q2 and Q3 verify the conceptional, internal quality.
Q4 verifies the geobasis database internally as a product for logical agreement with the AAA application schema and compliance with the defined quality specifications, while Q5 compares the geodatabase externally with the real world. Q6 relates the quality of the NAS to the user.
Table 5.1 describes the quality testing schema applied.
TABLE 5.1 QUALITY TESTING SCHEMA
AdV States
1. AdV regulations and standards for the development of procedures and program systemsQuality assurance of the AAA-basic schema against stipulations of the AdV (Q1) X
Quality assurance of the common AAA-technical schema against the technical stipulations of the AdV (Q2)
X
Quality assurance of the common AAA-technical schema against the AAA-basic schema (Q3)
X
Quality assurance of data inventories (ALKIS/ATKIS/AFIS) against the common AAA-application schema (Q4)
X
Quality assurance of the exchange data against NAS (Q6) Fundamental principles
X
2. Stipulations for AdV product qualityStipulation of descriptive and evaluating quality features for unified products including topicality, uniformity, completeness and availability
X
3. Stipulations for quality assurance of the primary database dataQuality assurance of the primary database data against technical reality (Q5) X
4. Quality assurance (as part of quality management)Conformity declaration by the surveying authority X
The quality assurance principles for Q6 assume that when data is submitted from AFIS/ALKIS/ATKIS, the created NAS files do not have to be checked against the model. The model-compliant implementation must guarantee this using the valid XML schema files (XSD); interoperability must be guaranteed. Data acceptance is part of the qualification process. For this purpose, appropriate test tools must be provided which ensure the required quality of the accepted data by using the currently applicable XML schema files (XSD). The testing of exchange data against the NAS-schema is differentiated between testing for good shape of the XML-file and testing forvalidity of the XML-file.
Systems and recording of quality assuranceOn the basis of ISO 19105 Geographic Information - Conformance and testing, abstract test suites (ATS) are to be formulated and used to examine conformity. Each AAA-quality criteria can then be analysed and recorded according to the following schema:
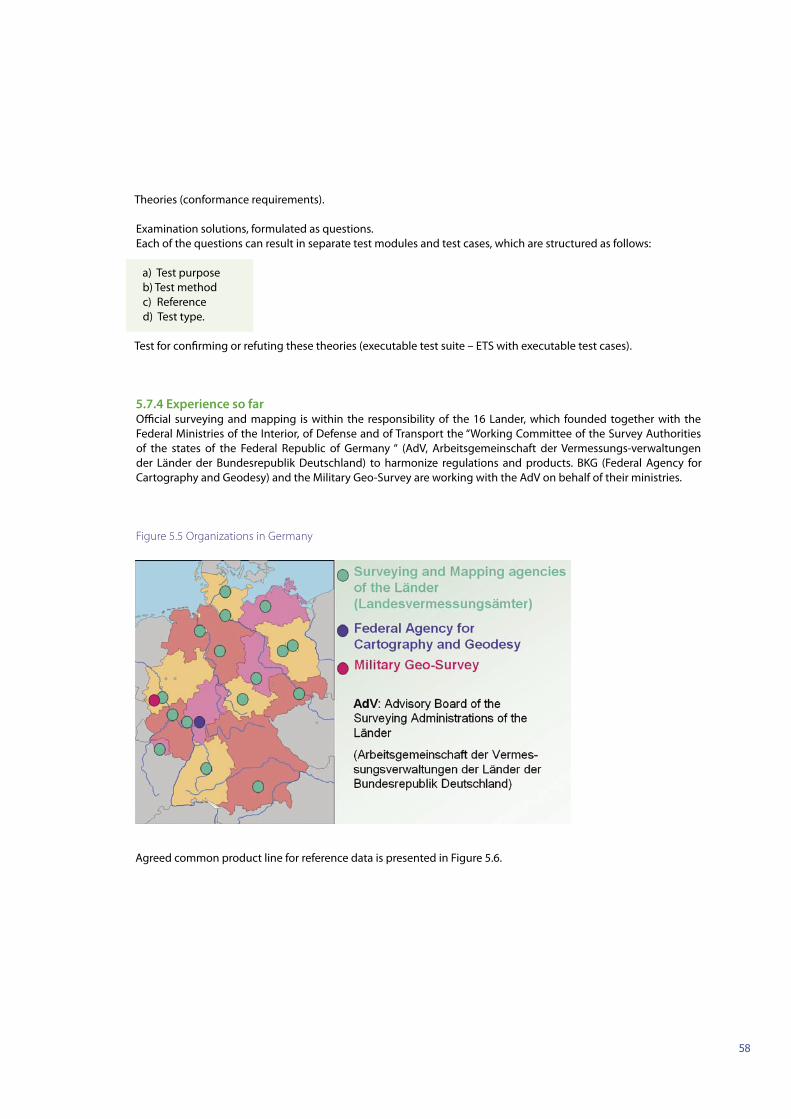
58
Theories (conformance requirements).
Examination solutions, formulated as questions. Each of the questions can result in separate test modules and test cases, which are structured as follows:
a) Test purposeb) Test methodc) Referenced) Test type.
Test for confirming or refuting these theories (executable test suite – ETS with executable test cases).
5.7.4 Experience so farOfficial surveying and mapping is within the responsibility of the 16 Lander, which founded together with the Federal Ministries of the Interior, of Defense and of Transport the “Working Committee of the Survey Authorities of the states of the Federal Republic of Germany “ (AdV, Arbeitsgemeinschaft der Vermessungs-verwaltungen der Länder der Bundesrepublik Deutschland) to harmonize regulations and products. BKG (Federal Agency for Cartography and Geodesy) and the Military Geo-Survey are working with the AdV on behalf of their ministries.
Figure 5.5 Organizations in Germany
Agreed common product line for reference data is presented in Figure 5.6.

59
Figure 5.6 Agreed Common Product Line of Reference Data
The surveying and mapping authorities of the Lander (Landesvermessungsämter, LVA) are responsible for production and quality of large scale products while BKG is responsible for small scales (1: 200.000 and less).
In 1996 the Lander and BKG agreed to establish the GeoDatenZentrum (Geodata Centre, GDZ) at the BKG branch office at Leipzig to provide reference data to federal organizations and to supply private customers with geodata for cross-Applications-applications. Quality control is one step within the workflow at GDZ, which is supported by a data base system (based on Oracle):
Figure 5.7 Process of Quality in GDZ
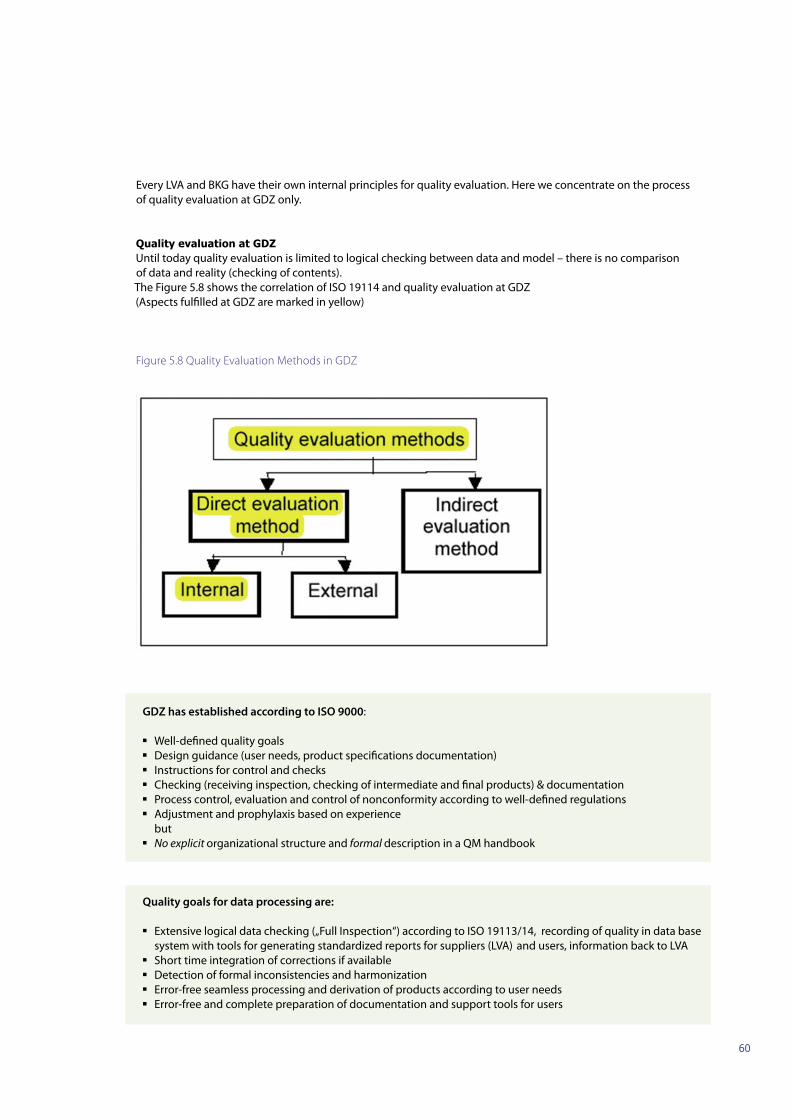
60
Every LVA and BKG have their own internal principles for quality evaluation. Here we concentrate on the process of quality evaluation at GDZ only.
Quality evaluation at GDZUntil today quality evaluation is limited to logical checking between data and model – there is no comparison of data and reality (checking of contents).The Figure 5.8 shows the correlation of ISO 19114 and quality evaluation at GDZ (Aspects fulfilled at GDZ are marked in yellow)
Figure 5.8 Quality Evaluation Methods in GDZ
GDZ has established according to ISO 9000:
Well-defined quality goals Design guidance (user needs, product specifications documentation) Instructions for control and checks Checking (receiving inspection, checking of intermediate and final products) & documentation Process control, evaluation and control of nonconformity according to well-defined regulations Adjustment and prophylaxis based on experience but No explicit organizational structure and formal description in a QM handbook
Quality goals for data processing are:
Extensive logical data checking („Full Inspection“) according to ISO 19113/14, recording of quality in data base system with tools for generating standardized reports for suppliers (LVA) and users, information back to LVA
Short time integration of corrections if available Detection of formal inconsistencies and harmonization Error-free seamless processing and derivation of products according to user needs Error-free and complete preparation of documentation and support tools for users

61
Quality checking of the BaseDLM:
Logical tests of about 40 aspects Records of the test with summarized error information and detailed error descriptions Graphical documentation of special problem areas Correction by LVA within the next update cycle
Figure 5.9 Quality Checking According to ISO 19113 at GDZ

62
APPENDICES
Some example documents that are available:
National profiles
Name of the document (in English and national languages)
Purpose Relevant ISO standards
Responsible organization Link to the publication
GeoinfoDok (Germany)
General document on modelling the core datasets. Quality is part of the document
ISO 19100 series
AdV http://www.adv-online.de/exteng/broker.jsp?uMen=01a700d3-6ed6-0bfb-8f23-50376a112976
National recommenda-tion on quality (Finland)
Profile of ISO 19113, ISO 19114, ISO 19138
ISO 19113, ISO 19114, ISO 19138
JUHTA (advisory board for public administration recommendations)Document has been produces by the national geoinformation council
Available in Finnish onlyhttp://www.jhs-suositukset.fi/suomi/jhs160
National meta-data profile
Profile of ISO 19115
ISO 19115 JUHTA Available in Finnish onlyhttp://www.jhs-suositukset.fi/suomi/jhs158
National meta-data profile in France
GI Interoperability at a European level
ISO 19115 CNIG www.cnig.gouv.fr
Improving operational efficiency with geographic information (Finland)
Practical guidelines for the harmonisa-tion of core geographic datasets
ISO 19100 series
National geoinformation council
http://www.mmm.fi/attachments/5eWDNtABr/5mfRbNB7P/Files/CurrentFile/MMM_12a_06_net.pdf

63
Organizational/Domain profiles
Name of the document (in English and national languages)
Purpose Relevant ISO standards
Responsible organization
Link to the publication
EuroRoadS Quality documentation: D2.4 Quality Management Concept
Quality manage-ment of Road Data
ISO 9000 EuroRoadS project
http://www.euroroads.org/php/Reports/D2.4%20Quality%20management_FD0.1.pdf
D2.3 Probabilistic model to de-scribe and evalu-ate information quality
A probabilistic model to describe and evaluate quality of geoinformation within data providing processes
None EuroRoadS project
http://www.euroroads.org/php/Reports/D2.3.pdf
ISO 19131 profile for IGN (France)
Profile ISO 19131 IGN See table below.
ISO 19115 profile for IGN
Profile ISO 19115 IGN See table below.
Meant as examples of IGN France’s organizational profiles, the following tables are extracted from IGN’s ISO 19131 and ISO 19115 standards.

64
Extract from IGN France’s ISO 19131 profile (2004)
2.5.3. MaintenanceDescription de la périodicité de maintenance du produit (champ « resourceMaintenance » de la Table 2.5). Elle cor-respond à l’ensemble MD_MaintenanceInformation de la norme 19115. L’identifiant est «{PRODUIT_EE-RR}.resource-Maintenance_i» :
Nom Définition Utilisation dans le profil
maintenanceAndUpdateFrequency
Fréquence de mise à jour du produit
- continual (MaintFreqCd001)- daily (MaintFreqCd002)- weekly (MaintFreqCd003)- fornightly (MaintFreqCd004)- monthly (MaintFreqCd005)- quartely (MaintFreqCd006)- biannually (MaintFreqCd007)- annually (MaintFreqCd008)- asNeeded (MaintFreqCd009)- irregular (MaintFreqCd010)- notPlanned (MaintFreqCd011)- unknown (MaintFreqCd012)- pluriannually (propre IGN)Pour un produit externe, il s’agit de la fréquence du produit interne qui à partir duquel il est constitué.
dateOfNextUpdate Date de la prochaine mise à jour Non utilisé
userDefinedMaintenanceFrequency
Période ou durée de la mainte-nance
Non utilisé
updateScope Portée de la maintenance du produit
Non utilisé
updateScopeDescription* Information sur la portée de la maintenance du produit
Non utilisé
maintenanceNote* Information sur la maintenance du produit
Si fréquence variable ou si besoin.
contact* Identification des personnes et organisations associées à la maintenance du produit
Non utilisé
Table 2.5.3. MD_MaintenanceInformation

65
Extract from IGN France’s ISO 19115 profile (2005)
2.7. QualitéInformation sur la qualité de l’agrégat (champ « dataQualityInfo » de la Table 2). Il correspond à l’ensemble DQ_DataQuality de la norme 19115 :
Nom Définition Utilisation dans le profil
scope Données tests sur lesquelles s’applique les informations
Cf. Table 2.7.1
report* Date de la prochaine mise à jour Cf. Table 2.7.2
lineage Information sur la généalogie Référence aux informations sur la généalogiedu produit :{PRODUIT_EE-RR}.lineageou Cf. Table 2.7.3
Table 2.6. DQ_DataQuality
Nom Définition Utilisation dans le profil
level Domaine des données tests - attribute (ScopeCd001)- attributeType (ScopeCd002)- collectionSession (ScopeCd004)- dataset (ScopeCd005)- series (ScopeCd006)- feature (ScopeCd009)- featureSession (ScopeCd010) ) La valeur collectionSession doit apparaître une fois et une seule
extent Étendue des données tests Non utilisé
levelDescription* Description détaillée des données sur lesquelles le critère s’applique
Au choix :- Identifiant de l’attribut- Identifiant de la classe/relation- Identifiant du lot de données- Autre (e. g., échantillon de 80km2 pris sur les zones de raccord de bloc)
Table 2.7.1. DQ_Scope
2.7.1. Données testInformation sur les données tests pour la qualité de l’agrégat (champ « scope » de la Table 2.7). Il correspond à l’ensemble DQ_Scope de la norme 19115 :
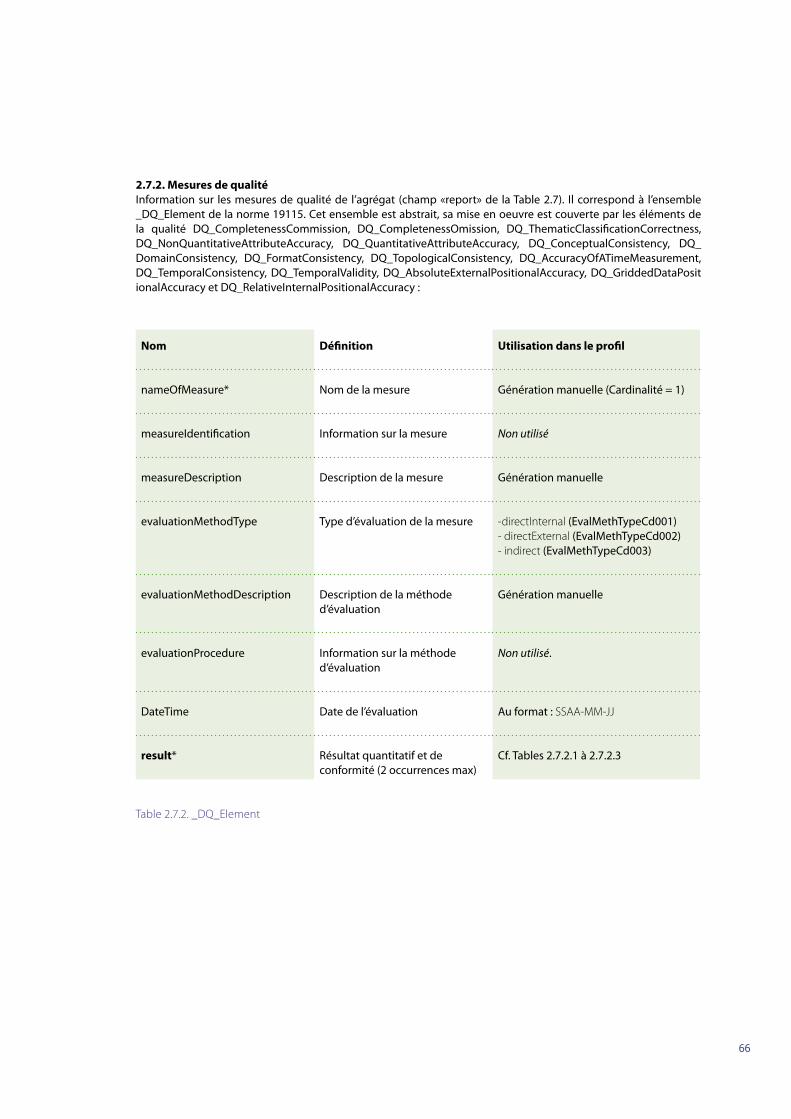
66
Nom Définition Utilisation dans le profil
nameOfMeasure* Nom de la mesure Génération manuelle (Cardinalité = 1)
measureIdentification Information sur la mesure Non utilisé
measureDescription Description de la mesure Génération manuelle
evaluationMethodType Type d’évaluation de la mesure -directInternal (EvalMethTypeCd001)- directExternal (EvalMethTypeCd002)- indirect (EvalMethTypeCd003)
evaluationMethodDescription Description de la méthode d’évaluation
Génération manuelle
evaluationProcedure Information sur la méthode d’évaluation
Non utilisé.
DateTime Date de l’évaluation Au format : SSAA-MM-JJ
result* Résultat quantitatif et de conformité (2 occurrences max)
Cf. Tables 2.7.2.1 à 2.7.2.3
Table 2.7.2. _DQ_Element
2.7.2. Mesures de qualitéInformation sur les mesures de qualité de l’agrégat (champ «report» de la Table 2.7). Il correspond à l’ensemble _DQ_Element de la norme 19115. Cet ensemble est abstrait, sa mise en oeuvre est couverte par les éléments de la qualité DQ_CompletenessCommission, DQ_CompletenessOmission, DQ_ThematicClassificationCorrectness, DQ_NonQuantitativeAttributeAccuracy, DQ_QuantitativeAttributeAccuracy, DQ_ConceptualConsistency, DQ_DomainConsistency, DQ_FormatConsistency, DQ_TopologicalConsistency, DQ_AccuracyOfATimeMeasurement, DQ_TemporalConsistency, DQ_TemporalValidity, DQ_AbsoluteExternalPositionalAccuracy, DQ_GriddedDataPositionalAccuracy et DQ_RelativeInternalPositionalAccuracy :
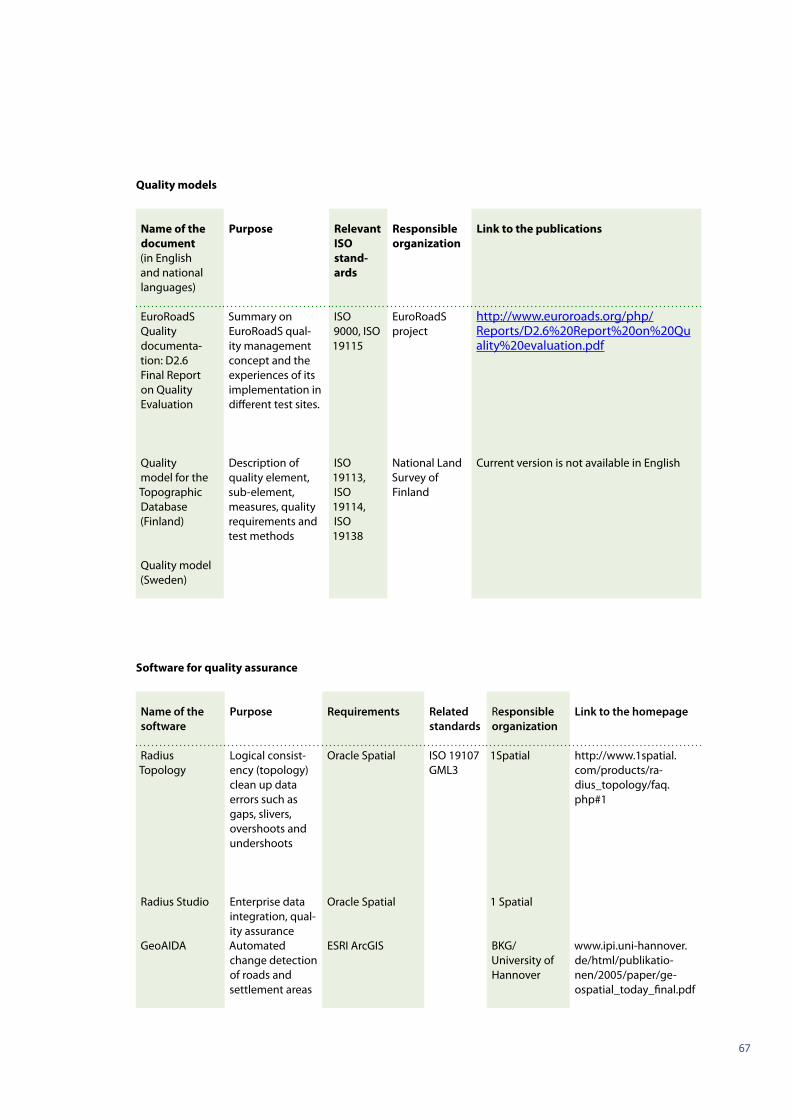
67
Quality models
Name of the document (in English and national languages)
Purpose Relevant ISO stand-ards
Responsible organization
Link to the publications
EuroRoadS Quality documenta-tion: D2.6 Final Report on Quality Evaluation
Summary on EuroRoadS qual-ity management concept and the experiences of its implementation in different test sites.
ISO 9000, ISO 19115
EuroRoadS project
http://www.euroroads.org/php/Reports/D2.6%20Report%20on%20Quality%20evaluation.pdf
Quality model for the Topographic Database (Finland)
Description of quality element, sub-element, measures, quality requirements and test methods
ISO 19113, ISO 19114,ISO 19138
National Land Survey of Finland
Current version is not available in English
Quality model (Sweden)
Software for quality assurance
Name of the software
Purpose Requirements Related standards
Responsible organization
Link to the homepage
Radius Topology
Logical consist-ency (topology)clean up data errors such as gaps, slivers, overshoots and undershoots
Oracle Spatial ISO 19107GML3
1Spatial http://www.1spatial.com/products/ra-dius_topology/faq.php#1
Radius Studio Enterprise data integration, qual-ity assurance
Oracle Spatial 1 Spatial
GeoAIDA Automated change detection of roads and settlement areas
ESRI ArcGIS BKG/University of Hannover
www.ipi.uni-hannover.de/html/publikatio-nen/2005/paper/ge-ospatial_today_final.pdf

68
(Footnotes)
1 www.eurogeographics.org/eng/documents/Report_ISO_final.doc
2 http://www.gsdi.org/docs2004/Cookbook/cookbookV2.0.pdf
3 Preliminary Results of Survey on Data Providers. ISO TC 211 Focus Group on Data Providers, http://www.isotc211fgdp.info/
4 See presentation “Auditing Spatial Data Suitability for Specific Applications: Professional and Technological issues at http://www.eurogeographics.org/eng/05_quality_meetings_Feb06.asp
5 See http://www.opengeospatial.org/projects/groups/dqwg
6 See doctoral dissertation of Jakobsson http://lib.tkk.fi/Diss/2006/isbn9512282062/
7 See presentation “Quality accreditation “A Journey Towards Perfection” at http://www.eurogeographics.org/eng/05_quality_meetings_Feb06.asp
8 See Quality Management Guidelines of the Expert Group on Quality
9 At the moment no international standard of quality accreditation in geographic information is available. National example can be used from Great Britain.
10 See document D2.3 Probabilistic model to describe and evaluate information quality. http://www.euroroads.org/php/Reports/D2.3.pdf. It should be noted that this procedure is applicable only to a situation where reliability of a certain process is the main concern.
11 See Benchmarking report on generalization, Expert Group on Quality, 2005 http://www.eurogeographics.org/eng/documents/Benchmarking_FR-2004_ver_09.doc
12 Usually the revision is expected after 5 years.
13 See Expert Group Publications in http://www.eurogeographics.org/eng/05_quality.asp
14 http://www.isotc211fgdp.info/
15 http://www.isotc211.org/
16 See for example: STANAG 2215 Standardization agreement: Evaluation of land maps, aeronautical charts and digital topographic data. North Atlantic Treaty Organization, Brussels 2002.
17 Devillers R and R. Jeansoulin eds. Fundamentals of Spatial Data Quality, ISTE, 2006: Chapter 8 page 146
18 http://www.geodatenzentrum.de/isoinfo/iso_rahmen.iso_div?iso_spr_id=2
19 http://www.adv-online.de/exteng/broker.jsp?uMen=01a700d3-6ed6-0bfb-8f23-50376a112976