Guideline report interpretation
10
www. epilog .care
-
Upload
epilog -
Category
Health & Medicine
-
view
10 -
download
0
Transcript of Guideline report interpretation

w w w . e p i l o g . c a r e

Spike cluster 43D source localization of the average and single spikes
© Epilog 2017, All rights reserved
PATIENT ID
F04025D05D7BEEG
# electrodes: 30
date: 17-Apr-2015 15:41:59
duration: 57.5476 hours
# spikes: 117
# spike clusters: 4
montage: recorded
reference: common average
MRI
type: 3T 3D GR\IR
date: 29-Apr-2015
Spike max: Fp2
#spikes: 17
Similarity: 32%
AVERAGE
SINGLES
Source intensity:
MaxMin
Examples of single spikes
similarity: 87 82 79 69 51 51 51 49 49 40
6 / 7
Spike cluster 33D source localization of the average and single spikes
© Epilog 2017, All rights reserved
PATIENT ID
F04025D05D7BEEG
# electrodes: 30
date: 17-Apr-2015 15:41:59
duration: 57.5476 hours
# spikes: 117
# spike clusters: 4
montage: recorded
reference: common average
MRI
type: 3T 3D GR\IR
date: 29-Apr-2015
Spike max: F8
#spikes: 26
Similarity: 66%
AVERAGE
SINGLES
Source intensity:
MaxMin
Examples of single spikes
similarity: 94 89 88 88 88 87 86 84 84 84
5 / 7
Spike cluster 23D source localization of the average and single spikes
© Epilog 2017, All rights reserved
PATIENT ID
F04025D05D7BEEG
# electrodes: 30
date: 17-Apr-2015 15:41:59
duration: 57.5476 hours
# spikes: 117
# spike clusters: 4
montage: recorded
reference: common average
MRI
type: 3T 3D GR\IR
date: 29-Apr-2015
Spike max: T4
#spikes: 35
Similarity: 68%
AVERAGE
SINGLES
Source intensity:
MaxMin
Examples of single spikes
similarity: 96 94 94 94 93 91 90 88 87 85
4 / 7
PATIENT ID
F04025D05D7BEEG
# electrodes: 30
date: 17-Apr-2015 15:41:59
duration: 57.5476 hours
# spikes: 117
# spike clusters: 4
montage: recorded
reference: common average
MRI
type: 3T 3D GR\IR
date: 29-Apr-2015
Patient specific head model
air WM GM CSF skull scalp elec
1. the report does not constitute medical advice 2. the report can not be used as the sole basis for deciding the epileptogenic focus3. the decision to localize the epileptogenic focus can only be made by the treating physician
© Epilog NV, All rights reserved
Adress: AA Tower
Technologiepark 19
9052 Ghent, Belgium
Product: ESI presurgical
Version: EpiSpi v1.0
Made: Wed Jan 04 2017
7 / 7
Detected Spike ClustersAverage spike of the detected clusters and corresponding 2D topography at the peak
© Epilog 2017, All rights reserved
PATIENT ID
F04025D05D7BEEG
# electrodes: 30
date: 17-Apr-2015 15:41:59
duration: 57.5476 hours
# spikes: 117
# spike clusters: 4
montage: recorded
reference: common average
MRI
type: 3T 3D GR\IR
date: 29-Apr-2015
Spike max: F8
#spikes: 26
Spike similarity: 66%
Spike max: Fp2
#spikes: 17
Spike similarity: 32%
Spike LateralizationAt which electrodes most spikes were
detected
Spike TimingTiming of the detected spikes
2 / 7
Spike cluster 13D source localization of the average and single spikes
© Epilog 2017, All rights reserved
PATIENT ID
F04025D05D7BEEG
# electrodes: 30
date: 17-Apr-2015 15:41:59
duration: 57.5476 hours
# spikes: 117
# spike clusters: 4
montage: recorded
reference: common average
MRI
type: 3T 3D GR\IR
date: 29-Apr-2015
Spike max: T3
#spikes: 39
Similarity: 49%
AVERAGE
SINGLES
Source intensity:
MaxMin
Examples of single spikes
similarity: 94 89 88 88 87 87 83 80 79 78
3 / 7
Detected Spike ClustersAverage spike of the detected clusters and corresponding 2D topography at the peak
© Epilog 2017, All rights reserved
PATIENT ID
F04025D05D7BEEG
# electrodes: 30
date: 17-Apr-2015 15:41:59
duration: 57.5476 hours
# spikes: 117
# spike clusters: 4
montage: recorded
reference: common average
MRI
type: 3T 3D GR\IR
date: 29-Apr-2015
Spike max: T3
#spikes: 39
Spike similarity: 49%
Spike max: T4
#spikes: 35
Spike similarity: 68%
Spike LateralizationAt which electrodes most spikes were
detected
Spike TimingTiming of the detected spikes
1 / 7
Overview
The first pages give an overview of the spike clusters that have been detected, the
lateralization of these clusters and at what time during the recording the spikes were detected.
Two spike clusters are shown per page, and each
cluster is color coded. This color is used throughout the report to denote this cluster.
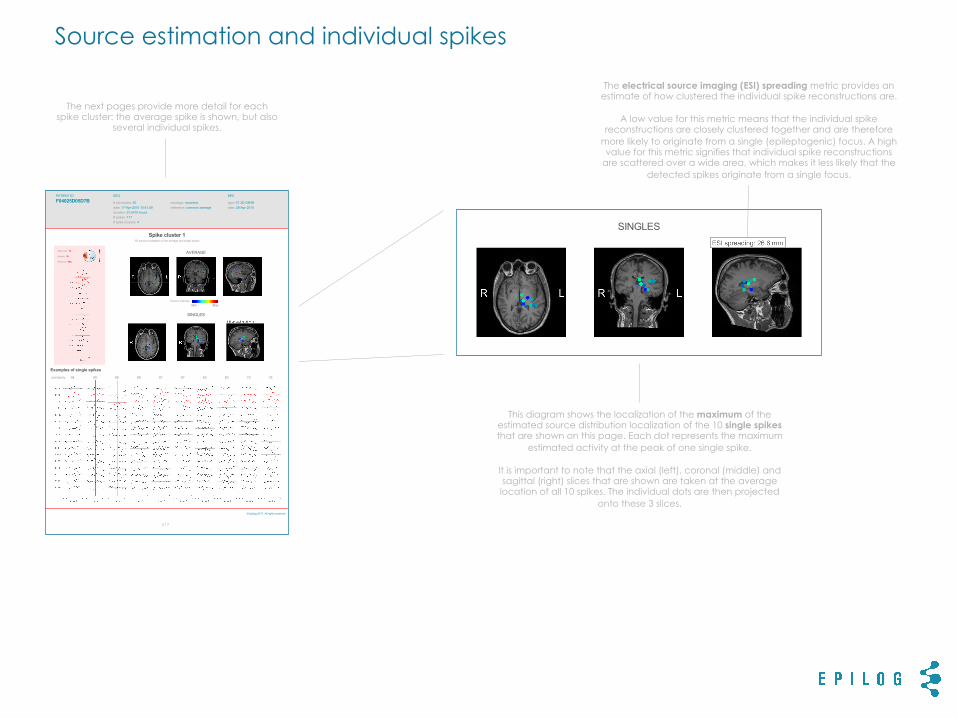
The next pages provide more detail for each spike cluster: the average spike is shown, but also
several individual spikes.
The source estimation (spike localization) is shown for the average spike as well as for the depicted
individual spikes.
The last page provides information on the patient-specific head model that was used to
perform source estimation.

Detected Spike ClustersAverage spike of the detected clusters and corresponding 2D topography at the peak
© Epilog 2017, All rights reserved
PATIENT ID
F04025D05D7BEEG
# electrodes: 30
date: 17-Apr-2015 15:41:59
duration: 57.5476 hours
# spikes: 117
# spike clusters: 4
montage: recorded
reference: common average
MRI
type: 3T 3D GR\IR
date: 29-Apr-2015
Spike max: T3
#spikes: 39
Spike similarity: 49%
Spike max: T4
#spikes: 35
Spike similarity: 68%
Spike LateralizationAt which electrodes most spikes were
detected
Spike TimingTiming of the detected spikes
1 / 7
Header
The report header is shown on each page and contains information on patient identification
and on the uploaded data.
Detected Spike ClustersAverage spike of the detected clusters and corresponding 2D topography at the peak
© Epilog 2017, All rights reserved
PATIENT ID
F04025D05D7BEEG
# electrodes: 30
date: 17-Apr-2015 15:41:59
duration: 57.5476 hours
# spikes: 117
# spike clusters: 4
montage: recorded
reference: common average
MRI
type: 3T 3D GR\IR
date: 29-Apr-2015
Spike max: T3
#spikes: 39
Spike similarity: 49%
Spike max: T4
#spikes: 35
Spike similarity: 68%
Spike LateralizationAt which electrodes most spikes were
detected
Spike TimingTiming of the detected spikes
1 / 7
The patient ID corresponds to the ID that was entered
at data upload.
For the MRI that was uploaded, the type of image
(T1/T2) and the date of acquisition is shown.
The number of electrodes used for EEG recording, the
date of acquisition and total duration are shown.
The header also shows the total number of spikes that was
detected in the recording, and the number of spike clusters
these spikes were grouped into.

Detected Spike ClustersAverage spike of the detected clusters and corresponding 2D topography at the peak
© Epilog 2017, All rights reserved
PATIENT ID
F04025D05D7BEEG
# electrodes: 30
date: 17-Apr-2015 15:41:59
duration: 57.5476 hours
# spikes: 117
# spike clusters: 4
montage: recorded
reference: common average
MRI
type: 3T 3D GR\IR
date: 29-Apr-2015
Spike max: T3
#spikes: 39
Spike similarity: 49%
Spike max: T4
#spikes: 35
Spike similarity: 68%
Spike LateralizationAt which electrodes most spikes were
detected
Spike TimingTiming of the detected spikes
1 / 7
Average spike, lateralization and timing
The first pages give an overview of the spike clusters that have been detected, the
lateralization of these clusters and at what time during the recording the spikes were detected.
It is important to note that only the spike clusters
with more than 15 spikes detected per cluster are reported.
The average spike is obtained by taking the
average of all single spikes that were detected for this spike cluster. The average
recoding is shown from 0.5s before to 0.5s after the spike
maximum
Averaging is done by first aligning the maximum (peak) of all individual
spikes and taking the sum of all recordings.
Averaging increases the
signal-to-noise ratio of the data, which yields a more
accurate source estimation.
Epilog automatically clusters individual spikes that have
comparable morphology into spike clusters. These spike
clusters are determined by the electrode at which the
(average) spike is maximal.
The number of spikes detected in this cluster is shown, as well
as the spike similarity – this is a measure of how well the
individual spikes compare to the average spike.
Each cluster is color coded, and this color code is used
further throughout the report.
The voltage map depicts the voltage of the average spike at the spike maximum.
This map shows the
calculated scalp voltages for the average spike. It
does not give an estimation of where the spike
originated within the brain, i.e. it does not include any
source estimation.

Detected Spike ClustersAverage spike of the detected clusters and corresponding 2D topography at the peak
© Epilog 2017, All rights reserved
PATIENT ID
F04025D05D7BEEG
# electrodes: 30
date: 17-Apr-2015 15:41:59
duration: 57.5476 hours
# spikes: 117
# spike clusters: 4
montage: recorded
reference: common average
MRI
type: 3T 3D GR\IR
date: 29-Apr-2015
Spike max: T3
#spikes: 39
Spike similarity: 49%
Spike max: T4
#spikes: 35
Spike similarity: 68%
Spike LateralizationAt which electrodes most spikes were
detected
Spike TimingTiming of the detected spikes
1 / 7
Average spike, lateralization and timing
The first pages give an overview of the spike clusters that have been detected, the
lateralization of these clusters and at what time during the recording the spikes were detected.
The lateralization diagram gives an overview of the electrodes where spike clusters were
detected. All detected spike clusters are shown with their color code - not only the two clusters of
which the details are shown on the page.
The size of the discs is correlated to the number of spikes that were detected for each cluster. This
diagram is generated solely based on scalp recordings. It does not include any information on
where the spikes originated in the brain, i.e. no source estimation.
These histograms give information about when individual spikes were detected during the recording. The size of each histogram bar is
correlated to the number of individual spikes detected during that period of time. All detected spike clusters are shown – not only the two clusters
of which the details are shown on this page.
This information can be correlated to clinical information from the recording. For example,
more spikes of certain clusters may have appeared after reduction of anti-epileptic drug
dose.

Spike cluster 13D source localization of the average and single spikes
© Epilog 2017, All rights reserved
PATIENT ID
F04025D05D7BEEG
# electrodes: 30
date: 17-Apr-2015 15:41:59
duration: 57.5476 hours
# spikes: 117
# spike clusters: 4
montage: recorded
reference: common average
MRI
type: 3T 3D GR\IR
date: 29-Apr-2015
Spike max: T3
#spikes: 39
Similarity: 49%
AVERAGE
SINGLES
Source intensity:
MaxMin
Examples of single spikes
similarity: 94 89 88 88 87 87 83 80 79 78
3 / 7
Source estimation and individual spikes
The next pages provide more detail for each spike cluster: the average spike is shown, but also
several individual spikes.
The source estimation of the average spike provides the best estimate of the location within the brain where this spike cluster
originates. The advantage of performing source estimation on the average spike lies in its high signal-to-noise ratio. An axial (left),
coronal (middle) and sagittal (right) slice is shown at the maximum of the source distribution.
It is obtained by using the patient-specific head model in an
iterative algorithm to estimate the origin of an epileptic discharge within the brain that would cause the measured voltage
distribution on the scalp.
The source intensity color map shows the distribution of the source estimate within the brain. A high source intensity (red) means there
is a large probability that this is where the epileptic discharge originated. A low source intensity (blue) means the opposite.
Spike cluster 13D source localization of the average and single spikes
© Epilog 2017, All rights reserved
PATIENT ID
F04025D05D7BEEG
# electrodes: 30
date: 17-Apr-2015 15:41:59
duration: 57.5476 hours
# spikes: 117
# spike clusters: 4
montage: recorded
reference: common average
MRI
type: 3T 3D GR\IR
date: 29-Apr-2015
Spike max: T3
#spikes: 39
Similarity: 49%
AVERAGE
SINGLES
Source intensity:
MaxMin
Examples of single spikes
similarity: 94 89 88 88 87 87 83 80 79 78
3 / 7
Source estimation and individual spikes
The next pages provide more detail for each spike cluster: the average spike is shown, but also
several individual spikes.
For each individual spike the EEG recording is shown from 0.5s before to 0.5s after the spike peak. This allows interpretation of the
morphology of the individual spikes and how they relate to the background rhythm. These individual spike examples are used to
assess whether or not the proposed spike cluster indeed correlates to epileptic activity.
It is important to note that the spike detector may yield false
positives: normal variants (e.g. breach rhythms) or artefacts (e.g. electrode pop) can rarely be detected as epileptic activity. If
visual inspection reveals that all individual spikes are false positives, this should be taken into account for final interpretation.
Spike cluster 13D source localization of the average and single spikes
© Epilog 2017, All rights reserved
PATIENT ID
F04025D05D7BEEG
# electrodes: 30
date: 17-Apr-2015 15:41:59
duration: 57.5476 hours
# spikes: 117
# spike clusters: 4
montage: recorded
reference: common average
MRI
type: 3T 3D GR\IR
date: 29-Apr-2015
Spike max: T3
#spikes: 39
Similarity: 49%
AVERAGE
SINGLES
Source intensity:
MaxMin
Examples of single spikes
similarity: 94 89 88 88 87 87 83 80 79 78
3 / 7
For each spike cluster, 10 individual spikes are shown. For this, the individual spikes with the highest similarity are selected. These are
the individual spikes that have a morphology that is most comparable to the average spike.
Spike cluster 13D source localization of the average and single spikes
© Epilog 2017, All rights reserved
PATIENT ID
F04025D05D7BEEG
# electrodes: 30
date: 17-Apr-2015 15:41:59
duration: 57.5476 hours
# spikes: 117
# spike clusters: 4
montage: recorded
reference: common average
MRI
type: 3T 3D GR\IR
date: 29-Apr-2015
Spike max: T3
#spikes: 39
Similarity: 49%
AVERAGE
SINGLES
Source intensity:
MaxMin
Examples of single spikes
similarity: 94 89 88 88 87 87 83 80 79 78
3 / 7
Source estimation and individual spikes
The next pages provide more detail for each spike cluster: the average spike is shown, but also
several individual spikes.
This diagram shows the localization of the maximum of the estimated source distribution localization of the 10 single spikes that are shown on this page. Each dot represents the maximum
estimated activity at the peak of one single spike.
It is important to note that the axial (left), coronal (middle) and sagittal (right) slices that are shown are taken at the average location of all 10 spikes. The individual dots are then projected
onto these 3 slices.
Spike cluster 13D source localization of the average and single spikes
© Epilog 2017, All rights reserved
PATIENT ID
F04025D05D7BEEG
# electrodes: 30
date: 17-Apr-2015 15:41:59
duration: 57.5476 hours
# spikes: 117
# spike clusters: 4
montage: recorded
reference: common average
MRI
type: 3T 3D GR\IR
date: 29-Apr-2015
Spike max: T3
#spikes: 39
Similarity: 49%
AVERAGE
SINGLES
Source intensity:
MaxMin
Examples of single spikes
similarity: 94 89 88 88 87 87 83 80 79 78
3 / 7
The electrical source imaging (ESI) spreading metric provides an estimate of how clustered the individual spike reconstructions are.
A low value for this metric means that the individual spike
reconstructions are closely clustered together and are therefore more likely to originate from a single (epileptogenic) focus. A high value for this metric signifies that individual spike reconstructions
are scattered over a wide area, which makes it less likely that the detected spikes originate from a single focus.

PATIENT ID
F04025D05D7BEEG
# electrodes: 30
date: 17-Apr-2015 15:41:59
duration: 57.5476 hours
# spikes: 117
# spike clusters: 4
montage: recorded
reference: common average
MRI
type: 3T 3D GR\IR
date: 29-Apr-2015
Patient specific head model
air WM GM CSF skull scalp elec
1. the report does not constitute medical advice 2. the report can not be used as the sole basis for deciding the epileptogenic focus3. the decision to localize the epileptogenic focus can only be made by the treating physician
© Epilog NV, All rights reserved
Adress: AA Tower
Technologiepark 19
9052 Ghent, Belgium
Product: ESI presurgical
Version: EpiSpi v1.0
Made: Wed Jan 04 2017
7 / 7
Patient-specific head model
The last page provides information on the patient-specific head model that was used to
perform source estimation.
Axial (left) and coronal (right) slices through the brain allow the reader to assess the quality of the patient-specific head model. It
allows verification of the accuracy of the segmentation into different tissue types, and whether anatomical abnormalities (e.g.
lesions) are correctly represented in the head model.
The legend shows the color codes for the six different tissue types that are used to construct the head model.

PATIENT ID
F04025D05D7BEEG
# electrodes: 30
date: 17-Apr-2015 15:41:59
duration: 57.5476 hours
# spikes: 117
# spike clusters: 4
montage: recorded
reference: common average
MRI
type: 3T 3D GR\IR
date: 29-Apr-2015
Patient specific head model
air WM GM CSF skull scalp elec
1. the report does not constitute medical advice 2. the report can not be used as the sole basis for deciding the epileptogenic focus3. the decision to localize the epileptogenic focus can only be made by the treating physician
© Epilog NV, All rights reserved
Adress: AA Tower
Technologiepark 19
9052 Ghent, Belgium
Product: ESI presurgical
Version: EpiSpi v1.0
Made: Wed Jan 04 2017
7 / 7
Patient-specific head model
The last page provides information on the patient-specific head model that was used to
perform source estimation.
This 3-dimensional rendering of the head of the patient shows where the electrodes (blue dots) were positioned for the source
estimation.


![Final Interpretation Report of the PHEBUS test FPT0 · Therefore, in this final interpretation report specific tests results of the intermediate interpretation report [2] are re-discussed](https://static.fdocuments.in/doc/165x107/5f96e7037195673ef75374d9/final-interpretation-report-of-the-phebus-test-fpt0-therefore-in-this-final-interpretation.jpg)