Guided Performance Analysis with NVIDIA Visual...
32
Guided Performance Analysis with the NVIDIA Visual Profiler
Transcript of Guided Performance Analysis with NVIDIA Visual...

Guided Performance Analysis with the NVIDIA Visual Profiler

Identifying Performance Opportunities
NVIDIA® Nsight™ Eclipse Edition (nsight)
NVIDIA® Visual Profiler (nvvp)
nvprof command-line profiler

Guided Performance Analysis
NEW in 5.5 Step-by-step optimization guidance
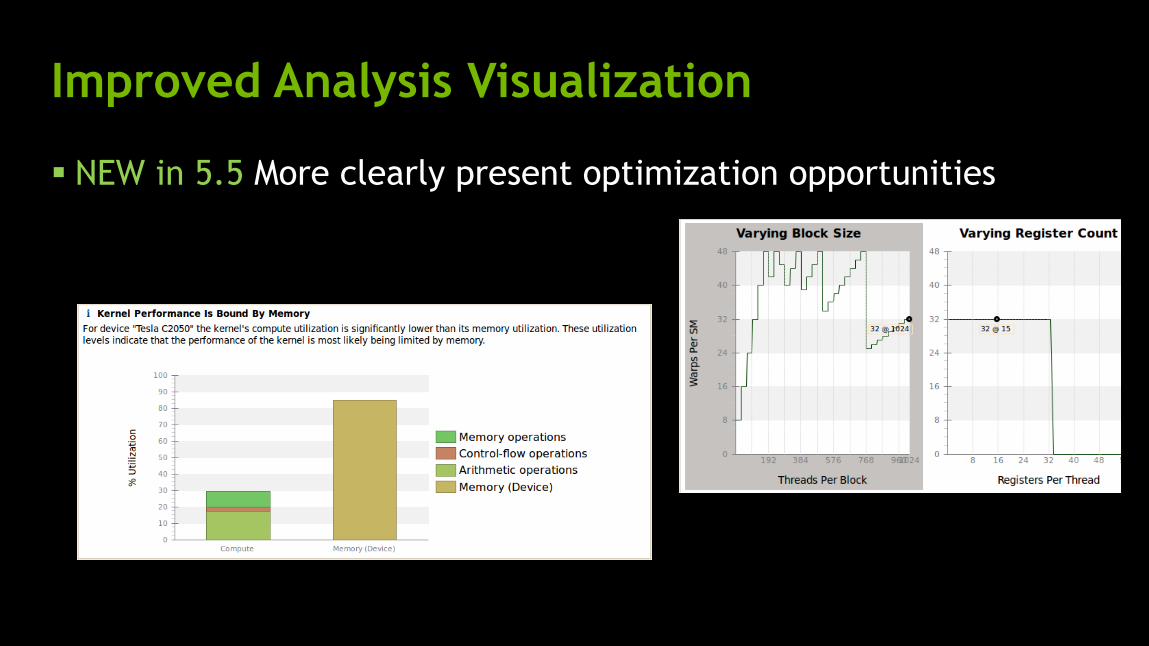
Improved Analysis Visualization
NEW in 5.5 More clearly present optimization opportunities
Demo - Analysis Introduction

Guided Analysis: Kernel Optimization
Overall application optimization strategy
— Based on identifying primary performance limiter
Common optimization opportunities
How to use CUDA profiling tools
— Execute optimization strategy
— Identify optimization opportunities
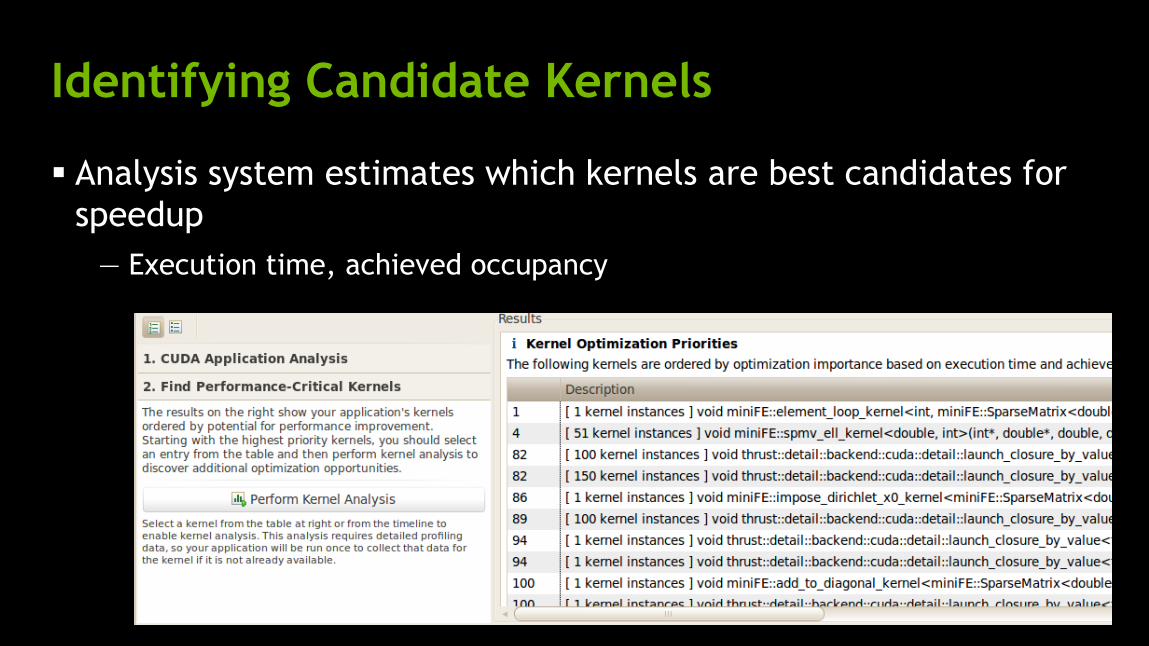
Identifying Candidate Kernels
Analysis system estimates which kernels are best candidates for
speedup
— Execution time, achieved occupancy

Primary Performance Limiter
Most likely limiter to performance for a kernel
— Memory bandwidth
— Compute resources
— Instruction and memory latency
Primary limiter should be addressed first
Often beneficial to examine secondary limiter as well
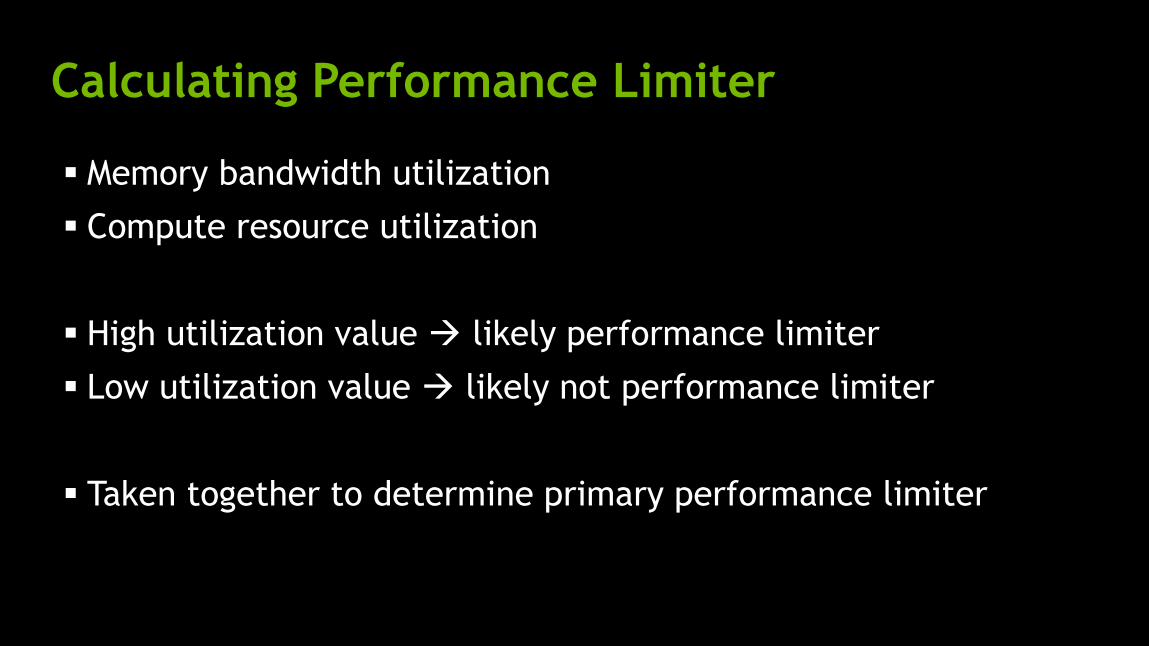
Calculating Performance Limiter
Memory bandwidth utilization
Compute resource utilization
High utilization value likely performance limiter
Low utilization value likely not performance limiter
Taken together to determine primary performance limiter

Memory Bandwidth Utilization
Traffic to/from each memory subsystem, relative to peak
Maximum utilization of any memory subsystem
— L1/Shared Memory
— L2 Cache
— Texture Cache
— Device Memory
— System Memory (via
PCIe)

Compute Resource Utilization
Number of instructions issued, relative to peak capabilities
of GPU
— Some resources shared across all instructions
— Some resources specific to instruction “classes”: integer, FP,
control-flow, etc.
— Maximum utilization of any resource

Calculating Performance Limiter
Utilizations
— Both high compute and memory highly utilized
Compute Memory

Calculating Performance Limiter
Utilizations
— Memory high, compute low memory bandwidth limited
Compute Memory

Calculating Performance Limiter
Utilizations
— Compute high, memory low compute resource limited
Compute Memory
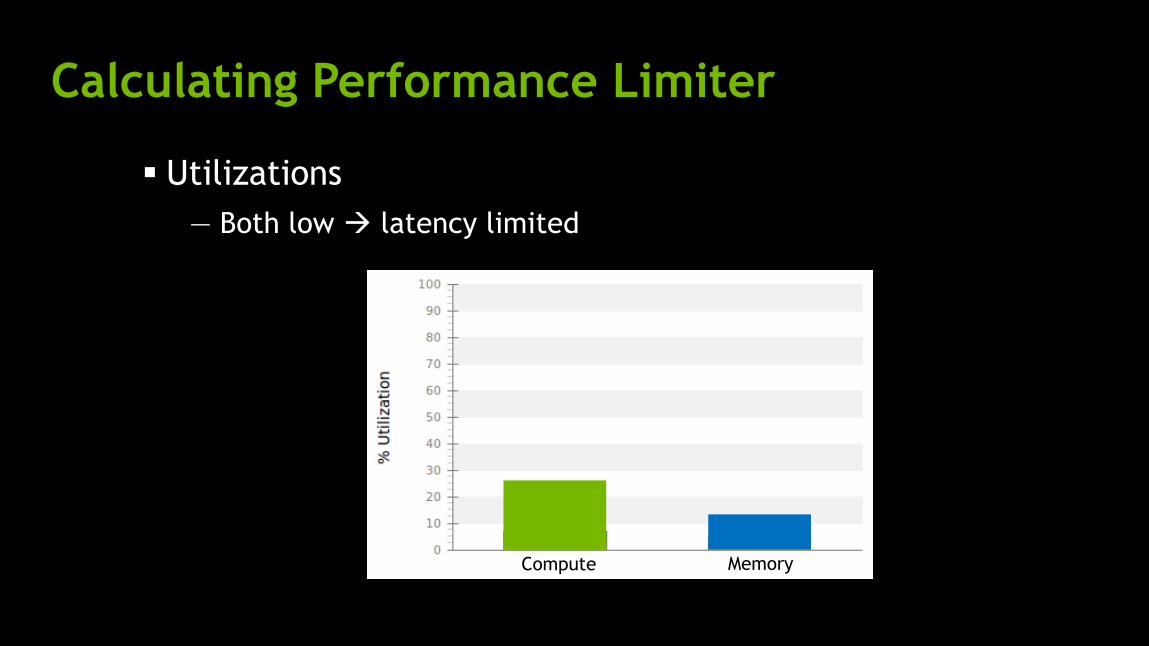
Calculating Performance Limiter
Utilizations
— Both low latency limited
Compute Memory

Demo - Performance Limiter

Limiter-Specific Optimization Analysis
Memory Bandwidth Limited
Compute Limited
Latency Limited

Memory Bandwidth Limited
Global Memory Load/Store
— Access pattern inefficiencies
— Misaligned
Memory Bandwidth Limits
Local Memory Overhead
— Register spilling
— Local stack variables

Compute Resource Limited
Divergent Branches
Low Warp Execution Efficiency
— Due to divergent branches
Over-subscribed function units
— Load/Store
— Arithmetric
— Control-Flow
— Texture

Latency Limited
Low Theoretical Occupancy
— Block Size
— Registers
— Shared Memory
Low Achieved Occupancy
Too Few Blocks
Instruction Stalls

Demo - Limiter Details

Summary
Visual Profiler Guided Analysis gives step-by-step optimization
advice
Kernel Analysis strategy based on identifying primary limiter
— Memory bandwidth
— Compute resources
— Instruction and memory latency
Visual result and integrated documentation
Upcoming GTC Express Webinars
Register at www.gputechconf.com/gtcexpress
September 17 - ArrayFire: A Productive GPU Software Library for Defense and
Intelligence Applications
September 19 - Learn How to Debug OpenGL 4.2 with NVIDIA® Nsight™ Visual Studio
Edition 3.1
September 24 - Pythonic Parallel Patterns for the GPU with NumbaPro
September 25 - An Introduction to GPU Programming
September 26 - Learn How to Profile OpenGL 4.2 with NVIDIA® Nsight™ Visual Studio
Edition 3.1

GTC 2014 Call for Submissions
Looking for submissions in the fields of
Science and research
Professional graphics
Mobile computing
Automotive applications
Game development
Cloud computing
Submit by September 27 at www.gputechconf.com

Extra

Understanding Latency
Memory load : delay from when load instruction executed
until data returns
Arithmetic : delay from when instruction starts until result
produced
A = … … = A Waiting for A

Hiding Latency
SM can do many things at once…
Can “hide” latency as long as there are enough
Warp 0 Warp 6
Warp 1
Warp 2 Warp 3
Warp 4
Warp 5
Warp 0
Warp 2
Warp 0 waiting
SM still busy
Time
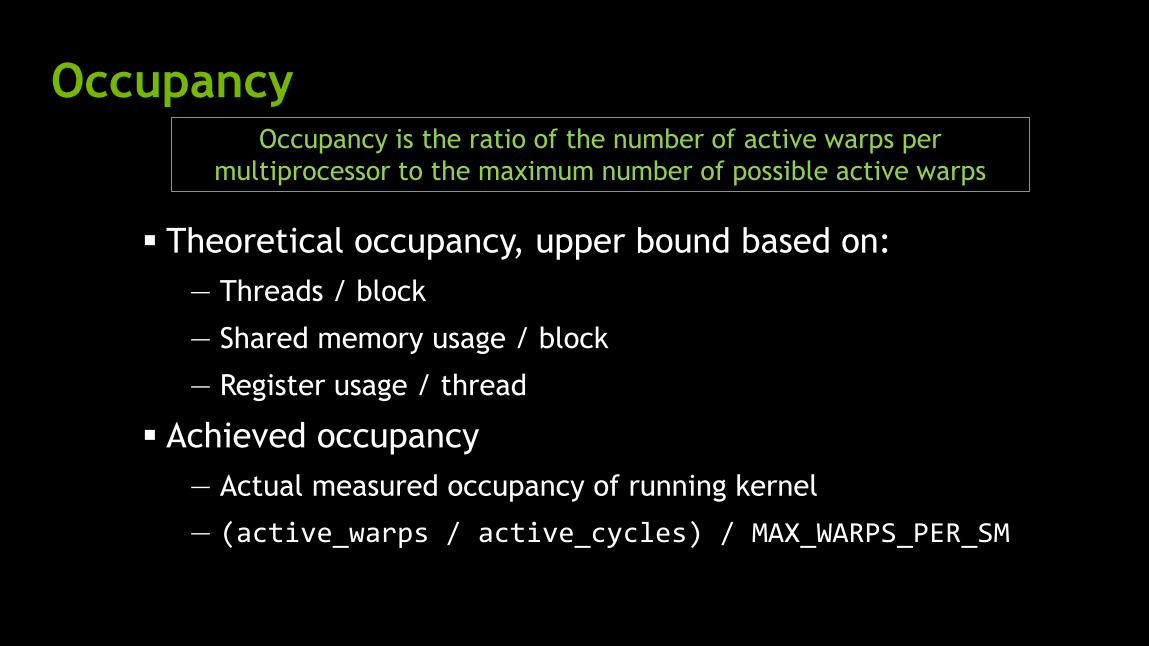
Occupancy
Theoretical occupancy, upper bound based on:
— Threads / block
— Shared memory usage / block
— Register usage / thread
Achieved occupancy
— Actual measured occupancy of running kernel
— (active_warps / active_cycles) / MAX_WARPS_PER_SM
Occupancy is the ratio of the number of active warps per
multiprocessor to the maximum number of possible active warps

Low Theoretical Occupancy
# warps on SM = # blocks on SM × # warps per block
If low…
— Not enough blocks in kernel
— # blocks on SM limited by threads,
shared memory, registers
CUDA Best Practices Guide has
extensive discussion on improving
occupancy

Low Achieved Occupancy
In theory… kernel allows enough warps on each SM
SM
1
Time
Block 0
SM
0
Block 6
Block 1 Block 7
Block 2 Block 8
Block 3 Block 9
Block 4 Block 10
Block 5 Block 11

Low Achieved Occupancy
In theory… kernel allows enough warps on each SM
In practice… have low achieved occupancy
Likely cause is that all SMs do not remain equally busy over
duration of kernel execution
SM
1
Time
Block 0
Block 1
Block 2
Block 6
Block 7
Block 8
SM
0 Block 3
Block 4
Block 5
Block 9
Block 10
Block 11

Lots Of Warps, Not Enough Can Execute
SM can do many things at once…
No “ready” warp…
Warp
Idle
Warp
Idle
Time