Guided Inquiry in Biology - Teacher Edition
64
Transcript of Guided Inquiry in Biology - Teacher Edition


Copyright © by The McGraw-Hill Companies, Inc. All rights reserved. Permission is granted toreproduce the material contained herein on the condition that such material be reproduced onlyfor classroom use; be provided to students, teachers, and families without charge; and be usedsolely in conjunction with a Glencoe Science program. Any other reproduction, for use or sale, isprohibited without prior written permission of the publisher.
Send all inquiries to:Glencoe/McGraw-Hill8787 Orion Place Columbus, OH 43240-4027
ISBN-13: 978-0-07-874719-9ISBN-10: 0-07-874719-8
Printed in the United States of America.
1 2 3 4 5 6 7 8 9 10 047 11 10 09 08 07 06

GUIDED INQUIRY LAB MANUAL iii
Contents
To the Teacher . . . . . . . . . . . . . . . . . . . . . . . . . . . . . . . . . . . . . . . . . . . . . . . . . . . . . . . iv
Correlation to Glencoe Biology Programs . . . . . . . . . . . . . . . . . . . . . . . . . . . . . . . . vi
Safety and Disposal of Lab Materials . . . . . . . . . . . . . . . . . . . . . . . . . . . . . . . . . . . . vii
Materials Supply List . . . . . . . . . . . . . . . . . . . . . . . . . . . . . . . . . . . . . . . . . . . . . . . . . ix
Suppliers . . . . . . . . . . . . . . . . . . . . . . . . . . . . . . . . . . . . . . . . . . . . . . . . . . . . . . . . . . . . . x
Student Edition Table of Contents . . . . . . . . . . . . . . . . . . . . . . . . . . . . . . . . . . . . . . . 3
To the Student . . . . . . . . . . . . . . . . . . . . . . . . . . . . . . . . . . . . . . . . . . . . . . . . . . . . . . . . 4
Laboratory and Safety Guidelines . . . . . . . . . . . . . . . . . . . . . . . . . . . . . . . . . . . . . . . 5
Safety Symbols . . . . . . . . . . . . . . . . . . . . . . . . . . . . . . . . . . . . . . . . . . . . . . . . . . . . . . . 6
Activity 1 What is inquiry? . . . . . . . . . . . . . . . . . . . . . . . . . . . . . . . . . . . . . . . . . . . .7
Activity 2 Monitoring a Plankton Bloom . . . . . . . . . . . . . . . . . . . . . . . . . . . . . . . 11
Activity 3 Plasma Membranes . . . . . . . . . . . . . . . . . . . . . . . . . . . . . . . . . . . . . . . 15
Activity 4 Predicting the Traits of Offspring . . . . . . . . . . . . . . . . . . . . . . . . . . . . 19
Activity 5 Discovering Your Learning Style . . . . . . . . . . . . . . . . . . . . . . . . . . . . . 23
Activity 6 Plant Adaptations . . . . . . . . . . . . . . . . . . . . . . . . . . . . . . . . . . . . . . . . . 27
Activity 7 Effects of Ozone Depletion . . . . . . . . . . . . . . . . . . . . . . . . . . . . . . . . . . 31
Activity 8 Measuring Biodiversity . . . . . . . . . . . . . . . . . . . . . . . . . . . . . . . . . . . . 35
Activity 9 Effects of Water Quality Changes on Protists . . . . . . . . . . . . . . . . . . 39
Activity 10 Environmental Effects on Tadpole Upbringing . . . . . . . . . . . . . . . . 43
Answers and Teacher Guide . . . . . . . . . . . . . . . . . . . . . . . . . . . . . . . . . . . . . . . . . . . 47

To The TeacherWhat is inquiry?The process of inquiry models actual science practice, encourages problem-solving strategies,and develops critical thinking skills. Inquiry gets students actively involved in the learningprocess by allowing them to determine materials, procedures, and/or the topics and questionsthey want to investigate.
Inquiry can range from a very structured activity for those students who need more guidance,to a more open-ended approach in which students design the investigations. The inquiryactivities suggested in this manual will not look the same in every classroom. We encourageyou to modify the suggested activities in a manner that best supports your students.
Why is inquiry important?Inquiry activities, such as those in Glencoe’s Guided Inquiry Lab Manual, will help studentsdevelop educational, career, and life skills. Students learn how to think for themselves, how tosolve problems, and how to apply prior knowledge to new situations.
How can this book help?Glencoe’s Guided Inquiry Lab Manual is structured to give support to both teachers and students.Important biological concepts are the core to each inquiry activity. Students gain practice indeveloping questions and testing their own hypotheses, designing experiments, gathering andanalyzing data, and communicating their conclusions to their peers. As the year progresses,they should begin to feel more comfortable designing their own procedures and conductingtheir own experiments. Teachers are given strategies to guide students who need additionalstructure and to encourage students who are ready for more open-ended exploration.
Suggestions for Incorporating Inquiry in the Biology ClassroomInquiry in biology does take extra time, just as it would in a research lab. Here are some waysyou might be able to efficiently incorporate inquiry into your classroom.
• At the beginning of the year, plan with students the systems they would like to studyand observe over the course of the year (plants, animals, etc.). Have students identifytime constraints such as the length of the organism’s life cycle and the availability of theorganisms throughout the year. Set up long-term experiments and projects with yourstudents to take advantage of the life cycle and availability of the chosen organisms.
• Supply various materials that are related to the concept you are trying to convey and allow students to explore and become familiar with them in groups for about 15 minutes. Have groups brainstorm ideas and list questions they have about thoseconcepts. Have them list materials they will need. As a class or on your own, eliminatethose questions that cannot be answered in the classroom. Gather any additionalmaterials that are needed and allow students to begin their explorations the next day or the next week.
iv GUIDED INQUIRY LAB MANUAL
Cop
yrig
ht ©
by
Gle
ncoe
/McG
raw
-Hill
, a d
ivis
ion
of th
e M
cGra
w-H
ill C
ompa
nies
, Inc
.
• Have students brainstorm questions they would like to explore. As a class, choose 1 or 2 reasonable questions that each group will explore in its own way. (This is veryhelpful if you are trying to cover a specific topic.)
• Give your students a more guided activity that relates hard-to-understand concepts andskills. Then, allow them to explore on their own with a wider variety of materials. Makesure you allow time for debriefing so the students (and you) will understand what theylearned from the experience.
• Students will need practice doing inquiry before they should be allowed to explorecompletely on their own. Be sure to give them lots of practice in using the tools ofscience so that their explorations are more successful.
• Encourage students to rely on their data and not on what they think the answer shouldbe. If their data are unexpected, help them to interpret what might have happened.
• Although truly open inquiry by definition has few boundaries, for these activities,students should be aware of the limitations of their investigations and should keep thisin mind as they design their explorations.
GUIDED INQUIRY LAB MANUAL v
Cop
yrig
ht ©
by
Gle
ncoe
/McG
raw
-Hill
, a d
ivis
ion
of th
e M
cGra
w-H
ill C
ompa
nies
, Inc
.

Correlation to Glencoe Biology ProgramsThe activities in Glencoe’s Guided Inquiry Lab Manual coordinate with the following
chapters/units in these Glencoe biology programs. Use this chart to help plan the best way to use these activities with your class.
Glencoe Biology BSCS Biology: A Molecular
Approach
Biology: AnEveryday
Experience
Biology: LivingSystems
What is inquiry?
Chapter 1 Chapter 1 Chapter 1 Chapter 2
Monitoring a Plankton Bloom
Chapter 19 Chapter 25 Chapter 5 Chapter 29
Plasma Membranes
Chapter 7 Chapter 3 Chapter 2 Chapter 4
Predicting the Traits of Offspring
Chapters 10, 11 Chapter 13 Chapters 26, 27 Chapters 8, 11
Discovering Your Learning Style
Plant Adaptations
Chapter 21 Chapter 7 Chapters 19, 20 Chapter 16
Effects of Ozone Depletion
Chapter 5 Chapter 25 Chapter 32 Chapter 30
Measuring Biodiversity
Chapter 5 Chapter 18 Chapter 7
Effects of Water Quality Changes on Protists
Chapter 19
EnvironmentalEffects on Tadpole Upbringing
vi GUIDED INQUIRY LAB MANUAL
Cop
yrig
ht ©
by
Gle
ncoe
/McG
raw
-Hill
, a d
ivis
ion
of th
e M
cGra
w-H
ill C
ompa
nies
, Inc
.

Safety and Disposal of Lab MaterialsTeaching science requires the use of certain supplies and safety equipment to maintain a safe class-room. The activities in Glencoe’s Guided Inquiry Lab Manual minimize dangers in the laboratory.Even so, there are no guarantees against accidents. For additional help, refer to the booklet GlencoeLaboratory Management and Safety in the Science Classroom, which contains safety guidelines andmasters to test students’ lab and safety skills.
General Guidelines• Post safety guidelines, fire escape routes, and a
list of emergency procedures in the classroom.Make sure students understand these proce-dures. Remind them at the beginning of everylab session.
• Understand and make note of the safety sym-bols used in the activities.
• Have students fill out a safety contract.Students should pledge to follow the rules, towear safety attire, and to conduct themselves ina responsible manner.
• Know where emergency equipment is storedand how to use it.
• Perform all activities before you allow studentsto do so.
• Supervise students at all times. Check assemblyof all setups.
• Instruct students to follow directions carefullyand to not take shortcuts or switch steps.
• Make sure that all students are wearing propersafety attire. Do not permit wearing contactlenses, even with safety glasses; splashingchemicals could infuse under a lens and causeeye damage.
Handling Electronic Equipment • Instruct students on the safety guidelines pro-
vided by the manufacturer of yourcalculator(s) and probe(s).
• Check wiring for damage before each use. Donot use if frayed.
• Do not use the equipment where it could getwet.
• Do not allow students to eat or drink whileusing the equipment.
• Unplug the calculator when not in use.
• Caution students to use care when handlingthe equipment. Calculators and probes shouldnot be shaken or dropped.
• Store the equipment properly when not in use.
Handling Chemicals• Always wear safety goggles, gloves, and an
apron when handling chemicals. Treat allchemicals as potentially dangerous.
• Never ingest chemicals. Use proper techniquesto smell solutions.
• Use a fume hood when handling chemicalsthat are poisonous or corrosive or that give offa vapor.
• Know the location of an eyewash station. Flushthe eyewash for five minutes once a week toremove harmful contaminants that may growin the eyewash. Do not use a squeeze bottle asa substitute for an eyewash.
• Always add acids to water, never the reverse.• Prepare solutions by adding the solid to a small
amount of distilled water and then dilutingwith water to the volume listed. If you use ahydrate that is different from the one specifiedin a particular preparation, you will need toadjust the amount of hydrate to obtain thecorrect concentration.
• Consider purchasing premixed solutions froma scientific supply house to reduce the amountof chemicals on hand.
• Maintain appropriate MSDS (Materials SafetyData Sheets) in the laboratory.
Chemical Storage• Use wood shelving, rather than metal, that is
firmly attached to the wall.• Equip shelves with a lip to prevent chemicals
from being jarred off the shelf.
GUIDED INQUIRY LAB MANUAL vii
Cop
yrig
ht ©
by
Gle
ncoe
/McG
raw
-Hill
, a d
ivis
ion
of th
e M
cGra
w-H
ill C
ompa
nies
, Inc
.
• Store only those chemicals you intend to use.• Store chemicals in upright positions no more
than three containers deep.• Store chemicals at or below eye level but not
on the floor.• Make sure all containers are labeled to identify
the contents, concentration, date purchased orprepared, safety precautions for handling,expiration date, and manufacturer’s name andaddress.
• Separate chemicals by reaction type. For exam-ple, store acids in one place and bases inanother. Store oxidants away from easily oxi-dized materials.
• Store flammables in an approved flammablecabinet.
Chemical Disposal• Maintain an ongoing chemical inventory.
Remove chemicals that are out-of-date, conta-minated, or lacking legible labels.
• Consult local and state authorities for disposalmethods. Use a reference such as PrudentPractices in the Laboratory: Handling andDisposal of Chemicals (National AcademyPress, 1995) for general guidelines on handlingand disposing of chemicals. Current laws inyour area supersede the information in thisbook.
• Neutralize any substance that has a pH lessthan 3 or greater than 8 before disposal.
• For substances that can be flushed down adrain, flush with at least 100 times its volumeof tap water.
• Consider utilizing a commercial chemical dis-posal company.
Chemical Spills• Maintain a clearly identified spill kit in the sci-
ence lab that contains commercial materialsfor that purpose. You also can keep a containerof dry sand or dry clay available; rememberthat these will not neutralize an acid or base.
• Contain the spill and neutralize the chemical ifnecessary.
• Remove the material with equipment made ofplastic or polypropylene to prevent reactionwith any chemical that remains.
• Place the material in plastic bags or containersand label appropriately.
• Inform the custodial staff of proper disposal ofthe material.
• For a major spill, such as breaking a liter bottleof hydrochloric acid, take the followingactions:➢ Evacuate all students through the exits far-thest from the spill.➢ Assist any person splashed with the chemi-cal to the safety shower.➢ Contain the spill wearing proper protectiveclothing. Do not allow the spill to trap you.➢ Call for help.
DISCLAIMERGlencoe/McGraw-Hill makes no claims to the completeness of this discussion of laboratorysafety and chemical storage. The information presented is not all-inclusive, nor does itaddress all of the hazards associated with the handling, storage, and disposal of chemi-cals, or with laboratory practices and management.
viii GUIDED INQUIRY LAB MANUAL
Cop
yrig
ht ©
by
Gle
ncoe
/McG
raw
-Hill
, a d
ivis
ion
of th
e M
cGra
w-H
ill C
ompa
nies
, Inc
.

Guided Inquiry Materials Supply List
Activities Everyday Materials Lab MaterialsActivity 1What is inquiry?
dry soil rubber bandsplastic wrap various leavesnewspaper small slices of apple, banana,
and potato peel
large beakers (2) goggleswax pencil plastic glovessmall jar maskmoisture meter thermometer distilled waterpH meter or pH paper
Activity 2Monitoring aPlankton Bloom
nylon stocking scissorsplastic tie wire/wire hangerwire cutter pliersneedle and thread staplerwatch rubber bandtap watersmall plastic container with lidmedium-size container with lidheavy-duty tape (duct or mailing tape)
thermometer pH test stripsnitrate test kit phosphate test kit1-mL pipette coversliprubbing alcoholcompound microscopemicroscope slide/depression slidereferences for phytoplankton and
zooplankton identification
Activity 3Plasma Membranes
beet roots dry yeastsaltliquid detergentplastic knife
24-well microplate timerbalance hot platestirring rods pipettes150-mL beaker methanoldistilled water pH paperCongo red biological stain
Activity 4Predicting the Traitsof Offspring
individuals to observe (people or pets) fast-growing plantssuccessive generations of plantssoilfertilizer
Activity 5Discovering YourLearning Style
white index cards traycolored index cards dictionarycolored pens or pencils highlighterstable of random numberstape player or CD player with headphonesstopwatch/watch or clock with a secondhandtwo CDs or tapes of different types of musiccommon household or classroom items
Activity 6Plant Adaptations
soilsandsmall pots or polystyrene cups
aquatic plants desert plantshouseplants 200-watt lampmicroscope microscope slidesaquarium or large
clear container
Activity 7Effects of OzoneDepletion
soil scissorswater plastic plantersheavy-duty string wooden stakesclock/timer ruler
balance drying oventhermometer UVB light sourceUVB screen fertilizer500-mL beakerseeds for several species of plants, or
partially grown plants
GUIDED INQUIRY LAB MANUAL ix
Cop
yrig
ht ©
by
Gle
ncoe
/McG
raw
-Hill
, a d
ivis
ion
of th
e M
cGra
w-H
ill C
ompa
nies
, Inc
.

American Science & SurplusP.O. Box 1030Skokie, IL 60076(847) 647-0011www.sciplus.com
Arbor ScientificP.O. Box 2750Ann Arbor, MI 48106-2750(734) 477-9370www.arborsci.com
Bio-Rad Laboratories2000 Alfred Nobel Dr.Life Science GroupHercules, CA 94547(800) 876-3425www.biorad.com
Carolina Biological Supply Co.2700 York RoadBurlington, NC 27215(800) 334-5551www.carolina.com
Chem Scientific, LLC1250 Washington St.Norwood, MA 02062(888) 527-5827www.chemscientific.com
Edmund Scientifics60 Pearce Ave.Tonawanda, NY 14150-6711(800) 728-6999www.scientificsonline.com
Fisher Science Education4500 TurnberryHanover Park, IL 60133(800) 955-1177www.fisheredu.com
Flinn ScientificP.O. Box 219770 N. Raddant Rd.Batavia, IL 60510(800) 452-1261www.flinnsci.com
Frey ScientificP.O. Box 8101100 Paragon ParkwayMansfield, OH 44903(800) 225-3739www.freyscientific.com
Nasco Science901 Janesville AvenueP.O. Box 901Fort Atkinson, WI 53538-0901(800) 558-9595www.enasco.com
Nebraska Scientific3823 Leavenworth St.Omaha, NE 68105-1180(800) 228-7117www.nebraskascientific.com
Pasco Scientific10101 Foothills Blvd.Roseville, CA 95747(800) 772-8700www.pasco.com
Sargent-Welch/VWR ScientificProducts
P.O. Box 5229Buffalo Grove, IL 60089-5229(800) 727-4368www.sargentwelch.com
Science Kit and Boreal Laboratories777 East Park Dr.P.O. Box 5003Tonawanda, NY 14150(800) 828-7777www.sciencekit.com
VWR CanLab2360 Argentina Rd.Mississauga, Ontario L5N5Z7(800) 932-5000www.vwrcanlab.com
Ward’s Natural ScienceEstablishment, Inc.
5100 W. Henrietta RoadP.O. Box 92912Rochester, NY 14692-9012(800) 962-2660www.wardsci.com
Suppliers
Activity 9Effects of WaterQuality Changes onProtists
glass jarssilt or sandhot water bathvinegar
thermometer droppersmicroscope slides motor oilprotist-slowing agent pH test stripshouseplant pesticide liquid fertilizerculture media for protistscultures of a variety of freshwater protists,
such as Euglena graciliscompound light microscope
Activity 10EnvironmentalEffects on TadpoleUpbringing
dried leaveslettuce, spinach, and other food for the
tadpoles
water thermometer magnifiersmall fish net tadpoles200-watt lampaquariums or short, wide plastic
containers with snap-on lids
x GUIDED INQUIRY LAB MANUAL
Cop
yrig
ht ©
by
Gle
ncoe
/McG
raw
-Hill
, a d
ivis
ion
of th
e M
cGra
w-H
ill C
ompa
nies
, Inc
.
Activity 8MeasuringBiodiversity
heavy-duty stringmeterstickscissorssmall garden shovel or trowel
70% isopropyl alcohol droppercollection jars magnifying glassmicroscope slides sieve60-watt lightbulb paper funnelring stand 500-mL beakercompound light microscope or
dissecting microscope small weights or stakes
Activities Everyday Materials Lab Materials

Contents
To the Student . . . . . . . . . . . . . . . . . . . . . . . . . . . . . . . . . . . . . . . . . . . . . . . . . . . . . . . . 4
Laboratory and Safety Guidelines . . . . . . . . . . . . . . . . . . . . . . . . . . . . . . . . . . . . . . . 5
Safety Symbols . . . . . . . . . . . . . . . . . . . . . . . . . . . . . . . . . . . . . . . . . . . . . . . . . . . . . . . 6
Activity 1 What is inquiry? . . . . . . . . . . . . . . . . . . . . . . . . . . . . . . . . . . . . . . . . . . . .7
Activity 2 Monitoring a Plankton Bloom . . . . . . . . . . . . . . . . . . . . . . . . . . . . . . . 11
Activity 3 Plasma Membranes . . . . . . . . . . . . . . . . . . . . . . . . . . . . . . . . . . . . . . . 15
Activity 4 Predicting the Traits of Offspring . . . . . . . . . . . . . . . . . . . . . . . . . . . . 19
Activity 5 Discovering Your Learning Style . . . . . . . . . . . . . . . . . . . . . . . . . . . . . 23
Activity 6 Plant Adaptations . . . . . . . . . . . . . . . . . . . . . . . . . . . . . . . . . . . . . . . . . 27
Activity 7 Effects of Ozone Depletion . . . . . . . . . . . . . . . . . . . . . . . . . . . . . . . . . . 31
Activity 8 Measuring Biodiversity . . . . . . . . . . . . . . . . . . . . . . . . . . . . . . . . . . . . 35
Activity 9 Effects of Water Quality Changes on Protists . . . . . . . . . . . . . . . . . . 39
Activity 10 Environmental Effects on Tadpole Upbringing . . . . . . . . . . . . . . . . . 43
GUIDED INQUIRY LAB MANUAL 3
Cop
yrig
ht ©
by
Gle
ncoe
/McG
raw
-Hill
, a d
ivis
ion
of th
e M
cGra
w-H
ill C
ompa
nies
, Inc
.

To the StudentWhat is inquiry?Inquiry can come in many forms. Somtimes it is very structured, such as when a scientist issearching for a cure for cancer and follows an exact plan for his research. Sometimes it can bevery open, such as when a researcher designs her own methods for observing and investigatingthe social patterns of elephants.
As a student, you may not always get to choose the topic you will be studying, but throughinquiry, you can often choose the way you will investigate the topic at hand. You can chooseyour materials, plan, and execute your own procedure. If you are really curious about somethingyou have observed, your teacher may encourage you to investigate that question further.
How to Use This Lab ManualGlencoe’s Guided Inquiry Lab Manual provides you with a variety of activities about a range ofbiology topics. Each lab provides you with background material about a topic, offers suggestionsfor questions to explore, encourages you to form your own questions and hypotheses, and provides you with suggestions for testing your hypothesis. The questions at the end of the labgive you an opportunity to analyze your data and draw conclusions about what you found.
Suggestions for Successful Inquiry in BiologyConducting inquiry in biology is challenging but it can also be a lot of fun. Here are some ideasfor how you can make each inquiry a success:
• Explore safely. Always check your plan with your teacher before you get started. • Ask questions. Think about what the activity is asking you to do and make sure you
understand it before you begin.• Keep an open mind. Experiments don’t always turn out the way you plan them. Use the
data you have to draw conclusions. If the result is completely unexpected, try to figure outwhat you can change to get the results you expected.
• Be creative. Think of new ways to explore the concepts rather than the ones that aresuggested. This will keep you more interested in the process and can result in someinteresting findings.
• Ask more questions. Really interesting things can happen throughout an experiment. Ask questions such as how, why, and what if, to learn more. Explore on your own, or getpermission from your teacher.
4 GUIDED INQUIRY LAB MANUAL
Cop
yrig
ht ©
by
Gle
ncoe
/McG
raw
-Hill
, a d
ivis
ion
of th
e M
cGra
w-H
ill C
ompa
nies
, Inc
.
Laboratory and Safety GuidelinesEmergencies• Inform the teacher immediately of any mishap—fire, injury, glassware breakage, chemical spills, and
so forth.• Know the location of the fire extinguisher, safety shower, eyewash, fire blanket, and first-aid kit.
Know how to use this equipment.• If chemicals come into contact with your eyes or skin, flush with large quantities of water and
notify your teacher immediately.
Preventing Accidents• Do NOT wear clothing that is loose enough to catch on anything. Do NOT wear sandals or open-
toed shoes. Remove loose jewelry—chains or bracelets—while doing lab work.• Wear protective safety gloves, goggles, and aprons as instructed.• Always wear safety goggles (not glasses) in the laboratory.• Wear goggles throughout the entire activity, cleanup, and handwashing.• Keep your hands away from your face while working in the laboratory.• Remove synthetic fingernails before working in the lab (these are highly flammable).• Do NOT use hair spray, mousse, or other flammable hair products just before or during
laboratory work where an open flame is used (they can ignite easily).• Tie back long hair and loose clothing to keep them away from flames and equipment.• Eating, drinking, chewing gum, applying makeup, and smoking are prohibited in the
laboratory.• Do NOT inhale vapors or taste, touch, or smell any chemical or substance unless instructed to do so
by your teacher.
Working in the Laboratory• Study all instructions before you begin a laboratory or field activity. Ask questions if you do not
understand any part of the activity.• Work ONLY on activities assigned by your teacher. NEVER work alone in the laboratory.• Do NOT substitute other chemicals/substances for those listed in your activity.• Do NOT begin any activity until directed to do so by your teacher.• Do NOT handle any equipment without specific permission.• Remain in your own work area unless given permission by your teacher to leave it.• Do NOT point heated containers—test tubes, flasks, and so forth—at yourself or anyone else.• Do NOT take any materials or chemicals out of the classroom.• Stay out of storage areas unless you are instructed to be there and are supervised by your teacher.
Laboratory Cleanup• Keep work, lab, and balance areas clean, limiting the amount of easily ignitable materials.• Turn off all burners, water faucets, probeware, and calculators before leaving the lab.• Carefully dispose of waste materials as instructed by your teacher.• With your goggles on, wash your hands thoroughly with soap and warm water after each
activity.
GUIDED INQUIRY LAB MANUAL 5
Cop
yrig
ht ©
by
Gle
ncoe
/McG
raw
-Hill
, a d
ivis
ion
of th
e M
cGra
w-H
ill C
ompa
nies
, Inc
.

6 GUIDED INQUIRY LAB MANUAL
Cop
yrig
ht ©
by
Gle
ncoe
/McG
raw
-Hill
, a d
ivis
ion
of th
e M
cGra
w-H
ill C
ompa
nies
, Inc
.
GUIDED INQUIRY LAB MANUAL ACTIVITY 1 7
Cop
yrig
ht ©
by
Gle
ncoe
/McG
raw
-Hill
, a d
ivis
ion
of th
e M
cGra
w-H
ill C
ompa
nies
, Inc
.
What is inquiry?Activity
1Activity
Name Date Class
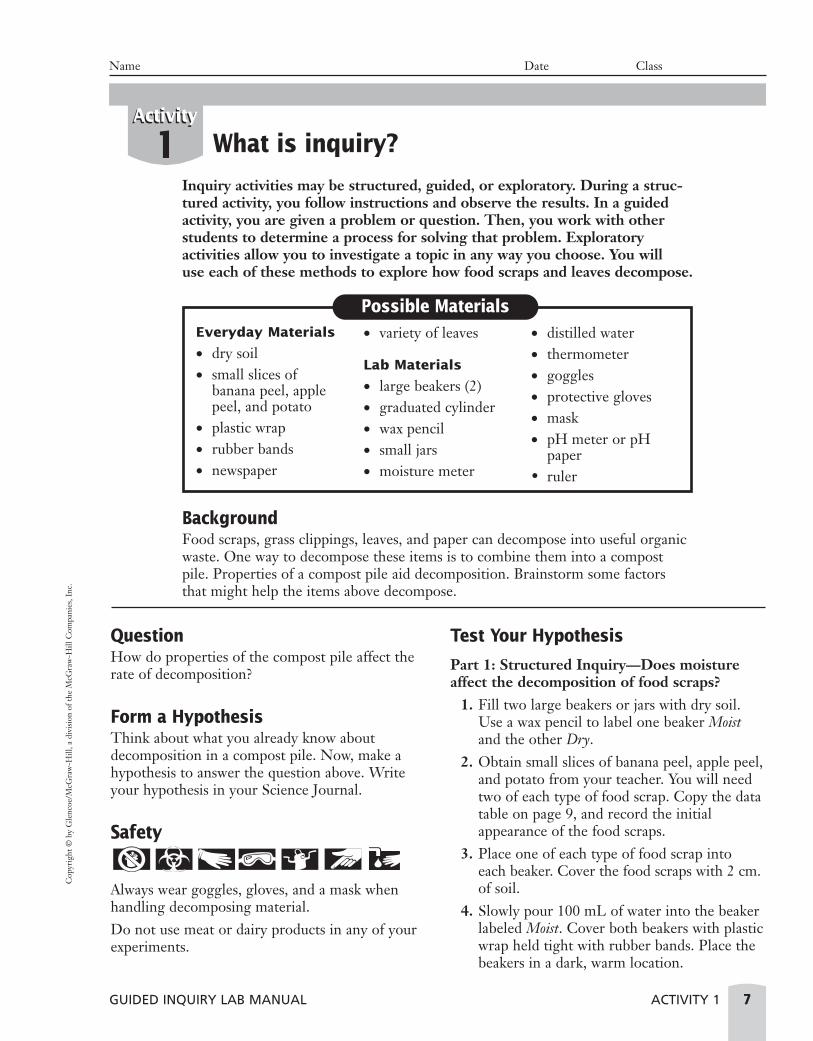
Inquiry activities may be structured, guided, or exploratory. During a struc-tured activity, you follow instructions and observe the results. In a guidedactivity, you are given a problem or question. Then, you work with otherstudents to determine a process for solving that problem. Exploratory activities allow you to investigate a topic in any way you choose. You will use each of these methods to explore how food scraps and leaves decompose.
BackgroundFood scraps, grass clippings, leaves, and paper can decompose into useful organicwaste. One way to decompose these items is to combine them into a compostpile. Properties of a compost pile aid decomposition. Brainstorm some factorsthat might help the items above decompose.
QuestionHow do properties of the compost pile affect therate of decomposition?
Form a HypothesisThink about what you already know aboutdecomposition in a compost pile. Now, make ahypothesis to answer the question above. Writeyour hypothesis in your Science Journal.
Safety
Always wear goggles, gloves, and a mask whenhandling decomposing material. Do not use meat or dairy products in any of yourexperiments.
Test Your Hypothesis
Part 1: Structured Inquiry—Does moistureaffect the decomposition of food scraps?
1. Fill two large beakers or jars with dry soil.Use a wax pencil to label one beaker Moistand the other Dry.
2. Obtain small slices of banana peel, apple peel,and potato from your teacher. You will needtwo of each type of food scrap. Copy the datatable on page 9, and record the initialappearance of the food scraps.
3. Place one of each type of food scrap into each beaker. Cover the food scraps with 2 cm.of soil.
4. Slowly pour 100 mL of water into the beakerlabeled Moist. Cover both beakers with plasticwrap held tight with rubber bands. Place thebeakers in a dark, warm location.
Possible MaterialsEveryday Materials
• dry soil• small slices of
banana peel, applepeel, and potato
• plastic wrap• rubber bands• newspaper
• variety of leaves
Lab Materials
• large beakers (2)• graduated cylinder• wax pencil• small jars• moisture meter
• distilled water• thermometer• goggles• protective gloves• mask• pH meter or pH
paper• ruler

5. After one day, remove the plastic wrap. Pourthe contents of the beaker onto cardboard andrecord the appearance of the food scraps inyour data table. Be sure to wear protectivegoggles, gloves, and a mask while handlingthe food scraps.
6. Place the food scraps and soil back in thebeakers. Add 10 mL of water into the beakerlabeled Moist. Replace the plastic covering onthe beakers and put the beakers back in thedark, warm location. Wash hands thoroughlyafter science activities.
7. Repeat steps 5 and 6 every day for a week.Afterward, dispose of the materials as directedby your teacher.
Part 2: Guided Inquiry—Do all leaves decompose at the same rate?
1. Discuss decomposition of leaves with your labpartner. Recall times when you have seendecomposing leaves. What did the leaves looklike? Did some leaves seem to decomposefaster than others? Write your hypothesis.
2. Work with your partner to design anexperiment to test your hypothesis. Use avariety of leaves in your study, includingdeciduous leaves and evergreen leaves.Include leaves from the ground as well as
leaves from trees. Make a list of the differentmaterials you will need for your lab. Thinkabout how you will make your observations.Create a data table for recording yourobservations and measurements. In your plan,be sure to include any necessary safetymeasures.
3. Have your teacher approve your plan beforeyou begin.
4. Gather the materials you need for your lab.5. Carry out your investigation according to
your plan.
Part 3: Exploratory Inquiry—How does therate of decomposition in a compost piledepend on its properties?
1. Think about other properties youbrainstormed at the beginning of the lab. Arethere any properties you could investigate fortheir effect on decomposition? Are there othertests you could perform to explore the effectsof moisture? Remember to limit your variableswhen designing your experiment.
2. Make a list of possible experiments you couldconduct. Think about whether the materialsrequired are easily available. How long wouldeach experiment take to complete?
3. Work with your lab partner to choose anexperiment from your list. Write out the stepsthat you will follow, and include a list ofmaterials and a data table for recording yourobservations and measurements. In your plan,be sure to include any necessary safetymeasures.
4. Have your teacher approve the plan for yourexperiment.
5. Gather the supplies you need for yourinvestigation. Perform the experimentaccording to your plan.
What is inquiry? continued1
8 ACTIVITY 1 GUIDED INQUIRY LAB MANUAL
ActivityActivity
Name Date Class
Cop
yrig
ht ©
by
Gle
ncoe
/McG
raw
-Hill
, a d
ivis
ion
of th
e M
cGra
w-H
ill C
ompa
nies
, Inc
.

Interpret Your Data1. Look at the observations that you made for Part 1, the effect of moisture on decomposition of food
scraps. Describe how the appearance of the food scraps in dry soil and moist soil changed through-out the week.
2. What variable did you test in Part 2? How does that variable relate to the rate of decomposition?
3. Look at the data that you collected for Parts 2 and 3. If possible, make a graph using your data.Remember that the independent variable (the factors you changed) will be on the x-axis, and thedependent variable (your observations) will be on the y-axis.
What is inquiry? continued1
GUIDED INQUIRY LAB MANUAL ACTIVITY 1 9
ActivityActivity
Name Date Class
Observations
Decomposition of Food ScrapsDay Dry Moist
1234567
Cop
yrig
ht ©
by
Gle
ncoe
/McG
raw
-Hill
, a d
ivis
ion
of th
e M
cGra
w-H
ill C
ompa
nies
, Inc
.
Cop
yrig
ht ©
by
Gle
ncoe
/McG
raw
-Hill
, a d
ivis
ion
of th
e M
cGra
w-H
ill C
ompa
nies
, Inc
.
Conclude and Apply1. How did moisture affect the rate of decomposition of the food scraps you tested in Part 1?
2. Would making the soil in Part 1 very wet increase the rate of decomposition? Design an experimentto test your hypothesis.
3. Write a conclusion about how the property of compost piles that you tested in Part 3 affects the rateof decomposition.
4. Discuss the results you obtained in Part 3 with your classmates. Compare the different propertieseach group in your class tested. Draw conclusions about the best conditions for a compost pile.
5. Explain how an exploratory activity, such as the one you performed in Part 3, allows you to investi-gate a topic in more depth.
Going FurtherLook back at the procedures that you used in Part 3. How could you improve your design?
What is inquiry? continued1
10 ACTIVITY 1 GUIDED INQUIRY LAB MANUAL
ActivityActivity
Name Date Class

GUIDED INQUIRY LAB MANUAL ACTIVITY 2 11
Cop
yrig
ht ©
by
Gle
ncoe
/McG
raw
-Hill
, a d
ivis
ion
of th
e M
cGra
w-H
ill C
ompa
nies
, Inc
.
Monitoring a Plankton BloomActivity
2Activity
Name Date Class
Plankton are organisms that are found in both freshwater and marineecosystems. The word plankton is derived from the Greek word planktos,which means “wandering.” Plankton do not have the ability to move againstwater currents. Plankton drift with existing water movements. Phytoplankton,such as diatoms and dinoflagellates, are primary producers that use carbondioxide, nutrients, and light to make food. Zooplankton, such as the copepod(copepods are small crustaceans that are usually shorter than 1 mm) shownbelow, are free-floating animals that feed on phytoplankton.
Possible Materials
BackgroundIn temperate regions, seasonal cycles cause changes in the water temperature oflakes and ponds. These changes lead to mixing between surface water and deeperlayers of water. This process of mixing, which occurs in both the spring and thefall, is known as turnover. Brainstorm factors that might be present in surfacewater, deeper waters, or both, that might affect plankton populations and growth.
Figure 1
Everyday Materials
• nylon stocking• scissors• small plastic
container with lipon the top
• heavy-duty string• rubber band• plastic tie• wire/wire hanger• wire cutter• pliers• thread
• needle• stapler• watch• medium-size plastic
container with lid • tap water • heavy-duty tape
(duct or mailingtape)
Lab Materials
• thermometer• pH test strips• nitrate test kit
• phosphate test kit• rubbing alcohol • compound
microscope• microscope
slide/depressionslide
• coverslip• references for
phytoplankton andzooplanktonidentification
• 1-mL pipette

Cop
yrig
ht ©
by
Gle
ncoe
/McG
raw
-Hill
, a d
ivis
ion
of th
e M
cGra
w-H
ill C
ompa
nies
, Inc
.
QuestionHow do seasonal cycles affect plankton in your area?
Form a HypothesisThink about what you already know aboutseasonal cycles and plankton blooms. Now, form ahypothesis to answer the question above. Writeyour hypothesis in your Science Journal.
Safety
Wash hands immediately after collecting a sampleor working in the laboratory. Do not drink any ofthe water that you collected. Dress appropriatelyand wear a personal flotation device if necessary.Use caution while collecting samples. Use alllaboratory materials appropriately.
Test Your Hypothesis1. Think about the materials that have been
provided for you. How will you test yourhypothesis?
2. Make a list of the steps you will take to monitora plankton bloom. There are several stages to
consider. First, you will have to construct yourown plankton net to use for sampling. Thinkabout how you will use the materials providedto make a plankton net. How will you ensurethat it will be structurally strong?
3. Construct your plankton net. Use Figure 2 asa reference.
4. Using your knowledge of plankton, make alist of steps you will follow to monitor aplankton bloom. • Consider the variables in your experiment.• How will you ensure the quality of your
data as you make your collections?
Monitoring a Plankton Bloom, continued2
12 ACTIVITY 2 GUIDED INQUIRY LAB MANUAL
ActivityActivity
Name Date Class
Collecting cup(pill bottle)
String/rubber band/plastic tie
Mesh netting(nylon)
Towline(string)
Mouth of net(wire)
Plankton Cycles Plankton exhibit a seasonal cycle that can be monitored using avariety of tools. These tools reveal information about the biological, chemical, andphysical characteristics of the water. Plankton cycles are affected by both abiotic andbiotic factors, including water temperature, light intensity, nutrient concentrations,and predator-prey relationships. High nutrient concentrations and increasing lightintensity in the spring help phytoplankton flourish, resulting in a plankton bloom.Zooplankton populations also will increase after a lag period. To a lesser extent, thisprocess is repeated in the fall, but a fall bloom is usually smaller than a spring bloombecause of the decreasing intensity of light. Collecting Plankton Plankton blooms can be monitored by collecting planktonsamples with a plankton net. A plankton net, shown in Figure 2, consists of fine-meshnetting with a collecting cup on one end and a towline on the other end. Acting like afilter, it is pulled through the water. Water passes through the mesh netting, but anyorganisms larger than the size of the mesh will be collected in the sampling cup. Thesample is then analyzed under a microscope and the numbers and types of organismscan be determined. Other measurements, such as water temperature, pH, nitrate andphosphate concentrations, and oxygen concentrations, can be taken as well. In thisactivity you will construct a plankton net. You will use your net to monitor a fall orspring plankton bloom in a nearby area of water by doing a plankton tow once a weekfor at least six weeks or longer, if possible.
Figure 2

Cop
yrig
ht ©
by
Gle
ncoe
/McG
raw
-Hill
, a d
ivis
ion
of th
e M
cGra
w-H
ill C
ompa
nies
, Inc
.
• Consider how variations in the followingcould affect your data: ■ method by which sample is collected
(For example: will you have to drag thenet through still water, or will thecurrent be strong enough to allow youto hold the net in one place while waterpasses through it?)
■ length of time of plankton tow■ time of day sample is collected■ exact location sample is taken
5. After you collect your data and complete yourplankton tow each week, how will you store yoursample? Consider the length of time betweencollection and viewing under the microscope.
Plankton only live for about 24 hours. Store theplankton in the refrigerator or preserve them byadding one part 70% isopropyl alcohol to sixparts of water. CAUTION: Keep all sources ofignition away from the alcohol.
6. How will you make an accurate count of theorganisms in your sample? How will youidentify whether an organism is zooplanktonor phytoplankton?
7. How will you clean and store your netbetween uses? Does your net need to berepaired or reconstructed?
8. Read the MSDSs in the test kits and follow thesafety guidelines. Review your plan with yourteacher before you proceed with each step.
Monitoring a Plankton Bloom, continued2
GUIDED INQUIRY LAB MANUAL ACTIVITY 2 13
ActivityActivity
Name Date Class
* Units may vary depending on test kit.
Interpret Your Data1. On graph paper, construct graphs that show how the variables of water temperature, pH, nitrate
and phosphate concentrations, and the average number of phytoplankton and zooplankton changedover the weeks of sampling. You should also make graphs showing time (week 1, week 2, and so on)on the x-axis and the number of phytoplankton and zooplankton on the y-axis.
2. Analyze your graphs. How do the seasonal changes correlate to the changes in the number of planktonyou collected? Is there a correlation between any other data collected and the number of plankton?
Variable Week 1 Week 2 Week 3 Week 4 Week 5 Week 6Surface water temperature (°C)
pH
Nitrate (ppm)*Phosphate (ppm)*Air temperature (°C)
Weather conditions
Other observations
Average number ofphytoplankton
Average number ofzooplankton

Cop
yrig
ht ©
by
Gle
ncoe
/McG
raw
-Hill
, a d
ivis
ion
of th
e M
cGra
w-H
ill C
ompa
nies
, Inc
.
Conclude and Apply 1. Do your data support your hypothesis? Explain why or why not.
2. Compare your data to those of your classmates. Are there any differences? What could account forthese differences?
3. Explain the relationship between seasonal changes and plankton blooms. How are the concentrationsof nitrate and phosphate related to plankton blooms?
4. Predict how nitrates and phosphates from runoff could affect a plankton bloom.
Going FurtherIf you were to do this project again, how would you improve your methods? What additional studiescould be conducted?
Monitoring a Plankton Bloom, continued2
14 ACTIVITY 2 GUIDED INQUIRY LAB MANUAL
ActivityActivity
Name Date Class
GUIDED INQUIRY LAB MANUAL ACTIVITY 3 15
Cop
yrig
ht ©
by
Gle
ncoe
/McG
raw
-Hill
, a d
ivis
ion
of th
e M
cGra
w-H
ill C
ompa
nies
, Inc
.
Plasma MembranesActivity
3Activity
Name Date Class
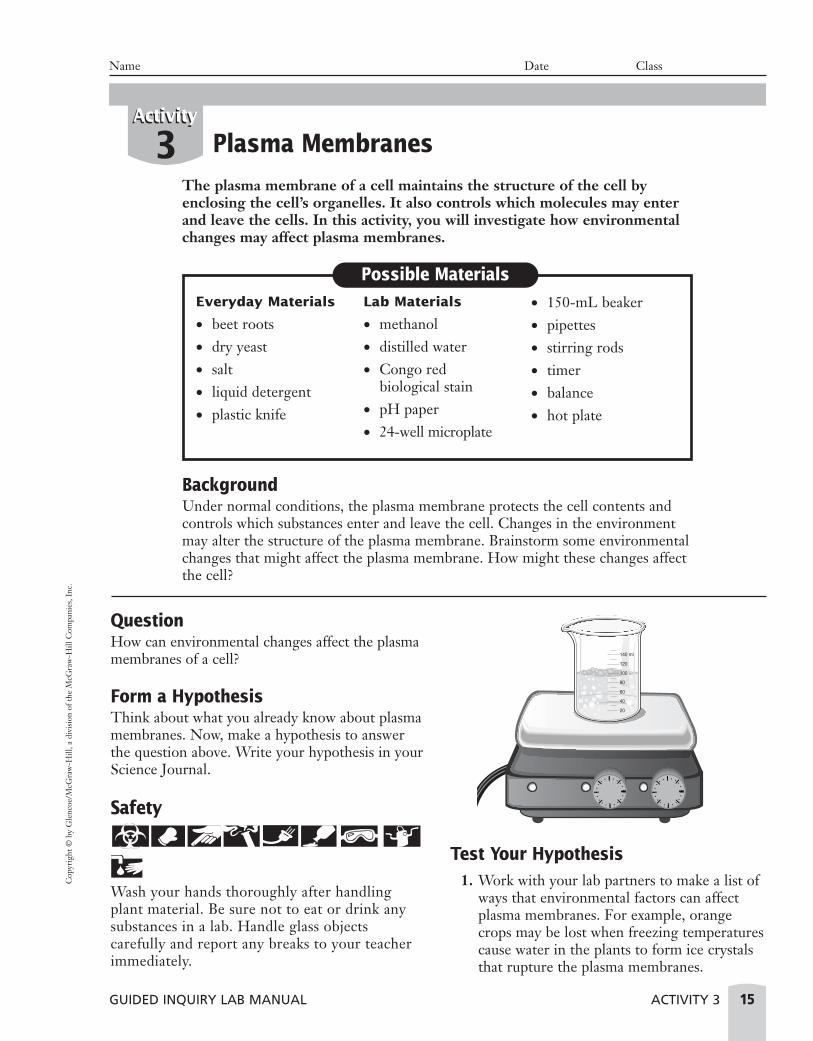
The plasma membrane of a cell maintains the structure of the cell byenclosing the cell’s organelles. It also controls which molecules may enterand leave the cells. In this activity, you will investigate how environmentalchanges may affect plasma membranes.
BackgroundUnder normal conditions, the plasma membrane protects the cell contents andcontrols which substances enter and leave the cell. Changes in the environmentmay alter the structure of the plasma membrane. Brainstorm some environmentalchanges that might affect the plasma membrane. How might these changes affectthe cell?
QuestionHow can environmental changes affect the plasmamembranes of a cell?
Form a HypothesisThink about what you already know about plasmamembranes. Now, make a hypothesis to answerthe question above. Write your hypothesis in yourScience Journal.
Safety
Wash your hands thoroughly after handlingplant material. Be sure not to eat or drink anysubstances in a lab. Handle glass objectscarefully and report any breaks to your teacherimmediately.
Test Your Hypothesis1. Work with your lab partners to make a list of
ways that environmental factors can affectplasma membranes. For example, orangecrops may be lost when freezing temperaturescause water in the plants to form ice crystalsthat rupture the plasma membranes.
20
40
60
80
100
120
140 ml
Possible MaterialsEveryday Materials
• beet roots• dry yeast• salt• liquid detergent• plastic knife
Lab Materials
• methanol• distilled water• Congo red
biological stain• pH paper• 24-well microplate
• 150-mL beaker• pipettes• stirring rods• timer• balance• hot plate

Cop
yrig
ht ©
by
Gle
ncoe
/McG
raw
-Hill
, a d
ivis
ion
of th
e M
cGra
w-H
ill C
ompa
nies
, Inc
.
2. What environmental factors can you test?Consider variables that are both naturallyoccurring and those that are of human origin.How could you recreate these factors in the lab?
3. One method you might use to study theenvironmental effects on plasma membranesuses beet roots. Beet cells contain a redchemical. If the plasma membranes arealtered or damaged, the red coloring willescape. You can also observe effects on theplasma membranes by looking at yeast cellsunder a microscope. The chemical stainCongo red normally can’t penetrate themembrane of yeast cells. If a solution of yeastcells is stained with Congo red, the cytoplasmwill remain clear. However, if the plasmamembranes are damaged, the stain will enterthe cell and the cytoplasm will appear red.
4. Decide with your lab partner whichenvironmental condition you wish to
investigate. Also decide which method youthink is best for studying the effect that achange in an environmental condition wouldhave on plasma membranes.
5. Make a list of the steps that you will followfor your investigation. Have your teacherapprove your plan.
6. Discuss with your partner how you think yourenvironmental change will affect the plasmamembranes you test. Based on theenvironmental condition you have decided totest, restate your hypothesis below:Prediction:
7. Carry out your investigation. You may wish touse a data table similar to the one below. Ifpossible, create a graph of your data.
Plasma Membranes, continued3
16 ACTIVITY 3 GUIDED INQUIRY LAB MANUAL
ActivityActivity
Name Date Class
Interpret Your Data1. Describe the environmental condition that you changed.
EnvironmentalCondition(variable)
Observations/Data
Data Table

Cop
yrig
ht ©
by
Gle
ncoe
/McG
raw
-Hill
, a d
ivis
ion
of th
e M
cGra
w-H
ill C
ompa
nies
, Inc
.
2. Explain the procedure you used to test this environmental change.
3. Using the data table(s) you prepared, describe any changes you observed or measured during yourinvestigation.
4. Describe any problems you may have encountered during your investigation. Did this affect yourresults? If so, explain how.
Conclude and Apply1. Review your data table. Write a statement that summarizes your results. What other questions do
you have?
2. Compare your results to those of other groups in your class. Describe other investigations that couldbe made about environmental effects on plasma membranes.
Plasma Membranes, continued3
GUIDED INQUIRY LAB MANUAL ACTIVITY 3 17
ActivityActivity
Name Date Class

Cop
yrig
ht ©
by
Gle
ncoe
/McG
raw
-Hill
, a d
ivis
ion
of th
e M
cGra
w-H
ill C
ompa
nies
, Inc
.
3. The investigations made by you and your class involved only one or a few types of cells. Do you thinkyour results can be extended to other types of plasma membranes as well? Explain why or why not.
Going FurtherDescribe a way that your investigation or the investigation of another group could be applied to aneveryday situation.
Plasma Membranes, continued3
18 ACTIVITY 3 GUIDED INQUIRY LAB MANUAL
ActivityActivity
Name Date Class

GUIDED INQUIRY LAB MANUAL ACTIVITY 4 19
Cop
yrig
ht ©
by
Gle
ncoe
/McG
raw
-Hill
, a d
ivis
ion
of th
e M
cGra
w-H
ill C
ompa
nies
, Inc
.
Predicting the Traits ofOffspring
Activity
4Activity
Name Date Class
Children resemble their parents because genes are passed from generationto generation. By examining the traits of a family, you can predict whichtraits will most likely occur in the offspring. In this activity, you will investi-gate how traits can be predicted.
BackgroundTraits can be either learned or inherited. Learned traits are acquired throughout ourlives. Inherited traits are determined by genes encoded on DNA in cells. Genes havetwo or more versions called alleles. One allele might be dominant and the othermight be recessive. A child might show a trait that is not seen in either parent becausethe child has two recessive alleles for that trait. Make a list of human traits that arelearned and a list of those that are inherited.
QuestionHow do parents’ traits affect those of theiroffspring?
Form a HypothesisThink about your current knowledge of inheritedtraits. Now, make a hypothesis to answer the questionabove. Write your hypothesis in your Science Journal.
Safety
If you are working with plants, be sure to washyour hands thoroughly after handling plants,fertilizer, or other related materials.
Test Your Hypothesis1. Discuss with your lab partners ways that you
could investigate inherited traits. You mightwant to examine your traits, traits of a familypet, or traits of a plant.
2. After choosing a person, animal, or plant tostudy, you should consider from where thetraits were inherited. For example, if youchoose to examine the traits of a student, youshould be able to examine the traits of thestudent’s parents, grandparents, and otherfamily members. If you choose a pet, you
Possible MaterialsEveryday Materials
• individuals to observe (people or pets)
Everyday Materials
• soilLab Materials
• fast-growing plants• fertilizer• successive generations
of plants
b
B b
B
B b
b
B = Brown eyes
= Female
= Male
b = Blue eyes
— or —
Figure 1
Cop
yrig
ht ©
by
Gle
ncoe
/McG
raw
-Hill
, a d
ivis
ion
of th
e M
cGra
w-H
ill C
ompa
nies
, Inc
.
Interpret Your Data1. Look at the trait survey forms that you completed. Note any trends in how the traits are passed on.
2. Draw a pedigree for each trait.
Predicting the Traits of Offspring, continued4
20 ACTIVITY 4 GUIDED INQUIRY LAB MANUAL
ActivityActivity
Name Date Class
should be able to examine both your pet’sparents and grandparents, as well as itsbrothers or sisters.
3. Work with your lab partners to write a list ofsteps that you will follow for your inquiry.
4. Make a list of the traits that you want to study.Remember that some traits are learned andsome are inherited. For this inquiry activity, youwill consider only inherited traits.
5. Have your teacher approve your plan beforeyou begin.
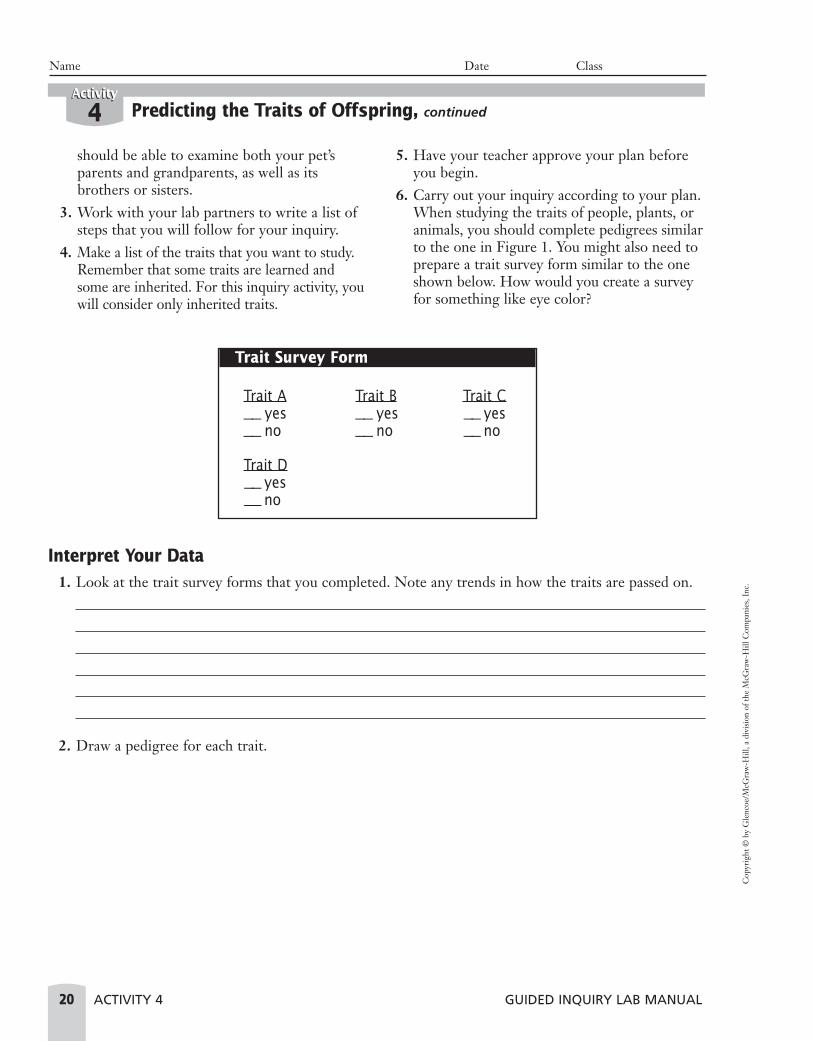
6. Carry out your inquiry according to your plan.When studying the traits of people, plants, oranimals, you should complete pedigrees similarto the one in Figure 1. You might also need toprepare a trait survey form similar to the oneshown below. How would you create a surveyfor something like eye color?
Trait Survey Form
Trait A Trait B Trait C__ yes __ yes __ yes__ no __ no __ no
Trait D__ yes__ no

Cop
yrig
ht ©
by
Gle
ncoe
/McG
raw
-Hill
, a d
ivis
ion
of th
e M
cGra
w-H
ill C
ompa
nies
, Inc
.
3. Look at the pedigrees that you drew. Which traits occurred most often? Which traits skipped a generation?
4. What percentage of the people, animals, or plants that you studied had the same form of a specifictrait? Calculate the percentage by dividing the number of subjects with the same form of the trait bythe total number of subjects.
Conclude and Apply1. Based on your survey, describe the possible forms that occurred for each trait on your list. What is
the probability that each trait will be passed on to the next generation?
2. Compare the results of your inquiry with those of other groups in your class. Based on what youlearned, do you feel that it is possible to make a good prediction about the traits a new offspring willhave if you know the traits of its recent ancestors? Explain why or why not.
Predicting the Traits of Offspring, continued4
GUIDED INQUIRY LAB MANUALL ACTIVITY 4 21
ActivityActivity
Name Date Class

Cop
yrig
ht ©
by
Gle
ncoe
/McG
raw
-Hill
, a d
ivis
ion
of th
e M
cGra
w-H
ill C
ompa
nies
, Inc
.
Going FurtherWhat do you think was the greatest limitation in your study of inherited traits? What are some ways thatyou could overcome this limitation in future studies? What are some additional studies that could beconducted?
Predicting the Traits of Offspring, continued4
22 ACTIVITY 4 GUIDED INQUIRY LAB MANUAL
ActivityActivity
Name Date Class

GUIDED INQUIRY LAB MANUAL ACTIVITY 5 23
Cop
yrig
ht ©
by
Gle
ncoe
/McG
raw
-Hill
, a d
ivis
ion
of th
e M
cGra
w-H
ill C
ompa
nies
, Inc
.
Discovering Your Learning StyleActivity
5Activity
Name Date Class
Do you often repeat your notes aloud to yourself while studying? Youmight be an auditory learner. Do you take frequent breaks to get up andmove around while studying? You might be a kinesthetic learner. Do youusually form a mental picture of the information that you are trying to remember? You might be a visual learner.
BackgroundHow people process and remember incoming information has been a topic ofstudy for many years in the fields of education and psychology. There are severaltheories or models that exist to help explain how people analyze and catalog newinformation. One theory of learning style is based on the idea that peopleinterpret and remember information using three modes—auditory or hearing,visual or seeing, and kinesthetic/tactile or moving/touching. Most people use allthree modes to process information; however, for many, one mode might bestronger than the other two. For example, some people might find it is easiest tolearn new material by hearing it and then repeating it back to themselves. Theymight find it harder to process new information by just reading the material.People who are strongly kinesthetic might find it is easier to remember if they aremoving while they learn. A strongly visual person might prefer to use flash cardsor charts and graphs to help him or her learn and remember new information.
QuestionWhat type of learning style(s) do you use?
Form a HypothesisThink about how you learn information in theclassroom and as you study. Now, make ahypothesis to answer the question above. Writeyour hypothesis in your Science Journal.
Safety Use all laboratory materials appropriately.
Test Your Hypothesis1. Think about the materials that have been
provided for you. Discuss with your labpartner(s) how you will test your hypothesis.
2. Think about the three types of learning listedin the introduction—visual, auditory, andkinesthetic. Design three separateexperiments to test each type of learning.Consider how to set up a control for eachexperiment. Identify what the independentand dependent variables for each experimentwill be. The experiments should be designedin such a way that the data from each shouldbe able to be compared to the other two.
Possible MaterialsEveryday Materials
• white index cards• colored index cards• highlighters• colored pens or
pencils
• table of randomnumbers
• common householdor classroom objects
• tray• two CDs or tapes of
different music
• tape player or CDplayer withheadphones
• dictionary• stopwatch/watch or
clock with a secondhand
Cop
yrig
ht ©
by
Gle
ncoe
/McG
raw
-Hill
, a d
ivis
ion
of th
e M
cGra
w-H
ill C
ompa
nies
, Inc
.
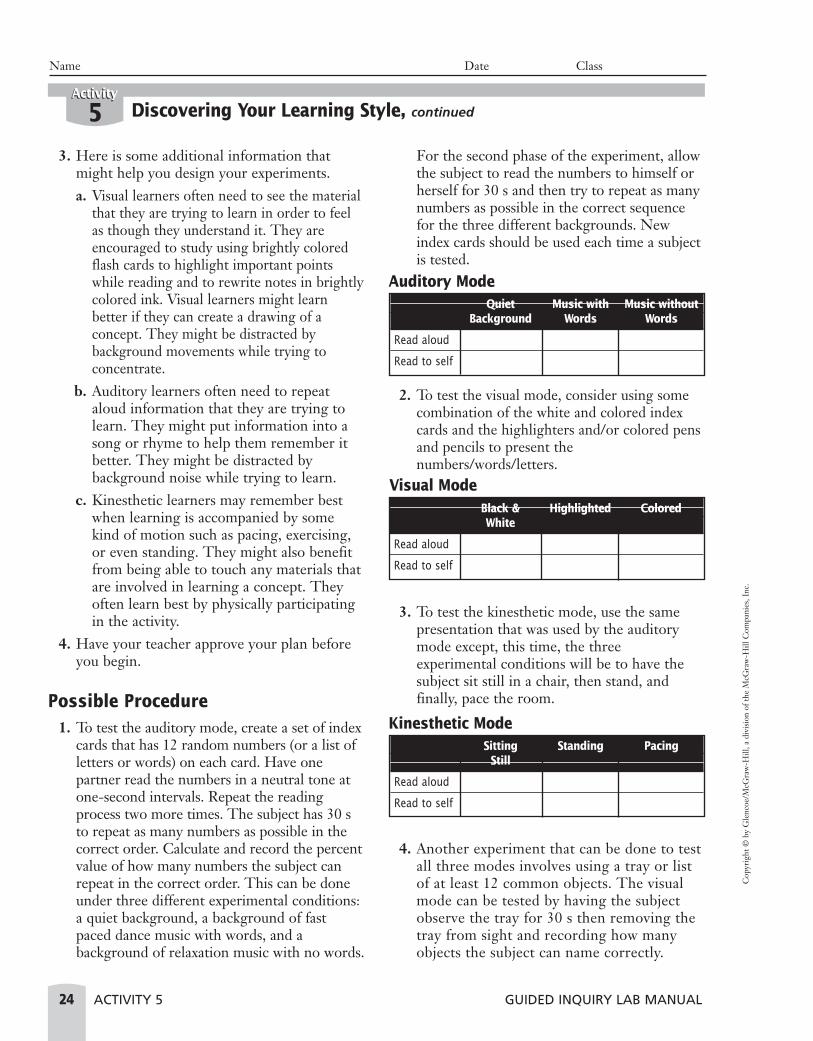
3. Here is some additional information thatmight help you design your experiments.a. Visual learners often need to see the material
that they are trying to learn in order to feelas though they understand it. They areencouraged to study using brightly coloredflash cards to highlight important pointswhile reading and to rewrite notes in brightlycolored ink. Visual learners might learnbetter if they can create a drawing of aconcept. They might be distracted bybackground movements while trying toconcentrate.
b. Auditory learners often need to repeataloud information that they are trying tolearn. They might put information into asong or rhyme to help them remember itbetter. They might be distracted bybackground noise while trying to learn.
c. Kinesthetic learners may remember bestwhen learning is accompanied by somekind of motion such as pacing, exercising,or even standing. They might also benefitfrom being able to touch any materials thatare involved in learning a concept. Theyoften learn best by physically participatingin the activity.
4. Have your teacher approve your plan beforeyou begin.
Possible Procedure 1. To test the auditory mode, create a set of index
cards that has 12 random numbers (or a list ofletters or words) on each card. Have onepartner read the numbers in a neutral tone atone-second intervals. Repeat the readingprocess two more times. The subject has 30 sto repeat as many numbers as possible in thecorrect order. Calculate and record the percentvalue of how many numbers the subject canrepeat in the correct order. This can be doneunder three different experimental conditions:a quiet background, a background of fastpaced dance music with words, and abackground of relaxation music with no words.
For the second phase of the experiment, allowthe subject to read the numbers to himself orherself for 30 s and then try to repeat as manynumbers as possible in the correct sequencefor the three different backgrounds. Newindex cards should be used each time a subjectis tested.
2. To test the visual mode, consider using somecombination of the white and colored indexcards and the highlighters and/or colored pensand pencils to present thenumbers/words/letters.
3. To test the kinesthetic mode, use the samepresentation that was used by the auditorymode except, this time, the threeexperimental conditions will be to have thesubject sit still in a chair, then stand, andfinally, pace the room.
4. Another experiment that can be done to testall three modes involves using a tray or listof at least 12 common objects. The visualmode can be tested by having the subjectobserve the tray for 30 s then removing thetray from sight and recording how manyobjects the subject can name correctly.
Discovering Your Learning Style, continued5
24 ACTIVITY 5 GUIDED INQUIRY LAB MANUAL
ActivityActivity
Name Date Class
Quiet Music with Music withoutBackground Words Words
Read aloud
Read to self
Auditory Mode
Black & Highlighted ColoredWhite
Read aloud
Read to self
Visual Mode
Sitting Standing PacingStill
Read aloud
Read to self
Kinesthetic Mode

Cop
yrig
ht ©
by
Gle
ncoe
/McG
raw
-Hill
, a d
ivis
ion
of th
e M
cGra
w-H
ill C
ompa
nies
, Inc
.
Discovering Your Learning Style, continued5
GUIDED INQUIRY LAB MANUAL ACTIVITY 5 25
ActivityActivity
Name Date Class
Experimental Condition Percent of ObjectsRecalled Correctly
LookingListeningTouching
Interpret Your Data1. Construct graphs that allow you to compare data collected from each experiment.
2. Is your hypothesis supported by the data? Why or why not?
Object Recall
The auditory mode can be tested by reading a listof similar objects and recording how many thesubject can recall. The kinesthetic mode can betested by allowing the subject to touch the itemson the tray, then removing the tray from view, andrecording how many items the subject can recall.Use a different set of items for each portion of theexperiment and calculate the percent of objectsthat the subject was able to recall correctly.

Cop
yrig
ht ©
by
Gle
ncoe
/McG
raw
-Hill
, a d
ivis
ion
of th
e M
cGra
w-H
ill C
ompa
nies
, Inc
.
Conclude and Apply1. What conclusion can you reach about your learning style?
2. What factors other than learning style could affect the outcome of the experiment?
3. How can you use what you discovered about your learning styles to your advantage?
4. Do you think the learning style you identified in this experiment is always the primary way youlearn? Why or why not?
Going FurtherDesign an experiment that will allow you to further refine your understanding of learning styles.
Discovering Your Learning Style, continued5
26 ACTIVITY 5 GUIDED INQUIRY LAB MANUAL
ActivityActivity
Name Date Class
GUIDED INQUIRY LAB MANUAL ACTIVITY 6 27
Cop
yrig
ht ©
by
Gle
ncoe
/McG
raw
-Hill
, a d
ivis
ion
of th
e M
cGra
w-H
ill C
ompa
nies
, Inc
.
Plant AdaptationsActivity
6Activity
Name Date Class
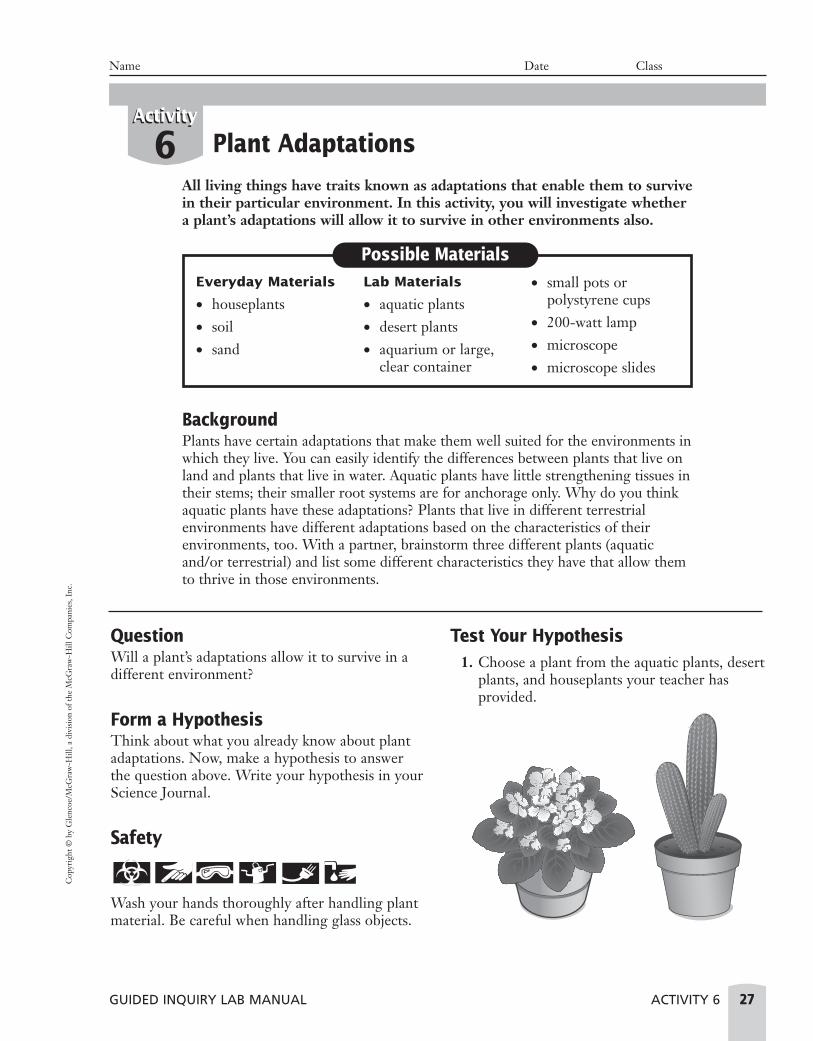
All living things have traits known as adaptations that enable them to survivein their particular environment. In this activity, you will investigate whethera plant’s adaptations will allow it to survive in other environments also.
BackgroundPlants have certain adaptations that make them well suited for the environments inwhich they live. You can easily identify the differences between plants that live onland and plants that live in water. Aquatic plants have little strengthening tissues intheir stems; their smaller root systems are for anchorage only. Why do you thinkaquatic plants have these adaptations? Plants that live in different terrestrialenvironments have different adaptations based on the characteristics of theirenvironments, too. With a partner, brainstorm three different plants (aquaticand/or terrestrial) and list some different characteristics they have that allow themto thrive in those environments.
QuestionWill a plant’s adaptations allow it to survive in adifferent environment?
Form a HypothesisThink about what you already know about plantadaptations. Now, make a hypothesis to answerthe question above. Write your hypothesis in yourScience Journal.
Safety
Wash your hands thoroughly after handling plantmaterial. Be careful when handling glass objects.
Test Your Hypothesis1. Choose a plant from the aquatic plants, desert
plants, and houseplants your teacher hasprovided.
Possible MaterialsEveryday Materials
• houseplants• soil• sand
Lab Materials
• aquatic plants• desert plants• aquarium or large,
clear container
• small pots orpolystyrene cups
• 200-watt lamp• microscope• microscope slides
Cop
yrig
ht ©
by
Gle
ncoe
/McG
raw
-Hill
, a d
ivis
ion
of th
e M
cGra
w-H
ill C
ompa
nies
, Inc
.
2. Discuss with your lab partners the type ofenvironment for which your plant is bestsuited. Use reference materials to findinformation about your plant.
3. Observe the characteristics of your plant thatyou can see without harming it. Are its leaveslarge or small? What type of stem does ithave? What adaptations can you observe that allow your plant to live in its naturalenvironment? Are there other adaptations thatyou might be able to see with a microscope?
4. What effect would there be on your plant ifyou placed it in a different environment?Decide with your lab partners whichenvironment you would like to provide foryour plant.
5. Look at the list of materials provided for thisactivity. How can you use these or othermaterials to create the different environment?
Write a plan for your investigation. Rememberto include details about how long yourinvestigation will last, how you will care for yourplant, and what observations you will make.
6. Have your teacher approve your plan beforeyou begin.
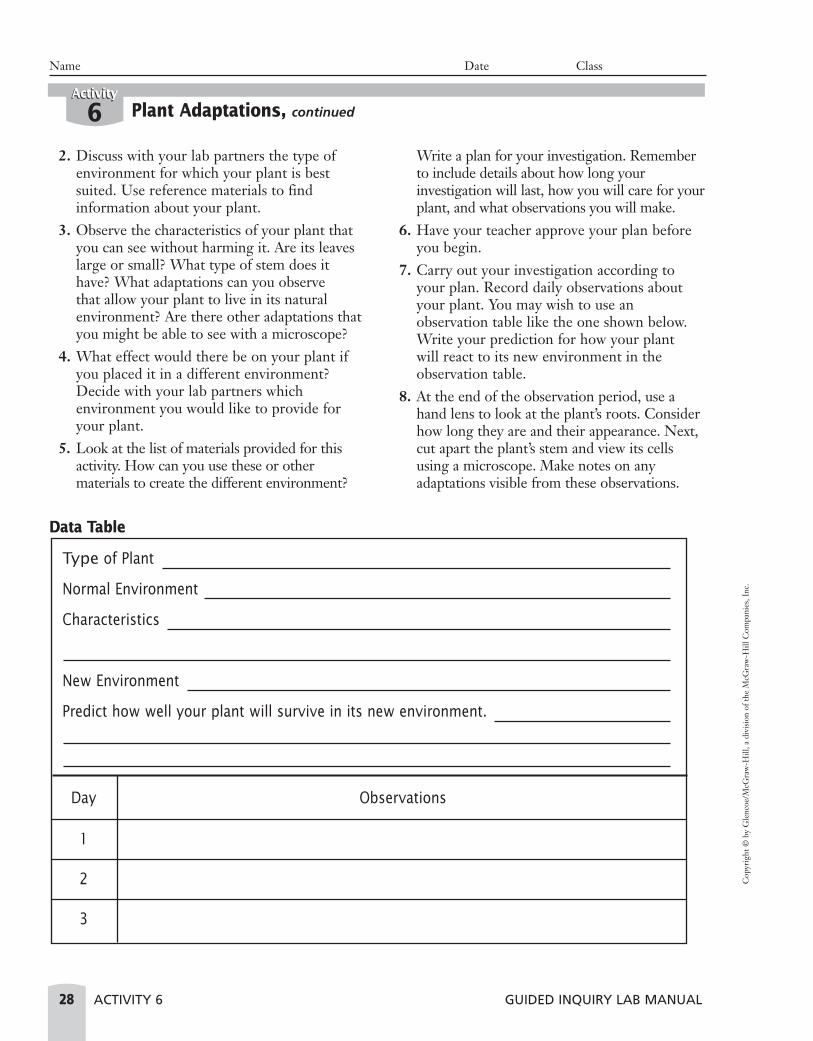
7. Carry out your investigation according toyour plan. Record daily observations aboutyour plant. You may wish to use anobservation table like the one shown below.Write your prediction for how your plant will react to its new environment in theobservation table.
8. At the end of the observation period, use ahand lens to look at the plant’s roots. Considerhow long they are and their appearance. Next,cut apart the plant’s stem and view its cellsusing a microscope. Make notes on anyadaptations visible from these observations.
Plant Adaptations, continued6
28 ACTIVITY 6 GUIDED INQUIRY LAB MANUAL
ActivityActivity
Name Date Class
Type of Plant
Normal Environment
Characteristics
New Environment
Predict how well your plant will survive in its new environment.
Day Observations
1
2
3
Data Table

Cop
yrig
ht ©
by
Gle
ncoe
/McG
raw
-Hill
, a d
ivis
ion
of th
e M
cGra
w-H
ill C
ompa
nies
, Inc
.
Interpret Your Data1. Which type of plant did you study, and what is its natural environment?
2. Name some characteristics of your plant that you feel are important adaptations enabling it to live inits natural environment.
3. Describe the new environment that you provided for your plant.
4. Explain how you cared for your plant.
5. Review the chart you made for observing your plant in its new environment. Did your plant survivewell in this environment? Explain.
6. Did you prove or disprove your hypothesis? Explain.
Plant Adaptations, continued6
GUIDED INQUIRY LAB MANUAL ACTIVITY 6 29
ActivityActivity
Name Date Class

Cop
yrig
ht ©
by
Gle
ncoe
/McG
raw
-Hill
, a d
ivis
ion
of th
e M
cGra
w-H
ill C
ompa
nies
, Inc
.
Conclude and Apply1. Think about your plant’s adaptations and how these adaptations enable the plant to survive in its
natural environment. Explain how each of these adaptations either helped or hurt the plant in itsnew environment.
2. Compare your results with those of your classmates. Write a general statement that describes theclass results.
Going FurtherCreate a computer graphics presentation describing your experiment. If possible, include photographsshowing the condition of your plant. Be sure to summarize your results.
Plant Adaptations, continued6
30 ACTIVITY 6 GUIDED INQUIRY LAB MANUAL
ActivityActivity
Name Date Class

GUIDED INQUIRY LAB MANUAL ACTIVITY 7 31
Cop
yrig
ht ©
by
Gle
ncoe
/McG
raw
-Hill
, a d
ivis
ion
of th
e M
cGra
w-H
ill C
ompa
nies
, Inc
.
Effects of Ozone DepletionActivity
7Activity
Name Date Class
Earth’s atmosphere consists of many different gases, one of which is ozone.Ozone gas is formed as ultraviolet light from the sun breaks apart oxygenmolecules into single oxygen atoms. These single oxygen atoms combinewith molecules of oxygen to form ozone (O3). Although ozone exists insmall quantities high in Earth’s atmosphere, it plays a vital role in protect-ing Earth’s surface from harmful ultraviolet (UV) radiation, particularlyUVB and UVC radiation.
BackgroundWhen substances such as chlorofluorocarbons(CFCs) and halons reach the stratosphere, they candestroy ozone. These gases were once used in thecoolant systems of refrigerators and air conditionersas well as the manufacture of aerosol cans and fireextinguishers. Other, natural processes, such asvolcanic eruptions that release aerosols into theatmosphere, can also destroy ozone. Satellitemeasurements of the total atmospheric ozoneduring the years 1974 to 1993 show an averageglobal decrease in total ozone of about 2% perdecade. The eruption of Mt. Pinatubo in thePhillipines in 1991 also had an effect onatmospheric ozone. The aerosols produced by theeruption caused a short-term decrease in globallyaveraged ozone by about 6% over the years 1991 to1994. As a result of this decreased ozone coverage,more UVB radiation is reaching Earth’s surface.The Environmental Protection Agency estimatesthat each percent of ozone reduction results in a1.5% to 2% increase in the amount of UVBradiation reaching Earth’s surface.
The medium-length waves of UVB radiation areknown to cause damage to DNA that can result inskin cancer in humans and other animals. Exposureto UVB radiation can also increase the risk ofcataract development and aggravate certain skinconditions. Immune system function may decrease.
If exposure to UVB radiation can pose a threatto humans and animals, what impacts might ithave on plants? Brainstorm some ways you thinkplants might be impacted by increased exposure toUVB rays. Why might they experience theseresults? Don’t forget to include both terrestrialand aquatic plants.
QuestionWhat effect does UVB radiation have onterrestrial plants?
Form a HypothesisThink about what you already know about UVBradiation. Now, form a hypothesis to answer thequestion above. Write your hypothesis in yourScience Journal.
Possible MaterialsEveryday Materials
• soil• water• plastic planters• scissors• wooden stakes• heavy-duty string
• clock/timer• ruler
Lab Materials
• seeds for severalspecies of plants, orpartially grownplants
• fertilizer• 500-mL beaker• UVB screen• UVB light source• thermometer• drying oven• balance
Cop
yrig
ht ©
by
Gle
ncoe
/McG
raw
-Hill
, a d
ivis
ion
of th
e M
cGra
w-H
ill C
ompa
nies
, Inc
.
Safety
Always wash your hands immediately afterhandling plant material.
Test Your Hypothesis1. Think about the materials that have been
provided for you. How will you test yourhypothesis?
2. Make a list of steps that you will follow.Consider the following questions as youdesign your experiment:• How will you identify which plants are yours
and which treatment they are receiving?
• How will you care for the plants in termsof planting, watering, and fertilizing?
• How will you control variables such as theamount of water or fertilizer given to theplants? Do you want to monitor thetemperature in the area of eachexperimental condition?
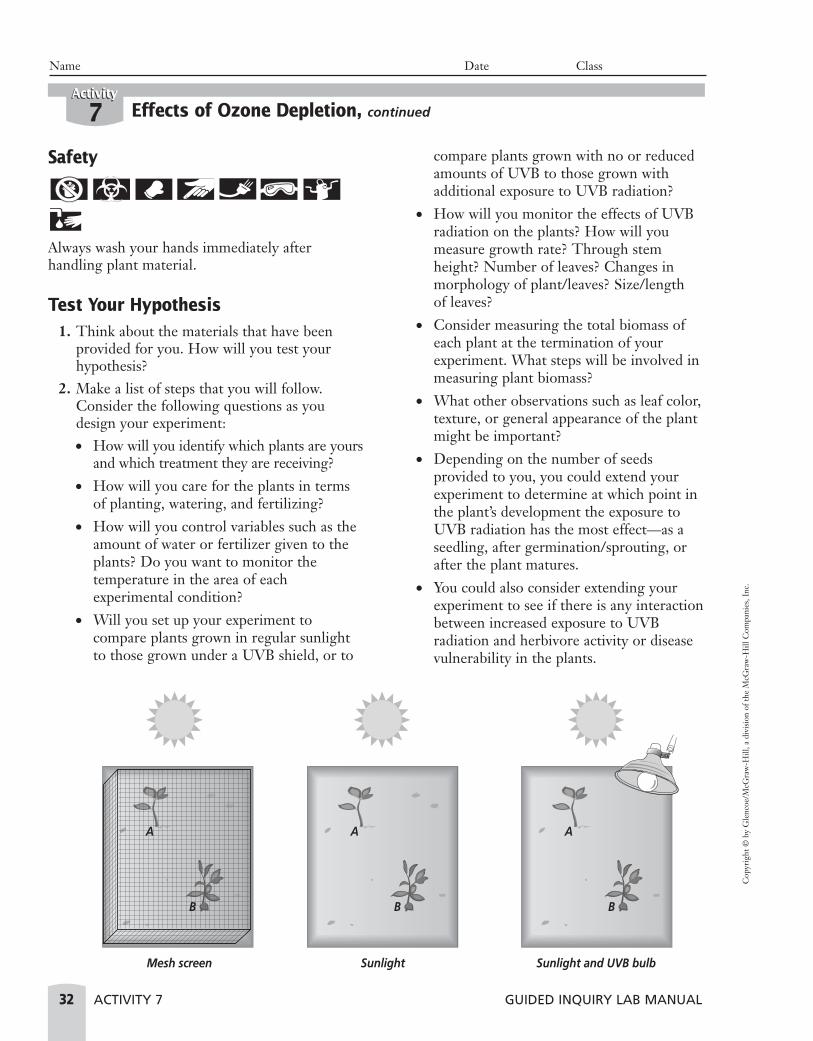
• Will you set up your experiment tocompare plants grown in regular sunlightto those grown under a UVB shield, or to
compare plants grown with no or reducedamounts of UVB to those grown withadditional exposure to UVB radiation?
• How will you monitor the effects of UVBradiation on the plants? How will youmeasure growth rate? Through stemheight? Number of leaves? Changes inmorphology of plant/leaves? Size/length of leaves?
• Consider measuring the total biomass ofeach plant at the termination of yourexperiment. What steps will be involved inmeasuring plant biomass?
• What other observations such as leaf color,texture, or general appearance of the plantmight be important?
• Depending on the number of seedsprovided to you, you could extend yourexperiment to determine at which point inthe plant’s development the exposure toUVB radiation has the most effect—as aseedling, after germination/sprouting, orafter the plant matures.
• You could also consider extending yourexperiment to see if there is any interactionbetween increased exposure to UVBradiation and herbivore activity or diseasevulnerability in the plants.
Effects of Ozone Depletion, continued7
32 ACTIVITY 7 GUIDED INQUIRY LAB MANUAL
ActivityActivity
Name Date Class
Mesh screen Sunlight
A
B
Sunlight and UVB bulb
A
B
A
B
Cop
yrig
ht ©
by
Gle
ncoe
/McG
raw
-Hill
, a d
ivis
ion
of th
e M
cGra
w-H
ill C
ompa
nies
, Inc
.
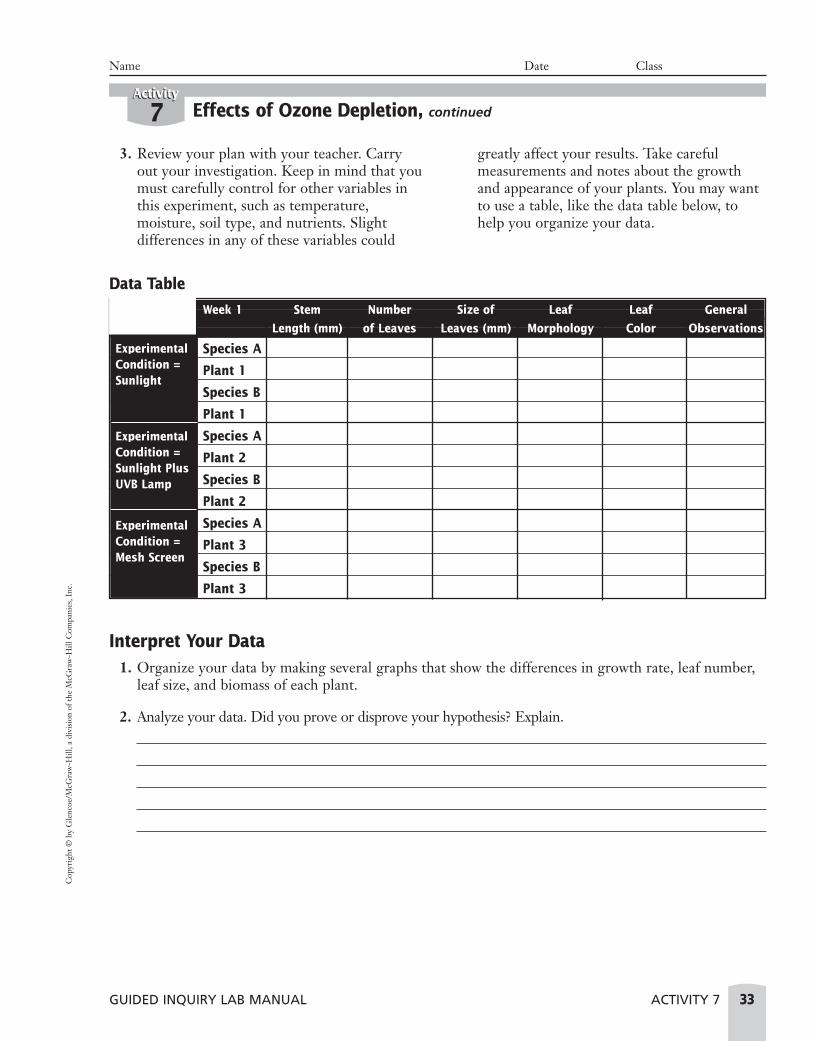
3. Review your plan with your teacher. Carryout your investigation. Keep in mind that youmust carefully control for other variables inthis experiment, such as temperature,moisture, soil type, and nutrients. Slightdifferences in any of these variables could
greatly affect your results. Take carefulmeasurements and notes about the growthand appearance of your plants. You may wantto use a table, like the data table below, tohelp you organize your data.
Effects of Ozone Depletion, continued7
GUIDED INQUIRY LAB MANUAL ACTIVITY 7 33
ActivityActivity
Name Date Class
Week 1 Stem Number Size of Leaf Leaf General
Length (mm) of Leaves Leaves (mm) Morphology Color Observations
Species A
Plant 1
Species B
Plant 1
Species A
Plant 2
Species B
Plant 2
Species A
Plant 3
Species B
Plant 3
ExperimentalCondition =Sunlight
ExperimentalCondition =Sunlight PlusUVB Lamp
ExperimentalCondition =Mesh Screen
Data Table
Interpret Your Data1. Organize your data by making several graphs that show the differences in growth rate, leaf number,
leaf size, and biomass of each plant.
2. Analyze your data. Did you prove or disprove your hypothesis? Explain.

Cop
yrig
ht ©
by
Gle
ncoe
/McG
raw
-Hill
, a d
ivis
ion
of th
e M
cGra
w-H
ill C
ompa
nies
, Inc
.
3. Compare your data from the two species of plants grown. Did one species show more resistance toUVB radiation? What are other explanations for differences in growth between the different species?
Conclude and Apply1. What effects can UVB light have on terrestrial plants?
2. Studies have shown that increased exposure to UVB radiation leads to decreased primary productivityin phytoplankton. Predict how this could affect all levels of the food chain in an ecosystem.
3. Describe possible solutions that could decrease the impact of increased UVB radiation on crop plants.
4. Design an experiment that would allow you to selectively breed plants that are resistant to the effectsof increased exposure to UVB radiation.
Going FurtherPrepare your project for presentation to another class. Include information on the current status of theozone layer and what individuals can do to help further reduce the rate of ozone destruction.
Effects of Ozone Depletion, continued7
34 ACTIVITY 7 GUIDED INQUIRY LAB MANUAL
ActivityActivity
Name Date Class

GUIDED INQUIRY LAB MANUAL ACTIVITY 8 35
Cop
yrig
ht ©
by
Gle
ncoe
/McG
raw
-Hill
, a d
ivis
ion
of th
e M
cGra
w-H
ill C
ompa
nies
, Inc
.
Measuring BiodiversityActivity
8Activity
Name Date Class
Biodiversity is defined as the total variety of life on Earth. The three levels of biodiver-sity are genetic diversity, species diversity, and ecosystem diversity. Genetic diversityrefers to genetic differences both within and between populations. Species diversity, orthe variety of species in an ecosystem, is sometimes called species richness. The varietyof ecosystems on Earth, ranging from rain forests to deserts to hydrothermal vents, isreferred to as ecosystem diversity. In this activity, you will focus on the species diversityof an ecosystem.
BackgroundSpecies diversity is the total number of species in an ecosystem, from familiar plants andanimals to microscopic bacteria and protists. Some areas of the world, such as tropicalrain forests and coral reefs, have higher species diversity than other areas do. For example,a five-square-kilometer area of rain forest in Peru contains over three times as manybutterfly species than are found in the entire United States. In this lab, you will comparethe species diversity of two different ecosystems in your area. You will survey small areaswithin each ecosystem using a quadrat similar to the one shown in Figure 1. You maychoose to compare any two ecosystems in your area. Examples include a grassy park, adowntown street, a desert, a sandy beach, or a forest. You may also choose to compare anytwo local aquatic ecosystems, such as a small pond, a tidal pool, a stream, or a large lake.
QuestionHow does species diversity differ between twoecosystems in your area?
Form a HypothesisThink about what you already know aboutbiodiversity and the different ecosystems in yourarea. Now, make a hypothesis to answer thequestion above. Write your hypothesis in yourScience Journal.
Safety
Always wash your hands immediately aftercompleting field or laboratory work. Wear glovesand appropriate clothing while you conduct yoursurvey. To avoid hazards in conducting field studies,don’t reach where you can’t see. If the vegetation ishigher than one foot, use a stick to check for hiddenhazards ahead of you. Avoid wearing perfumedproducts that will attract insects. Be alert and avoidpoisonous plants and animals.
Possible MaterialsEveryday Materials
• heavy-duty string• meterstick• scissors• small shovel or
gardening trowel
Lab Materials
• small weights orstakes
• identification booksfor plants, fungi,insects and otherinvertebrates, birds,etc.
• magnifying glass• collection jars• ring stand• paper funnel• 500-mL beaker
• 70% isopropylalcohol
• 60-watt lightbulb• dropper• microscope slides• compound light
microscope ordissectingmicroscope
• sieve
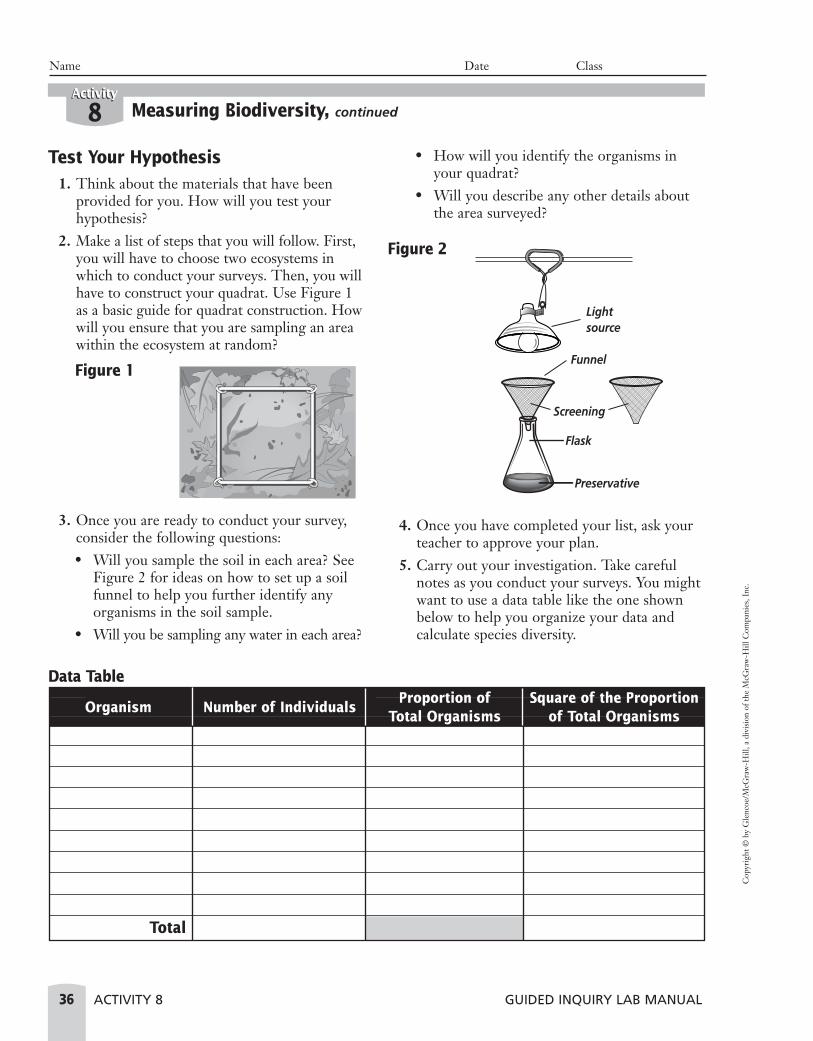
Cop
yrig
ht ©
by
Gle
ncoe
/McG
raw
-Hill
, a d
ivis
ion
of th
e M
cGra
w-H
ill C
ompa
nies
, Inc
.
Test Your Hypothesis1. Think about the materials that have been
provided for you. How will you test yourhypothesis?
2. Make a list of steps that you will follow. First,you will have to choose two ecosystems inwhich to conduct your surveys. Then, you willhave to construct your quadrat. Use Figure 1as a basic guide for quadrat construction. Howwill you ensure that you are sampling an areawithin the ecosystem at random?
3. Once you are ready to conduct your survey,consider the following questions:• Will you sample the soil in each area? See
Figure 2 for ideas on how to set up a soilfunnel to help you further identify anyorganisms in the soil sample.
• Will you be sampling any water in each area?
• How will you identify the organisms inyour quadrat?
• Will you describe any other details aboutthe area surveyed?
4. Once you have completed your list, ask yourteacher to approve your plan.
5. Carry out your investigation. Take carefulnotes as you conduct your surveys. You mightwant to use a data table like the one shownbelow to help you organize your data andcalculate species diversity.
Measuring Biodiversity, continued8
36 ACTIVITY 8 GUIDED INQUIRY LAB MANUAL
ActivityActivity
Name Date Class
Proportion of Square of the ProportionTotal Organisms of Total Organisms
Total
Funnel
Flask
Screening
Lightsource
Preservative
Data Table
Organism Number of Individuals
Figure 1
Figure 2

Cop
yrig
ht ©
by
Gle
ncoe
/McG
raw
-Hill
, a d
ivis
ion
of th
e M
cGra
w-H
ill C
ompa
nies
, Inc
.
Interpret Your Data1. Calculate the biodiversity of each area surveyed using the Simpson Diversity Index.
2. Compare the Simpson Diversity Index values for the two areas that you surveyed. Which area hashigher biodiversity? Do your data support your hypothesis? Explain why or why not.
Conclude and Apply1. Compare and contrast the characteristics of the two ecosystems that you studied. How are the char-
acteristics of each ecosystem related to the species diversity?
2. Compare your data to those of others in the class. What conclusions can be made from the similaritiesor differences in data?
Measuring Biodiversity, continued8
GUIDED INQUIRY LAB MANUAL ACTIVITY 8 37
ActivityActivity
Name Date Class

Cop
yrig
ht ©
by
Gle
ncoe
/McG
raw
-Hill
, a d
ivis
ion
of th
e M
cGra
w-H
ill C
ompa
nies
, Inc
.
3. Why is it important to conduct more than one survey within each ecosystem?
4. Explain why monitoring biodiversity is important.
Going FurtherResearch the influence of human activities on biodiversity. Share the results of your research with yourclass in the form of a multimedia presentation.
Measuring Biodiversity, continued8
38 ACTIVITY 8 GUIDED INQUIRY LAB MANUAL
ActivityActivity
Name Date Class

GUIDED INQUIRY LAB MANUAL ACTIVITY 9 39
Cop
yrig
ht ©
by
Gle
ncoe
/McG
raw
-Hill
, a d
ivis
ion
of th
e M
cGra
w-H
ill C
ompa
nies
, Inc
.
Effects of Water QualityChanges on Protists
Activity
9Activity
Name Date Class
Protists (Kingdom Protista) are an extremely diverse group of organisms.They exhibit a number of characteristics that set them apart from bacteria,plants, animals, and fungi. Protists can be one-celled organisms, likebacteria. But unlike bacteria, which are prokaryotes, protists are eukaryotes,and they can be multicellular. Many protists are too small to be seenwithout a magnifying lens. Others, such as slime molds and the algae thatmake up kelp forests, can be easily seen and may even be very large. Someprotists are photosynthetic organisms, while others are heterotrophs thatfeed on bacteria or other protists. Living in freshwater, salt water, soil richwith decaying matter, and other moist areas, many protists use flagella, cilia,or pseudopodia to move around. Examples of protists you may be familiarwith are shown in Figure 1.
BackgroundIn freshwater ecosystems, protists are important organisms at or near the base ofthe food chain. Photosynthetic protists contribute to the total amount of primaryproduction. Others provide a link between primary producers and consumers andlarger, secondary consumers, such as fish. Freshwater protists are affected by a number of variables. Freshwater protists areaffected by a number of variables. Thinking about what you have learned aboutanimals and their environments, brainstorm things that might affect a protist’sability to survive in its environment. Why is it important that we learn this? In thisactivity, you will investigate the effects of water quality changes on several species of protists.
Possible MaterialsEveryday Materials
• glass jars• silt/sand• vinegar• hot water bath
Lab Materials• cultures of a variety
of freshwaterprotists including(but not limited to)the following: Euglena gracilisAmoeba proteusParameciumcaudatumSynedra Volvox globatorChilomonas
• culture media forprotists
• liquid fertilizer• pH test strips• motor oil• houseplant pesticide• thermometer• droppers• protist-slowing
agent• microscope slides• compound light
microscope

Cop
yrig
ht ©
by
Gle
ncoe
/McG
raw
-Hill
, a d
ivis
ion
of th
e M
cGra
w-H
ill C
ompa
nies
, Inc
.
QuestionDoes a change in water quality affect protists?
Form a HypothesisForm a hypothesis to answer the question above.Write your hypothesis in your Science Journal.
Safety
Always wash your hands immediately afterhandling chemicals such as pesticides andfertilizers. Wear goggles, gloves, and appropriateclothing while you conduct your experimentsusing hazardous chemicals. Do not touch yourface while conducting science activities.
Test Your Hypothesis1. Think about the materials that have been
provided for you. How will you test yourhypothesis?
2. Make a list of steps that you will follow.Consider the following statements andquestions as you plan your experiment:• Identify the independent and dependent
variables of the experiment. How will youmaintain a control throughout theexperiment? How will you manipulate the
independent variable for each experimentalcondition?
• How will you monitor the number oforganisms in each experimental condition?You will need an initial estimate andfrequent estimates throughout the courseof the experiment. How often will youdetermine the number of organisms? Willyou return the sampled organisms to theculture after you have examined them?
• How will you use the materials providedfor you to model changes in water quality,such as the addition of nutrients, pesticides,oil, and silt; changes in pH due to acidprecipitation; or increased watertemperature due to thermal pollution?
3. Once you have completed your list, ask yourteacher to approve your plan. Be sure toinclude any necessary safety measures.
4. Carry out your investigation. Make carefulcounts of the number of organisms for eachexperimental condition. You might want toorganize your data in a table like the onebelow. Construct a similar data table for eachorganism used in the experiment.
Effects of Water Quality Changes on Protists, continued9
40 ACTIVITY 9 GUIDED INQUIRY LAB MANUAL
ActivityActivity
Name Date Class
Estimated Number of Organisms/mLExperimentalConditionControlVinegarOilSiltNutrientsPesticideHeat
Data Table
Initial Day 1 Day 2 Day 3 Day 4 Day 5
Figure 1
Cop
yrig
ht ©
by
Gle
ncoe
/McG
raw
-Hill
, a d
ivis
ion
of th
e M
cGra
w-H
ill C
ompa
nies
, Inc
.
Interpret Your Data1. For each organism tested, use graph paper to make a line graph that shows how the number
of organisms changed through time. Label the horizontal axis Time (days) and the vertical axisEstimated Number of Organisms/mL. Use a different color line to represent the changes through timefor each experimental condition. Make a legend to identify which experimental condition each color represents.
2. Analyze your tables and graphs. Were any of the organisms affected by the changes in water quality?Which organisms were most affected? By which experimental condition? Did the results of theexperiment support your hypothesis?
Conclude and Apply1. Compare your data to those of your classmates. What additional factors were investigated? Based on
the class’s pool of data, what can you conclude about the effects of water quality changes on protists?
2. Did your results prove or dispove your hypothesis? Explain. Did the class’s results prove or disproveyour hypothesis? Explain.
Effects of Water Quality Changes on Protists, continued9
GUIDED INQUIRY LAB MANUAL ACTIVITY 9 41
ActivityActivity
Name Date Class

Cop
yrig
ht ©
by
Gle
ncoe
/McG
raw
-Hill
, a d
ivis
ion
of th
e M
cGra
w-H
ill C
ompa
nies
, Inc
.
3. Predict how changes in the protist population of a given body of water could affect other organisms.
4. Can protists be used as bioindicators of changes in water quality? Based on the results of your exper-iment, which organism would you choose to use as a bioindicator?
Going FurtherDesign an experiment that will allow you to determine which species of protists are useful as bioindicators.
Effects of Water Quality Changes on Protists, continued9
42 ACTIVITY 9 GUIDED INQUIRY LAB MANUAL
ActivityActivity
Name Date Class
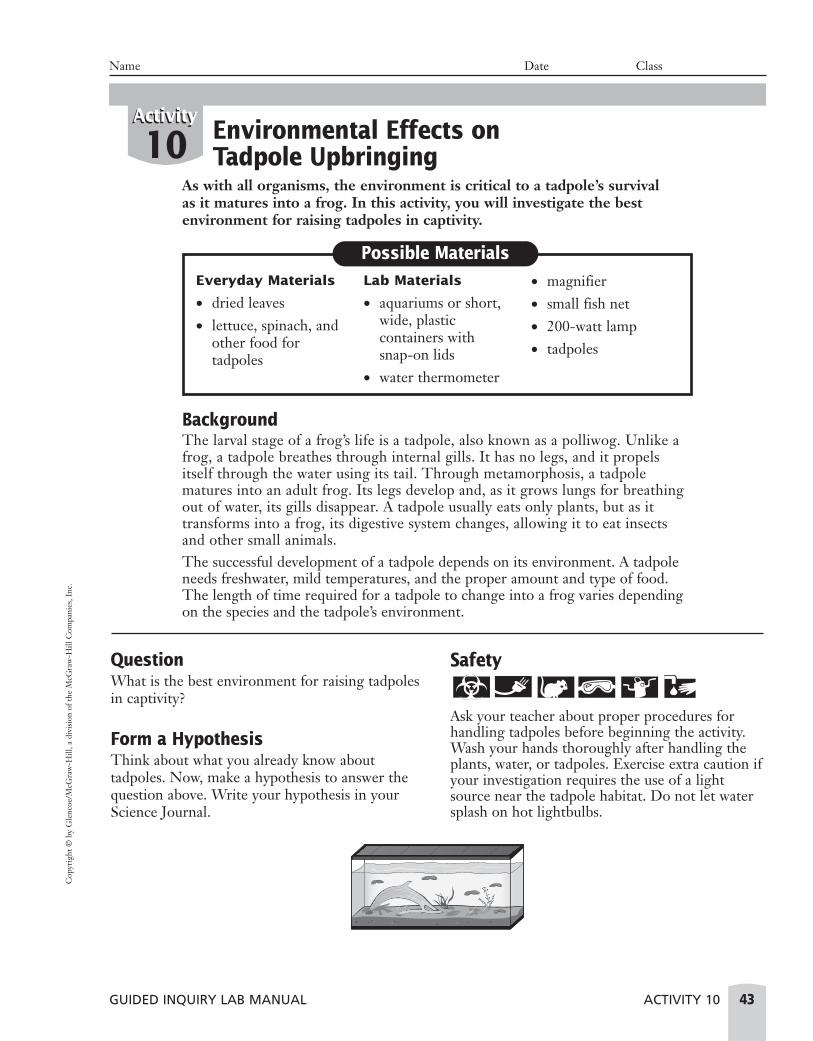
GUIDED INQUIRY LAB MANUAL ACTIVITY 10 43
Cop
yrig
ht ©
by
Gle
ncoe
/McG
raw
-Hill
, a d
ivis
ion
of th
e M
cGra
w-H
ill C
ompa
nies
, Inc
.
Environmental Effects onTadpole Upbringing
Activity
10Activity
Name Date Class
As with all organisms, the environment is critical to a tadpole’s survival as it matures into a frog. In this activity, you will investigate the best environment for raising tadpoles in captivity.
BackgroundThe larval stage of a frog’s life is a tadpole, also known as a polliwog. Unlike afrog, a tadpole breathes through internal gills. It has no legs, and it propelsitself through the water using its tail. Through metamorphosis, a tadpolematures into an adult frog. Its legs develop and, as it grows lungs for breathingout of water, its gills disappear. A tadpole usually eats only plants, but as ittransforms into a frog, its digestive system changes, allowing it to eat insectsand other small animals.The successful development of a tadpole depends on its environment. A tadpoleneeds freshwater, mild temperatures, and the proper amount and type of food.The length of time required for a tadpole to change into a frog varies dependingon the species and the tadpole’s environment.
QuestionWhat is the best environment for raising tadpolesin captivity?
Form a HypothesisThink about what you already know abouttadpoles. Now, make a hypothesis to answer thequestion above. Write your hypothesis in yourScience Journal.
Safety
Ask your teacher about proper procedures forhandling tadpoles before beginning the activity.Wash your hands thoroughly after handling theplants, water, or tadpoles. Exercise extra caution ifyour investigation requires the use of a lightsource near the tadpole habitat. Do not let watersplash on hot lightbulbs.
Possible MaterialsEveryday Materials
• dried leaves• lettuce, spinach, and
other food fortadpoles
Lab Materials
• aquariums or short,wide, plasticcontainers withsnap-on lids
• water thermometer
• magnifier• small fish net• 200-watt lamp• tadpoles

Cop
yrig
ht ©
by
Gle
ncoe
/McG
raw
-Hill
, a d
ivis
ion
of th
e M
cGra
w-H
ill C
ompa
nies
, Inc
.
Test Your Hypothesis1. Before beginning this project, research
tadpoles to learn about proper care andfeeding. Contact local wildlife experts and askabout regulations regarding obtaining tadpolesand releasing frogs into ponds. Talk with yourteacher about where you will obtain thetadpoles and what will happen to the tadpolesor frogs when the project is completed.
2. For this inquiry activity, you will examine thebest conditions for raising tadpoles in captivity.Discuss with your lab partners which variableyou want to investigate, and which conditionsyou want to keep constant. You might want toconsider the temperature, food, lighting, ornumber of tadpoles kept in a container.
3. Make a list of the steps you will follow in yourinvestigation. Think about what properties youwill observe when determining the tadpoles’
response to various environmental conditions.How long will you observe your tadpoles?Remember that you must use a control groupin your investigation. In your plan, be sure toinclude any necessary safety measures.
4. Have your teacher approve your plan for the activity.
5. Prepare the habitats that you will use for yourtadpoles. Be sure to vary only one conditionof the environment. When the habitats areready, obtain the tadpoles according to yourteacher’s instructions. In your Science Journal,note any differences you find in the tadpoles,for example, species or size. At the end of theexperiment, you may want to examine anysuch differences in relation to your findings.
6. Carry out the investigation of the tadpole’senvironment. Record your observationscarefully. You might want to use a table likethe data table below.
Environmental Effects on Tadpole Upbringing, continued10
44 ACTIVITY 10 GUIDED INQUIRY LAB MANUAL
ActivityActivity
Name Date Class
Tadpole Growth and Well-BeingControl Group Conditions:
Experimental Group Conditions:
Date Control Group Experimental Group
Data Table

Cop
yrig
ht ©
by
Gle
ncoe
/McG
raw
-Hill
, a d
ivis
ion
of th
e M
cGra
w-H
ill C
ompa
nies
, Inc
.
Interpret Your Data1. How did the condition of the control group of tadpoles change throughout your investigation?
2. How did the condition of your experimental group of tadpoles change throughout your investigation?
3. Did any unplanned events occur during your investigation that might have affected your results? If so, what were they?
4. Make a Venn diagram below comparing changes in the overall conditions of your control group andyour experimental group.
Environmental Effects on Tadpole Upbringing, continued10
GUIDED INQUIRY LAB MANUAL ACTIVITY 10 45
ActivityActivity
Name Date Class
Control Group
Experimental Group

Cop
yrig
ht ©
by
Gle
ncoe
/McG
raw
-Hill
, a d
ivis
ion
of th
e M
cGra
w-H
ill C
ompa
nies
, Inc
.
Conclude and Apply1. Compare and contrast how the conditions of your control group and your experimental group
changed.
2. Which group seemed to thrive better? Explain.
3. Summarize the results of your investigation.
4. If you could extend or repeat your investigation, what would you do? Why?
5. Look over the results obtained by other groups in your classroom. Compare your group’s results tothose of the other groups. Write a summary of what you think are the best environmental conditionsfor raising tadpoles in captivity.
Going FurtherUse computer graphics software to prepare an instructional booklet for raising tadpoles in captivity.
Environmental Effects on Tadpole Upbringing, continued10
46 ACTIVITY 10 GUIDED INQUIRY LAB MANUAL
ActivityActivity
Name Date Class
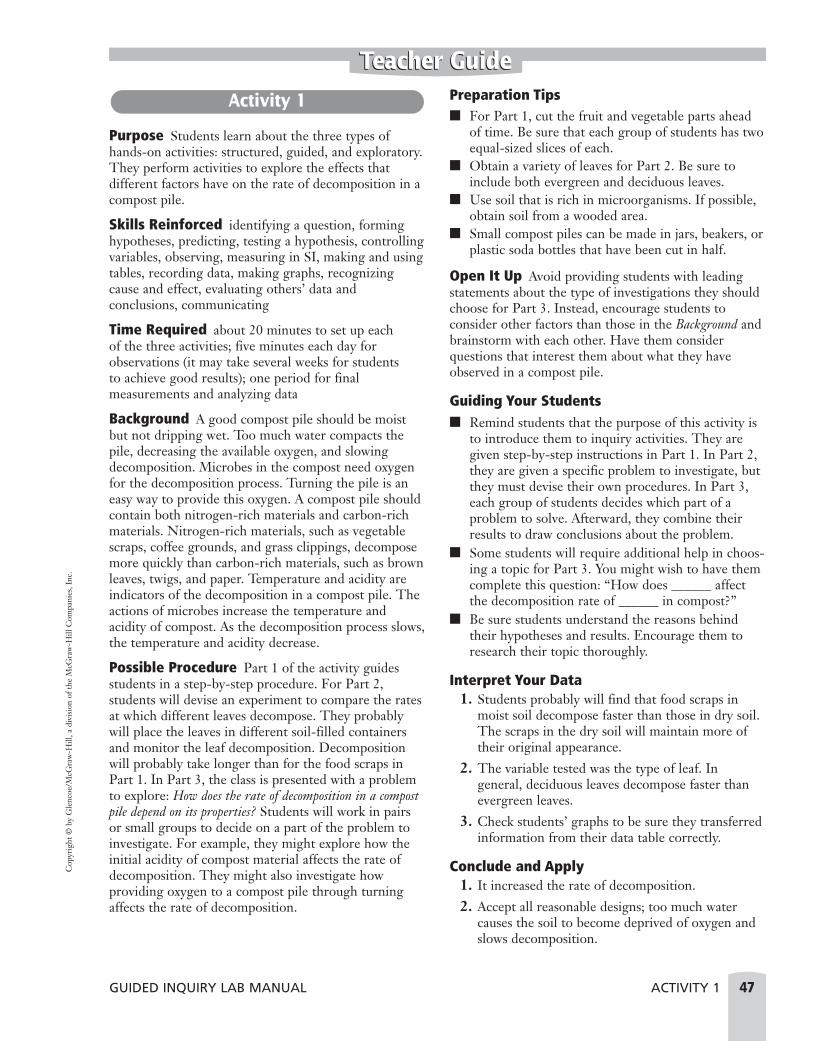
Cop
yrig
ht ©
by
Gle
ncoe
/McG
raw
-Hill
, a d
ivis
ion
of th
e M
cGra
w-H
ill C
ompa
nies
, Inc
.
Purpose Students learn about the three types ofhands-on activities: structured, guided, and exploratory.They perform activities to explore the effects thatdifferent factors have on the rate of decomposition in acompost pile.
Skills Reinforced identifying a question, forminghypotheses, predicting, testing a hypothesis, controllingvariables, observing, measuring in SI, making and usingtables, recording data, making graphs, recognizingcause and effect, evaluating others’ data andconclusions, communicating
Time Required about 20 minutes to set up each of the three activities; five minutes each day forobservations (it may take several weeks for students to achieve good results); one period for finalmeasurements and analyzing data
Background A good compost pile should be moistbut not dripping wet. Too much water compacts thepile, decreasing the available oxygen, and slowingdecomposition. Microbes in the compost need oxygenfor the decomposition process. Turning the pile is aneasy way to provide this oxygen. A compost pile shouldcontain both nitrogen-rich materials and carbon-richmaterials. Nitrogen-rich materials, such as vegetablescraps, coffee grounds, and grass clippings, decomposemore quickly than carbon-rich materials, such as brownleaves, twigs, and paper. Temperature and acidity areindicators of the decomposition in a compost pile. Theactions of microbes increase the temperature andacidity of compost. As the decomposition process slows,the temperature and acidity decrease.
Possible Procedure Part 1 of the activity guidesstudents in a step-by-step procedure. For Part 2,students will devise an experiment to compare the ratesat which different leaves decompose. They probablywill place the leaves in different soil-filled containersand monitor the leaf decomposition. Decompositionwill probably take longer than for the food scraps inPart 1. In Part 3, the class is presented with a problemto explore: How does the rate of decomposition in a compostpile depend on its properties? Students will work in pairsor small groups to decide on a part of the problem toinvestigate. For example, they might explore how theinitial acidity of compost material affects the rate ofdecomposition. They might also investigate howproviding oxygen to a compost pile through turningaffects the rate of decomposition.
Preparation Tips■ For Part 1, cut the fruit and vegetable parts ahead
of time. Be sure that each group of students has twoequal-sized slices of each.
■ Obtain a variety of leaves for Part 2. Be sure toinclude both evergreen and deciduous leaves.
■ Use soil that is rich in microorganisms. If possible,obtain soil from a wooded area.
■ Small compost piles can be made in jars, beakers, orplastic soda bottles that have been cut in half.
Open It Up Avoid providing students with leadingstatements about the type of investigations they shouldchoose for Part 3. Instead, encourage students toconsider other factors than those in the Background andbrainstorm with each other. Have them considerquestions that interest them about what they haveobserved in a compost pile.
Guiding Your Students■ Remind students that the purpose of this activity is
to introduce them to inquiry activities. They aregiven step-by-step instructions in Part 1. In Part 2,they are given a specific problem to investigate, butthey must devise their own procedures. In Part 3,each group of students decides which part of aproblem to solve. Afterward, they combine theirresults to draw conclusions about the problem.
■ Some students will require additional help in choos-ing a topic for Part 3. You might wish to have themcomplete this question: “How does ______ affectthe decomposition rate of ______ in compost?”
■ Be sure students understand the reasons behindtheir hypotheses and results. Encourage them toresearch their topic thoroughly.
Interpret Your Data1. Students probably will find that food scraps in
moist soil decompose faster than those in dry soil.The scraps in the dry soil will maintain more oftheir original appearance.
2. The variable tested was the type of leaf. Ingeneral, deciduous leaves decompose faster thanevergreen leaves.
3. Check students’ graphs to be sure they transferredinformation from their data table correctly.
Conclude and Apply1. It increased the rate of decomposition.
2. Accept all reasonable designs; too much watercauses the soil to become deprived of oxygen andslows decomposition.
Activity 1
GUIDED INQUIRY LAB MANUAL ACTIVITY 1 47
Teacher GuideTeacher Guide

Cop
yrig
ht ©
by
Gle
ncoe
/McG
raw
-Hill
, a d
ivis
ion
of th
e M
cGra
w-H
ill C
ompa
nies
, Inc
.
3. Answers will depend on the property that studentstest. As an example, students who test fortemperature may find that higher temperaturesresult in faster decomposition.
4. The class might conclude that the best conditionsare moist soil, the presence of a variety ofmaterials, and turning the soil to provide adequateoxygen. They might also notice that highertemperature and acidity indicate thatdecomposition has occurred.
5. An exploratory activity allows students to focus onone aspect of a problem. They learn more aboutthe problem by combining their results with theresults of others in the class. A second advantagemight be that students could follow up onexperimental results by designing anotherexperiment.
Going Further Remind students that learning from mistakes andunexpected results is an important way scientistsincrease their knowledge of a subject.
Purpose Students acquire problem-solving experienceas they construct their plankton nets and take theirsamples. Students master important biological conceptsas they interpret data and analyze relationships betweenvariables.
Skills Reinforced problem-solving, forminghypotheses, testing hypotheses, controlling variables,measuring, observing, collecting data, developingexplanations, communicating
Time Required one period to make plankton net;one period each week to analyze samples; one period toanalyze final data; student time outside of class tocollect samples
Background The cycles of phytoplankton andzooplankton populations are usually tied together in aclassic example of predator-prey interaction. Soon afterthe number of phytoplankton in an area increases, thenumber of zooplankton also will increase. As nutrientssuch as nitrates or phosphates become scarce, thephytoplankton die. As the number of phytoplanktondecreases, the number of zooplankton begins todecrease.
Possible Procedure Students cut the toe end of thenylon stocking and attach it to the sampling cup. Bendone piece of wire into a circle by twisting the two endsover each other. The mouth of the net can be made bycutting the nylon stocking at the top of the one leg and
attaching it to the wire. Four pieces of string of equallength are attached equidistant from each other aroundthe mouth. The four loose ends are tied together and onelonger piece of string is tied at the knot formed by theother three pieces.
To establish consistency and to be able to make arelative comparison of the number of organisms in eachsample, have students remove between 0.1 mL and 0.5 mL of water from each sample to view under themicroscope. They then count the number ofphytoplankton and zooplankton and attempt to identifysome organisms. Students can count the number ofphytoplankton and zooplankton for five drops of eachsample and take an average for the five drops. Afterfinding the average number of phytoplankton andzooplankton in the portion of the sample examinedunder the microscope, they can estimate the totalnumber in each milliliter of sample water. Students usethese and other data to construct graphs.
Alternate Procedure If your class does not haveaccess to a suitable body of water for this experiment, stu-dents can still learn to monitor plankton populations. Kitsfor culturing plankton in aquariums are available for pur-chase. These kits can contain both algae and rotifers—organisms that feed on the algae—as well as bottlednutrients that will help the organisms grow. If you decideto culture plankton, encourage students to form ahypothesis about the most favorable growing conditions.The background information still applies—the algae needlight and nutrients to flourish. By using two tanks, stu-dents can vary one growing condition (for example, theamount of light the tank receives) and compare theresults for the tanks. They will need to adapt their plank-ton nets to the small tank size; otherwise, the procedurefor harvesting and counting may be very similar to theone described in the project.
If the kits are too expensive or are not readilyavailable, consider seeding an aquarium with the waterfrom a mature fish tank, which contains manymicroorganisms. Students can first analyze the waterfrom the mature tank to see which microorganisms itcontains. They can then take two fresh tanks, vary onegrowing condition, and proceed as above.
Preparation Tips■ Review the concept of turnover and how it affects
plankton with students. ■ If applicable, order nitrate, phosphate, and other
test kits in advance.
Open It Up Ask students to think of other factors totest. What other questions arise during the project?Allow interested students to pursue these.
Activity 2
48 ACTIVITY 2 GUIDED INQUIRY LAB MANUAL
Teacher GuideTeacher Guide

Cop
yrig
ht ©
by
Gle
ncoe
/McG
raw
-Hill
, a d
ivis
ion
of th
e M
cGra
w-H
ill C
ompa
nies
, Inc
.
Guiding Your Students■ Encourage students to be creative in attaching the
sampling cup. Possible ways it can be attachedinclude wrapping a rubber band, tightening a plastictie, or tightly tying a piece of string just beneath thelip of the jar.
■ The nylon can be attached to the wire mouth of thenet by sewing it or stapling it. Some students maychoose to tape the two ends of the wire mouthtogether after twisting them together.
■ Students could test their completed nets in a basinof water in the lab.
■ Encourage students to learn how to use the net inthe water. When a sample is collected, the net shouldbe pulled slowly through water for the designatedperiod of time (approximately 3–5 minutes). If thewater has a current, the net can be held in one placefor the entire collection time.
Interpret Your Data1. Check to make sure that students correctly graph
the data in their tables.2. If a fall or spring bloom occurred in the water
sampled, graphs should show an increase in thenumber of phytoplankton and zooplankton,followed by a decrease in the numbers of eachover the sampling period. If nitrate and phosphatewere tested, the graph should show that as theamount of phytoplankton increased, theconcentration of these nutrients decreased.Answers about the correlation of other data andthe number of plankton will vary.
Conclude and Apply1. Hypotheses might include that rising nutrient
levels will lead to a phytoplankton bloom. Datashowing an increase in nutrient levels followed byincreasing phytoplankton counts would supportthis hypothesis.
2. Differences might result from different water beingsampled, human error, random error, or variationin plankton nets, sampling methods, countingmethods, or additional environmental factors.
3. As water temperature begins to rise in the spring,the surface water reaches maximum density andsinks. The deeper water that contains highconcentrations of nutrients, such as nitrates andphosphates, rises to the surface. This process isknown as spring turnover. The high nutrientconcentrations and the increasing intensity of lighteach day provide conditions that allowphytoplankton to flourish, resulting in a planktonbloom. Zooplankton populations will also increase
after a lag period. When the resources areexhausted, the plankton die. As the surface watercools in the fall, it reaches its highest density, andsinks. Once again, deeper water that contains highamounts of nutrients rises to the surface. A fallbloom is usually smaller than a spring bloom due tothe decreasing intensity of daylight.
4. The addition of nutrients from runoff can lead toan increase in the phytoplankton populationduring the bloom because nutrients are usually thelimiting resource in a plankton bloom. Thebacterial decomposition of the increased amountsof organic matter from the bloom can cause anunusually high oxygen demand. The resultinghypoxic or anoxic conditions can lead to fish kills.
Going Further Students might mention using computer applications tograph data as a tip for someone who is beginning theactivity. Students might also wonder about how to takeexact plankton counts. Have them research griddedslides and counting chambers for plankton.
Purpose Students will learn about how environmentalchanges can affect plasma membranes.
Skills Reinforced identifying a question, forminghypotheses, testing a hypothesis, observing, measuringin SI, making tables, making graphs
Time Required 45 minutes to plan the activity; 45 minutes to carry out the investigation; 30 minutes to answer conclusion questions
Background A plasma membrane is composedprimarily of fats and proteins. High temperatures,detergents, alcohols, salt, and acidity may degrade ordestroy the membrane. Under such conditions,substances may be able to pass through the plasmamembrane more easily, or the membrane may bedestroyed. Freezing may form ice crystals that rupturethe plasma membrane.
Possible Procedure Students will choose one methodfor observing the effects of environmental changes onplasma membranes. They will then choose one or moreenvironmental conditions to apply to the cells. Ifstudents use the beet root method of observing effectson plasma membranes, they should cut a small (about 1-cm square) chunk of beet root, rinse it thoroughly, andplace it in water (for heating) or the solution to betested. A color change after a few minutes will indicate ifplasma membrane damage has occurred and the cell
Activity 3
GUIDED INQUIRY LAB MANUAL ACTIVITY 3 49
Teacher GuideTeacher Guide
Cop
yrig
ht ©
by
Gle
ncoe
/McG
raw
-Hill
, a d
ivis
ion
of th
e M
cGra
w-H
ill C
ompa
nies
, Inc
.
contents have leaked out. If students use the yeast cellmethod, they should dissolve a few pinches of dry baker’syeast in water and place a drop of it on a microscopeslide. Next, they should add a drop of Congo red stainand observe the cells under a microscope at 400�. Red-colored cytoplasm indicates a structural change in theplasma membrane. Students should use a control for allinvestigations.
Preparation Tips■ Prepare yeast stain by adding 0.5 grams of Congo
red stain to 100 mL of distilled water.
■ Demonstrate the methods of testing the beet andyeast plasma membranes. You may also need todemonstrate the proper procedure for observingyeast cells under a microscope.
Open It Up Encourage each group to investigate adifferent environmental condition. During a classdiscussion, ask questions which will lead them to thinkof different possibilities. For example, ask, “What effectdoes acid rain have on a plant?” and “Why do orangegrowers sometimes lose their entire crops duringfreezing weather?” Relate these everyday situations tothe environmental effects on plasma membranes.
Guiding Your Students■ You will probably have to work closely with some
students if they study the effect on yeast cells. Thismethod of investigation may be better suited tomore capable students.
■ If students find that their investigation isn’t workingwell, help them re-evaluate their method.Encourage them to start over if time permits.
Interpret Your Data1. Students may answer high/low temperatures,
detergents, alcohols, salt, or acidity.2. Answers will vary, but many students will choose
to use beet roots and yeast cells.3. Answers will vary. If studying beet cells, students
will mention color changes in the liquid. Ifstudying yeast cells, students will mention colorchanges in the cytoplasm.
4. Students should be aware of limitations in theirinvestigation.
Conclude and Apply1. Students will probably find that each of the
environmental condition changes affects theplasma membranes to some extent. They shouldnot observe changes in their control cells.
2. Answers will vary, but students may suggest varyingtemperatures, varying chemicals exposed to thecells, or changing the pH of the cells’ environment.
3. Although the results only apply to the cells in thisstudy, most other cells are affected in a similarway. Students should understand that they cannotsay conclusively that other cells would react in asimilar way without further tests.
Going Further Have students write their description as a paragraphand present it to the class. If they have trouble thinkingof an application, encourage group discussions andfurther research.
Purpose Students will learn how traits in families canbe used to predict the traits of offspring.
Skills Reinforced forming hypotheses, predicting,testing a hypothesis, observing, comparing andcontrasting, drawing conclusions, calculating ratios
Time Required 45 minutes to plan the study; timefor the inquiry might range from one week for studies of people or pets to 5 months for plant studies; 45 minutes to analyze data and make conclusions
Background An offspring obtains half of its genesfrom its mother and half from its father. Alleles(different forms of a gene) may be dominant orrecessive. The offspring only will have the traitdetermined by the recessive allele if both of its allelesfor that trait are recessive. If the offspring has onedominant allele and one recessive allele for a trait, it iscalled a carrier. It will have the trait determined by thedominant allele. A carrier can pass either the dominantor the recessive allele to the next generation.
Possible Procedure Each group might choose toinvestigate traits of members of a family. They willmake a list of traits and survey each family memberabout the traits. Students then will make pedigrees andlook for patterns of occurrence for the traits. The classthen will compare their results and conclude how easilyit is to predict the traits of offspring.
Preparation Tips■ Discuss a sample pedigree with students to illustrate
how traits can be passed from one generation to the next.
■ Some students might choose to study the traits ofplants. You can obtain successive generations ofplants from nurseries. Alternatively, fast-growingplants are available from biological supply compa-nies. These plants can grow from seeds to mature,seed-bearing plants in about 40 days.
Open It Up Be sure that families, plants, and animalsare studied by different groups of the class. As students
Activity 4
50 ACTIVITY 4 GUIDED INQUIRY LAB MANUAL
Teacher GuideTeacher Guide

Cop
yrig
ht ©
by
Gle
ncoe
/McG
raw
-Hill
, a d
ivis
ion
of th
e M
cGra
w-H
ill C
ompa
nies
, Inc
.
work through the activity, encourage students to ask“Why?” questions about their inquiry. For example,they might ask, “Why doesn’t anyone in the familyhave black hair?” or “Why do all of the dogs that westudied have long, floppy ears?” Are there otherquestions about inherited traits that arise? Allowinterested students to explore these further.
Guiding Your Students■ Discourage students from studying too many traits.
■ Remind students that some traits, such as the needfor eyeglasses, might be hereditary or might becaused by events in a person’s life.
■ Students will not always be able to obtain informa-tion by direct observation. For example, they mightobtain information about an individual’s great-grandparents by asking the individual’s parentsabout the traits.
Interpret Your Data1. Students probably will notice that some traits have
more than one form. Other traits have only oneform and may skip generations.
2. Be sure that students’ pedigrees are coded to show different versions of traits and theoccurrence of traits.
3. Students should consider different versions ofindividual traits.
4. Answers will depend on the people, animals, orplants that students survey.
Conclude and Apply1. Students should mention different alleles for traits.
They also should mention whether the alleles aredominant or recessive. A probability is the ratio ofthe number of times a trait occurs divided by thenumber of individuals in the survey.
2. Students should realize that although traits can bepredicted, you can only be certain of an outcome ifboth parents have the recessive version of a certaintrait. Additionally, they may not have beenstudying traits that follow single genedominant/recessive expression. Students may alsonote that, if pedigree reveals either one or bothparents to be homozygous dominant, the offspringwill certainly express the dominant trait.
Going Further The major limitation of this study is that students willonly survey a few generations of a family. Long-termstudies would overcome this difficulty.
Purpose Students will investigate differences in how people perceive incoming information and whichsenses are used to help process and remember newinformation.
Skills Reinforced forming hypotheses, controllingvariables, testing hypotheses, collecting data, developingexplanations, making graphs, communicating
Time Required one period to set up experiments,one period each to conduct experiments for each of thethree categories, one period to analyze data
Background Walter Barbe and Raymond Swassingpresent a theory of learning style and memory based onthe idea that there are three fundamental modes usedwhen perceiving, processing, and rememberinginformation. Being aware of strength in a particularmode and incorporating it into his or her learningexperience can be useful to an individual.
Possible Procedure Students can work in groups oftwo, with each partner acting as both the tester and thesubject. Students can use a table of random numbers tomake a set of index cards with 12 numbers on eachcard. They should use a different index card for eachportion of the experiment. The cards can have a list ofrandom letters or words instead of numbers. Music canbe used in the background as a distraction during thetest for auditory learning. The colored index cards,highlighters, and colored pencils can be used in the testfor visual learning. The tray of objects can be used as asimple test to compare the three modes for eachindividual.
Preparation Tips■ Collect various items that can be displayed on the
trays in advance. Students will need enough varietyso that they can have up to 12 different items on thetray for each part of the experiment.
Open It Up Encourage your students to think of waysto quickly test a person’s learning: memorizing numbersor words, remembering items seen, listing the featuresof an object or person, etc.
Guiding Your Students■ Once students determine a learning exercise, have
them determine ways of presenting the exercise,emphasizing the three learning styles, and recordingtheir results.
Activity 5
GUIDED INQUIRY LAB MANUAL ACTIVITY 5 51
Teacher GuideTeacher Guide

Cop
yrig
ht ©
by
Gle
ncoe
/McG
raw
-Hill
, a d
ivis
ion
of th
e M
cGra
w-H
ill C
ompa
nies
, Inc
.
Interpret Your Data1. Check to make sure that students correctly graph
the data in their tables.
2. Student answers will vary but should reflect anunderstanding of learning styles and the student’sown personal strengths.
Conclude and Apply1. Student answers will vary. Some students might
discover an area of strength in one mode; othersmight find that they use all three modes almostequally.
2. Student answers will vary, but could include: beinghungry, tired, or anxious; not feeling well; learningcurve; or use of strategies for remembering.
3. Student answers will vary, but might includemodifying the way they review notes and study for tests.
4. Student answers will vary.
Going Further Student experiments will vary, but should demonstratean understanding of inquiry and the results of theexperiment just completed.
Purpose Students will learn about the importance ofplant adaptations to their environments.
Skills Reinforced organizing, forming hypotheses,predicting, testing a hypothesis, observing, making andusing tables, analyzing results, recognizing cause andeffect, drawing conclusions, computer skills
Time Required 45 minutes to plan the activity; twoweeks or more for the investigation; 45 minutes foranalyzing the results
Background Plants first evolved in the ocean. Aquaticplants are supported by water and have little need forstrengthening tissue in their stems. They can absorbnutrients directly, and they can reproduce by releasingsperm and egg cells into the water. The adaptation tolife on land meant that plants had to develop structuressuitable for a dry environment. At first the plants weresmall and nonvascular, like the mosses we see today.Gradually, plants developed a vascular system of internaltubes called xylem and phloem that allows water andnutrients to flow through the plant. Land plants alsohave stronger stems to support them in air, and mostland plants reproduce by seeds. Their extensive rootsystems absorb water and nutrients from the soil andanchor them securely in the ground. The leaves of land
plants have a waxy coating called a cuticle to preventwater loss, and they have stomata on the underside toallow the exchange of carbon dioxide and oxygen.
Possible Procedure Students will work in smallgroups to investigate whether a plant’s adaptations willallow it to survive in a different environment. Eachgroup will choose one plant to investigate. They willobserve characteristics of the plant and determine howthe plant is suited to its environment. Students willthen create a different environment for the plant andobserve how well its adaptations allow it to survive.Afterwards, they will dissect the plant to observeinternal adaptations of the plant.
Preparation Tips■ Obtain a collection of desert, aquatic, and house-
hold plants, or have each group obtain their own.Inexpensive aquatic plants, such as Elodea, are avail-able from pet supply stores.
■ Play sand can be purchased at hardware stores.
■ Students may choose to place their plants in a warm,lighted environment. Arrange a location where theplant and a lamp can be placed undisturbed.
Open It Up Before Starting the activity, have the classdiscuss how plant adaptations allow them to live indifferent environments. Pose questions like “whatwould happen to the moss growing in a forest if thetree it was growing under fell down?” Encouragestudents to create their own “what if . . .” questions.
Guiding Your Students■ Some students may benefit from having a list of
adaptations that plants of different environmentshave. They can use these lists as a guide whenobserving their plant.
■ Give students everyday analogies to help themunderstand the plant adaptations. For example, youcan relate a vascular system to drinking juice with astraw. You can describe a land plant’s cuticle as acoat that keeps moisture in the leaves.
Interpret Your Data1. Answers will depend on which plant students
choose to study.2. Students should describe characteristics of their
plant that make it well suited to its naturalenvironment.
3. Answers should include information about theplant’s temperature, availability of water, type ofsoil, and sunlight.
4. Students should explain how often plants werewatered, whether there were periods of light anddark, and other ways they cared for their plants.
Activity 6
52 ACTIVITY 6 GUIDED INQUIRY LAB MANUAL
Teacher GuideTeacher Guide

Cop
yrig
ht ©
by
Gle
ncoe
/McG
raw
-Hill
, a d
ivis
ion
of th
e M
cGra
w-H
ill C
ompa
nies
, Inc
.
5. Most plants will not survive as well in a differentenvironment. Students should describe theirobservations.
6. Answers will vary.
Conclude and Apply1. Students should recognize that some adaptations
will be beneficial to a plant in its new environment,and other adaptations will be harmful.
2. Class observations should show that, althoughplants thrive best in their natural environment,some are able to survive in different environmentsas long as they are provided with basic needs.
Going Further Each member of a group should be involved in creatingthe presentation. Provide time for each group to showtheir presentation to the entire class. You may wish tohave students answer the second Conclude and Applyquestion after the presentations.
Purpose Students will investigate the possible effectsof ozone depletion, resulting in increased UVBradiation reaching Earth’s surface, on terrestrial plants.
Skills Reinforced forming hypotheses, testinghypotheses, controlling variables, recognizing cause andeffect, measuring, describing, observing, collecting data,developing explanations, making graphs, communicating
Time Required one period to set up the experiment;five to ten minutes a day for care of plants andobservations; one period for final measurements,including dried plant biomass, and analysis of data
Background Studies have shown that increased UVBexposure in phytoplankton can lead to inhibition ofphotosynthesis which results in less primaryproduction. Some species of phytoplankton are moreresistant to UVB exposure and are not as vulnerable toits damaging effects. It has also been shown thatincreased exposure to UVB radiation can negativelyaffect growth rate and leaf production in terrestrialplants. Some plants may have more natural resistanceto the effects of UVB radiation.
Possible Procedure Students can use plasticcontainers with holes in the bottom as planters. Theyshould use an equal amount of soil for each seed.Students can compare the growth of at least two speciesof plants (possibly alfalfa, beans, tomatoes, or peas)under different experimental conditions. An outdoorsetup could compare plants grown under normal sun
conditions, plants grown under a UVB screen, andplants grown in the direct sunlight with an additionalUVB source. Have students use extreme caution whenusing an electric light source outside. Limit theexperiment to totally dry conditions, with the UVBlight source being brought indoors at the end of everyschool day. Students can decide how much exposure theplants should receive each day. Use a drying oven todry plants, then measure total biomass using thebalance. Extended experiments could focus morespecifically on any interaction between increased UVBradiation and herbivore activity or disease vulnerability,or the stage at which a plant is most vulnerable tooverexposure to UVB radiation.
Preparation Tips• Obtain seeds locally or order from a supply catalog in
advance. If fungicide has been applied to seeds, stu-dents should wash their hands after handling them.
• Check the basic growth needs of the plants. You willneed to determine the best watering and nutrientschedule.
• Obtain soil and nutrient supplements in advance.• Obtain a UVB screen and UVB light in advance.
Use only safe UVB bulbs. Some UVB bulbs cancause eye damage. Obtain appropriate fixtures forusing the light outdoors.
Open It Up Encourage students to consider the manyplant characteristics that could be affected by UVBradiation and to choose those that they could include in an experiment.
Guiding Your Students• Help your students decide on the location for their
study. The UVB light source must be extremelyclose to the plants (3–6 inches) to have any effect.
• Make sure students consider each species’ water,light, and soil requirements when they plan theirprocedure.
Interpret Your Data1. Check to make sure that students correctly graph
the data in their tables.2. Answers will vary. Students will probably see
differences between control plants andexperimental plants.
3. Depending on the type of plants used, studentsmay find that plants under the UVB light showeddecreased growth rates, smaller leaf size, a changein leaf morphology, or smaller biomass comparedto the plants in other experimental conditions. Insome cases, if a plant has some resistance to UVBlight, the differences may not be significant.
Activity 7
GUIDED INQUIRY LAB MANUAL ACTIVITY 7 53
Teacher GuideTeacher Guide

Cop
yrig
ht ©
by
Gle
ncoe
/McG
raw
-Hill
, a d
ivis
ion
of th
e M
cGra
w-H
ill C
ompa
nies
, Inc
.
Conclude and Apply1. Increased exposure to UVB radiation could
negatively impact any aspect of plant growth,primary production, or interaction between plantsand other organisms leading to changes in anecosystem.
2. Phytoplankton are the base of the food chain inwater ecosystems. If production is reduced therecould be less food for consumers at higher levelson the food chain.
3. Answers will vary but may include: selectivelybreeding crop plants that are more resistant toUVB radiation, using filters that remove UVBradiation to grow plants, and continue to educatethe public about the ozone layer.
4. Continue to selectively breed plants from eachgeneration that show the best growth underincreased UVB radiation.
Going FurtherStudents may make a multimedia presentationincluding overhead projectors, spreadsheets, videos, orpamphlets that address the issue of ozone depletion.
Purpose Students will survey a small area of twoecosystems, calculate biodiversity, and compare thevalues for the two ecosystems.
Skills Reinforced forming hypotheses, testinghypotheses, collecting data, describing, observing,comparing and contrasting, communicating
Time Required one-half period to set up the activity;time outside of class to conduct the surveys; one periodfor final calculations and analyzing data
Background A large-scale pattern of species diversityemerges as species numbers are compared across linesof latitude. Tropical areas have much higher speciesdiversity than do temperate and polar regions, withpolar regions having the lowest species diversity.Although there are several possible explanations of whythis pattern occurs, the most common is that tropicalcommunities are older and have suffered fewerdisturbances, such as glaciations, than temperate andpolar communities. A tropical climate also has a longergrowing season than temperate and polar climates.
Possible Procedure Students work alone or in groupsof two. Students construct the quadrats using the string.Encourage students to develop a way to randomize theplacement of their quadrats. For example, they mightdraw a simple map of the area they are sampling, divide
the map into numbered squares, and draw a number froma hat to determine where to place their quadrats.Encourage students to allow a few minutes to pass afterthey have arranged the quadrat to reduce the effects ofdisturbance before conducting their surveys.
Preparation Tips■ Review with students the importance of wearing
gloves while conducting the surveys. They shouldnot touch any plants or other living material with-out gloves.
■ Appropriate field clothing includes wearing gloves,a wide-brim hat, long sleeves, long pants, thicksocks, and sturdy, high-top walking/hiking shoes.
■ Everyone should use waterproof sunscreen asdirected.
■ Make sure students drink sufficient amounts ofwater or non-caffeinated drinks.
■ Review any other safety procedures that you wouldlike students to follow.
Open It Up Encourage students to conduct eachsurvey under the most similar conditions possible, suchas the time of day and weather conditions. Also,encourage students to conduct more than one surveywithin each ecosystem to allow a more accuraterepresentation of the type and number of organisms tobe obtained. Allow interested students to pursue otherbiodiversity questions as they arise.
Guiding Your StudentsExplain how to determine the Simpson Diversity Index.■ Add the numbers of each type of organism found
in your survey to determine the total number oforganisms.
■ The proportion of each type of organism can becalculated by dividing the number of individualorganisms found for each type by the total numberof all types of organisms.
■ Square each proportion.
■ Add all of the squares of each proportion.
■ Subtract this number from the number 1. Thisnumber is the Simpson Diversity Index value for thearea surveyed.
Interpret Your Data1. Check to make sure that students have calculated
biodiversity correctly.
2. When students calculate the index value, theyshould get a number between 0 and 1. Studentsshould conclude that a greater number indicatesgreater species diversity.
Activity 8
54 ACTIVITY 8 GUIDED INQUIRY LAB MANUAL
Teacher GuideTeacher Guide
Cop
yrig
ht ©
by
Gle
ncoe
/McG
raw
-Hill
, a d
ivis
ion
of th
e M
cGra
w-H
ill C
ompa
nies
, Inc
.
Conclude and Apply1. Student answers will vary depending on which
ecosystems they studied.2. Students might be able to reach conclusions about
certain ecosystems if enough data are compared.3. Conducting multiple surveys allows for a more
accurate representation of the species and theirnumbers.
4. Monitoring changes in biodiversity can be helpfulin determining the health of an ecosystem.
Going FurtherStudents can share their presentation with other classesat their school or make their presentation to a middleschool science class.
Purpose Students will understand the relationshipbetween water quality and the health of differentorganisms in an ecosystem.
Skills Reinforced forming hypotheses, testinghypotheses, controlling variables, recognizing cause andeffect, measuring, describing, collecting data, makinggraphs, developing explanations
Time Required one period to set up the activity; one-half to a whole period each day for five more days tomake observations and monitor the number oforganisms; one period for final counts and analyzing data
Background Certain types of protists can thrive inpolluted water. Identifying the species and number ofeach type of organism in an area can be useful indetermining water quality. Other species of protists aresensitive to changes in water quality such as the inputof pesticides, heavy metals, and acid precipitation.Their absence from an environment in which theynormally would thrive can indicate the presence of apollutant. Contact a local authority such as the EPA forinformation specific to your area.
Possible Procedure Students can work in groups of two. Students establish several cultures of eachorganism to be tested in glass jars. Each jar shouldreceive the same treatment, except for the independentvariable. Students can monitor the number oforganisms by examining a 0.1–0.5-mL sample underthe microscope each day for at least five days.
Preparation Tips■ Obtain the necessary materials, such as liquid fertil-
izer, motor oil, and houseplant pesticide, in advance.
■ Order the organisms and, if applicable, the appro-priate culture media from a supply catalog in
advance. Schedule delivery for the day before theexperiment will begin.
■ Only GFCI protected electrical outlets should beused in areas where water is present.
Open It Up Encourage students to consider the widerange of options for this investigation and to narrowthe number of organisms and pollutants to manageablenumbers. Have the students consider the need tomonitor the pH and temperature of the water for eachset of organisms as the experiment continues. Also,have the students consider how to ensure that anysubstance added does not contain additionalunrecorded chemicals or pollutants.
Guiding Your Students■ Remind students that acid precipitation has a pH of
less than 5.6.
■ Review with students any safety concerns for the laband how you would like them to dispose of thematerials used during the lab.
Interpret Your Data1. Check to make certain that students correctly
graph the data in their tables.
2. Student answers will vary depending on the type oforganisms used and the outcome of the experiment.
Conclude and Apply1. Student answers will vary but may include:
differences in the amount of any substanceintroduced into the water, a different method ofcounting the organisms, unforeseen contamination,or human error. Conclusions will vary. Someorganisms may show a decrease in numbercompared to the control group; some organismsthat are more tolerant may not be affected.
2. Some organisms may be able to tolerate certaintypes of changes in water quality.
3. Any significant change in population can lead to achange in the dynamics of the ecosystem. Otherorganisms may not have enough food, speciescomposition may change, and competitionbetween organisms may increase.
4. Protists can be used as bioindicators. Differentdegrees of sensitivity for chemicals are determinedfor each organism. The organism that is the mostsensitive to a given substance is used as abioindicator.
Going FurtherExperiments should determine which organism is themost sensitive to a given substance.
Activity 9
GUIDED INQUIRY LAB MANUAL ACTIVITY 9 55
Teacher GuideTeacher Guide
Cop
yrig
ht ©
by
Gle
ncoe
/McG
raw
-Hill
, a d
ivis
ion
of th
e M
cGra
w-H
ill C
ompa
nies
, Inc
.
Purpose Students will investigate the best conditionsfor raising tadpoles.
Skills Reinforced researching information, making a Venn diagram, forming hypotheses, testing ahypothesis, identifying and manipulating variables andcontrols, observing, making tables, comparing andcontrasting, recognizing cause and effect, drawingconclusions, evaluating others’ data and conclusions,communicating, using graphics software
Time Required 45 minutes to plan the activity; acouple of minutes each day for 1 to 2 months for feedingand observations; 45 minutes for analyzing results
Background The best conditions for raising tadpolesdepend on the species. Generally, the water should beabout 18°C to 24°C. Old leaves can be placed in thebottom of the tadpoles’ container. Each day, tadpolesshould be fed several pinches of boiled lettuce orspinach leaves, flake goldfish food, or other foodobtained from a pet store. The length of time requiredfor metamorphosis probably will be about 2 months.However, it can be shorter or much longer dependingon the environment and the species. Warmer watertends to increase the rate of metamorphosis.
Possible Procedure Students work in small groups toresearch appropriate conditions for raising tadpoles. Eachgroup investigates one characteristic of the tadpoleenvironment, such as temperature, water, food, light, orpopulation density of tadpoles. Students may observetheir tadpoles for all or part of the metamorphosis period.By varying one characteristic of the environment andcomparing their results to a control group, students learnabout good conditions for raising tadpoles.
Preparation Tips■ Tap water can be used if you add a water condi-
tioner obtained from a pet shop. Alternatively, youcan let the tap water sit for at least 4 days beforeusing it. Be sure to keep a good supply of preparedwater on hand. About once a month, one-fourth ofthe water used in the tadpole tank should bedrained and replaced.
■ Decide on a suitable source for tadpoles. Fast-growing tadpoles can be obtained from biologicalsupply companies. You may also wish to have stu-dents obtain tadpoles from a nearby pond.
■ Check with local wildlife officials about regulationsfor collecting tadpoles and releasing frogs into theenvironment.
■ Only GFCI protected electrical outlets should beused in areas where water is present.
Open It Up After students have researched the propercare conditions for tadpoles, have them make a list onthe chalkboard of the characteristics of a tadpole’senvironment, such as water and food. Beside eachcharacteristic, have them write ways that thecharacteristic could be changed. Allow interestedstudents to pursue other questions that arise.
Guiding Your Students■ Explain to students that they won’t be able to
conduct a comprehensive study of the best conditionsfor raising tadpoles. Instead, they should focus on anarrow question, such as, “Do tadpoles thrive betterat 18°C or 24°C?”
Interpret Your Data1. Students probably will observe the tadpoles
gradually metamorphosing into frogs.2. Students should understand that both the control
group and the experimental group probably willmature. Their response should note differences in the rate of maturation and differences in thewell-being of the tadpoles.
3. Check students’ responses.4. Check to be sure the diagrams accurately reflect
conditions recorded in students’ observation table.
Conclude and Apply1. Students should mention similarities and
differences in the rate of maturation and the well-being of the tadpoles.
2. Students should explain which condition theytested and which group responded best.
3. Answers might describe no differences, slightdifferences, or significant differences between thecondition of the control group and theexperimental group.
4. Students may wish they could test other variationsof the characteristic they tested, such as differenttemperatures or foods, or other water conditions.Students may also wish to change their procedures.
5. Overall, the class should conclude that tadpolesthrive best in water that is allowed to be a bitcloudy. The food should be small bits of plants,such as lettuce leaves, when the tadpole is young.As a tadpole nears the change to a frog, its dietshould be more carnivorous.
Going Further Students should not include details about their individualinvestigation in the instructional booklets. They shouldonly include the results obtained by the entire class.
Activity 10
56 ACTIVITY 10 GUIDED INQUIRY IN BIOLOGY LAB MANUAL
Teacher GuideTeacher Guide