Guide to MLP Investing - Alerian · Guide to MLP Investing ... Growing Asset Class •2014: ......
40
Guide to MLP Investing Equipping Investors to Make Informed Decisions About MLPs and Energy Infrastructure Maria Halmo and James Wang Global Trend Events| New Orleans, LA | 19 October – 22 October 2014
Transcript of Guide to MLP Investing - Alerian · Guide to MLP Investing ... Growing Asset Class •2014: ......

Guide to MLP Investing Equipping Investors to Make Informed Decisions About MLPs and Energy Infrastructure
Maria Halmo and James Wang Global Trend Events| New Orleans, LA | 19 October – 22 October 2014

Disclosures
2
This Document Is Impersonal and Not a Solicitation. In jurisdictions where Alerian or its affiliates do not have the necessary licenses, this document does not constitute an offering of any security, product, or service. Alerian
receives compensation in connection with licensing its indices to third parties. All information provided by Alerian in this document is impersonal and not customized to the specific needs of any entity, person, or group of
persons. Alerian and its affiliates do not endorse, manage, promote, sell, or sponsor any investment fund or other vehicle that is offered by third parties and that seeks to provide an investment return linked to or based on
the returns of any Alerian index.
No Advisory Relationship. Alerian is not an investment advisor, and Alerian and its affiliates make no representation regarding the advisability of investing in any investment fund or other vehicle. This document should not
be construed to provide advice of any kind, including, but not limited to, tax and legal.
You Must Make Your Own Investment Decision. It is not possible to invest directly in an index. Index performance does not reflect the deduction of any fees or expenses. Past performance is not a guarantee of future
returns. You should not make a decision to invest in any investment fund or other vehicle based on the statements set forth in this document, and are advised to make an investment in any investment fund or other vehicle
only after carefully evaluating the risks associated with investment in the investment fund, as detailed in the offering memorandum or similar document prepared by or on behalf of the issuer. This document does not
contain, and does not purport to contain, the level of detail necessary to give sufficient basis to an investment decision. The addition, removal, or inclusion of a security in any Alerian index is not a recommendation to buy,
sell, or hold that security, nor is it investment advice.
No Warranties. The accuracy and/or completeness of any Alerian index, any data included therein, or any data from which it is based is not guaranteed by Alerian, and it shall have no liability for any errors, omissions, or
interruptions therein. Alerian makes no warranties, express or implied, as to results to be obtained from use of information provided by Alerian and used in this service, and Alerian expressly disclaims all warranties of
suitability with respect thereto.
Limitation of Liability. While Alerian believes that the information provided in this document is reliable, Alerian shall not be liable for any claims or losses of any nature in connection with the use of the information in this
document, including but not limited to, lost profits or punitive or consequential damages, even if Alerian has been advised of the possibility of same.
Research May Not Be Current. This document has been prepared solely for informational purposes based on information generally available to the public from sources believed to be reliable. Alerian makes no
representation as to the accuracy or completeness of this document, the content of which may change without notice. Alerian expressly disclaims any obligation to update the contents of this document to reflect
developments in the energy Master Limited Partnership sector. The methodology involves rebalancings and maintenance of indices that are made periodically throughout the year and may not, therefore, reflect real-time
information.
Linked Products. Alerian licensees its indexes to third parties for the creation of investment funds or other vehicles. Alerian is not responsible for the information on these websites or for anything that they provide.
Policies and Procedures. Analytic services and products provided by Alerian are the result of separate activities designed to preserve the independence and objectivity of each analytic process. Alerian has established
policies and procedures to maintain the confidentiality of material non-public information received during each analytic process. Alerian and its affiliates provide a wide range of services to, or relating to, many
organizations, and may receive fees or other economic benefits from these organizations.
Copyright. No Unauthorized Redistribution. Alerian © 2014. All rights reserved. This document, in whole or in part, may not be redistributed, reproduced, and/or photocopied without prior written permission.

3
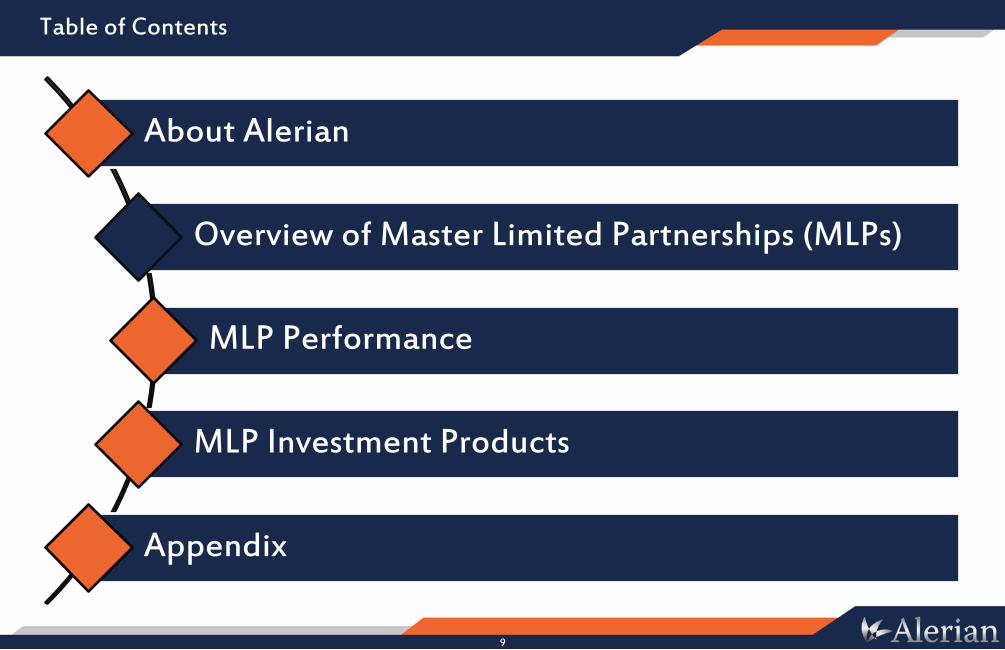
Table of Contents
About Alerian
Overview of Master Limited Partnerships (MLPs)
MLP Performance
MLP Investment Products
Appendix

4
Table of Contents
About Alerian
Overview of Master Limited Partnerships (MLPs)
MLP Performance
MLP Investment Products
Appendix

Source: Alerian as of 31 December 2013
5
Alerian Index Series

The MLP Industry Standard
6
MLP Management Teams
Television Print
Research Analysts

Alerian Index-Linked Products
7
Source: Alerian as of 30 September 2014
TickerProdu ct
TypeProdu ct Name L icen s ee
I n ception
Date
Un derlyin g
I n dex
An n u al
Fee
Total As s ets
(mil)
AML P ETF Alerian MLP ETF ALPS August 24, 2010 AMZI 0.85% $9,616
ENFR ETF Alerian Energy Infrastructure ETF ALPS November 1, 2013 AMEI 0.65% $16
AMJ ETN JPMorgan Alerian MLP Index ETN JPMorgan April 1, 2009 AMZ 0.85% $6,715
AMU ETN ETRACS Alerian MLP Index ETN UBS July 17, 2012 AMZ 0.80% $354
ML PI ETN ETRACS Alerian MLP Infrastructure Index ETN UBS March 31, 2010 AMZI 0.85% $2,341
ML PL ETN ETRACS 2x Leveraged Long Alerian MLP Infrastructure Index ETN UBS July 6, 2010 AMZI 0.85% $312
ML PG ETN ETRACS Alerian Natural Gas MLP Index ETN UBS July 13, 2010 ANGI 0.85% $38
ML PS ETN ETRACS 1x Monthly Short Alerian MLP Infrastructure Index ETN UBS September 28, 2010 AMZI 0.85% $4
Series 1 -2 0 ROC Note CIBC Alerian MLP Infrastructure Index-Linked ROC Notes CIBC October 7, 2010 AMZI 1.25% $774
AL ERX Mutual Fund ALPS Alerian MLP Infrastructure Index Fund ALPS December 31, 2012 AMZI 1.25% $18
AL EFX VIT ALPS Alerian Energy Infrastructure Portfolio ALPS April 30, 2013 AMEI 0.80% $45
$ 2 0 ,2 3 4Total Alerian L in ked-
Produ cts AUM ($ mil) :

Alerian Benefits From First-Mover Advantage
Source: Alerian as of 30 September 2014
8
9
Table of Contents
About Alerian
Overview of Master Limited Partnerships (MLPs)
MLP Performance
MLP Investment Products
Appendix

Why MLPs?
10
• MLPs build, acquire, and operate transportation assets • MLPs build, acquire, and operate processing and storage assets
Growth of US Energy Infrastructure
• Fee-based toll-road business models • Interstate liquid tariffs are indexed to inflation using PPI+ methodology • Average distribution growth of ~7% over the past 10 years
Stable and Growing Cash Flows
• No double taxation if 90% of income is from qualifying sources • Higher payout ratios and lower cost of capital than C corporations
No Entity-Level Taxation
• 2004: 38 MLPs with $53 billion in market capitalization • 2014: 121 MLPs with $600 billion in market capitalization Growing Asset Class
• 70%-100% of income is tax-deferred return of capital • Low correlation to broader markets (0.50 to the S&P 500)
Tax-Efficient Yield and Diversification
Source: Alerian as of 30 September 2014

What Is an Energy Infrastructure Asset?
11
Stable Cash Flows • Toll-road [Price x Volume] or contract-based business models
• Limited ownership of hydrocarbons mitigates commodity price exposure
Growing Cash Flows • Price: Interstate liquids tariffs have built-in PPI “plus” revenue indexing
• Volume: Inelastic and growing energy demand

12
Toll-Road Business Models
The Lake Pontchartrain Causeway charges the same toll for an Aston Martin as it does for a Honda Civic
Pipeline and storage businesses charge the same price to move or store a $30 barrel as they do a $150 barrel of oil

New Infrastructure Investment to Spur MLP Growth
13
$641 billion will need to be invested in North American infrastructure over the next
20 years
Source: INGAA as of 28 June 2014

14
Dramatic Increase in Infrastructure Demand
• Hydraulic fracturing, horizontal drilling, and other technologies were not prevalent 5-10 years ago • US crude production is at its highest level in two decades • US natural gas production is at historical highs, shale gas is expected to grow 44% by 2040 • Many existing pipelines are running at or near capacity due to significant, recent production increases
New Technologies Unlock Resources
• Moving crude by rail is a short-term solution • Pipelines needed for takeaway capacity in the Bakken, Permian, Marcellus, Eagle Ford, and Canadian Oil
Sands • New oil produced in Canada and the US Northwest needs to get to the refining centers on the Gulf Coast • INGAA estimates that NA will require over $641B in infrastructure investment over the next 25 years
Immediate Demand for Additional Infrastructure
• Domestic natural gas prices have dropped dramatically while international prices remain high • Four LNG export licenses have been approved by the US government with 18 applications still pending • Panama Canal opening in 2015 will allow competitive access to Asian markets from the US Gulf Coast • Oil sands bitumen needs to be blended with NGLs (diluent ) so that it moves smoothly through pipelines
Potential for Export
America needs more infrastructure to achieve energy independence
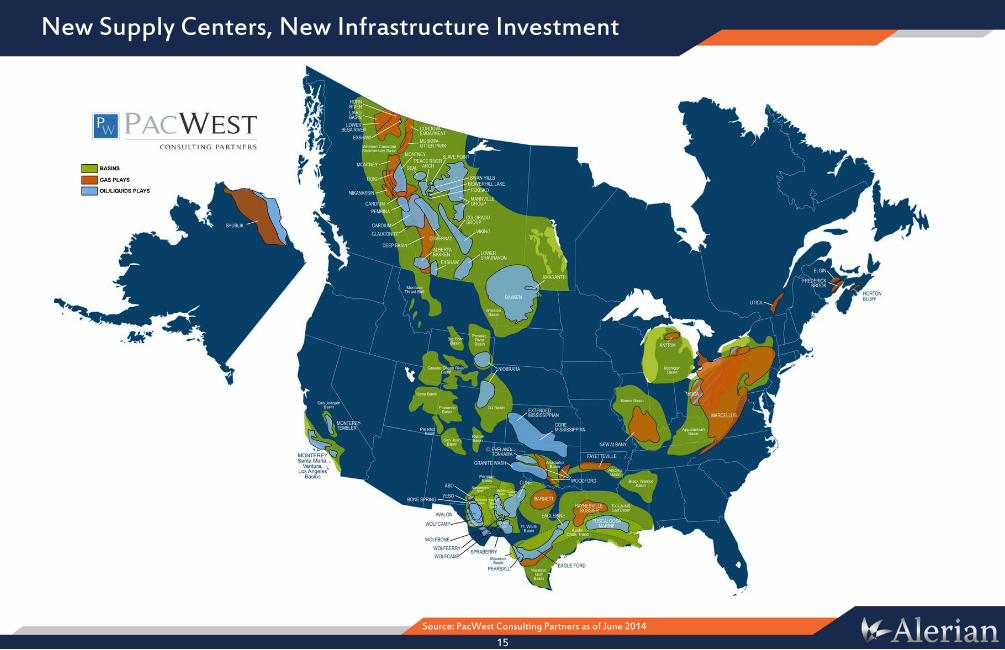
New Supply Centers, New Infrastructure Investment
Source: PacWest Consulting Partners as of June 2014
15

Congressional Leaders View MLPs Constructively
Source: GovTrack Joint Committee On Taxation, NAPTP
16
Joint Committee on
Taxation (JCT)
Abolishing structure would be counterintuitive for viability of US energy independence
MLP Parity Act
NAPTP Educational Outreach
“New revenue numbers are dwarfed by the level of private capital that MLPs have invested to build US energy infrastructure ($113 billion of infrastructure since 2007) and other contributions to our domestic energy security.”
• Proposed in House (HR 1696) and Senate (S 795), bipartisan cosponsors • Would grant same tax status to certain renewable fuels • Foregone revenue estimate of $1.5 billion over 10 years
• Updated August 2014 study estimates foregone revenue of $6.3 billion in 2014 • Decrease from February 2013 estimate of $7.5 billion

MLP IPOs Since 1986
17
Source: Alerian as of 16 September 2014

18
Table of Contents
About Alerian
Overview of Master Limited Partnerships (MLPs)
MLP Performance
MLP Investment Products
Appendix

MLPs Historically Outperform Other Asset Classes
19
Source: Alerian as of 30 September 2014

The Periodic Table of Performance
20
Source: Alerian as of 30 September 2014
Master Limited Partnerships (MLPs) are represented by the Alerian MLP Index (AMZ). Utilities are represented by the S&P 500 Utilities Index, a composite of utility stocks in the S&P 500. Small-cap equities are represented by the Russell 2000 Index. Real Estate Investment Trusts (REITs) are represented by the Real Estate 50 Index, a supplemental benchmark to the FTSE NAREIT US Real Estate Index Series to measure the performance of more frequently traded equity REITs. The S&P 500 is a capitalization-weighted index of 500 stocks designed to measure performance of the broad domestic economy. Bonds are represented by the Barclays US Aggregate Total Return Bond Index. Non-US equities are represented by the MSCI Daily Total Return EAFE Index (NDDUEAFE). Commodities are represented by the S&P Total Return World Commodity Index (SPWCITR). Performance is provided on a total return basis.

MLPs Offer An Attractive Relative Yield
21
Source: Alerian as of 30 September 2014
Master Limited Partnerships (MLPs) are represented by the Alerian MLP Index (AMZ). Utilities are represented by the S&P 500 Utilities Index, a composite of utility stocks in the S&P 500. Real Estate Investment Trusts (REITs) are represented by the Real Estate 50 Index, a supplemental benchmark to the FTSE NAREIT US Real Estate Index Series to measure the performance of more frequently traded equity REITs. Bonds are represented by the Barclays US Aggregate Total Return Bond Index. The S&P 500 is a capitalization-weighted index of 500 stocks designed to measure performance of the broad domestic economy.

Distribution Growth Despite Environment
22
Source: Alerian as of 31 December 2013

23
What are the risks?
Sharp interest rate increase
Broad equity market decline
Demand destruction
Tax law changes
Limited capital markets access
Environmental law changes
Execution Labor/materials
availability Recontracting
24
Table of Contents
About Alerian
Overview of Master Limited Partnerships (MLPs)
MLP Performance
MLP Investment Products
Appendix

Different Strokes for Different Folks
Source: Alerian as of 30 September 2014, CEF/OEF as of 31 May 2014
25
100% MLP <25% MLP 100% MLP <25% MLP 100% MLP <25% MLP
Tax Clas s ification Partnership Partnership Forward ContractTaxable
"C" Corp
Non-Taxable
"M" Corp
Taxable
"C" Corp
Non-Taxable
"M" Corp
Taxable
"C" Corp
Non-Taxable
"M" Corp
Retu rn of Capital
F low -Th rou gh 1 70%-100% 70%-100% No 70%-100% Varies2 70%-100% Varies2 70%-100% Varies2
Tax Treatmen t0%-30%
Ordinary Income
0%-30%
Ordinary Income
100%
Ordinary Income
0%-30%
Qualified DividendVaries2 0%-30%
Qualified DividendVaries2 0%-30%
Qualified DividendVaries2
Tax Form Form K-1 Form K-1 Form 1099 Form 1099 Form 1099 Form 1099 Form 1099 Form 1099 Form 1099
I RA/4 0 1 k EligibleTaxable Beyond
$1,000 in UBTI3
Taxable Beyond
$1,000 in UBTI3 Yes Yes Yes Yes Yes Yes Yes
L ev erage No No No4 No No No5 No Up to 33% Up to 33%
L iqu idity Intraday Varies Intraday Intraday Intraday Daily Daily Intraday Intraday
Firs t Fu n d L au n ch ed N/A N/A Jul 2007 Aug 2010 Jun 2012 Mar 2010 Sep 2010 Feb 2004 Jun 2005
Total Fu n ds N/A N/A 16 6 3 14 12 22 10
AUM ($ MM) N/A N/A $12.1B $10.2B $1.1B $18.5B $4.1B $19.4B $4.8B
Exchange-Traded Notes: AMJ, AMU, ATMP, FMLP, IMLP, LMLP, MLPC, MLPG, MLPI, MLPL, MLPN, MLPS, MLPW, MLPY, OSMS, YGROC Corp Exchange-Traded Funds: AMLP, MLPA, MLPJ, YMLI, YMLP, ZMLPRIC Exchange-Traded Funds: EMLP, MLPX, ENFRC Corp Open-End Mutual Funds: ALERX, AMLPX, BPMAX, CCCAX, CSHAX, CURAX, GLPAX, HEFAX, ILPAX, MLPAX, MLPDX, MLPFX, MLPLX, PRPAXRIC Open-End Mutual Funds: CRZAX, EGLAX, INFRX, LCPAX, MLOAX, MLPPX, SMAPX, TMLAX, TNPTX, TOPTX, TORTX, VMLPXC Corp Closed-End Funds: CBA, CEM, CEN, CTR, DSE, EMO, FEI, FEN, FMO, FPL, GMZ, JMLP, JMF, KED, KYN, NML, NTG, SRF, SRV, TYG, TYN, TYYRIC Closed-End Funds: FIF, KMF, KYE, MIE, NDP, SMF, SMM, SZC, TPZ, TTP1Return of Capital Flow-Through: Historical range for most midstream-focused MLPs.2RIC-compliant funds hold a diverse group of investments and the tax treatment of income paid to investors may vary dramatically between funds.3Unrelated Business Taxable Income is the gross income from any unrelated trade or business regularly conducted by an exempt organization, less the deductions connected with carrying
on the trade or business. An investment in MLPs directly or through a separately managed account may generate UBTI.4Except MLPL, which is 2x leveraged with monthly reset5Except MLPLX, which may use up to 33% of leverage
I n v es tmen t TypeClosed-End FundExchange-Traded Fund Open-End Mutual Fund
DirectSeparately
Managed AccountExchange-Traded Note

MLP Investment Product Decision Tree
26

Source: Alerian as of 30 September 2014
27
Should I Own MLPs via Exchange-Traded Notes?
• First Launch: 19 Jul 2007 • Number of Notes: 16 • Aggregate AUM: $12.1B
Statistics
• No or little tracking error • Intraday knowledge of portfolio holdings • Generally lower expense ratio than MLP 40 Act Funds
Advantages
• Coupon taxed as ordinary income • Lower income due to expense ratio being taken from coupon • Unsecured debt obligation of the issuer, Code Section 1260 ambiguity
Disadvantages
• Tax-advantaged investors • Total return investors in a taxable account • Investors that are comfortable with financial institution credit risk
Suitability

Source: Alerian as of 30 September 2014
28
Should I Own MLPs via C Corp 40 Act Funds?
• First Launch: 24 Feb 2004 (CEF), 30 Mar 2010 (OEF), 24 Aug 2010 (ETF) • Number of Funds: 22 CEFs, 14 OEFs, 6 ETFs • Aggregate AUM: $19.4B (CEFs), $18.5B (OEFs), $10.2B (ETFs)
Statistics
• Ownership of underlying securities • Tax character of distribution mirrors that of the underlying portfolio • Higher yield due to expense ratio being taken from NAV
Advantages
• Deferred tax liability (DTL) mutes gains/losses when fund is in a net DTL position Disadvantages
• Taxable investors seeking after-tax yield • Low volatility investors Suitability

Source: Alerian as of 30 September 2014
29
Should I Own MLPs via RIC-Compliant 40 Act Funds?
• First Launch: 27 Jun 2005 (CEF), 9 Sep 2010 (OEF), 20 Jun 2012 (ETF) • Number of Funds: 10 CEFs, 12 OEFs, 3 ETFs • Aggregate AUM: $4.8B (CEFs), $4.1B (OEFs), $1.1B (ETFs)
Statistics
• Ownership of underlying securities • No or little tracking error Advantages
• A maximum of 25% of the portfolio is invested directly in MLPs • Other 75% can result in meaningful performance deviation versus MLPs • Generally lower yield
Disadvantages
• Tax-advantaged investors • Total return investors in a taxable account • Investors that do not have exposure to asset classes represented in the other 75%
Suitability

Continued Demand for Access Products
Source: Alerian as of 30 September 2014
30
*discontinued

Active Versus Passive Management
Source: SEC Filings as of 31 May 2014
31
Name Ticker % of Total As s ets Name Ticker % of Total As s ets
Enterprise Product Partners LP EPD 9.8% Enterprise Products Partners LP EPD 9.4%
Kinder Morgan Energy Partners LP KMP 8.9% Regency Energy Partners LP RGP 5.7%
Magellan Midstream Partners MMP 7.7% Williams Partners LP WPZ 5.4%
Plains All American Pipeline LP PAA 6.9% Plains All American Pipeline LP PAA 5.4%
Energy Transfer Partners LP ETP 6.7% Energy Transfer Partners LP ETP 5.2%
Markwest Energy Partners LP MWE 5.5% MarkWest Energy Partners LP MWE 4.9%
Buckeye Partners LP BPL 4.8% Kinder Morgan Management LLC KMR 4.8%
Williams Partners LP WPZ 4.7% DCP Midstream Partners LP DPM 4.5%
Regency Energy Partners LP RGP 4.5% ONEOK Partners LP OKS 4.1%
ONEOK Partners LP OKS 4.4% Magellan Midstream Partners LP MMP 3.3%
Total Ov erlap w ith ML P ETF 1 0 0 .0 % Total Ov erlap w ith ML P ETF 7 1 .0 %
Name Ticker % of Total As s ets Name Ticker % of Total As s ets
Enterprise Products Partners LP EPD 8.4% Magellan Midstream Partners, L.P. MMP 10.3%
Energy Transfer Equity LP ETE 6.9% Plains All American Pipeline, L.P. PAA 8.8%
Magellan Midstream Partners LP MMP 6.4% Sunoco Logistics Partners L.P. SXL 7.3%
Plains All American Pipeline LP PAA 6.0% Enterprise Products Partners L.P. EPD 6.9%
Kinder Morgan Management LLC KMR 5.5% Buckeye Partners, L.P. BPL 5.8%
Targa Resources Partners LP NGLS 5.1% Access Midstream Partners, L.P. ACMP 4.7%
Williams Partners LP WPZ 4.5% Western Gas Partners LP WES 3.9%
MarkWest Energy Partners LP MWE 4.0% Energy Transfer Partners, L.P. ETP 3.9%
Access Midstream Partners LP ACMP 4.0% ONEOK Partners, L.P. OKS 3.7%
DCP Midstream Partners LP DPM 3.7% Spectra Energy Partners, LP SEP 3.4%
Total Ov erlap w ith ML P ETF 7 5 .4 % Total Ov erlap w ith ML P ETF 7 2 .5 %
MLP CEF C | AUM: $2.4BMLP CEF B | AUM: $2.0B
MLP CEF A | AUM: $4.0BMLP ETF | AUM: $8.7B

Know What You’re Buying
32
• Despite the name, some funds have only 25% MLPs • RIC compliance • Structured as C corporation or M corporation
25% MLPs
• Redundant exposure via MLP affiliates and MLP debt • Other: Utilities, Power, E&P, Refining, Offshore Drilling, Shipping, Renewable • Fund of funds, owning other MLP products
75% Other*
• Lower yields • Performance deviation from the MLP sector • Excess fees from ownership of other funds
Impact on Returns
*RIC Compliant Funds: CRZAX, EGLAX, EMLP, ENFR, FIF, INFRX, KYE, LCPAX, MIE, MLOAX, MLPPX, MLPUX, MLPX, NDP, SMAPX, SMF, SMM, SZC, TMLAX, TNPTX, TOPTX, TORTX, TPZ, TTP, VMLPX

33
Table of Contents
About Alerian
Overview of Master Limited Partnerships (MLPs)
MLP Performance
MLP Investment Products
Appendix

34
Speaker Bios
Maria Halmo is the Director of Research at Alerian, which equips investors to make informed decisions about Master Limited Partnerships (MLPs) and energy infrastructure. Ms. Halmo leads the firm’s research efforts, which include examining MLP regulatory filings, monitoring legislative activity, and investigating industry developments. She also oversees Alerian’s public communications strategy through investor and media outreach. Ms. Halmo is a former Associate at SteelPath Capital Management LLC, a Dallas-based MLP investment manager, where she conducted valuation analyses of petroleum transportation partnerships and researched macro-level energy issues. Ms. Halmo graduated with a Bachelor of Arts in Astrophysics from Barnard College at Columbia University. She is also a contributing author to Midstream Business, a monthly publication addressing the need for business market intelligence on North American energy infrastructure.
James Wang is the Director of Data Analytics at Alerian, which equips investors to make informed decisions about Master Limited Partnerships (MLPs) and energy infrastructure. Mr. Wang conducts quantitative and statistical analyses in order to bring to light historical and emerging trends in the asset class. He also oversees the firm’s efforts to efficiently integrate and utilize technology in its brand management activities. Prior to Alerian, Mr. Wang was an Associate in the Equity Research Division of Raymond James & Associates Inc, where he constructed financial models for energy infrastructure MLPs and published comprehensive research reports to discuss his findings. Mr. Wang graduated with a Bachelor of Science in Biomedical Engineering and a minor in Management from the Johns Hopkins University Whiting School of Engineering.

Source: Alerian as of 30 September 2014
35
AMZ Yield Spread to 10-Year Treasury
Source: Alerian as of 31 December 2013
36
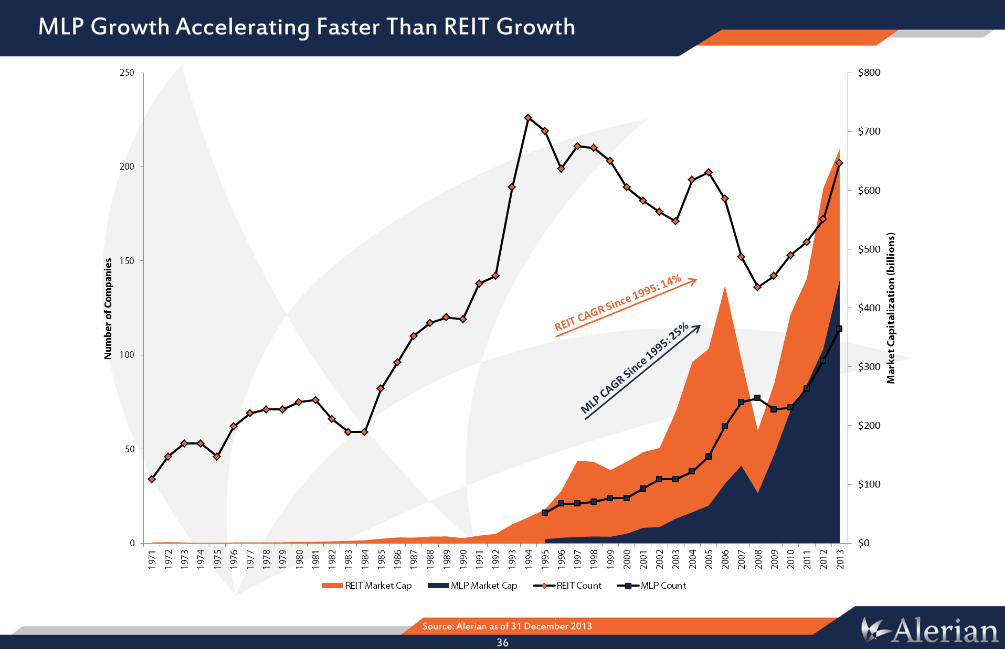
MLP Growth Accelerating Faster Than REIT Growth

Source: Alerian as of 30 September 2014
37
MLP Sensitivity to Interest Rates Possibly Overstated?

Source: SEC Filings as of 29 March 2013
38
Leverage Enhances Returns (and Risk)

Source: SEC Filings as of 28 February 2014
39
Getting What You Pay For
Each bar represents a currently available MLP investment product, and the length of the bar represents its annual fee. Expenses include management fees, borrowing costs, 12b-1 fees, other expenses as defined in the prospectus (including, but not limited to, shareholder service fees and fund acquisitions costs), fee waivers, and expense reimbursements. Current and deferred income tax expenses, trading costs, and commissions, among other costs, are excluded. Annual fees calculated from prospectus at fund launch. Borrowing costs conservatively estimated using 25% leverage and a 1.00% interest rate.

Contact
40
Contact Us
www.alerian.com
[email protected] // 972.957.7700 1717 McKinney Avenue, Suite 1450 // Dallas, TX 75202