Guide to ANALYSIS OF DNA MICROARRAY...
20
Guide to ANALYSIS OF DNA MICROARRAY DATA Second Edition Steen Knudsen Center for Biological Sequence Analysis BioCentrum-DTU Technical University of Denmark @ WI LEY-LISS A JOHN WILEY & SONS, INC., PUBLlCATION
-
Upload
truonglien -
Category
Documents
-
view
223 -
download
0
Transcript of Guide to ANALYSIS OF DNA MICROARRAY...

Guide to ANALYSIS OF DNA
MICROARRAY DATA Second Edition
Steen Knudsen Center for Biological Sequence Analysis
BioCentrum-DTU
Technical University of Denmark
@ WI LEY-LISS
A JOHN WILEY & SONS, INC., PUBLlCATION

This Page Intentionally Left Blank

Guide to ANALYSIS OF DNA
MICROARRAY DATA

This Page Intentionally Left Blank

Guide to ANALYSIS OF DNA
MICROARRAY DATA Second Edition
Steen Knudsen Center for Biological Sequence Analysis
BioCentrum-DTU
Technical University of Denmark
@ WI LEY-LISS
A JOHN WILEY & SONS, INC., PUBLlCATION
Copyright %: 2004 by John Wiley & Sons, Inc. All rights reserved
Published by John Wiley & Sons, Inc.. Hoboken. New Jersey. Published simultaneously in Canada.
No part of this publication may be reproduced. stored in a retrieval system or transmitted in any form or by any means, electronic, mechanical. photocopying, recording. scanning or otherwise. except as permitted under Section I07 or I08 of the 1976 United States Copyright Act, without either the prior written permission of the Publisher, or authorization through payment of the appropriate per-copy fee to the Copyright Clearance Center. Inc.. 222 Rosewood Drive, Danvers, MA 01923, (978) 750-8400. fax (978) 646-8600, or on the web at www.copyright.com. Requests to the Publisher for permission should be addressed to the Permissions Department. John Wiley & Sons, Inc.. 1 I 1 River Street, Hoboken, NJ 07030. (201) 748-601 I . fax (201) 748-6008.
Limit of Liability/Disclaimer of Warranty: While the publisher and author have used their best efforts in preparing this hook. they make no representation or warranties with respect to the accuracy or completeness of the contents of this book and specifically disclaim any implied warranties of merchantability or fitness for a particular purpose. No warranty may he created or extended by sales representatives or written sales materials. The advice and strategies contained herein may not be suitable for your situation. You should consult with a professional where appropriate. Neither the publisher nor author shall be liable for any loss of profit or any other commercial damages, including but not limited to special. incidental, consequential. or other damages.
For general information on our other products and services please contact our Customer Care Department within the U.S. at 877-762-2974. outside the U.S. at 317-572-3993 or fax 31 7-572-4002
Wiley also publishes its hooks in a variety of electronic formats. Some content that appears in print, however. rnav not he available in electronic format.
Library of Congress Cataloging-in-Publication Data is available.
ISBN 0-471-65604-6
Printed in the United States of America
I 0 9 8 7 6 5 4 3 2 I

TO Linnea

This Page Intentionally Left Blank
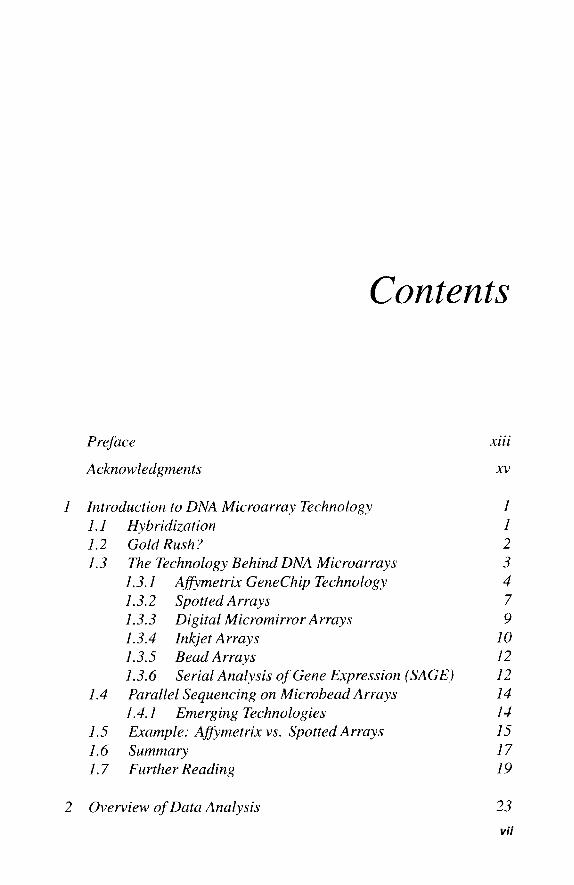
Contents
Preface
Acknowledgments
I Introduction to DNA Microarray Technology 1.1 Hybridization 1.2 Gold Rush? 1.3 The Technology Behind DNA Microarrays
1.3.1 Afimetrix GeneChip Technology 1.3.2 Spotted Arrays 1.3.3 Digital Micromirror Arrays 1.3.4 Inkjet Arrays 1.3.5 Bead Arrays 1.3.6 Parallel Sequencing on Microbead Arrays 1.4.1 Emerging Technologies Example: Afimetrix vs. Spotted Arrays
Serial Analysis of Gene Expression (SAGE) I .4
1.5 1.6 Summary I . 7 Further Reading
... X l l l
xv
1 1 2 3 4 7 9
10 12 12 14 14 15 17 19
2 Overview of Data Analysis 23
Vii
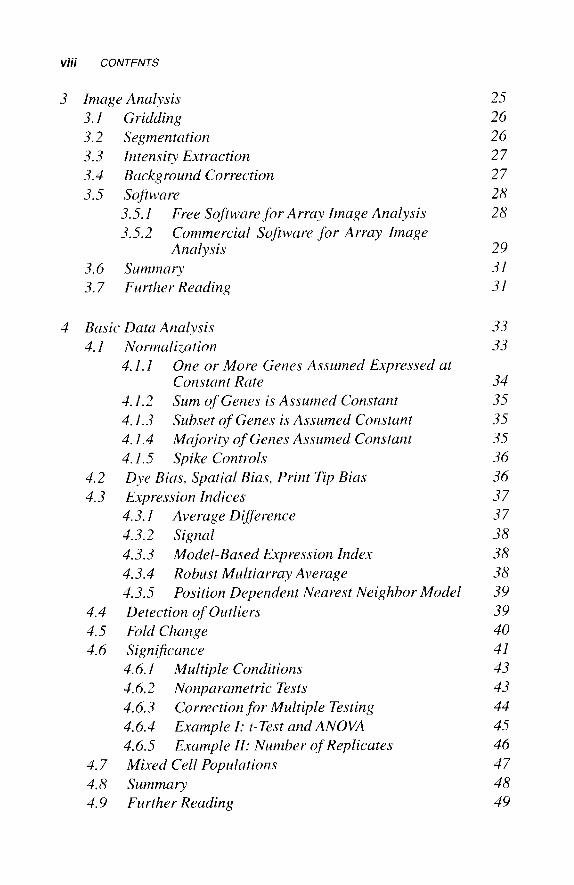
viii CONTENTS
3 Image Analysis 3.1 Gridding 3.2 Segmentation 3.3 Intensity Extraction 3.4 Background Correction 3.5 Software
3.5. I Free Software for Array Image Analysis 3.5.2 Commercial Software for Array Image
Analysis 3.6 Summary 3.7 Further Reading
25 26 26 27 27 28 28
29 31 31
4 Basic Data Analysis 33 4. I Normalization 33
One or More Genes Assumed Expressed at Constant Rate 34
4. I .2 Sum of Genes is Assumed Constant 35 4.1.3 Subset of Genes is Assumed Constant 35 4. I .4 Majority of Genes Assumed Constant 35
4.3 Expression Indices 37 4.3. I Average Difference 37
4.1.1
4.1.5 Spike Controls 36 4.2 Dye Bias, Spatial Bias, Print Tip Bias 36
4.3.2 Signal 38 4.3.3 Model-Based Expression Index 38 4.3.4 Robust Multiarray Average 38 4.3.5 Position Dependent Nearest Neighbor Model 39
4.5 Fold Change 40 4.6 SigniJCicance 41
4.4 Detection of Outliers 39
4.6.1 Multiple Conditions 43 4.6.2 Nonparametric Tests 43 4.6.3 Correction for Multiple Testing 44 4.6.4 Example I: t-Test and ANOVA 45
4.7 Mixed Cell Populations 47
4.9 Further Reading 49
4.6.5 Example II: Number of Replicates 46
4.8 Summary 48
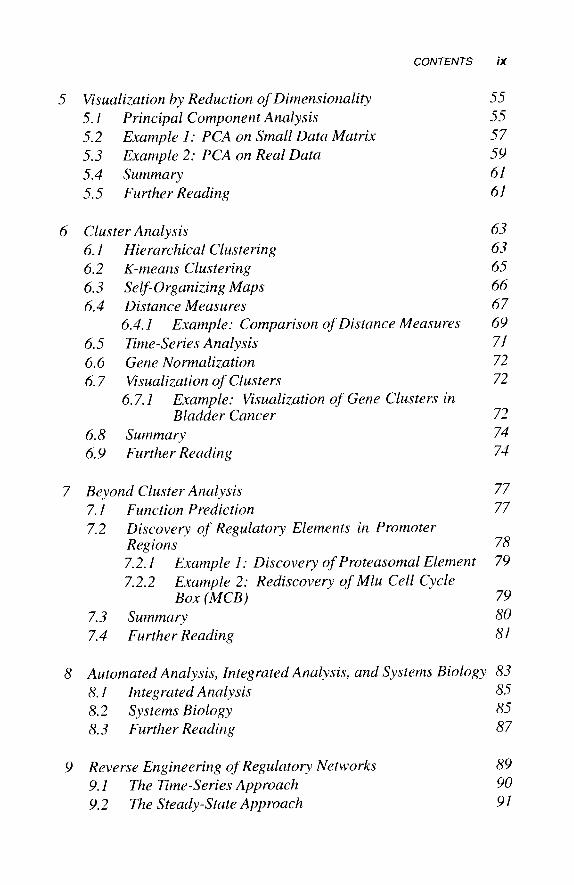
CONTENTS
5 Visualization by Reduction of Dimensionality 5. I Principal Component Analysis 5.2 Example I : PCA on Small Data Matrix 5.3 Example 2: PCA on Real Data 5.4 Summary 5.5 Further Reading
6 Cluster Analysis 6.1 Hierarchical Clustering 6.2 K-means Clustering 6.3 Self-organizing Maps 6.4 Distance Measures
6.5 Time-Series Analysis 6.6 Gene Normalization 6.7 Visualization of Clusters
Example: Visualization of Gene Clusters in Bladder Cancer
6.4. I Example: Comparison of Distance Measures
6.7.1
6.8 Summary 6.9 Further Reading
7 Beyond Cluster Analysis 7. I Function Prediction 7.2 Discovery of Regulatory Elements in Promoter
Regions 7.2. I 7.2.2
7.3 Summary 7.4 Further Reading
Example I : Discovery of Proteasomal Element Example 2: Rediscovery of Mlu Cell Cycle Box (MCB)
ix
55 55 57 59 61 61
63 63 65 66 67 69 71 72 72
72 74 74
77 77
78 79
79 80 81
8 Automated Analysis, Integrated Analysis, and Systems Biology 83 8. I Integrated Analysis 85 8.2 Systems Biology 85 8.3 Further Reading 87
9 Reverse Engineering of Regulatory Networks 9. I The Time-Series Approach 9.2 The Steady-State Approach
89 90 91
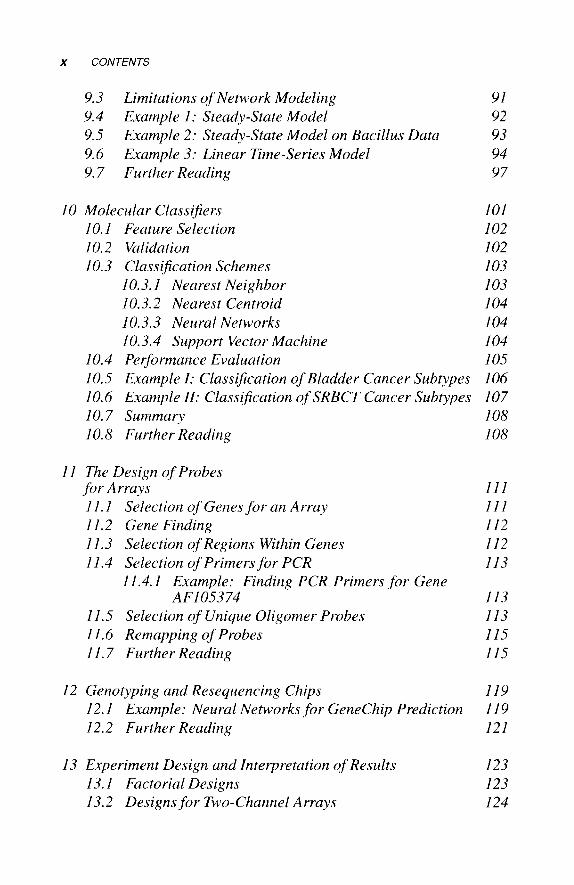
X CONTENTS
9.3 Limitations of Network Modeling 9.4 Example I : Steady-State Model 9.5 9.6 9.7 Further Reading
Example 2: Steady-State Model on Bacillus Data Example 3: Linear Time-Series Model
I0 Molecular Classijiers 10. I Feature Selection 10.2 Validation 10.3 Classijication Schemes
10.3. I Nearest Neighbor 10.3.2 Nearest Centroid 10.3.3 Neural Networks 10.3.4 Support Vector Machine
10.4 Pe formance Evaluation 10.5 Example I: Classijication of Bladder Cancer Subtypes 10.6 Example II: Classijication of SRBCT Cancer Subtypes 10.7 Summary 10.8 Further Reading
1 I The Design of Probes for Arrays I I . I Selection of Genes.for an Array 11.2 Gene Finding 11.3 Selection of Regions Within Genes 11.4 Selection of Primers for PCR
11.4. I Example: Finding PCR Primers for Gene A F1053 74
1 I .5 Selection of Unique Oligomer Probes 1 I .6 Remapping of Probes 1 I . 7 Further Reading
12 Genotyping and Resequencing Chips 12.1 Example: Neural Networks for GeneChip Prediction 12.2 Further Reading
13 Experiment Design and Interpretation of Results 13. I Factorial Designs 13.2 Designs for Two-Channel Arrays
91 92 93 94 97
101 102 102 103 103 104 104 104 105 106 107 108 108
111 111 112 112 113
113 113 115 115
119 119 121
123 123 124
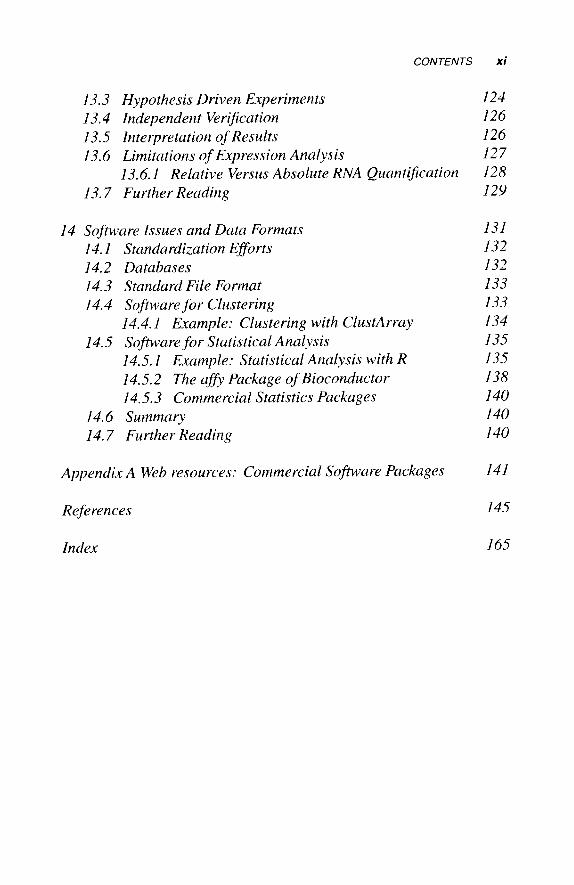
CONTENTS xi
13.3 Hypothesis Driven Experiments 13.4 Independent Verification 13.5 Interpretation of Results 13.6 Limitations of Expression Analysis
13.7 Further Reading 13.6.1 Relative Versus Absolute RNA Quantification
14 Software Issues and Data Formats 14. I Standardization Efforts 14.2 Databases 14.3 Standard File Format 14.4 Software for Clustering
14.5 Sof iare for Statistical Analysis 14.4.1 Example: Clustering with ClustArray
14.5. I Example: Statistical Analysis with R 14.5.2 The a& Package of Bioconductor 14.5.3 Commercial Statistics Packages
14.6 Summary 14.7 Further Reading
Appendix A Web resources: Commercial Software Packages
References
Index
124 126 126 127 128 129
131 132 132 133 133 134 135 135 138 140 140 140
141
145
165

This Page Intentionally Left Blank
Preface
I am often asked, “Do you have a good text I can read on analysis of DNA array data?” This is an attempt at providing such a text for students and scientists alike who venture into the field of DNA array data analysis for the first time. The book is written for biologists and medical researchers without special training in data analysis and statistics. Mathematical stringency is sacrificed for intuitive and visual introduction of concepts. Methods are introduced by simple examples and citations of relevant literature. Practical computer solutions to common analysis problems are suggested, with an emphasis on software developed at and made freely available by my own lab. The text emphasizes gene expression analysis.
This text takes over where the DNA array equipment leaves you: with a file containing an image of the microarray. If the equipment has already performed an analysis of the image, you are left with a file of signal inten- sities. The information in that file will prompt questions such as: How is it scaled? What is the error in the data? When can I say that a certain gene is up-regulated? What do I do with the thousands of genes that show some regulation? How much information can I get out of my data? This text will attempt to answer those questions and others that will come into mind as you delve further into the data.
Since the appearance of the first edition, the field has virtually exploded, with thousands of papers published on DNA microarrays and data analysis. A new generation of microarray equipment, allowing in situ synthesis of chips, has appeared. New public software packages have appeared, and improved
xiii
XiV PREFACE
methods for data analysis have been published. The second edition includes all these new and recent developments and also contains new chapters on image analysis, experiment design, interpretation of results, oligonucleotide probe design, data integration, and systems biology. The second edition aims to be the most comprehensive and up-to-date book available on DNA microarrays.
Each chapter has a section on Further Reading, which categorizes key literature by topic.
A web companion site' is available with copy-paste code examples from the book, errata, experimental protocols, and more.
STEEN KNUDSEN
Lyngbv, Denmark
December 2003
' http://www.cbs.dtu.dMsteen/book.html
Acknowledgments
Christopher Workman, Laurent Gautier, and Henrik Bjgrn Nielsen inspired me for many aspects of this book and also implemented many methods used in the book.
I thank Yves Moreau for helpful suggestions on the manuscript. I thank my collaborators Claus Nielsen, Kenneth Thirstrup, Torben 0rntoft,
Friedrik Wikman, Thomas Thykjaer, Mogens Kruhgffer, Karin Demtroder, Hans Wolf, Lars Dyrskjgt Andersen, Casper Mgller Frederiksen, Jeppe Spicker, Lars Juhl Jensen, Carsten Friis, Hanne Jarmer, Hans-Henrik Saxild, Randy Berka, Matthew Piper, Steen Westergaard, Christoffer Bro, Thomas Jensen, and Kristine Dahlin for allowing me to use examples generated from our collaborative research.
I am grateful to Center Director Sgren Brunak for creating the environment, and to the Danish National Research Foundation, the Danish Biotechnology Instrument Center, and Novozymes A / S for funding the research that made this book possible.
S. K.
xv

This Page Intentionally Left Blank
1 Introduction to DNA
Microarray Technology
1.1 HYBRIDIZATION
The fundamental basis of DNA microarrays is the process of hybridization. Two DNA strands hybridize if they are complementary to each other. Com- plementarity reflects the Watson-Crick rule that adenine (A) binds to thymine (T) and cytosine (C) binds to guanine (G). One or both strands of the DNA hybrid can be replaced by RNA and hybridization will still occur as long as there is complementarity.
Hybridization has for decades been used in molecular biology as the basis for such techniques as Southern blotting and Northern blotting. In Southern blotting, a small string of DNA, an oligonucleotide, is used to hybridize to complementary fragments of DNA that have been separated according to size in a gel electrophoresis. If the oligonucleotide is radioactively labeled, the hybridization can be visualized on a photographic film that is sensitive to radiation. In Northern blotting, a radio-labeled oligonucleotide is used to hybridize to messenger RNA that has been run through a gel. If the oligo is specific to a single messenger RNA, then it will bind to the location (band) of that messenger in the gel. The amount of radiation captured on a photographic film depends to some extent on the amount of radio-labeled probe present in the band, which again depends on the amount of messenger. So this method is a semiquantitative detection of individual messengers.
DNA arrays are a massively parallel version of' Northern and Southern blotting. Instead of distributing the oligonucleotide probes over a gel con- taining samples of RNA or DNA, the oligonucleotide probes are attached
7
2 INTRODUCTION TO DNA MICROARRAY TECHNOLOGY
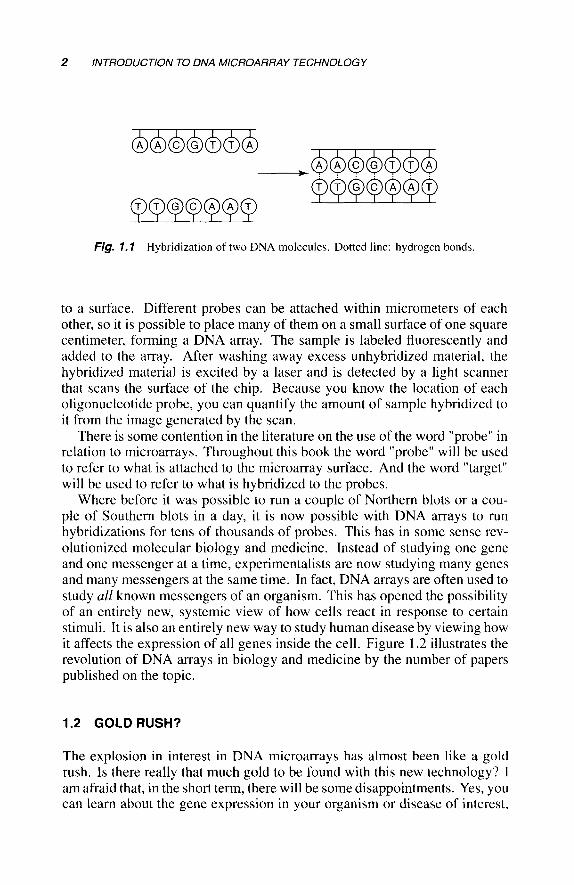
Fig. 7.7 Hybridization of two DNA molecules. Dotted line: hydrogen bonds.
to a surface. Different probes can be attached within micrometers of each other, so it is possible to place many of them on a small surface of one square centimeter, forming a DNA array. The sample is labeled fluorescently and added to the array. After washing away excess unhybridized material, the hybridized material is excited by a laser and is detected by a light scanner that scans the surface of the chip. Because you know the location of each oligonucleotide probe, you can quantify the amount of sample hybridized to it from the image generated by the scan.
There is some contention in the literature on the use of the word "probe" in relation to microarrays. Throughout this book the word "probe" will be used to refer to what is attached to the microarray surface. And the word "target" will be used to refer to what is hybridized to the probes.
Where before it was possible to run a couple of Northern blots or a cou- ple of Southern blots in a day, it is now possible with DNA arrays to run hybridizations for tens of thousands of probes. This has in some sense rev- olutionized molecular biology and medicine. Instead of studying one gene and one messenger at a time, experimentalists are now studying many genes and many messengers at the same time. In fact, DNA arrays are often used to study all known messengers of an organism. This has opened the possibility of an entirely new, systemic view of how cells react in response to certain stimuli. It is also an entirely new way to study human disease by viewing how it affects the expression of all genes inside the cell. Figure I .2 illustrates the revolution of DNA arrays in biology and medicine by the number of papers published on the topic.
1.2 GOLD RUSH?
The explosion in interest in DNA microarrays has almost been like a gold rush. Is there really that much gold to be found with this new technology? I am afraid that, in the short term, there will be some disappointments. Yes, you can learn about the gene expression in your organism or disease of interest,