Guide Improve Website
13
IMPROVING Y OUR WEBSITE Version 1.1 READ OUR BLOG: www.hostgee.com FOLLOW US ON TWITTER: www.twitter .com/hostgee
-
Upload
hostgeecom-inc -
Category
Documents
-
view
391 -
download
4
description
Register domain names and web domains - Hostgee.com offers domain name registration and is a top web hosting provider. Our professional website design and hosting services ensure quality solutions for your business.
Transcript of Guide Improve Website

1
IMPROVING YOUR WEBSITE
Version 1.1
READ OUR BLOG: www.hostgee.com
FOLLOW US ON TWITTER: www.twitter.com/hostgee
2
contents
who is this guide for? 3
gathering the data
4
using the data
8
testing the changes
10
free resources & links
13
3
is this guide for?
Once you have planned and built you website and starting driving tra ffic to it, surely all
that is left to do is sit down with a cup of tea and admire your handy work? Unfortunately
it is only the beginning.
This guide will introduce you to the methods, tools and resources available for you to
analyse your website and use that data to make it even better, including:
● Web analytics
● Heat maps
● User feedback
● Testing & optimisation
Planning Building Marketing Improving
We want this guide to be an on-going project that is constantly updated. If you have any
suggestions you would like to see please email us at [email protected] and
we will look at adding it to the next version. Feel free to distribute this document to
whoever you want, but if you use any of the images or definitions please reference us as
the source along with a link to http://www.hostgee.com
4
gathering the data
Web analytics
Before you can make any changes to your website you first need to understand how your
website is being used (or not). Adding web analytics script to the areas of your website
you want to track and monitor (ideally all of it) will enable you to report on:
● Visits
● Page views
● Traffic sources
● Keywords used to find your site
● Bounce rates
● Dropout rates
● Conversions
● Average time spent on site / page
● New vs return visits
● Browser / operating system used
● Country visiting you from
● How many pages they looked at
● Top landing and exit pages
● Products sold
● Revenue
● ROI
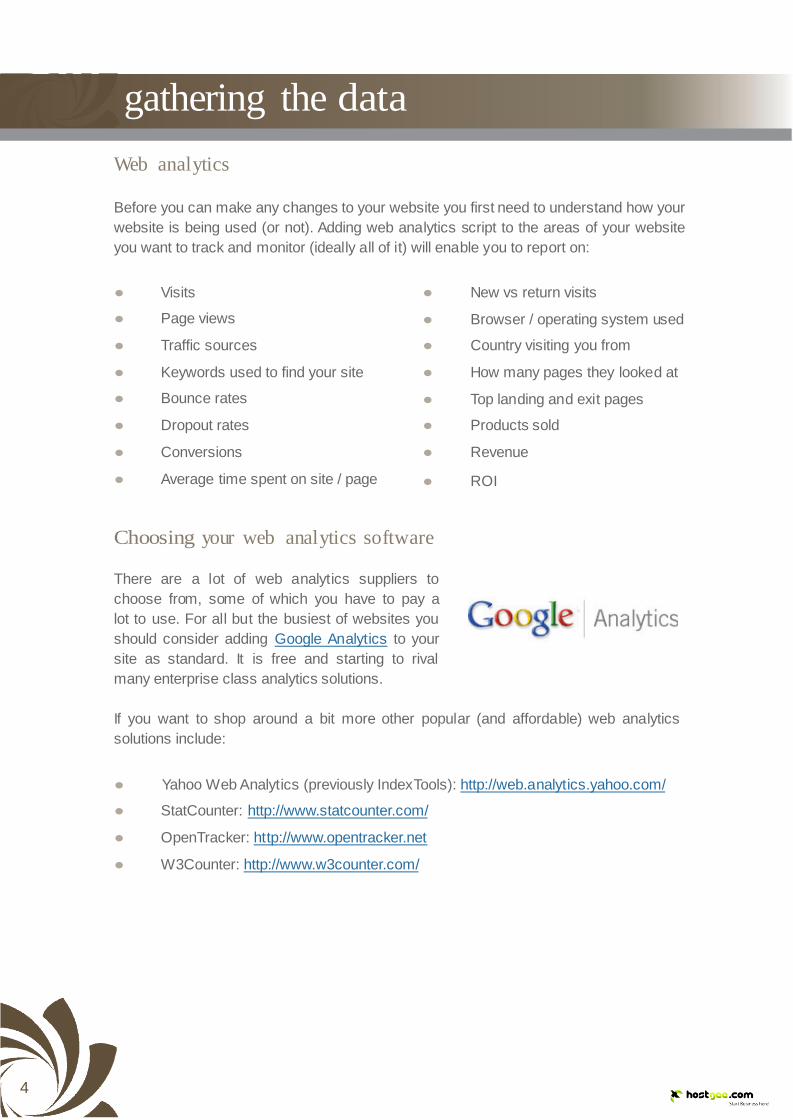
Choosing your web analytics software
There are a lot of web analytics suppliers to
choose from, some of which you have to pay a
lot to use. For all but the busiest of websites you
should consider adding Google Analytics to your
site as standard. It is free and starting to rival
many enterprise class analytics solutions.
If you want to shop around a bit more other popular (and affordable) web analytics
solutions include:
● Yahoo Web Analytics (previously IndexTools): http://web.analytics.yahoo.com/
● StatCounter: http://www.statcounter.com/
● OpenTracker: http://www.opentracker.net
● W3Counter: http://www.w3counter.com/
5
Installing Google Analytics (GA)
If you already have an account with Google
you can use GA from that account. If not,
signing up is free and very quick. Google
provides a series of comprehensive guides
to help setting up your account and adding
the tracking to your site. To read more go to
http://www.google.com/support/analytics/
Heat maps
Quick Adding
easy
as copy
step by
running
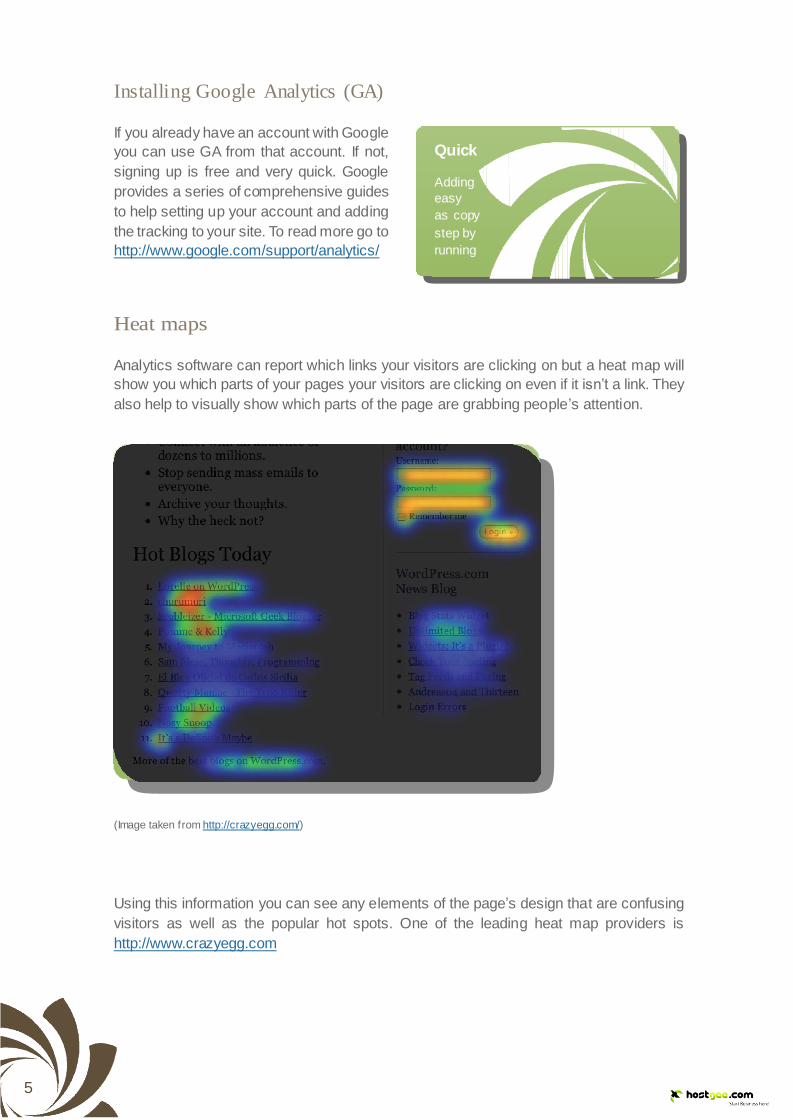
Analytics software can report which links your visitors are clicking on but a heat map will
show you which parts of your pages your visitors are clicking on even if it isn‟t a link. They
also help to visually show which parts of the page are grabbing people‟s attention.
(Image taken from http://crazyegg.com/)
Using this information you can see any elements of the page‟s design that are confusing
visitors as well as the popular hot spots. One of the leading heat map providers is
http://www.crazyegg.com
6
User / customer feedback
Feedback forms and surveys are great ways to collect data about how people use your
website, what they think about your services and how they rate your products. However,
writing a good survey with results you can analyse and data you can actually use is not
as simple as many people think.
Keep it short: No one wants to be faced with dozens of questions especially online
where attentions spans continue to fall. To ensure as many questions are answered as
possible and reduce the dropout rate aim for 10 questions or less. If you decide to split
the questions in to multiple pages don‟t create so many stages that it looks like they are
climbing a mountain and always let them know where they are in the process e.g. step
2 of 5.
Give them a reason to take part: Provide a strong incentive for the participant to
complete the survey and give you their contact details. For example, if you are running a
survey to benchmark your industry you could give them access to the results or if it is a
survey about your service a competition is always popular e.g. Win a laptop.
Structuring the questions: How you structure your questions will make the difference
between having data you can apply and having a large spreadsheet sitting untouched on
your computer. Some tips include...
● Don‟t weigh the answers in favour of a certain answer
e.g. Excellent, Very good, Good, Poor (3 positive and only 1 negative)
● Don‟t put “don‟t know” or “NA” as an option in middle,
it will make statistical analysis a nightmare
● Avoid leading questions e.g. “Do you agree that...?”
● Keep the question specific e.g. don‟t use words such as “Occasionally”,
“Often”, “Regularly” etc. What they mean from person to person differs
● What does average mean? Don‟t use it for the sake of it
● Don‟t fall in to trap of asking two questions in one sentence.
“Did you buy our red balloon and what did you think of it?”
7
Open and closed questions: Open questions allow the respondent to answer a
question with no limitations on what they can say e.g. “What do you like about your
current supplier?” A closed question has a limited number of responses to choose from
e.g. “How would you rate our customer service?” Very Good, Good etc.
In theory open questions provide you with more qualitative data but they can be difficult
to analyse. If you have thousands of responses you will have to go through each one
grouping the answers to be able to spot any common themes. Closed questions make it
very easy to analyse the data but you could miss out on some valuable feedback.
Piloting the survey: Good practise dictates you should run a pilot survey to test
the questions amongst a limited sample before launching it to the general population.
Doing this will highlight any problems with the questions and any in data collection and
analysis.
Choosing the software There are literally hundreds of software suppliers to choose from covering all the stages
of planning, implementing, distributing and analysing your survey. A couple of popular
suppliers include:
● http://www.zoomerang.com/
● http://www.surveymonkey.com/
● http://www.keysurvey.co.uk/
8
using the data
Being able to look at all the wonderful information and pretty graphs is all well and good,
but how do you actually take the data available and apply it to improve your website?
Traffic
Beyond simply knowing how many people have visited your site, checking your traffic
stats every day also provides an insight into how the traffic changes throughout the
day, week and month along with seasonal fluctuations, thus allowing you to make plans
accordingly, for example…
● Maintenance down time in the quietest periods of the day / night
● Stock management during busy months
● Planning advertising schedules offline and online
● Periods of the day with a higher likelihood of sales / conversions
You can also use the data to highlight if your site had any technical issues or, even
worse, if it has any ongoing technical issues.
The specific pages people are going to also provide an understanding of how they are
interacting with your site. For example, if the „Help‟ page is one of the most visited pages
then clearly people are having trouble finding what they are looking for and you need to
look at making changes to either the content, navigation or structure of the site.
Time spent on a page
This is one metric particularly useful when analysing the popularity (or not) of a blog post.
If people are spending very little time on a post then that tells you the subject matter is
not an area the readership are interested in and you shouldn‟t spend time doing any
more like that. On the flip side, if they are spending a long time on the page, then you
should look to write more posts about that subject or in that format e.g. an interview.
9
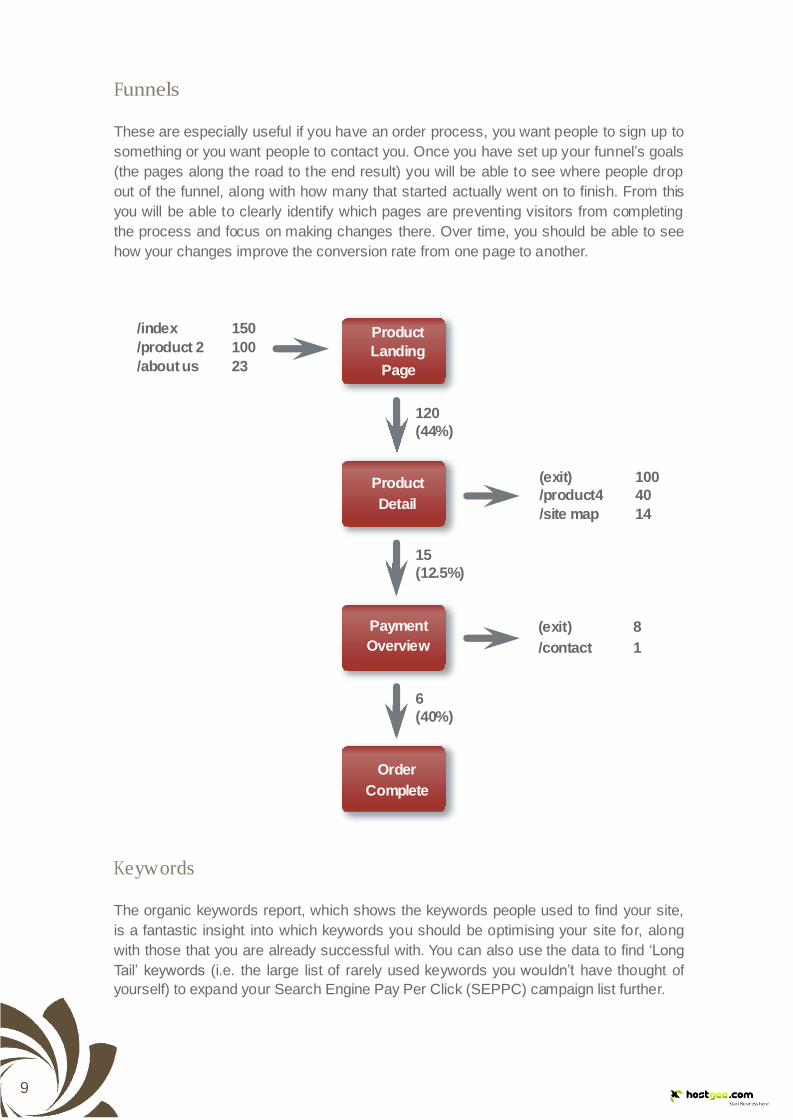
(exit) 100 /product4 40
/site map 14
Funnels
These are especially useful if you have an order process, you want people to sign up to
something or you want people to contact you. Once you have set up your funnel‟s goals
(the pages along the road to the end result) you will be able to see where people drop
out of the funnel, along with how many that started actually went on to finish. From this
you will be able to clearly identify which pages are preventing visitors from completing
the process and focus on making changes there. Over time, you should be able to see
how your changes improve the conversion rate from one page to another.
/index 150
/product 2 100
/about us 23
Product
Landing
Page
120
(44%)
Product
Detail
15
(12.5%)
Payment
Overview
(exit) 8
/contact 1
6
(40%)
Order
Complete
Keywords
The organic keywords report, which shows the keywords people used to find your site,
is a fantastic insight into which keywords you should be optimising your site for, along
with those that you are already successful with. You can also use the data to find „Long
Tail‟ keywords (i.e. the large list of rarely used keywords you wouldn‟t have thought of
yourself) to expand your Search Engine Pay Per Click (SEPPC) campaign list further.
10
Bounce rate
Bounce rate is the percentage of visits that land on a page and leave the site without
going anywhere else on the site i.e. they literally „bounce‟ away. Use this data to find
the pages that are putting people off going further into your site or to monitor how well
targeted any advertising you are running has been e.g. a paid search keyword with a
bounce rate of 80% needs either its creative reviewing or pulling altogether.
testing the changes
Once you have a better understanding of how visitors navigate your site, gathered their
feedback and put together your ideas to make changes you can now start testing their
impact. Website optimisation centres on the ability to scientifically test how your visitors
interact with various components and/ or pages on your website and the impact of
changes upon that.
By creating more than one version of a page (changing one component at a time) you
can test multiple variations to see which delivers the best results. Rather than guessing
which colour, image, content order, banner or call to action is most effective you can and
let your visitors do the work for you. Variables to consider testing include...
● Page headline (size, position, colour, copy...)
● Amount and depth of content
● Navigation bar
● Pricing
● Special offers
● Testimonials
● Logo design
● Anchor text in the body
● Images
● Call to action (where it is on the page, what it looks like and what it says)
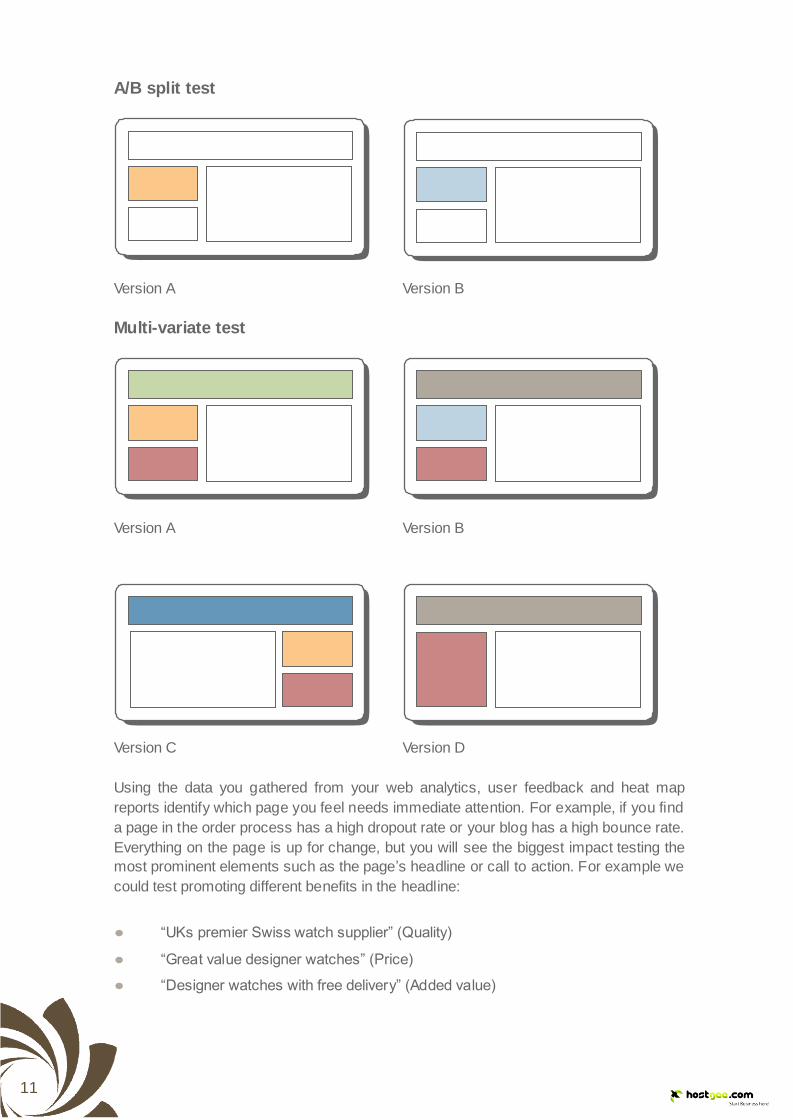
A/B split test & multi-variate testing
The main difference between these two methods is the number of variables you are
testing at the same time. As the name suggests, A/B split tests compare the performance
of two versions whereas multi-variate testing allows you to compare multiple variables
at once.
11
A/B split test
Version A Version B
Multi-variate test
Version A Version B
Version C Version D
Using the data you gathered from your web analytics, user feedback and heat map
reports identify which page you feel needs immediate attention. For example, if you find
a page in the order process has a high dropout rate or your blog has a high bounce rate.
Everything on the page is up for change, but you will see the biggest impact testing the
most prominent elements such as the page‟s headline or call to action. For example we
could test promoting different benefits in the headline:
● “UKs premier Swiss watch supplier” (Quality)
● “Great value designer watches” (Price)
● “Designer watches with free delivery” (Added value)

12
Software suppliers
We are going to refer you back to Google again
who have a free and powerful solution in this field
as well. Their Website Optimizer product has
everything you will need to conduct these tests.
Their product information page can be found here
http://www.google.com/websiteoptimizer/ which will
also take you to their comprehensive step by step
installation guide.
13
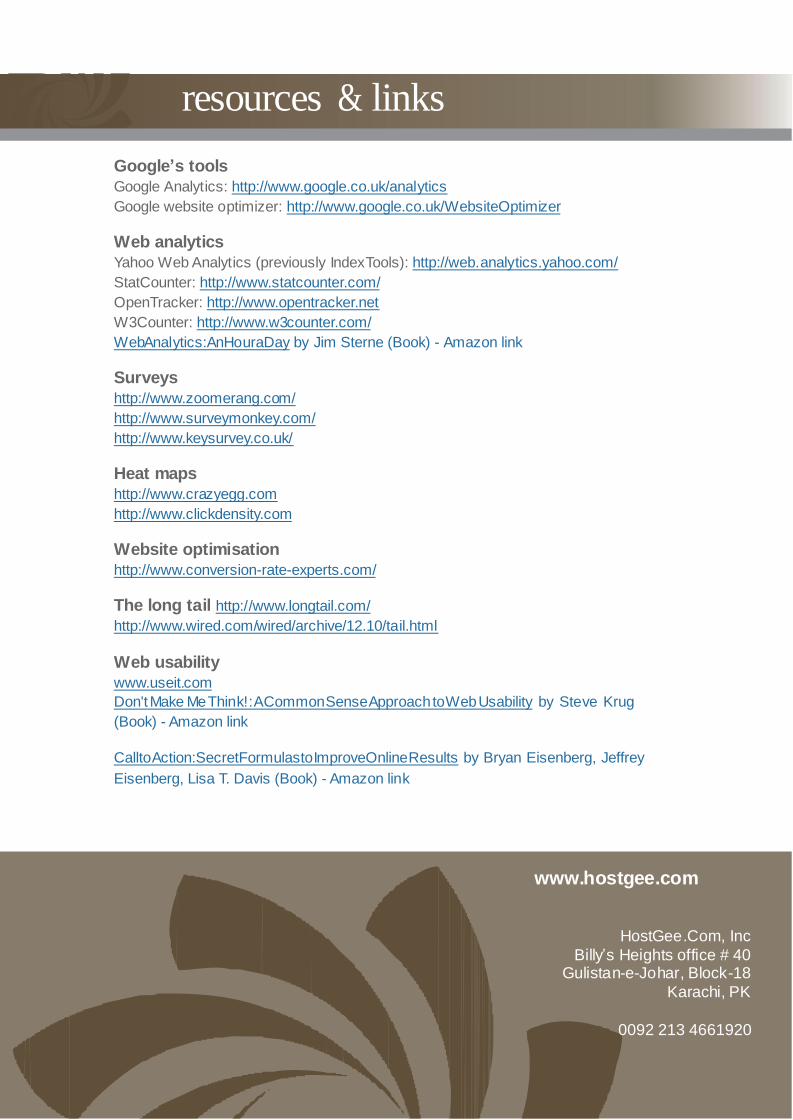
resources & links
Google’s tools
Google Analytics: http://www.google.co.uk/analytics
Google website optimizer: http://www.google.co.uk/WebsiteOptimizer
Web analytics
Yahoo Web Analytics (previously IndexTools): http://web.analytics.yahoo.com/
StatCounter: http://www.statcounter.com/
OpenTracker: http://www.opentracker.net
W3Counter: http://www.w3counter.com/
Web Analytics: An Hour a Day by Jim Sterne (Book) - Amazon link
Surveys
http://www.zoomerang.com/
http://www.surveymonkey.com/
http://www.keysurvey.co.uk/
Heat maps
http://www.crazyegg.com
http://www.clickdensity.com
Website optimisation
http://www.conversion-rate-experts.com/
The long tail http://www.longtail.com/
http://www.wired.com/wired/archive/12.10/tail.html
Web usability
www.useit.com
Don't Make Me Think!: A Common Sense Approach to Web Usability by Steve Krug
(Book) - Amazon link
Call to Action: Secret Formulas to Improve Online Results by Bryan Eisenberg, Jeffrey
Eisenberg, Lisa T. Davis (Book) - Amazon link
www.hostgee.com
HostGee.Com, Inc
Billy‟s Heights office # 40 Gulistan-e-Johar, Block-18
Karachi, PK
0092 213 4661920