Guide for Pedestrian and Bicyclist Count Data Submittal · 2019-02-01 · TxDOT Statewide Bicycle...
86
Cooperative Research Program TTI: 0-6927 Technical Product 0-6927-P7 Guide for Pedestrian and Bicyclist Count Data Submittal in cooperation with the Federal Highway Administration and the Texas Department of Transportation http://tti.tamu.edu/documents/0-6927-P7.pdf TEXAS A&M TRANSPORTATION INSTITUTE COLLEGE STATION, TEXAS
Transcript of Guide for Pedestrian and Bicyclist Count Data Submittal · 2019-02-01 · TxDOT Statewide Bicycle...
Cooperative Research Program
TTI: 0-6927
Technical Product 0-6927-P7
Guide for Pedestrian and Bicyclist Count Data Submittal
in cooperation with the Federal Highway Administration and the
Texas Department of Transportation http://tti.tamu.edu/documents/0-6927-P7.pdf
TEXAS A&M TRANSPORTATION INSTITUTE
COLLEGE STATION, TEXAS

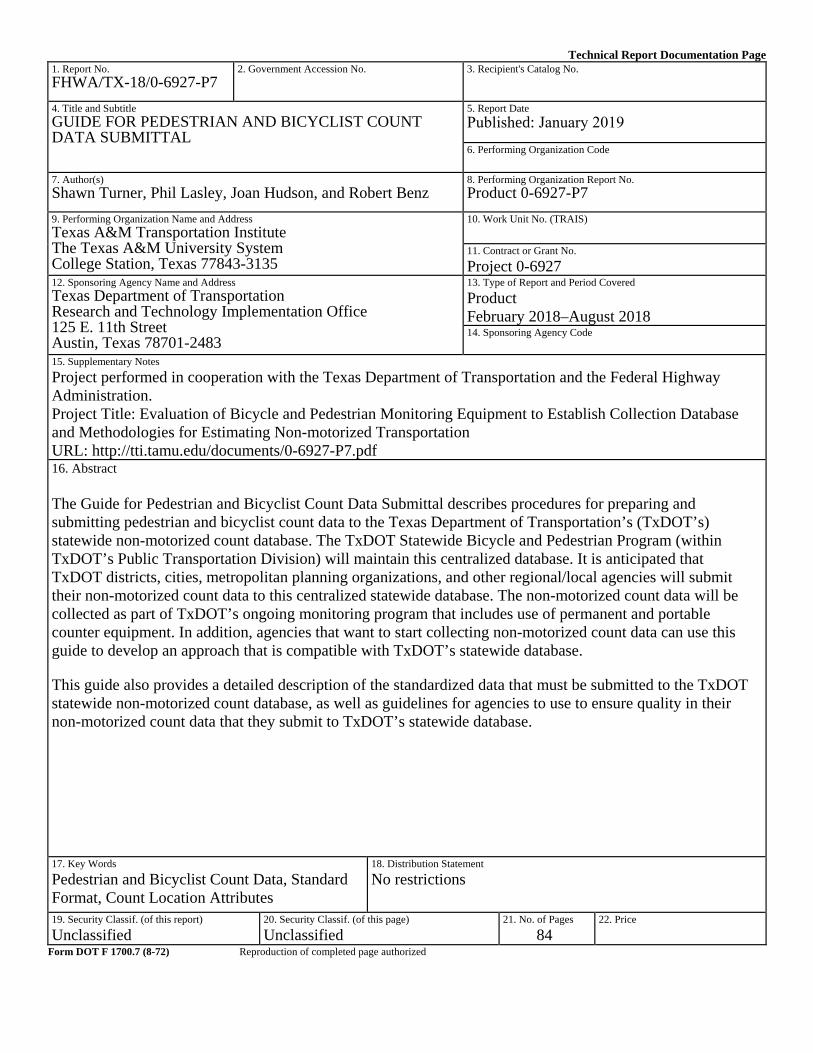
Technical Report Documentation Page 1. Report No.FHWA/TX-18/0-6927-P7
2. Government Accession No. 3. Recipient's Catalog No.
4. Title and SubtitleGUIDE FOR PEDESTRIAN AND BICYCLIST COUNT DATA SUBMITTAL
5. Report DatePublished: January 20196. Performing Organization Code
7. Author(s)Shawn Turner, Phil Lasley, Joan Hudson, and Robert Benz
8. Performing Organization Report No. Product 0-6927-P7
9. Performing Organization Name and AddressTexas A&M Transportation Institute The Texas A&M University System College Station, Texas 77843-3135
10. Work Unit No. (TRAIS)
11. Contract or Grant No. Project 0-6927
12. Sponsoring Agency Name and Address Texas Department of Transportation Research and Technology Implementation Office 125 E. 11th Street Austin, Texas 78701-2483
13. Type of Report and Period CoveredProduct February 2018–August 2018 14. Sponsoring Agency Code
15. Supplementary NotesProject performed in cooperation with the Texas Department of Transportation and the Federal Highway Administration. Project Title: Evaluation of Bicycle and Pedestrian Monitoring Equipment to Establish Collection Database and Methodologies for Estimating Non-motorized Transportation URL: http://tti.tamu.edu/documents/0-6927-P7.pdf 16. Abstract
The Guide for Pedestrian and Bicyclist Count Data Submittal describes procedures for preparing and submitting pedestrian and bicyclist count data to the Texas Department of Transportation’s (TxDOT’s) statewide non-motorized count database. The TxDOT Statewide Bicycle and Pedestrian Program (within TxDOT’s Public Transportation Division) will maintain this centralized database. It is anticipated that TxDOT districts, cities, metropolitan planning organizations, and other regional/local agencies will submit their non-motorized count data to this centralized statewide database. The non-motorized count data will be collected as part of TxDOT’s ongoing monitoring program that includes use of permanent and portable counter equipment. In addition, agencies that want to start collecting non-motorized count data can use this guide to develop an approach that is compatible with TxDOT’s statewide database.
This guide also provides a detailed description of the standardized data that must be submitted to the TxDOT statewide non-motorized count database, as well as guidelines for agencies to use to ensure quality in their non-motorized count data that they submit to TxDOT’s statewide database.
17. Key WordsPedestrian and Bicyclist Count Data, Standard Format, Count Location Attributes
18. Distribution StatementNo restrictions
19. Security Classif. (of this report)Unclassified
20. Security Classif. (of this page) Unclassified
21. No. of Pages84
22. Price
Form DOT F 1700.7 (8-72) Reproduction of completed page authorized

GUIDE FOR PEDESTRIAN AND BICYCLIST COUNT DATA SUBMITTAL
by
Shawn Turner Senior Research Engineer
Texas A&M Transportation Institute
Phil Lasley Assistant Research Scientist
Texas A&M Transportation Institute
Joan Hudson Associate Research Engineer
Texas A&M Transportation Institute
and
Robert Benz Research Engineer
Texas A&M Transportation Institute
Product 0-6927-P7 Project 0-6927
Project Title: Evaluation of Bicycle and Pedestrian Monitoring Equipment to Establish Collection Database and Methodologies for Estimating Non-motorized Transportation
Performed in cooperation with the Texas Department of Transportation
and the Federal Highway Administration
Published: January 2019
TEXAS A&M TRANSPORTATION INSTITUTE College Station, Texas 77843-3135

v
DISCLAIMER
This research was performed in cooperation with the Texas Department of Transportation (TxDOT) and the Federal Highway Administration (FHWA). The contents of this report reflect the views of the authors, who are responsible for the facts and the accuracy of the data presented herein. The contents do not necessarily reflect the official view or policies of the FHWA or TxDOT. This report does not constitute a standard, specification, or regulation.
The United States Government and the State of Texas do not endorse products or manufacturers. Trade or manufacturers’ names appear herein solely because they are considered essential to the object of this report.

vi
ACKNOWLEDGMENTS
This project was conducted in cooperation with TxDOT and FHWA. The authors thank the following members of the Project Monitoring Committee:
• Project Manager: Chris Glancy, TxDOT. • Lead: Teri Kaplan, TxDOT. • Co-Lead: Bonnie Sherman, TxDOT. • Mark Wooldridge, TxDOT. • Bill Knowles, TxDOT. • Greg Goldman, TxDOT. • Darren McDaniel, TxDOT. • Adam Chodkiewicz, TxDOT. • Shelly Harris, TxDOT. • Benjamin Miller, TxDOT. • Michael Flaming, TxDOT. • Ana Ramirez Huerta, TxDOT. • Mahendran Thivakaran, TxDOT. • Diane Dohm, Houston-Galveston Area Council. • Kelly Porter, Capital Area Metropolitan Planning Organization. • Karla Weaver, North Central Texas Council of Governments. • Alexandria Carroll, Alamo Area Metropolitan Planning Organization. • Jeffrey Pollack, Corpus Christi Metropolitan Planning Organization. • Francis Reilly, City of Austin. • Anita Holman, City of Houston. • Carl Seifert, Jacobs Engineering.
vii
TABLE OF CONTENTS LIST OF FIGURES ..................................................................................................................... viii LIST OF TABLES ......................................................................................................................... ix CHAPTER 1. INTRODUCTION AND PROGRAM OBJECTIVES ............................................ 1
Program Objectives ..................................................................................................................... 1 Organization of the Guide ........................................................................................................... 2
CHAPTER 2. OVERVIEW OF COUNT DATA SUBMITTAL PROCESS ................................. 3 Need for Standardized Non-motorized Count Data .................................................................... 3 TxDOT Approach: Adopting the Traffic Monitoring Guide Data Definitions ........................... 3 Overview of Data Submittal Procedures ..................................................................................... 4
CHAPTER 3. TxDOT DATA ATTRIBUTES FOR PEDESTRIAN AND BICYCLIST COUNTS......................................................................................................................................... 7
Station Description File ............................................................................................................... 7 Count Data File ......................................................................................................................... 33
CHAPTER 4. ENSURING QUALITY DATA ............................................................................ 41 The Importance of Quality Control ........................................................................................... 41 The QAQC Process Overview .................................................................................................. 41 Quality Assurance and Quality Control Flags and General Rules of Thumb ........................... 42 The Process of Examining Data ................................................................................................ 44 Good versus Bad Data ............................................................................................................... 49 Logging Comments ................................................................................................................... 61 Tips on What to Look for When Reviewing Data .................................................................... 61
APPENDIX A. TXDOT STATION DESCRIPTION DATA ENTRY FORM ........................... 63 APPENDIX B. NON-MOTORIZED COUNT PROGRAM GUIDELINES ............................... 67
Program Design: Permanent and Short-Duration Counts ......................................................... 67 Organizational Models—Who Does What? .............................................................................. 69 Selecting Equipment ................................................................................................................. 70 Selecting Sites ........................................................................................................................... 71 Coordination .............................................................................................................................. 73 Summary of Recommendations ................................................................................................ 73
viii
LIST OF FIGURES
Figure 1. Metadata Mislabeling Examples. .................................................................................. 44 Figure 2. Geographic Coordinate Error Example. ........................................................................ 45 Figure 3. Daily Subtotal Broad View Visualization Example—All Modes and Directions. ....... 47 Figure 4. Raw Data Broad View Visualization Example—Single Mode. .................................... 47 Figure 5. Raw Data Zoomed View Visualization Example—Single Mode. ................................ 48 Figure 6. Good Data Examples: Typical Pedestrian Counts. ........................................................ 50 Figure 7. Good Data Examples: Typical Bicycle Counts. ............................................................ 51 Figure 8. Good Data Examples: Typical Short-Duration (All Modes) Counts. ........................... 52 Figure 9. Good Data Examples: Typical Low-Usage Counts. ...................................................... 53 Figure 10. Pattern Identification Example. ................................................................................... 54 Figure 11. Bad Data Example: Partial Day Count with Spike When Counter Retrieved. ............ 55 Figure 12. Bad Data Example: Counts When Equipment Was Not in Use. ................................. 55 Figure 13. Bad Data Example: Counter Not at a Counting Location. .......................................... 55 Figure 14. Bad Data Example: Consecutive Zeros. ...................................................................... 56 Figure 15. Bad Data Example: Null Values. ................................................................................. 56 Figure 16. Bad Data Example: Counter Lag at Installation. ......................................................... 56 Figure 17. Bad Data Example: Complete Counter Malfunction. .................................................. 57 Figure 18. Bad Data Example: Counter Mode Split Malfunction. ............................................... 57 Figure 19. Bad Data Example: Counter Began to Report Daily Totals Instead of 15-Minute
Intervals............................................................................................................................. 58 Figure 20. Abnormal Event Pattern: Movie in the Park. .............................................................. 59 Figure 21. Abnormal Event Pattern: Morning Organized Cycling or Running Event. ................ 59 Figure 22. Abnormal Event Pattern: Large-Scale Bicycle Event. ................................................ 60 Figure 23. Abnormal Event Pattern: Multiday Festival. ............................................................... 60 Figure 24. Screenshot of TxDOT Station Description Data Entry Form, Top Portion. ............... 64 Figure 25. Screenshot of TxDOT Station Description Data Entry Form, Bottom Portion. .......... 65 Figure 26. TMG Summary of Technologies, Count Duration, and Cost. ..................................... 71

ix
LIST OF TABLES
Table 1. Summary of Attributes in Station Description File. ......................................................... 7 Table 2. Summary of Attributes in Count Data File. .................................................................... 33 Table 3. Key Guidance Documents for Non-motorized Count Programs. ................................... 68


1
CHAPTER 1. INTRODUCTION AND PROGRAM OBJECTIVES
This guide describes procedures for submitting pedestrian and bicyclist count data to the Texas Department of Transportation’s (TxDOT’s) statewide non-motorized count database. The TxDOT Statewide Bicycle and Pedestrian Program (within the Public Transportation Division) maintains this centralized database, and it is expected that TxDOT districts, cities, metropolitan planning organizations (MPOs), and other regional/local agencies will submit their non-motorized count data to this centralized statewide database.
The main audience for this guide includes the state, regional, and local agencies that wish to submit pedestrian and/or bicyclist count data to TxDOT’s statewide database. In many cases, these count data are being collected as part of an ongoing monitoring program that includes permanent and/or portable counter equipment. In other cases, agencies that want to start collecting non-motorized count data can use this guide to develop an approach that is compatible with TxDOT’s statewide database and the Federal Highway Administration’s (FHWA’s) Traffic Monitoring Guide (TMG).
PROGRAM OBJECTIVES
The primary objectives of TxDOT’s statewide non-motorized count database are as follows:
• Compile available pedestrian and bicyclist count data that have been collected within Texas into a standardized format.
• Provide summary reporting and analytic capabilities so that pedestrian and bicyclist count data can be used for multiple purposes, such as:
o Monitoring trends and patterns in pedestrian and bicyclist activity. o Improving the planning and design of pedestrian and bicyclist facilities. o Enabling safety analysis that accounts for pedestrian and bicyclist exposure.
• Upload Texas pedestrian and bicyclist count data to FHWA’s Travel Monitoring Analysis System (TMAS).
When initially launched in 2018, the TxDOT statewide non-motorized count database contained the most readily accessible and longest-duration count data in Texas. Because these count data were previously collected by state, regional, and local agencies at specific locations selected by these agencies, the statewide database may not include a statistically representative sample of all roads, streets, or pedestrian/bicyclist facilities in Texas. Therefore, it may be challenging to meet all non-motorized data needs with this initial database launch. However, as the number of submitting agencies grows and as the number of count locations increase and count data accumulate over multiple years, this statewide database will meet more of the objectives identified above.

2
ORGANIZATION OF THE GUIDE
The organization of this guide is as follows:
• Chapter 1. Introduction and Program Objectives: Introduces the purpose and objectives of the TxDOT database and monitoring program.
• Chapter 2. Overview of Count Data Submittal Process: Provides an overview of the process and requirements for submitting non-motorized count data to the TxDOT statewide database.
• Chapter 3. TxDOT Data Attributes for Pedestrian and Bicyclist Counts: Provides a detailed description of the standardized data that must be submitted to the TxDOT statewide non-motorized count database.
• Chapter 4. Ensuring Quality Data: Provides guidelines for agencies to use to ensure quality in their non-motorized count data that they submit to TxDOT’s statewide database.
• Appendix A. TxDOT Station Description Data Entry Form: Illustrates the use of an Excel-based form to simplify entering standardized metadata for each non-motorized count location.
• Appendix B. Non-motorized Count Program Guidelines: Summarizes guidance on developing and maintaining a non-motorized count monitoring program, including selecting locations, equipment, dates and times, and other useful information.

3
CHAPTER 2. OVERVIEW OF COUNT DATA SUBMITTAL PROCESS
This chapter provides an overview of the process and requirements for submitting non-motorized count data to the TxDOT statewide database. This chapter also describes the need for standardizing non-motorized count data and the standardization approach that is being used in the TxDOT statewide non-motorized count database.
NEED FOR STANDARDIZED NON-MOTORIZED COUNT DATA
There has been no standardized approach to exchange or store non-motorized count data. Multiple agencies across the state collect data in different formats and store the data in different file types. In addition, TxDOT intends to contribute statewide data to FHWA’s TMAS. Therefore, defining standardized count data attributes will streamline collection and distribution of data among multiple agencies.
TXDOT APPROACH: ADOPTING THE TRAFFIC MONITORING GUIDE DATA DEFINITIONS
For the statewide non-motorized count database, TxDOT has adopted data definitions from FHWA’s TMG (https://www.fhwa.dot.gov/policyinformation/tmguide/), a national document that is the de facto industry standard for roadway-based traffic monitoring (including pedestrians and bicyclists). Thus, the TxDOT approach is consistent with the national de facto guidance document and is more likely to be consistent with numerous other state departments of transportation (DOTs) and regional/local agencies that use the TMG.
Therefore, the TMG serves as a base for standardization. Fourteen additional data attributes providing location, ownership, and equipment details also are required to meet specific TxDOT and other state and local agencies’ requirements. The TMG data attributes and definitions, as well as the additional TxDOT data attributes, are described in detail in Chapter 3. The rest of this chapter provides a high-level overview of these standardized data attributes and outlines how state, regional, and local agencies should submit these data to TxDOT’s statewide count database.
Those agencies that wish to submit their non-motorized count data to TxDOT must provide two basic data sets: station description data and count data. Each data set is described in the following sections.
Station Description Data
The station description data include descriptive attributes for each non-motorized count station. A count station is defined as a unique location where non-motorized counts have been or are being collected. The station description data include attributes such as:
• Various geographic location descriptors (e.g., state, city, county, latitude, and longitude). • Mode and direction of non-motorized travel being counted. • Roadway inventory and land use characteristics at the count location. • Counter equipment type and description. • Contact information for relevant agencies and persons.
4
Some of the most important station description attributes are required for submittal, while others are optional. The specific requirements for each station description attribute are described in detail in Chapter 3.
A count station is a unique location that can be considered independent of other count locations. For non-motorized counts, a station can take several forms:
• A screen line on a street or road that includes non-motorized travel (regardless of travel direction) on both sides of the road.
• A screen line on a street or road that includes non-motorized travel (regardless of travel direction) on ONLY ONE side of the road.
• A screen line on a shared use path or other distinct non-motorized facility. • One or more intersections or mid-block street crossings. • An open space (e.g., pedestrian plaza) without discretely marked travel paths.
Extensive guidance on designating stations can be found in FHWA’s Coding Nonmotorized Station Location Information in the 2016 Traffic Monitoring Guide Format available at https://www.fhwa.dot.gov/environment/bicycle_pedestrian/publications/tmg_coding/.
Count Data
The count data include the actual non-motorized counts that have been collected at stations listed in the corresponding station description data set. The count data include several unique station location identifiers that link the count data to the station description, as well as several other required and optional attributes:
• Mode and direction of non-motorized travel being counted. • Descriptive attributes of non-motorized travelers (e.g., helmet use, gender, age group). • Weather conditions at time of count (e.g., precipitation and temperature range). • Date, time, and reporting interval of non-motorized count. • Non-motorized count for corresponding date/time/interval. • Validity codes indicating whether each count is valid, invalid, or abnormal but valid.
OVERVIEW OF DATA SUBMITTAL PROCEDURES
Submittal Frequency and Timeline
Those agencies that wish to submit their non-motorized count data to TxDOT should provide the required data according to the following schedule:
• For permanent count locations that collect continuous year-round data: at a minimum, count data for the previous calendar year should be submitted to TxDOT no later than March 31 of each year. Earlier or more frequent submittals are accepted and encouraged.
• For temporary count locations: at a minimum, non-motorized count data should be submitted no later than six months after the last day of data collection. Earlier or more frequent submittals are accepted and encouraged.
5
Submittal Format
If submitted to TxDOT, non-motorized count data, which comprise both the station description and the count data, should include all the required attributes detailed in Chapter 3.
All non-motorized count data should include the required validity code (see page 39, Attribute #17) that indicates whether the data being submitted are valid, invalid, or abnormal but valid.
The station description and count data should be submitted as separate files, in an Excel spreadsheet or comparable delimited-text file, in the order and format detailed in Chapter 3.
Appendix A describes a station description data entry form in Microsoft Excel that can be used to simplify entering station description data attributes.
The count station description and data should be submitted via email to [email protected] in the format described above. Data submissions that exceed 10 megabytes will be handled through an online file-sharing service. Agencies should contact [email protected] for specific file upload instructions.
Submittal via Internet Cloud-Based System
Several agencies in Texas currently store their non-motorized count data in an Internet cloud-based system maintained by their equipment manufacturer. Those agencies that wish to submit their non-motorized count data to TxDOT directly from this third-party cloud-based system must provide the required permissions for TxDOT to access the existing station description and count data. If additional information is necessary to meet the station description and count data requirements listed in Chapter 3, the agencies must provide the additional information in a timely manner.


7
CHAPTER 3. TxDOT DATA ATTRIBUTES FOR PEDESTRIAN AND BICYCLIST COUNTS
This chapter provides detailed descriptions of the standardized data attributes that should be submitted to the TxDOT statewide non-motorized count database. As indicated in Chapter 2, these data attributes should be submitted in two separate files:
• Station description file. • Count data file.
The exact contents required in each of these files is described in this chapter. An example is provided to illustrate application of these standardized data definitions.
STATION DESCRIPTION FILE
The station description file contains descriptive attributes for each count station, as shown in Table 1 and on the following pages. Some of these attributes have been established in the TMG. Additional guidance for coding TMG-specified attributes can be found in FHWA’s Coding Nonmotorized Station Location Information in the 2016 Traffic Monitoring Guide Format at https://www.fhwa.dot.gov/environment/bicycle_pedestrian/publications/tmg_coding/.
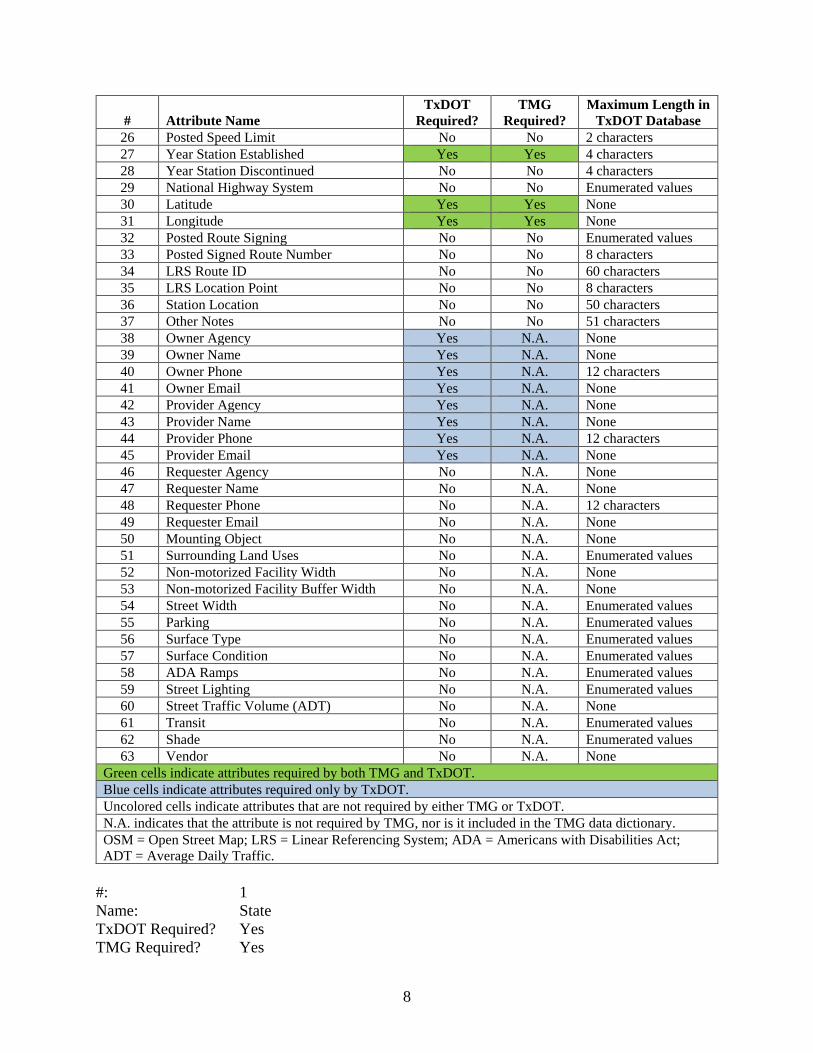
Table 1. Summary of Attributes in Station Description File.
# Attribute Name TxDOT
Required? TMG
Required? Maximum Length in
TxDOT Database 1 State Yes Yes Enumerated values 2 TxDOT District Yes N.A. Enumerated values 3 County Yes Yes Enumerated values 4 City/Area Yes N.A. None 5 Station ID TMG Yes Yes 6 characters 6 Station Name Yes N.A. None 7 Flow ID TxDOT Yes N.A. 14 characters 8 Station ID Agency No N.A. None 9 Travel Direction Yes N.A. Enumerated values
10 Functional Classification Yes Yes Enumerated values 11 Direction of Route Yes Yes Enumerated values 12 Location of Count Relative to Roadway Yes Yes Enumerated values 13 Direction of Movement Yes Yes Enumerated values 14 Facility Type Yes Yes Enumerated values 15 Intersection No No Enumerated values 16 Type of Count Yes Yes Enumerated values 17 Method of Counting Yes Yes Enumerated values 18 Type of Sensor Yes No Enumerated values 19 Year of Data Yes Yes 4 characters 20 Factor Group 1 No No 1 character 21 Factor Group 2 No No 1 character 22 Factor Group 3 No No 1 character 23 Factor Group 4 No No 1 character 24 Factor Group 5 No No 1 character 25 Primary Count Purpose No No Enumerated values
8
# Attribute Name TxDOT
Required? TMG
Required? Maximum Length in
TxDOT Database 26 Posted Speed Limit No No 2 characters 27 Year Station Established Yes Yes 4 characters 28 Year Station Discontinued No No 4 characters 29 National Highway System No No Enumerated values 30 Latitude Yes Yes None 31 Longitude Yes Yes None 32 Posted Route Signing No No Enumerated values 33 Posted Signed Route Number No No 8 characters 34 LRS Route ID No No 60 characters 35 LRS Location Point No No 8 characters 36 Station Location No No 50 characters 37 Other Notes No No 51 characters 38 Owner Agency Yes N.A. None 39 Owner Name Yes N.A. None 40 Owner Phone Yes N.A. 12 characters 41 Owner Email Yes N.A. None 42 Provider Agency Yes N.A. None 43 Provider Name Yes N.A. None 44 Provider Phone Yes N.A. 12 characters 45 Provider Email Yes N.A. None 46 Requester Agency No N.A. None 47 Requester Name No N.A. None 48 Requester Phone No N.A. 12 characters 49 Requester Email No N.A. None 50 Mounting Object No N.A. None 51 Surrounding Land Uses No N.A. Enumerated values 52 Non-motorized Facility Width No N.A. None 53 Non-motorized Facility Buffer Width No N.A. None 54 Street Width No N.A. Enumerated values 55 Parking No N.A. Enumerated values 56 Surface Type No N.A. Enumerated values 57 Surface Condition No N.A. Enumerated values 58 ADA Ramps No N.A. Enumerated values 59 Street Lighting No N.A. Enumerated values 60 Street Traffic Volume (ADT) No N.A. None 61 Transit No N.A. Enumerated values 62 Shade No N.A. Enumerated values 63 Vendor No N.A. None
Green cells indicate attributes required by both TMG and TxDOT. Blue cells indicate attributes required only by TxDOT. Uncolored cells indicate attributes that are not required by either TMG or TxDOT. N.A. indicates that the attribute is not required by TMG, nor is it included in the TMG data dictionary. OSM = Open Street Map; LRS = Linear Referencing System; ADA = Americans with Disabilities Act; ADT = Average Daily Traffic.
#: 1 Name: State TxDOT Required? Yes TMG Required? Yes
9
Maximum Length: Enumerated values Description: State in which count station is located. Use actual text value but note that
TMG requires a 2-digit Federal Information Processing Standard (FIPS) state code.
Example: “Texas”
#: 2 Name: TxDOT District TxDOT Required? Yes TMG Required? No (not included in TMG) Maximum Length: Enumerated values Description: TxDOT district in which count station is located. See
http://www.txdot.gov/inside-txdot/district.html for listing of TxDOT districts.
Example: “Corpus Christi”
#: 3 Name: County TxDOT Required? Yes TMG Required? Yes Maximum Length: Enumerated values Description: County in which count station is located. Use actual text value but note
that TMG requires a 3-digit FIPS county code. Example: “Nueces”
#: 4 Name: City/Area TxDOT Required? Yes TMG Required? No (not included in TMG) Maximum Length: None Description: City, jurisdiction, or distinct area within a city in which count station is
located. Example: “Corpus Christi”
#: 5 Name: Station ID TMG TxDOT Required? Yes TMG Required? Yes Maximum Length: 6 characters Description: A unique alphanumeric identifier for the count station. FHWA’s TMG
limits this to six alphanumeric characters. For TxDOT purposes, the first two characters should be an abbreviation of the city/area name, and the remaining four characters should be a sequential numeric identifier.
Example: “CC0001”
10
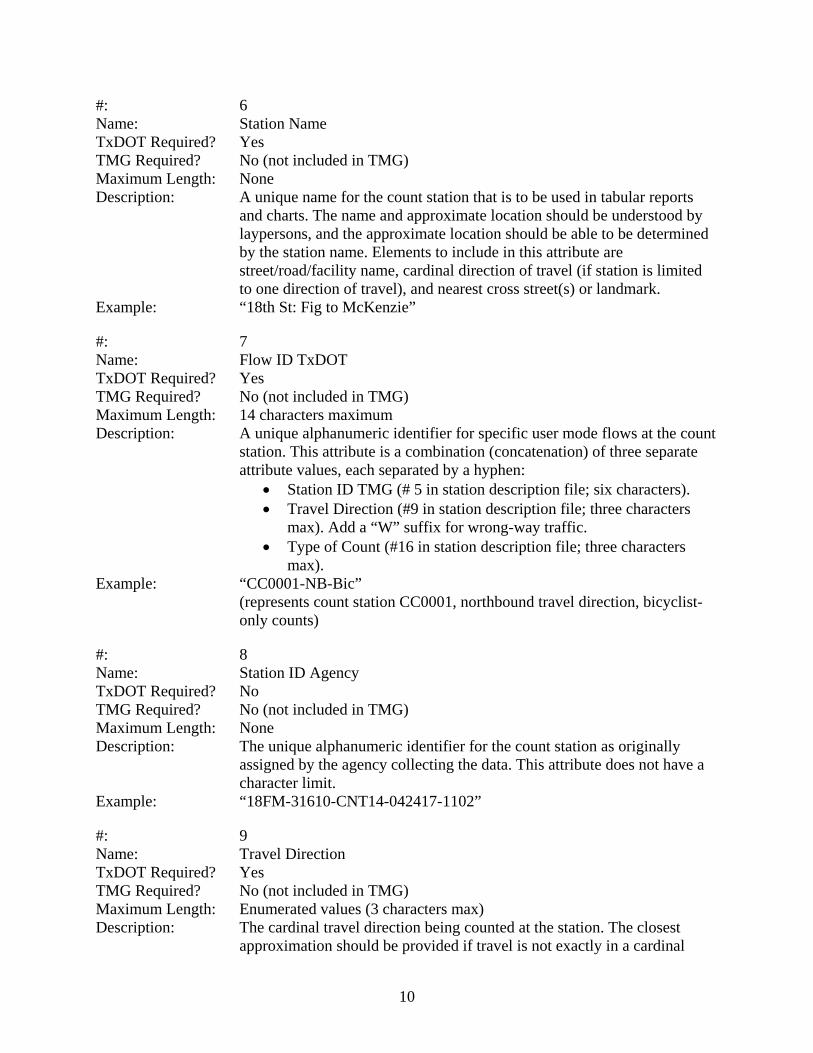
#: 6 Name: Station Name TxDOT Required? Yes TMG Required? No (not included in TMG) Maximum Length: None Description: A unique name for the count station that is to be used in tabular reports
and charts. The name and approximate location should be understood by laypersons, and the approximate location should be able to be determined by the station name. Elements to include in this attribute are street/road/facility name, cardinal direction of travel (if station is limited to one direction of travel), and nearest cross street(s) or landmark.
Example: “18th St: Fig to McKenzie”
#: 7 Name: Flow ID TxDOT TxDOT Required? Yes TMG Required? No (not included in TMG) Maximum Length: 14 characters maximum Description: A unique alphanumeric identifier for specific user mode flows at the count
station. This attribute is a combination (concatenation) of three separate attribute values, each separated by a hyphen:
• Station ID TMG (# 5 in station description file; six characters). • Travel Direction (#9 in station description file; three characters
max). Add a “W” suffix for wrong-way traffic. • Type of Count (#16 in station description file; three characters
max). Example: “CC0001-NB-Bic”
(represents count station CC0001, northbound travel direction, bicyclist-only counts)
#: 8 Name: Station ID Agency TxDOT Required? No TMG Required? No (not included in TMG) Maximum Length: None Description: The unique alphanumeric identifier for the count station as originally
assigned by the agency collecting the data. This attribute does not have a character limit.
Example: “18FM-31610-CNT14-042417-1102”
#: 9 Name: Travel Direction TxDOT Required? Yes TMG Required? No (not included in TMG) Maximum Length: Enumerated values (3 characters max) Description: The cardinal travel direction being counted at the station. The closest
approximation should be provided if travel is not exactly in a cardinal
11
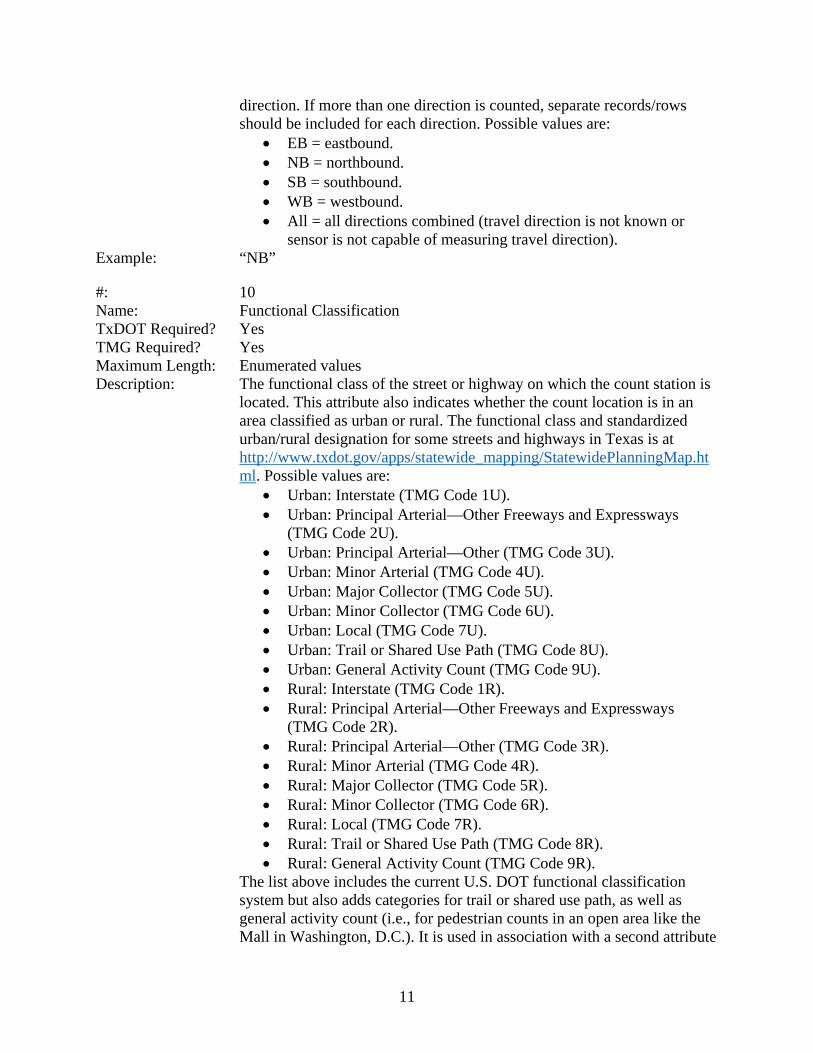
direction. If more than one direction is counted, separate records/rows should be included for each direction. Possible values are:
• EB = eastbound. • NB = northbound. • SB = southbound. • WB = westbound. • All = all directions combined (travel direction is not known or
sensor is not capable of measuring travel direction). Example: “NB”
#: 10 Name: Functional Classification TxDOT Required? Yes TMG Required? Yes Maximum Length: Enumerated values Description: The functional class of the street or highway on which the count station is
located. This attribute also indicates whether the count location is in an area classified as urban or rural. The functional class and standardized urban/rural designation for some streets and highways in Texas is at http://www.txdot.gov/apps/statewide_mapping/StatewidePlanningMap.html. Possible values are:
• Urban: Interstate (TMG Code 1U). • Urban: Principal Arterial—Other Freeways and Expressways
(TMG Code 2U). • Urban: Principal Arterial—Other (TMG Code 3U). • Urban: Minor Arterial (TMG Code 4U). • Urban: Major Collector (TMG Code 5U). • Urban: Minor Collector (TMG Code 6U). • Urban: Local (TMG Code 7U). • Urban: Trail or Shared Use Path (TMG Code 8U). • Urban: General Activity Count (TMG Code 9U). • Rural: Interstate (TMG Code 1R). • Rural: Principal Arterial—Other Freeways and Expressways
(TMG Code 2R). • Rural: Principal Arterial—Other (TMG Code 3R). • Rural: Minor Arterial (TMG Code 4R). • Rural: Major Collector (TMG Code 5R). • Rural: Minor Collector (TMG Code 6R). • Rural: Local (TMG Code 7R). • Rural: Trail or Shared Use Path (TMG Code 8R). • Rural: General Activity Count (TMG Code 9R).
The list above includes the current U.S. DOT functional classification system but also adds categories for trail or shared use path, as well as general activity count (i.e., for pedestrian counts in an open area like the Mall in Washington, D.C.). It is used in association with a second attribute
12
(facility type) that indicates whether the count was made on the main roadway, on a sidewalk, or on a special lane intended for use exclusively by non-motorized vehicles (e.g., bike lane).
Example: “Urban: Local (7U)”
#: 11 Name: Direction of Route TxDOT Required? Yes TMG Required? Yes Maximum Length: Enumerated values Description: This is the geographic orientation of the main roadway. Note that a
north/south roadway can be coded as either an “N” or an “S,” but the selection of the direction affects how the “location of count relative to roadway” variable (the next variable) is coded in order to effectively define the location and direction of the non-motorized count. Direction of route should be chosen carefully so that field collectors and users of the count data can easily comprehend where and in what direction counts are collected at this station. Note: For a general activity count (functional class coded as 9), direction of route may be coded as either 0 or 9. Possible values are:
• East-west or southeast-northwest combined (TMG Code 0). • North (TMG Code 1). • Northeast (TMG Code 2). • East (TMG Code 3). • Southeast (TMG Code 4). • South (TMG Code 5). • Southwest (TMG Code 6). • West (TMG Code 7). • Northwest (TMG Code 8). • North-south or northeast-southwest combined (TMG Code 9).
Example: “Northwest (8)”
#: 12 Name: Location of Count Relative to Roadway TxDOT Required? Yes TMG Required? Yes Maximum Length: Enumerated values Description: Possible values are:
• 1 = the count is taken on the side of the road for the listed direction of route.
• 2 = the count is taken on the opposite side of the road from the listed direction (i.e., the side with oncoming traffic, given the listed direction of route).
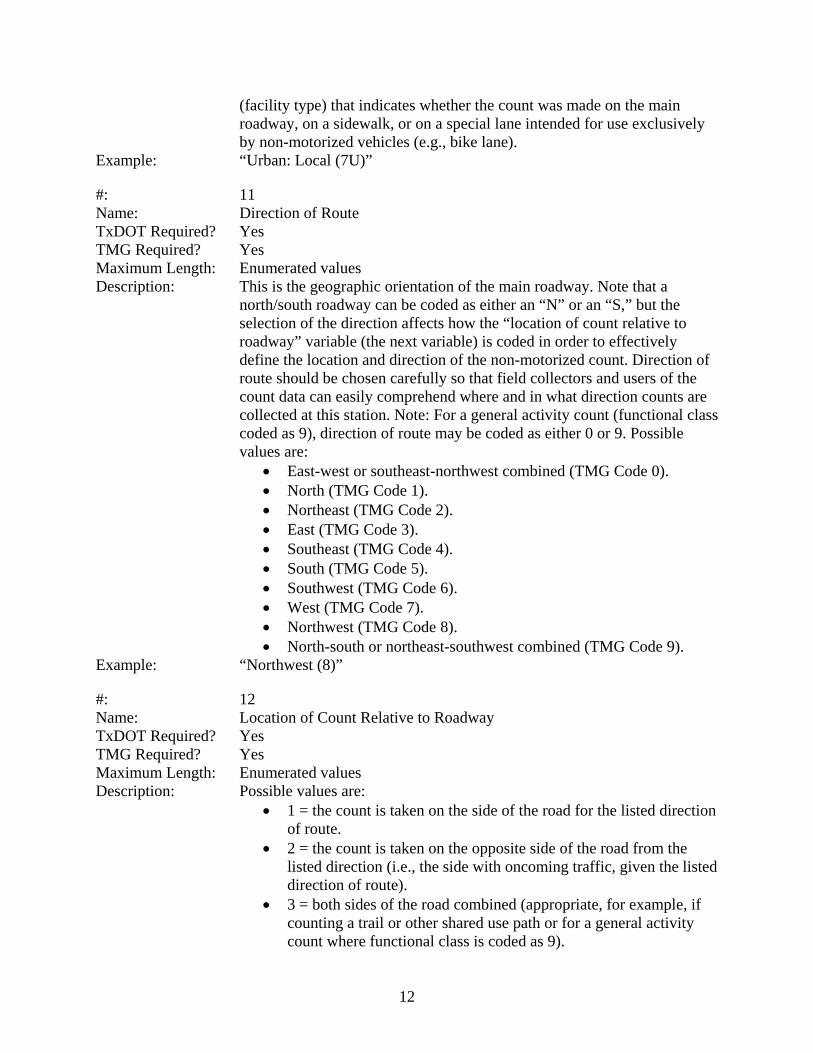
• 3 = both sides of the road combined (appropriate, for example, if counting a trail or other shared use path or for a general activity count where functional class is coded as 9).
13
• 4 = traffic moving perpendicular to the roadway (that is, crossing the street).
Note: If this attribute value is set to 4 (traffic moving perpendicular to the roadway), then the “direction of movement” attribute must have a value of 3 (both ways), 5 (left to right), or 6 (right to left).
Example: If you code the direction of route as “north” and are in fact facing in that northbound direction, a 1 for this variable would indicate that you are counting on the right (eastern) side of the road; a 2 would indicate you are counting non-motorized traffic on the left (western) side of the road; a 3 would indicate that you are counting all non-motorized traffic, regardless of which side of the road (which would be appropriate, for example, on a trail or other shared use path). For that same facility, if direction of route were coded as “south,” then a count performed on the eastern side of the road would be coded as a 2 since it would be on the opposite side of the road for vehicles traveling southbound.
Example: “Both sides of the route combined (3)”
#: 13 Name: Direction of Movement TxDOT Required? Yes TMG Required? Yes Maximum Length: Enumerated values Description: Possible values are:
• 1 = travel monitored only occurring in the direction of route. • 2 = travel monitored only occurring opposite to the direction of
route. • 3 = travel in both (all) directions. • 4 = travel at an intersection that includes all movements (e.g., the
sum of movements on all four crosswalks, or all movements occurring during a pedestrian scramble [or “Barnes Dance”] phase). Note: The “intersection” variable should also be coded as a 1 or 2 if this variable is coded as a 4. For a general activity count that includes all movements in all directions (functional class coded as 9, direction of route coded as 0 or 9), direction of movement should be coded as a 3, “all directions.”
• 5 = travel monitored perpendicular to direction of route, crossing from left to right (facing direction of route).
• 6 = travel monitored perpendicular to direction of route, crossing from right to left (facing direction of route).
Note: To actually understand where a count is being taken (what side of the road, and which directions of movement are being counted), it is necessary to look at all three variables: direction of route, location of count relative to roadway, and direction of movement. It may also be necessary to look at the facility type variable immediately below.

14
Note: If this field is set to either of the perpendicular codes (5 or 6), then location of count relative to roadway must be set to 4 (perpendicular to roadway).
Example: “Only in Direction of Route (1)”
#: 14 Name: Facility Type TxDOT Required? Yes TMG Required? Yes Maximum Length: Enumerated values Description: Indicates where the count was taken relative to the primary right of way.
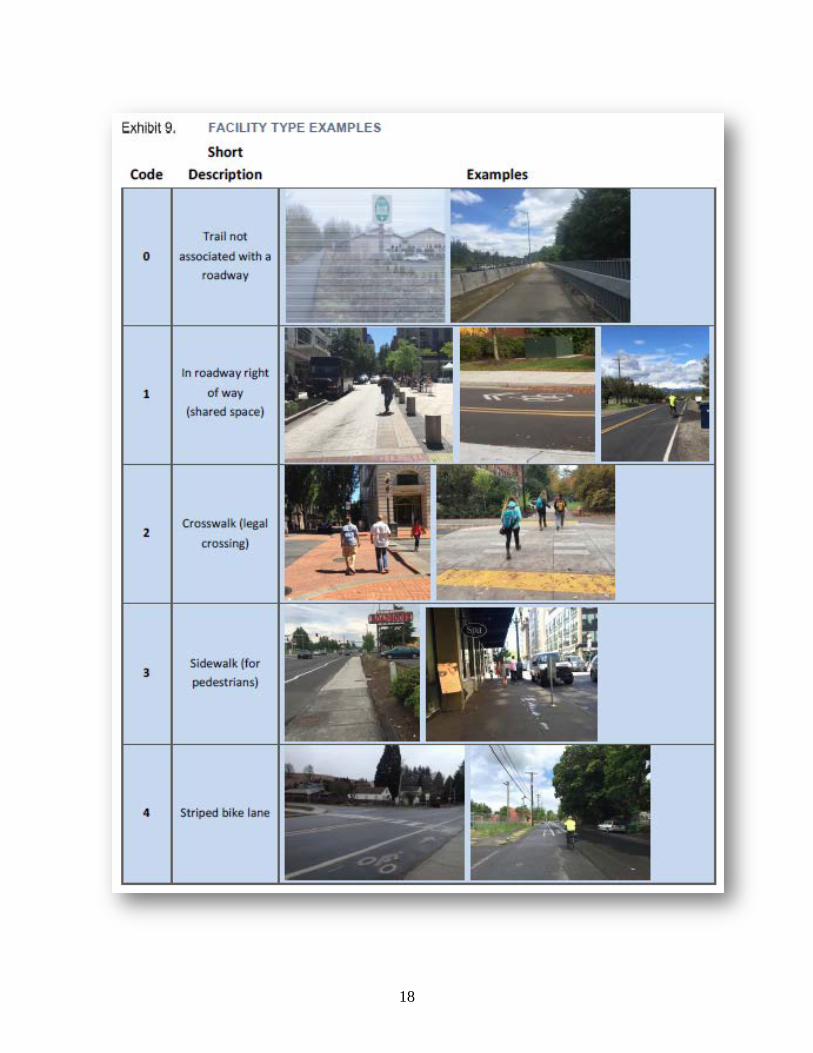
Possible values are: • 0 = on a trail not intended for on-road motor vehicles (may
accommodate snowmobiles or other off-road motorized vehicles) and not within the right of way of an adjacent road.
• 1 = in a shared roadway lane. Note that this option refers to locations where non-motorized users share the space with vehicles—like a sharrow or wide curb lane shared by cars and bicycles, a facility where pedestrians or bicyclists use the street rather than the roadside, or a forest road that is maintained, even if rarely used, for motor vehicles. Note that if “perpendicular to traffic” (4) is selected in the “location of count relative to roadway” variable and the “facility type” variable is coded as “in roadway right of way” (1), then the count includes ALL people crossing a roadway.
• 2 = exclusively in a crosswalk. If this option is chosen, then only those in the crosswalk (or directly next to the crosswalk) are being counted. This coding differentiation is designed to indicate if all pedestrians crossing a street within a given block (including jaywalkers) are being counted or whether only pedestrians actually using a marked crosswalk are being counted.
• 3 = on a sidewalk intended primarily or exclusively for pedestrians.
• 4 = in a striped (painted) bicycle lane (with no physical barrier separating adjacent motorized traffic). Note that this category also includes shoulder facilities used by bicyclists and/or pedestrians and buffered bicycle lanes with no vertical separation between motor vehicles and cyclists.
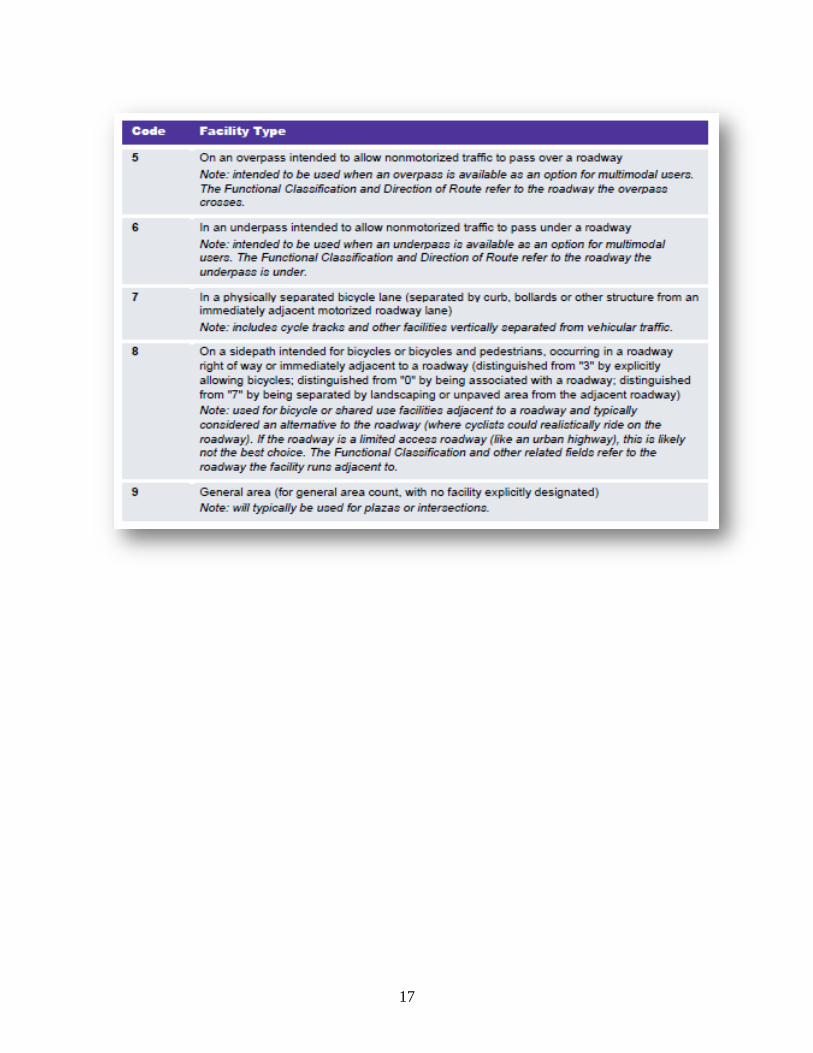
• 5 = on an overpass intended to allow non-motorized traffic to pass over a roadway.
• 6 = in an underpass intended to allow non-motorized traffic to pass under a roadway.
• 7 = in a physically separated bicycle lane or cycle track (separated by a curb, bollards, or other vertical element from an immediately adjacent motorized roadway lane).

15
• 8 = on a sidepath intended for bicycles or for bicycles and pedestrians, occurring in a roadway right of way or immediately adjacent to a roadway (distinguished from 3 by explicitly allowing bicycles; distinguished from 0 by being associated with a roadway; distinguished from 7 by being separated by landscaping or an unpaved area from the adjacent roadway).
• 9 = general area (for general area count, with no facility explicitly designated).
Example: “Shared roadway lane (1)”
Additional guidance for coding the facility type is provided on the following pages, which have been extracted directly from pages 18 through 21 of FHWA’s Coding Nonmotorized Station Location Information in the 2016 Traffic Monitoring Guide Format available at https://www.fhwa.dot.gov/environment/bicycle_pedestrian/publications/tmg_coding/.

16
17
18

19
20
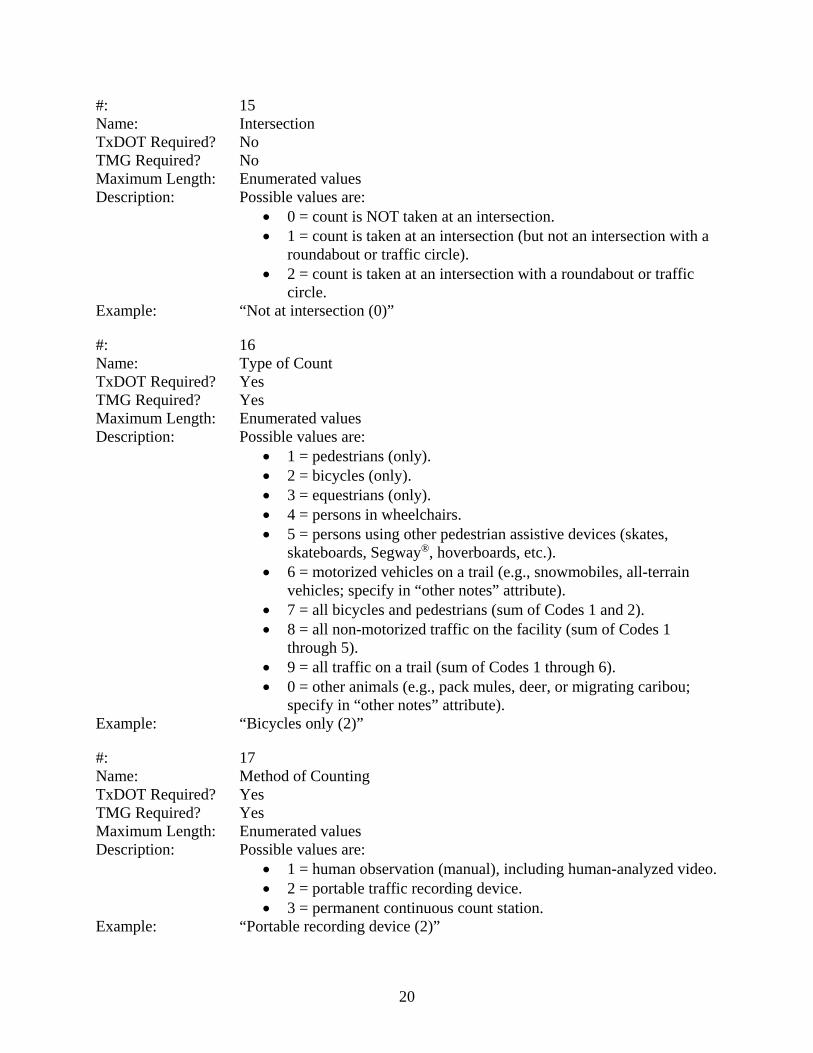
#: 15 Name: Intersection TxDOT Required? No TMG Required? No Maximum Length: Enumerated values Description: Possible values are:
• 0 = count is NOT taken at an intersection. • 1 = count is taken at an intersection (but not an intersection with a
roundabout or traffic circle). • 2 = count is taken at an intersection with a roundabout or traffic
circle. Example: “Not at intersection (0)”
#: 16 Name: Type of Count TxDOT Required? Yes TMG Required? Yes Maximum Length: Enumerated values Description: Possible values are:
• 1 = pedestrians (only). • 2 = bicycles (only). • 3 = equestrians (only). • 4 = persons in wheelchairs. • 5 = persons using other pedestrian assistive devices (skates,
skateboards, Segway®, hoverboards, etc.). • 6 = motorized vehicles on a trail (e.g., snowmobiles, all-terrain
vehicles; specify in “other notes” attribute). • 7 = all bicycles and pedestrians (sum of Codes 1 and 2). • 8 = all non-motorized traffic on the facility (sum of Codes 1
through 5). • 9 = all traffic on a trail (sum of Codes 1 through 6). • 0 = other animals (e.g., pack mules, deer, or migrating caribou;
specify in “other notes” attribute). Example: “Bicycles only (2)”
#: 17 Name: Method of Counting TxDOT Required? Yes TMG Required? Yes Maximum Length: Enumerated values Description: Possible values are:
• 1 = human observation (manual), including human-analyzed video. • 2 = portable traffic recording device. • 3 = permanent continuous count station.
Example: “Portable recording device (2)”
21
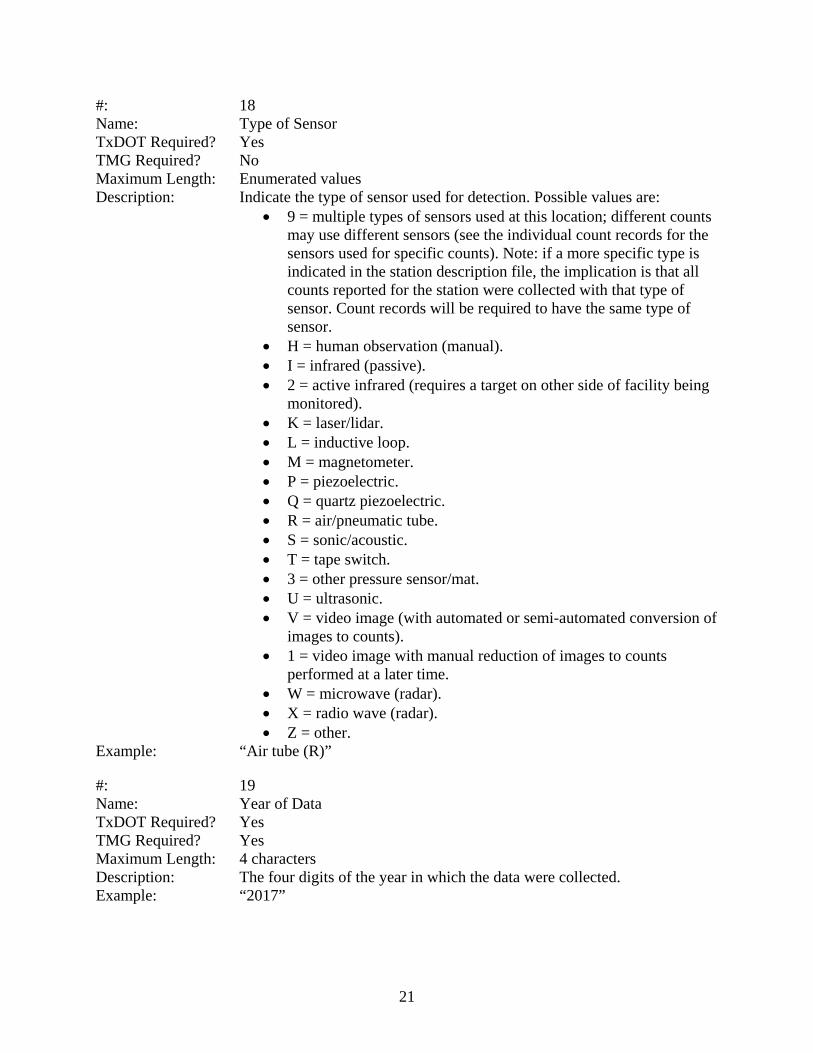
#: 18 Name: Type of Sensor TxDOT Required? Yes TMG Required? No Maximum Length: Enumerated values Description: Indicate the type of sensor used for detection. Possible values are:
• 9 = multiple types of sensors used at this location; different counts may use different sensors (see the individual count records for the sensors used for specific counts). Note: if a more specific type is indicated in the station description file, the implication is that all counts reported for the station were collected with that type of sensor. Count records will be required to have the same type of sensor.
• H = human observation (manual). • I = infrared (passive). • 2 = active infrared (requires a target on other side of facility being
monitored). • K = laser/lidar. • L = inductive loop. • M = magnetometer. • P = piezoelectric. • Q = quartz piezoelectric. • R = air/pneumatic tube. • S = sonic/acoustic. • T = tape switch. • 3 = other pressure sensor/mat. • U = ultrasonic. • V = video image (with automated or semi-automated conversion of
images to counts). • 1 = video image with manual reduction of images to counts
performed at a later time. • W = microwave (radar). • X = radio wave (radar). • Z = other.
Example: “Air tube (R)”
#: 19 Name: Year of Data TxDOT Required? Yes TMG Required? Yes Maximum Length: 4 characters Description: The four digits of the year in which the data were collected. Example: “2017”
22
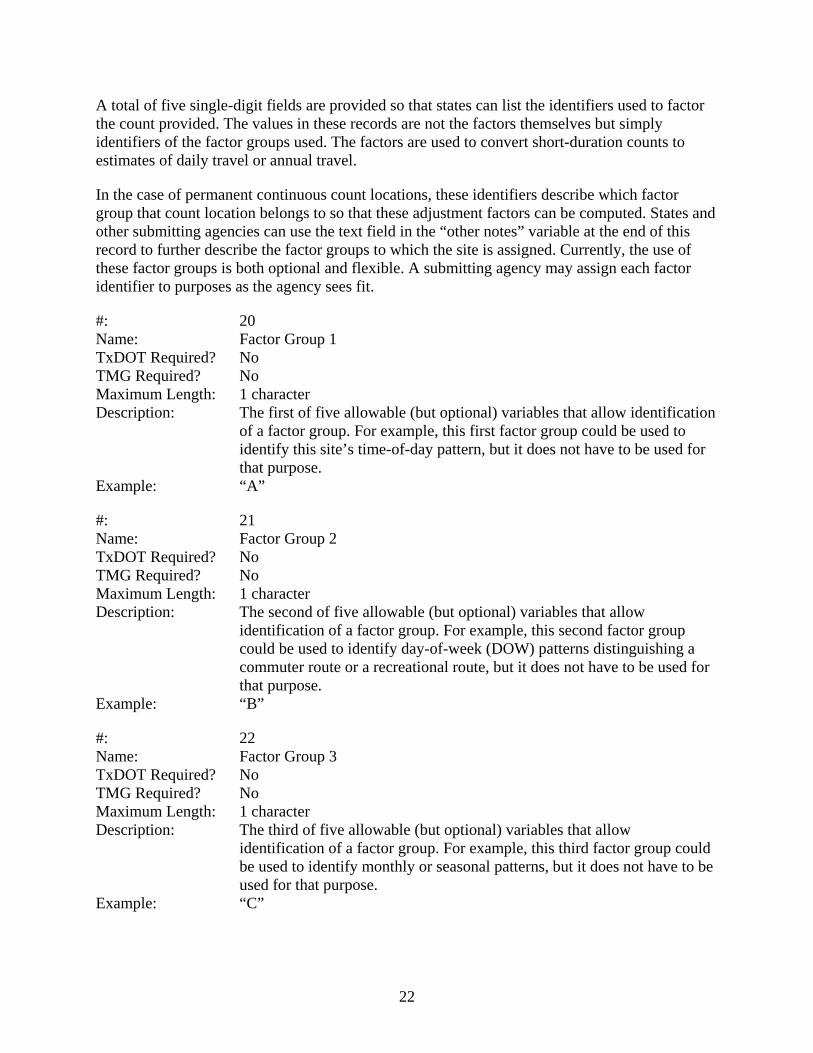
A total of five single-digit fields are provided so that states can list the identifiers used to factor the count provided. The values in these records are not the factors themselves but simply identifiers of the factor groups used. The factors are used to convert short-duration counts to estimates of daily travel or annual travel.
In the case of permanent continuous count locations, these identifiers describe which factor group that count location belongs to so that these adjustment factors can be computed. States and other submitting agencies can use the text field in the “other notes” variable at the end of this record to further describe the factor groups to which the site is assigned. Currently, the use of these factor groups is both optional and flexible. A submitting agency may assign each factor identifier to purposes as the agency sees fit.
#: 20 Name: Factor Group 1 TxDOT Required? No TMG Required? No Maximum Length: 1 character Description: The first of five allowable (but optional) variables that allow identification
of a factor group. For example, this first factor group could be used to identify this site’s time-of-day pattern, but it does not have to be used for that purpose.
Example: “A”
#: 21 Name: Factor Group 2 TxDOT Required? No TMG Required? No Maximum Length: 1 character Description: The second of five allowable (but optional) variables that allow
identification of a factor group. For example, this second factor group could be used to identify day-of-week (DOW) patterns distinguishing a commuter route or a recreational route, but it does not have to be used for that purpose.
Example: “B”
#: 22 Name: Factor Group 3 TxDOT Required? No TMG Required? No Maximum Length: 1 character Description: The third of five allowable (but optional) variables that allow
identification of a factor group. For example, this third factor group could be used to identify monthly or seasonal patterns, but it does not have to be used for that purpose.
Example: “C”
23
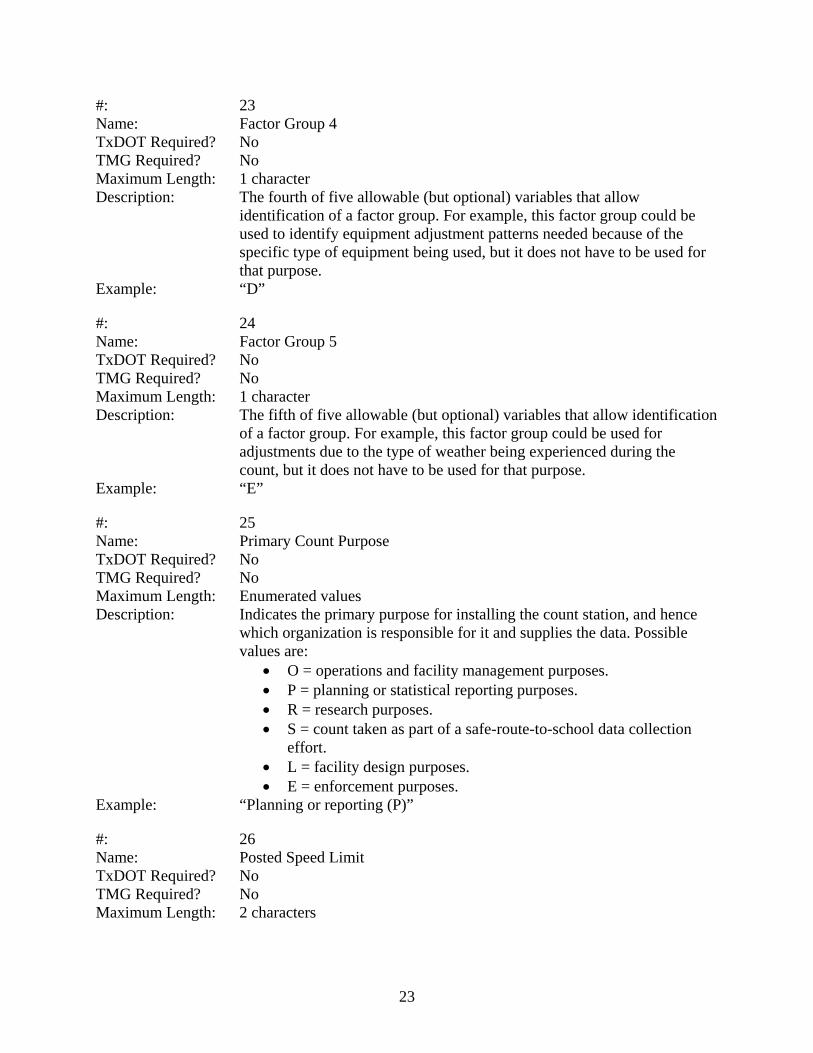
#: 23 Name: Factor Group 4 TxDOT Required? No TMG Required? No Maximum Length: 1 character Description: The fourth of five allowable (but optional) variables that allow
identification of a factor group. For example, this factor group could be used to identify equipment adjustment patterns needed because of the specific type of equipment being used, but it does not have to be used for that purpose.
Example: “D”
#: 24 Name: Factor Group 5 TxDOT Required? No TMG Required? No Maximum Length: 1 character Description: The fifth of five allowable (but optional) variables that allow identification
of a factor group. For example, this factor group could be used for adjustments due to the type of weather being experienced during the count, but it does not have to be used for that purpose.
Example: “E”
#: 25 Name: Primary Count Purpose TxDOT Required? No TMG Required? No Maximum Length: Enumerated values Description: Indicates the primary purpose for installing the count station, and hence
which organization is responsible for it and supplies the data. Possible values are:
• O = operations and facility management purposes. • P = planning or statistical reporting purposes. • R = research purposes. • S = count taken as part of a safe-route-to-school data collection
effort. • L = facility design purposes. • E = enforcement purposes.
Example: “Planning or reporting (P)”
#: 26 Name: Posted Speed Limit TxDOT Required? No TMG Required? No Maximum Length: 2 characters
24
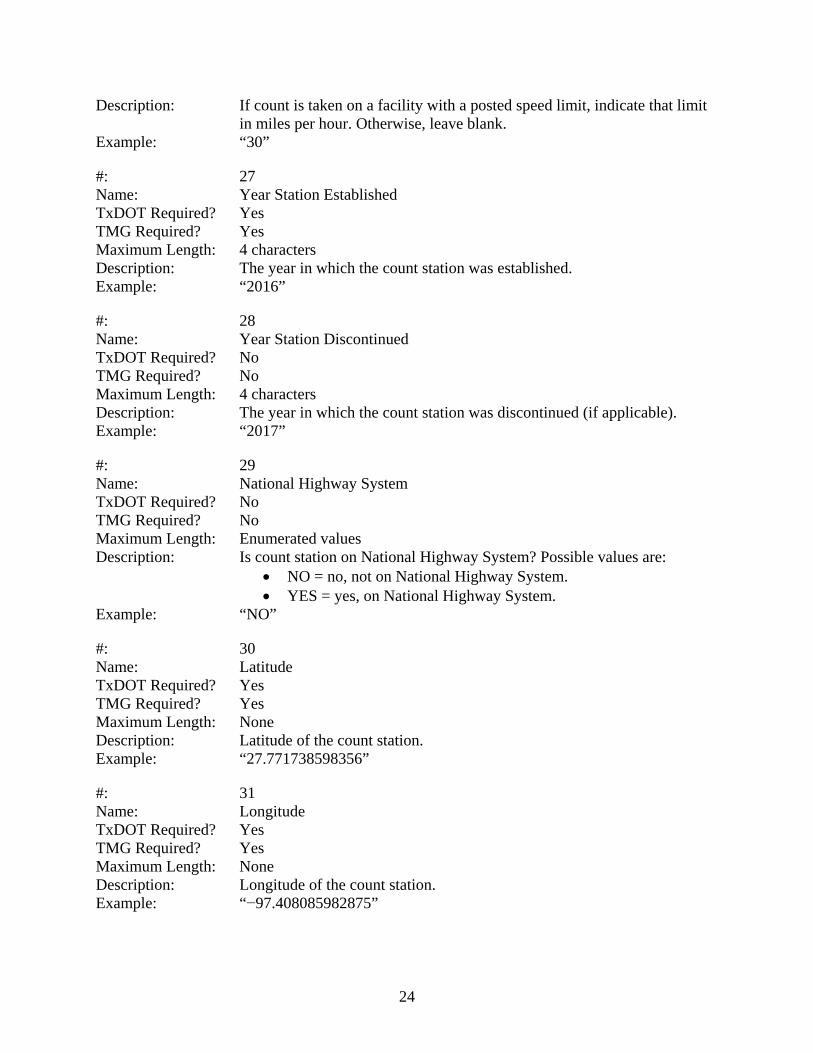
Description: If count is taken on a facility with a posted speed limit, indicate that limit in miles per hour. Otherwise, leave blank.
Example: “30”
#: 27 Name: Year Station Established TxDOT Required? Yes TMG Required? Yes Maximum Length: 4 characters Description: The year in which the count station was established. Example: “2016”
#: 28 Name: Year Station Discontinued TxDOT Required? No TMG Required? No Maximum Length: 4 characters Description: The year in which the count station was discontinued (if applicable). Example: “2017”
#: 29 Name: National Highway System TxDOT Required? No TMG Required? No Maximum Length: Enumerated values Description: Is count station on National Highway System? Possible values are:
• NO = no, not on National Highway System. • YES = yes, on National Highway System.
Example: “NO”
#: 30 Name: Latitude TxDOT Required? Yes TMG Required? Yes Maximum Length: None Description: Latitude of the count station. Example: “27.771738598356”
#: 31 Name: Longitude TxDOT Required? Yes TMG Required? Yes Maximum Length: None Description: Longitude of the count station. Example: “−97.408085982875”
25
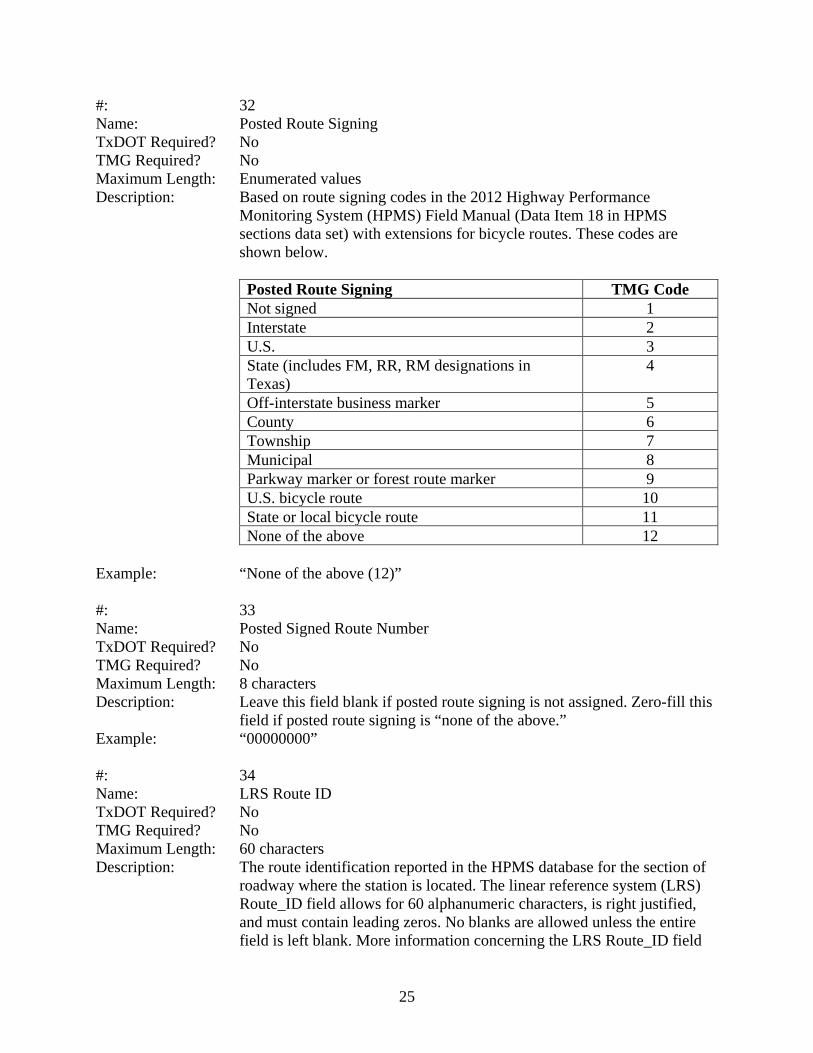
#: 32 Name: Posted Route Signing TxDOT Required? No TMG Required? No Maximum Length: Enumerated values Description: Based on route signing codes in the 2012 Highway Performance
Monitoring System (HPMS) Field Manual (Data Item 18 in HPMS sections data set) with extensions for bicycle routes. These codes are shown below.
Posted Route Signing TMG Code Not signed 1 Interstate 2 U.S. 3 State (includes FM, RR, RM designations in Texas)
4
Off-interstate business marker 5 County 6 Township 7 Municipal 8 Parkway marker or forest route marker 9 U.S. bicycle route 10 State or local bicycle route 11 None of the above 12
Example: “None of the above (12)” #: 33 Name: Posted Signed Route Number TxDOT Required? No TMG Required? No Maximum Length: 8 characters Description: Leave this field blank if posted route signing is not assigned. Zero-fill this
field if posted route signing is “none of the above.” Example: “00000000” #: 34 Name: LRS Route ID TxDOT Required? No TMG Required? No Maximum Length: 60 characters Description: The route identification reported in the HPMS database for the section of
roadway where the station is located. The linear reference system (LRS) Route_ID field allows for 60 alphanumeric characters, is right justified, and must contain leading zeros. No blanks are allowed unless the entire field is left blank. More information concerning the LRS Route_ID field

26
can be found in the HPMS Field Manual (see Section 4.2 in https://www.fhwa.dot.gov/policyinformation/hpms/fieldmanual/). Note that in the 2015 HPMS Addendum, states are allowed 120 characters instead of the 60 allowed in the 2010 coding instructions. If your agency uses more than 60 characters in this field, enter the 60 rightmost characters in this field.
Example: “ ” {Blank field} #: 35 Name: LRS Location Point TxDOT Required? No TMG Required? No Maximum Length: 8 characters Description: The LRS milepoint location for the station on the route named by the
Route_ID field, comparable to the LRS beginning point and LRS ending point in the HPMS. The milepost for the station must be within the range of the LRS beginning point and LRS ending point for the HPMS roadway section upon which the station is located. It is coded in miles, to the nearest thousandth of a mile, with an implied decimal in the middle: XXXX.XXX.
Example: “00000000”
#: 36 Name: Station Location TxDOT Required? No TMG Required? No Maximum Length: 50 characters Description: An English text entry field. For stations located on a numbered route, enter
the name of the nearest major intersecting route, state border, or landmark on state road maps and the distance and direction of the station from that landmark to the station (e.g., “12 miles south of the Kentucky border”). If the station is located on a city street, enter the city and street name. Abbreviate if necessary.
#: 37 Name: Other Notes TxDOT Required? No TMG Required? No Maximum Length: 51 characters Description: An English text field that can be used to provide notes to other users of
data from this location. For example, it can be used to describe the specific use of Factor Groups 1 through 5. Also, if type of count is coded as 8 (other animals), indicate the type(s) of animals in this field. In addition, this field should be used to indicate whether the trail or facility being counted is open to non-motorized traffic for only part of the year. For example, a trail in the mountains may be closed as a result of snow accumulation for four months of each year. Including a note such as
27
“Open April to October” will help users understand non-motorized travel at this location.
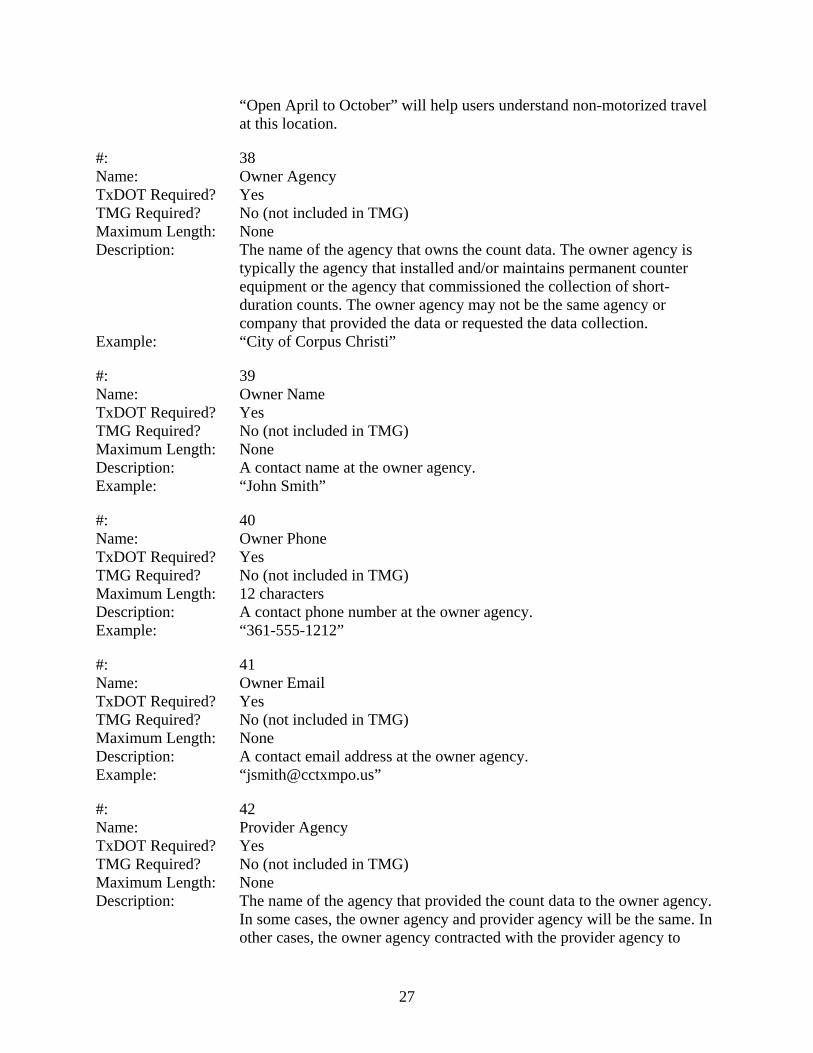
#: 38 Name: Owner Agency TxDOT Required? Yes TMG Required? No (not included in TMG) Maximum Length: None Description: The name of the agency that owns the count data. The owner agency is
typically the agency that installed and/or maintains permanent counter equipment or the agency that commissioned the collection of short-duration counts. The owner agency may not be the same agency or company that provided the data or requested the data collection.
Example: “City of Corpus Christi”
#: 39 Name: Owner Name TxDOT Required? Yes TMG Required? No (not included in TMG) Maximum Length: None Description: A contact name at the owner agency. Example: “John Smith”
#: 40 Name: Owner Phone TxDOT Required? Yes TMG Required? No (not included in TMG) Maximum Length: 12 characters Description: A contact phone number at the owner agency. Example: “361-555-1212”
#: 41 Name: Owner Email TxDOT Required? Yes TMG Required? No (not included in TMG) Maximum Length: None Description: A contact email address at the owner agency. Example: “[email protected]”
#: 42 Name: Provider Agency TxDOT Required? Yes TMG Required? No (not included in TMG) Maximum Length: None Description: The name of the agency that provided the count data to the owner agency.
In some cases, the owner agency and provider agency will be the same. In other cases, the owner agency contracted with the provider agency to
28
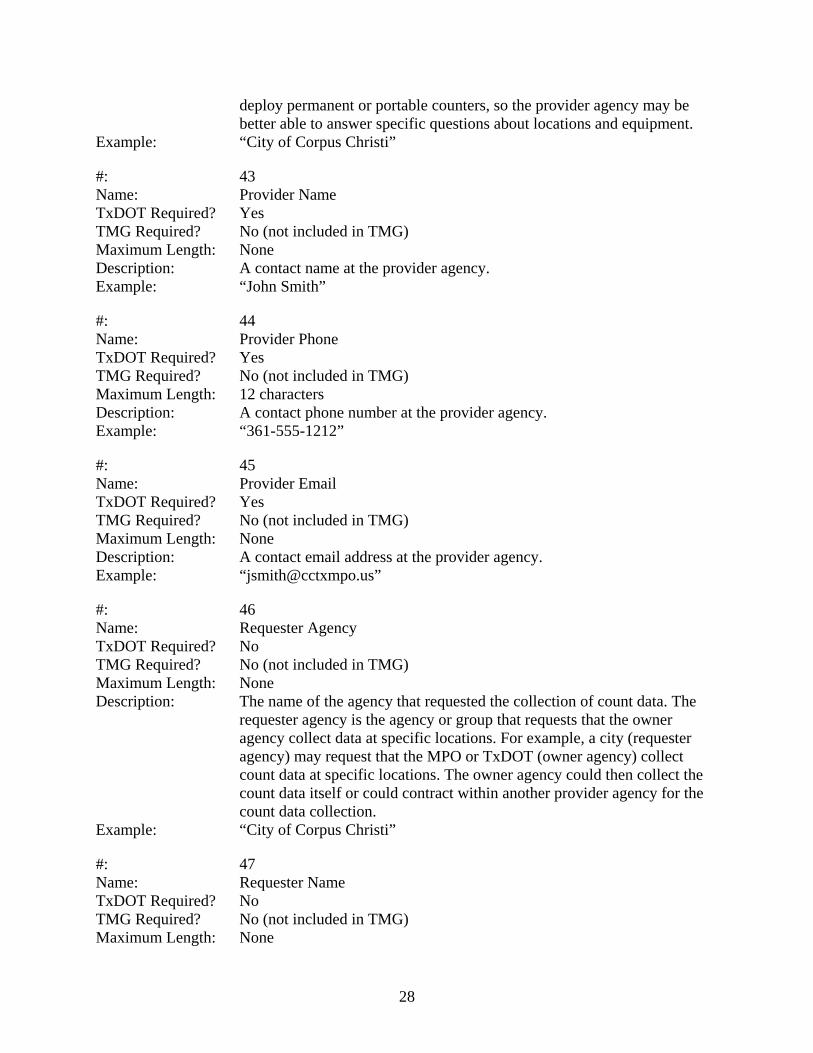
deploy permanent or portable counters, so the provider agency may be better able to answer specific questions about locations and equipment.
Example: “City of Corpus Christi”
#: 43 Name: Provider Name TxDOT Required? Yes TMG Required? No (not included in TMG) Maximum Length: None Description: A contact name at the provider agency. Example: “John Smith”
#: 44 Name: Provider Phone TxDOT Required? Yes TMG Required? No (not included in TMG) Maximum Length: 12 characters Description: A contact phone number at the provider agency. Example: “361-555-1212”
#: 45 Name: Provider Email TxDOT Required? Yes TMG Required? No (not included in TMG) Maximum Length: None Description: A contact email address at the provider agency. Example: “[email protected]”
#: 46 Name: Requester Agency TxDOT Required? No TMG Required? No (not included in TMG) Maximum Length: None Description: The name of the agency that requested the collection of count data. The
requester agency is the agency or group that requests that the owner agency collect data at specific locations. For example, a city (requester agency) may request that the MPO or TxDOT (owner agency) collect count data at specific locations. The owner agency could then collect the count data itself or could contract within another provider agency for the count data collection.
Example: “City of Corpus Christi”
#: 47 Name: Requester Name TxDOT Required? No TMG Required? No (not included in TMG) Maximum Length: None
29
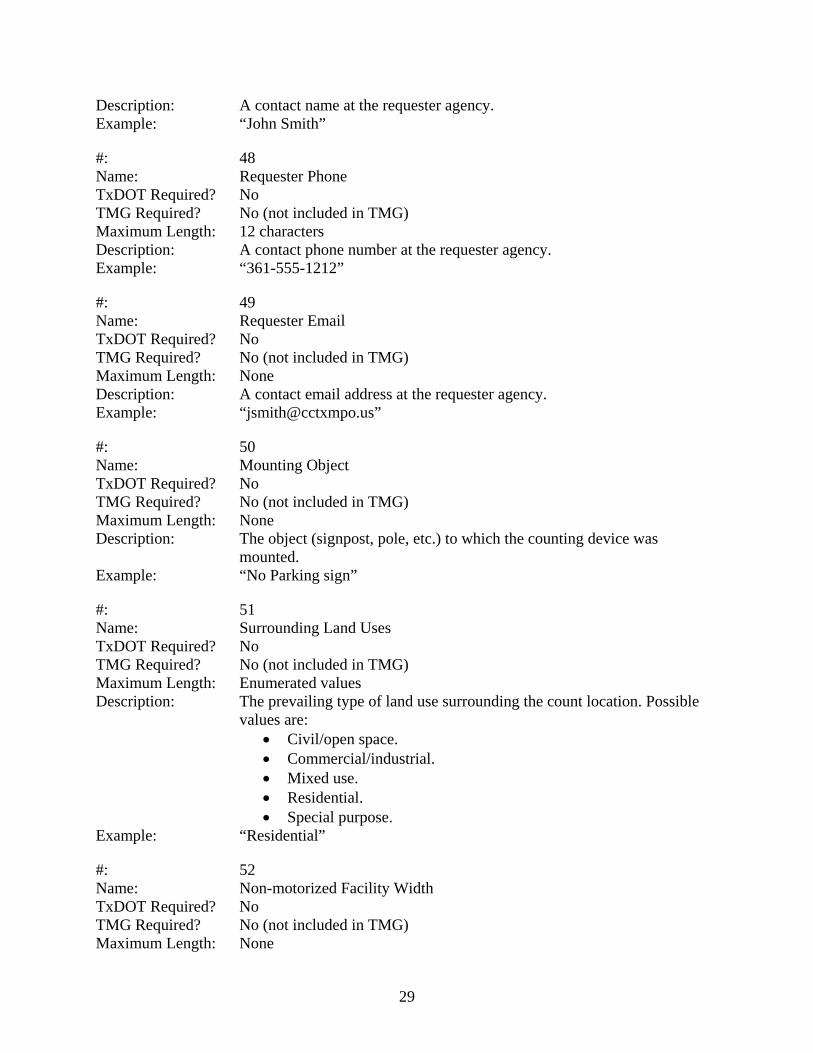
Description: A contact name at the requester agency. Example: “John Smith”
#: 48 Name: Requester Phone TxDOT Required? No TMG Required? No (not included in TMG) Maximum Length: 12 characters Description: A contact phone number at the requester agency. Example: “361-555-1212”
#: 49 Name: Requester Email TxDOT Required? No TMG Required? No (not included in TMG) Maximum Length: None Description: A contact email address at the requester agency. Example: “[email protected]”
#: 50 Name: Mounting Object TxDOT Required? No TMG Required? No (not included in TMG) Maximum Length: None Description: The object (signpost, pole, etc.) to which the counting device was
mounted. Example: “No Parking sign”
#: 51 Name: Surrounding Land Uses TxDOT Required? No TMG Required? No (not included in TMG) Maximum Length: Enumerated values Description: The prevailing type of land use surrounding the count location. Possible
values are: • Civil/open space. • Commercial/industrial. • Mixed use. • Residential. • Special purpose.
Example: “Residential”
#: 52 Name: Non-motorized Facility Width TxDOT Required? No TMG Required? No (not included in TMG) Maximum Length: None
30
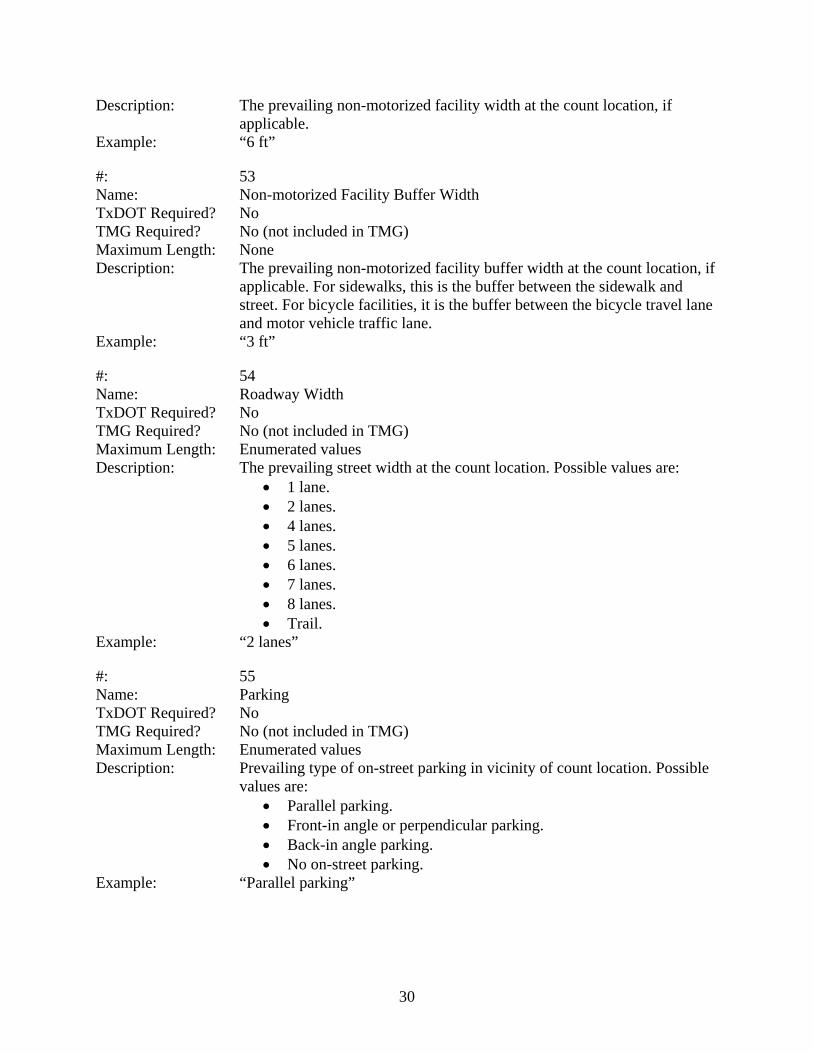
Description: The prevailing non-motorized facility width at the count location, if applicable.
Example: “6 ft”
#: 53 Name: Non-motorized Facility Buffer Width TxDOT Required? No TMG Required? No (not included in TMG) Maximum Length: None Description: The prevailing non-motorized facility buffer width at the count location, if
applicable. For sidewalks, this is the buffer between the sidewalk and street. For bicycle facilities, it is the buffer between the bicycle travel lane and motor vehicle traffic lane.
Example: “3 ft”
#: 54 Name: Roadway Width TxDOT Required? No TMG Required? No (not included in TMG) Maximum Length: Enumerated values Description: The prevailing street width at the count location. Possible values are:
• 1 lane. • 2 lanes. • 4 lanes. • 5 lanes. • 6 lanes. • 7 lanes. • 8 lanes. • Trail.
Example: “2 lanes”
#: 55 Name: Parking TxDOT Required? No TMG Required? No (not included in TMG) Maximum Length: Enumerated values Description: Prevailing type of on-street parking in vicinity of count location. Possible
values are: • Parallel parking. • Front-in angle or perpendicular parking. • Back-in angle parking. • No on-street parking.
Example: “Parallel parking”
31
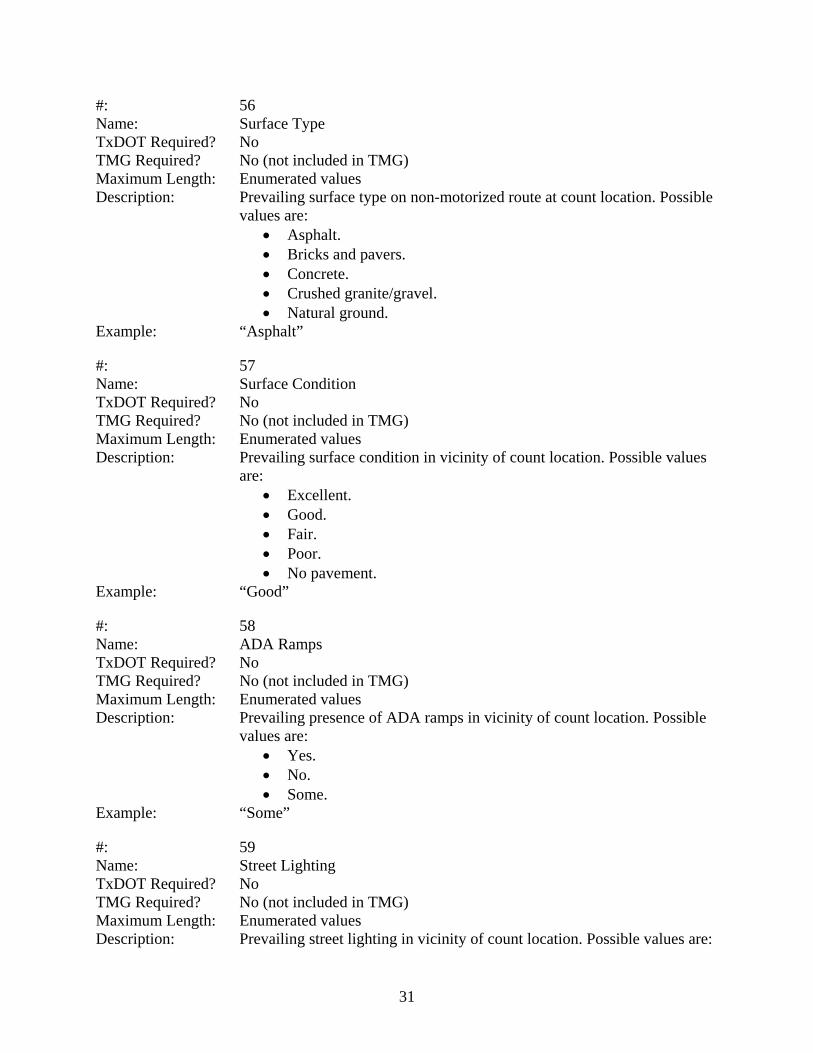
#: 56 Name: Surface Type TxDOT Required? No TMG Required? No (not included in TMG) Maximum Length: Enumerated values Description: Prevailing surface type on non-motorized route at count location. Possible
values are: • Asphalt. • Bricks and pavers. • Concrete. • Crushed granite/gravel. • Natural ground.
Example: “Asphalt”
#: 57 Name: Surface Condition TxDOT Required? No TMG Required? No (not included in TMG) Maximum Length: Enumerated values Description: Prevailing surface condition in vicinity of count location. Possible values
are: • Excellent. • Good. • Fair. • Poor. • No pavement.
Example: “Good”
#: 58 Name: ADA Ramps TxDOT Required? No TMG Required? No (not included in TMG) Maximum Length: Enumerated values Description: Prevailing presence of ADA ramps in vicinity of count location. Possible
values are: • Yes. • No. • Some.
Example: “Some”
#: 59 Name: Street Lighting TxDOT Required? No TMG Required? No (not included in TMG) Maximum Length: Enumerated values Description: Prevailing street lighting in vicinity of count location. Possible values are:

32
• One side. • Both sides. • None. • Partial.
Example: “Both sides”
#: 60 Name: Street Traffic Volume (ADT) TxDOT Required? No TMG Required? No (not included in TMG) Maximum Length: None Description: The motorized traffic volume (average daily total) in vicinity of count
location. Example: “10,000”
#: 61 Name: Transit TxDOT Required? No TMG Required? No (not included in TMG) Maximum Length: Enumerated values Description: Transit presence in vicinity of count location. Possible values are:
• Yes. • No. • Multiple routes.
Example: “No”
#: 62 Name: Shade TxDOT Required? No TMG Required? No (not included in TMG) Maximum Length: Enumerated values Description: Prevailing shade level in vicinity of count location. Possible values are:
• Full shade. • Partial shade. • No shade.
Example: “Partial”
#: 63 Name: Equipment Vendor TxDOT Required? No TMG Required? No (not included in TMG) Maximum Length: None Description: The manufacturer of the counter equipment used, if applicable. Example: “Jamar”
33
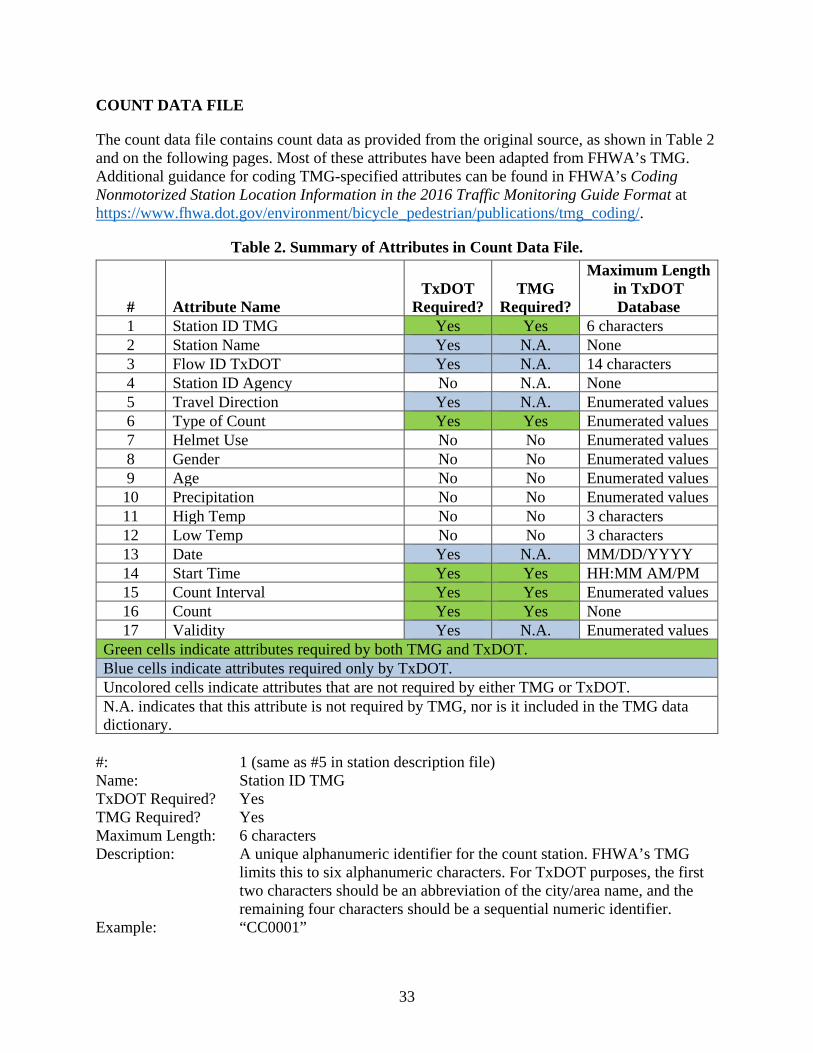
COUNT DATA FILE
The count data file contains count data as provided from the original source, as shown in Table 2 and on the following pages. Most of these attributes have been adapted from FHWA’s TMG. Additional guidance for coding TMG-specified attributes can be found in FHWA’s Coding Nonmotorized Station Location Information in the 2016 Traffic Monitoring Guide Format at https://www.fhwa.dot.gov/environment/bicycle_pedestrian/publications/tmg_coding/.
Table 2. Summary of Attributes in Count Data File.
# Attribute Name TxDOT
Required? TMG
Required?
Maximum Length in TxDOT Database
1 Station ID TMG Yes Yes 6 characters 2 Station Name Yes N.A. None 3 Flow ID TxDOT Yes N.A. 14 characters 4 Station ID Agency No N.A. None 5 Travel Direction Yes N.A. Enumerated values 6 Type of Count Yes Yes Enumerated values 7 Helmet Use No No Enumerated values 8 Gender No No Enumerated values 9 Age No No Enumerated values 10 Precipitation No No Enumerated values 11 High Temp No No 3 characters 12 Low Temp No No 3 characters 13 Date Yes N.A. MM/DD/YYYY 14 Start Time Yes Yes HH:MM AM/PM 15 Count Interval Yes Yes Enumerated values 16 Count Yes Yes None 17 Validity Yes N.A. Enumerated values
Green cells indicate attributes required by both TMG and TxDOT. Blue cells indicate attributes required only by TxDOT. Uncolored cells indicate attributes that are not required by either TMG or TxDOT. N.A. indicates that this attribute is not required by TMG, nor is it included in the TMG data dictionary.
#: 1 (same as #5 in station description file) Name: Station ID TMG TxDOT Required? Yes TMG Required? Yes Maximum Length: 6 characters Description: A unique alphanumeric identifier for the count station. FHWA’s TMG
limits this to six alphanumeric characters. For TxDOT purposes, the first two characters should be an abbreviation of the city/area name, and the remaining four characters should be a sequential numeric identifier.
Example: “CC0001”
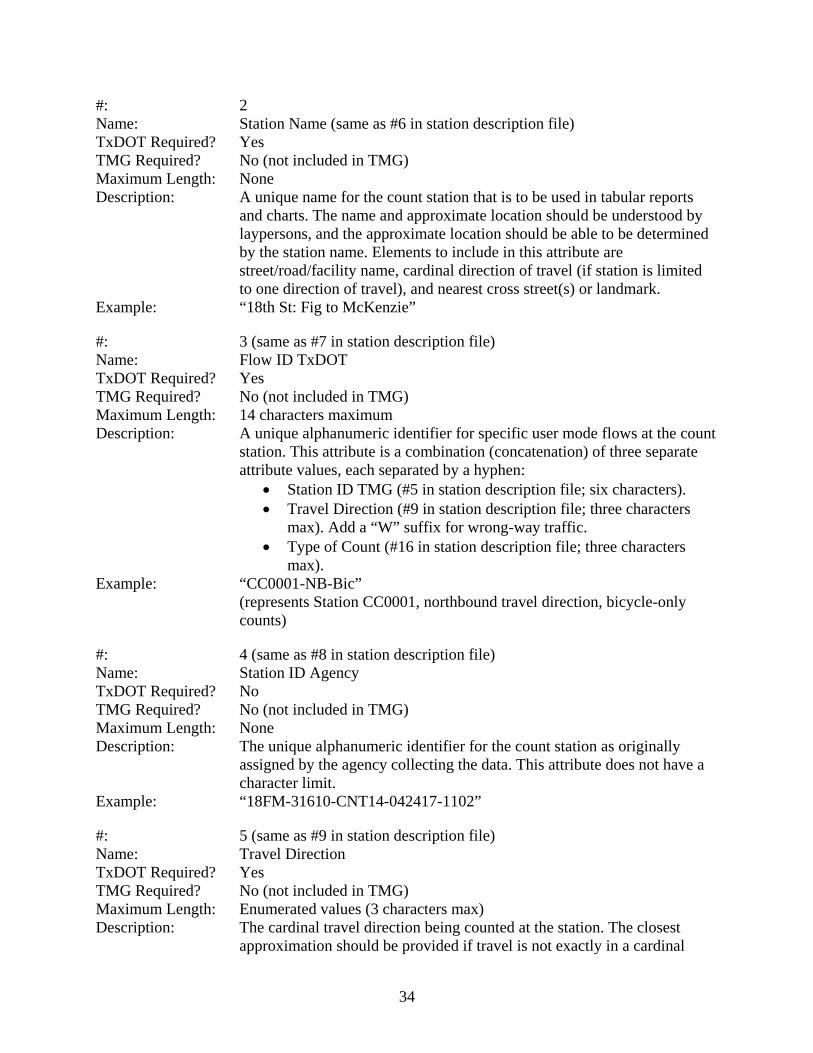
34
#: 2 Name: Station Name (same as #6 in station description file) TxDOT Required? Yes TMG Required? No (not included in TMG) Maximum Length: None Description: A unique name for the count station that is to be used in tabular reports
and charts. The name and approximate location should be understood by laypersons, and the approximate location should be able to be determined by the station name. Elements to include in this attribute are street/road/facility name, cardinal direction of travel (if station is limited to one direction of travel), and nearest cross street(s) or landmark.
Example: “18th St: Fig to McKenzie”
#: 3 (same as #7 in station description file) Name: Flow ID TxDOT TxDOT Required? Yes TMG Required? No (not included in TMG) Maximum Length: 14 characters maximum Description: A unique alphanumeric identifier for specific user mode flows at the count
station. This attribute is a combination (concatenation) of three separate attribute values, each separated by a hyphen:
• Station ID TMG (#5 in station description file; six characters). • Travel Direction (#9 in station description file; three characters
max). Add a “W” suffix for wrong-way traffic. • Type of Count (#16 in station description file; three characters
max). Example: “CC0001-NB-Bic”
(represents Station CC0001, northbound travel direction, bicycle-only counts)
#: 4 (same as #8 in station description file) Name: Station ID Agency TxDOT Required? No TMG Required? No (not included in TMG) Maximum Length: None Description: The unique alphanumeric identifier for the count station as originally
assigned by the agency collecting the data. This attribute does not have a character limit.
Example: “18FM-31610-CNT14-042417-1102”
#: 5 (same as #9 in station description file) Name: Travel Direction TxDOT Required? Yes TMG Required? No (not included in TMG) Maximum Length: Enumerated values (3 characters max) Description: The cardinal travel direction being counted at the station. The closest
approximation should be provided if travel is not exactly in a cardinal
35
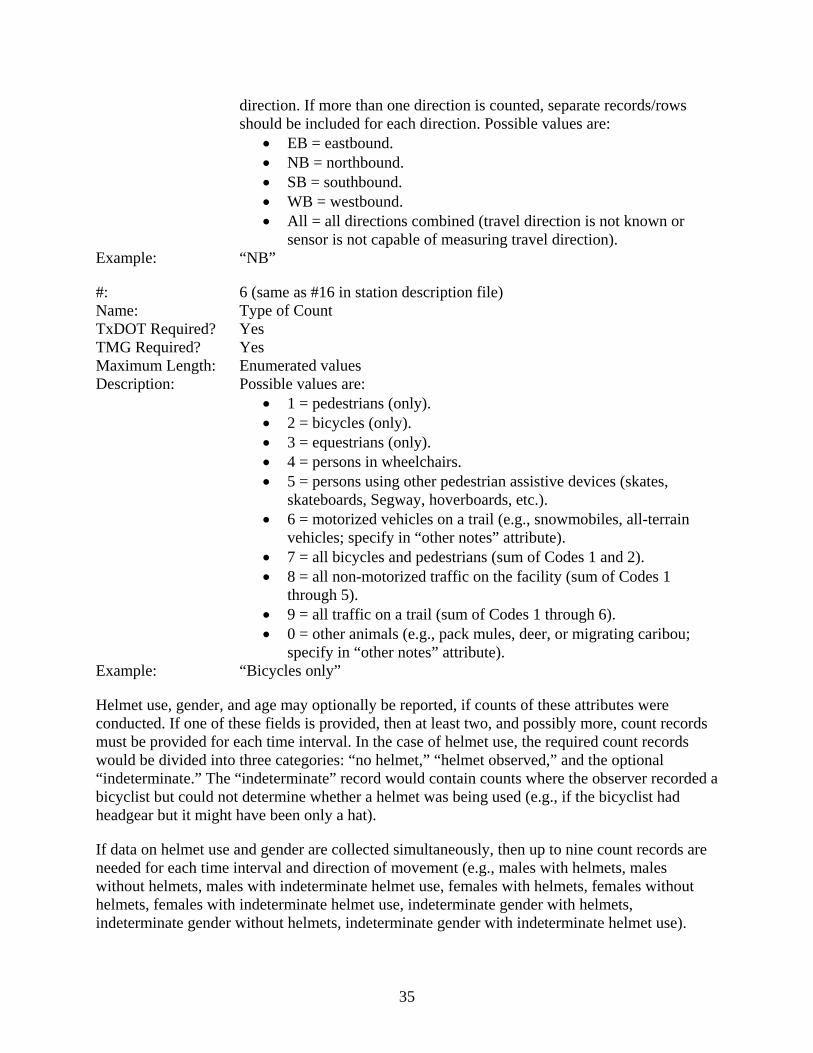
direction. If more than one direction is counted, separate records/rows should be included for each direction. Possible values are:
• EB = eastbound. • NB = northbound. • SB = southbound. • WB = westbound. • All = all directions combined (travel direction is not known or
sensor is not capable of measuring travel direction). Example: “NB”
#: 6 (same as #16 in station description file) Name: Type of Count TxDOT Required? Yes TMG Required? Yes Maximum Length: Enumerated values Description: Possible values are:
• 1 = pedestrians (only). • 2 = bicycles (only). • 3 = equestrians (only). • 4 = persons in wheelchairs. • 5 = persons using other pedestrian assistive devices (skates,
skateboards, Segway, hoverboards, etc.). • 6 = motorized vehicles on a trail (e.g., snowmobiles, all-terrain
vehicles; specify in “other notes” attribute). • 7 = all bicycles and pedestrians (sum of Codes 1 and 2). • 8 = all non-motorized traffic on the facility (sum of Codes 1
through 5). • 9 = all traffic on a trail (sum of Codes 1 through 6). • 0 = other animals (e.g., pack mules, deer, or migrating caribou;
specify in “other notes” attribute). Example: “Bicycles only”
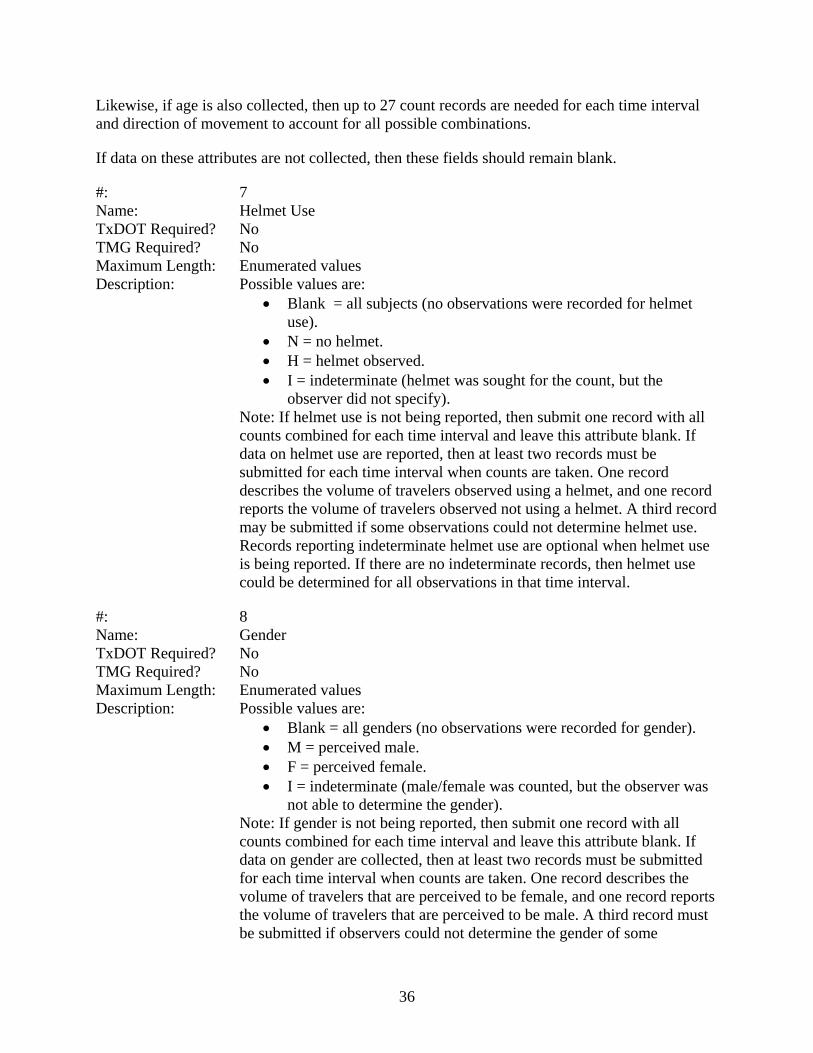
Helmet use, gender, and age may optionally be reported, if counts of these attributes were conducted. If one of these fields is provided, then at least two, and possibly more, count records must be provided for each time interval. In the case of helmet use, the required count records would be divided into three categories: “no helmet,” “helmet observed,” and the optional “indeterminate.” The “indeterminate” record would contain counts where the observer recorded a bicyclist but could not determine whether a helmet was being used (e.g., if the bicyclist had headgear but it might have been only a hat).
If data on helmet use and gender are collected simultaneously, then up to nine count records are needed for each time interval and direction of movement (e.g., males with helmets, males without helmets, males with indeterminate helmet use, females with helmets, females without helmets, females with indeterminate helmet use, indeterminate gender with helmets, indeterminate gender without helmets, indeterminate gender with indeterminate helmet use).
36
Likewise, if age is also collected, then up to 27 count records are needed for each time interval and direction of movement to account for all possible combinations.
If data on these attributes are not collected, then these fields should remain blank.
#: 7 Name: Helmet Use TxDOT Required? No TMG Required? No Maximum Length: Enumerated values Description: Possible values are:
• Blank = all subjects (no observations were recorded for helmet use).
• N = no helmet. • H = helmet observed. • I = indeterminate (helmet was sought for the count, but the
observer did not specify). Note: If helmet use is not being reported, then submit one record with all counts combined for each time interval and leave this attribute blank. If data on helmet use are reported, then at least two records must be submitted for each time interval when counts are taken. One record describes the volume of travelers observed using a helmet, and one record reports the volume of travelers observed not using a helmet. A third record may be submitted if some observations could not determine helmet use. Records reporting indeterminate helmet use are optional when helmet use is being reported. If there are no indeterminate records, then helmet use could be determined for all observations in that time interval.
#: 8 Name: Gender TxDOT Required? No TMG Required? No Maximum Length: Enumerated values Description: Possible values are:
• Blank = all genders (no observations were recorded for gender). • M = perceived male. • F = perceived female. • I = indeterminate (male/female was counted, but the observer was
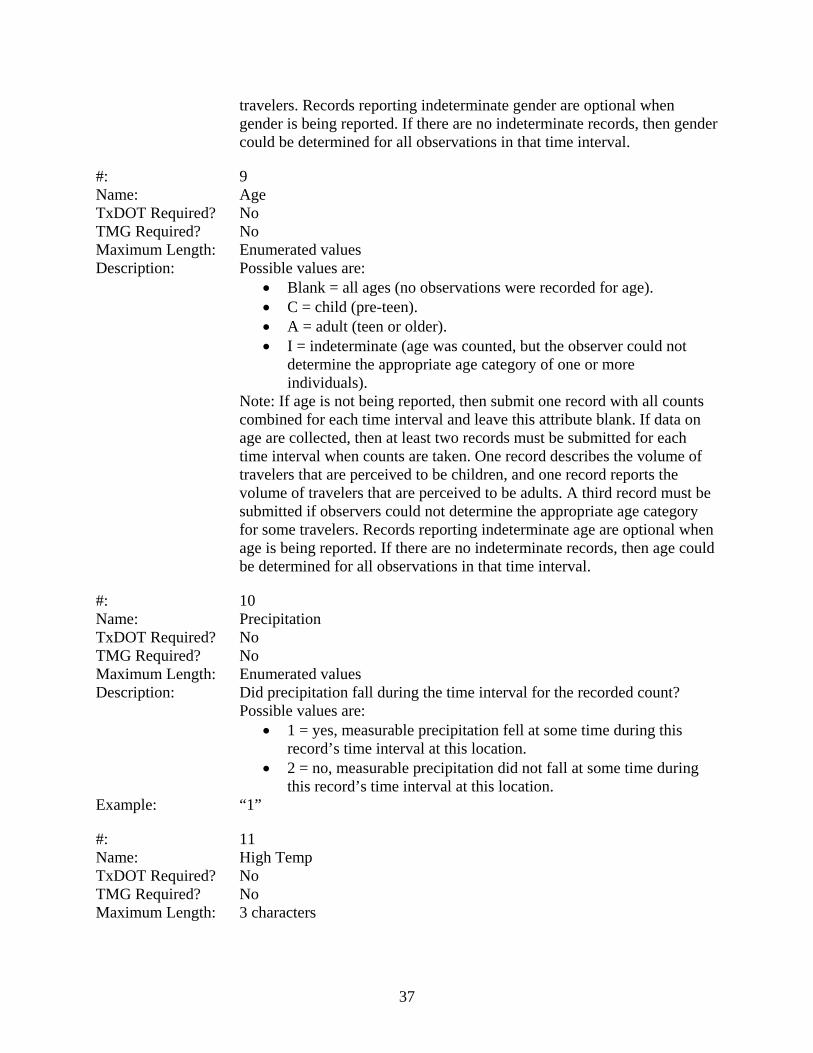
not able to determine the gender). Note: If gender is not being reported, then submit one record with all counts combined for each time interval and leave this attribute blank. If data on gender are collected, then at least two records must be submitted for each time interval when counts are taken. One record describes the volume of travelers that are perceived to be female, and one record reports the volume of travelers that are perceived to be male. A third record must be submitted if observers could not determine the gender of some
37
travelers. Records reporting indeterminate gender are optional when gender is being reported. If there are no indeterminate records, then gender could be determined for all observations in that time interval.
#: 9 Name: Age TxDOT Required? No TMG Required? No Maximum Length: Enumerated values Description: Possible values are:
• Blank = all ages (no observations were recorded for age). • C = child (pre-teen). • A = adult (teen or older). • I = indeterminate (age was counted, but the observer could not
determine the appropriate age category of one or more individuals).
Note: If age is not being reported, then submit one record with all counts combined for each time interval and leave this attribute blank. If data on age are collected, then at least two records must be submitted for each time interval when counts are taken. One record describes the volume of travelers that are perceived to be children, and one record reports the volume of travelers that are perceived to be adults. A third record must be submitted if observers could not determine the appropriate age category for some travelers. Records reporting indeterminate age are optional when age is being reported. If there are no indeterminate records, then age could be determined for all observations in that time interval.
#: 10 Name: Precipitation TxDOT Required? No TMG Required? No Maximum Length: Enumerated values Description: Did precipitation fall during the time interval for the recorded count?
Possible values are: • 1 = yes, measurable precipitation fell at some time during this
record’s time interval at this location. • 2 = no, measurable precipitation did not fall at some time during
this record’s time interval at this location. Example: “1”
#: 11 Name: High Temp TxDOT Required? No TMG Required? No Maximum Length: 3 characters
38
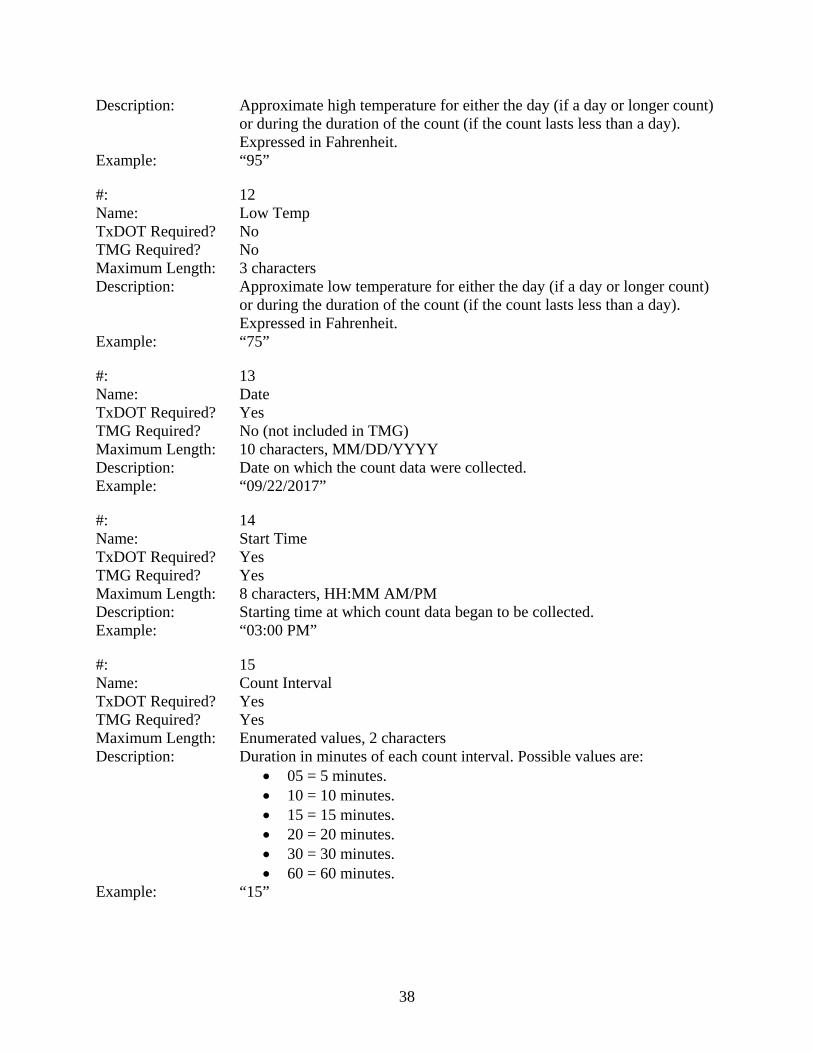
Description: Approximate high temperature for either the day (if a day or longer count) or during the duration of the count (if the count lasts less than a day). Expressed in Fahrenheit.
Example: “95”
#: 12 Name: Low Temp TxDOT Required? No TMG Required? No Maximum Length: 3 characters Description: Approximate low temperature for either the day (if a day or longer count)
or during the duration of the count (if the count lasts less than a day). Expressed in Fahrenheit.
Example: “75”
#: 13 Name: Date TxDOT Required? Yes TMG Required? No (not included in TMG) Maximum Length: 10 characters, MM/DD/YYYY Description: Date on which the count data were collected. Example: “09/22/2017”
#: 14 Name: Start Time TxDOT Required? Yes TMG Required? Yes Maximum Length: 8 characters, HH:MM AM/PM Description: Starting time at which count data began to be collected. Example: “03:00 PM”
#: 15 Name: Count Interval TxDOT Required? Yes TMG Required? Yes Maximum Length: Enumerated values, 2 characters Description: Duration in minutes of each count interval. Possible values are:
• 05 = 5 minutes. • 10 = 10 minutes. • 15 = 15 minutes. • 20 = 20 minutes. • 30 = 30 minutes. • 60 = 60 minutes.
Example: “15”
39
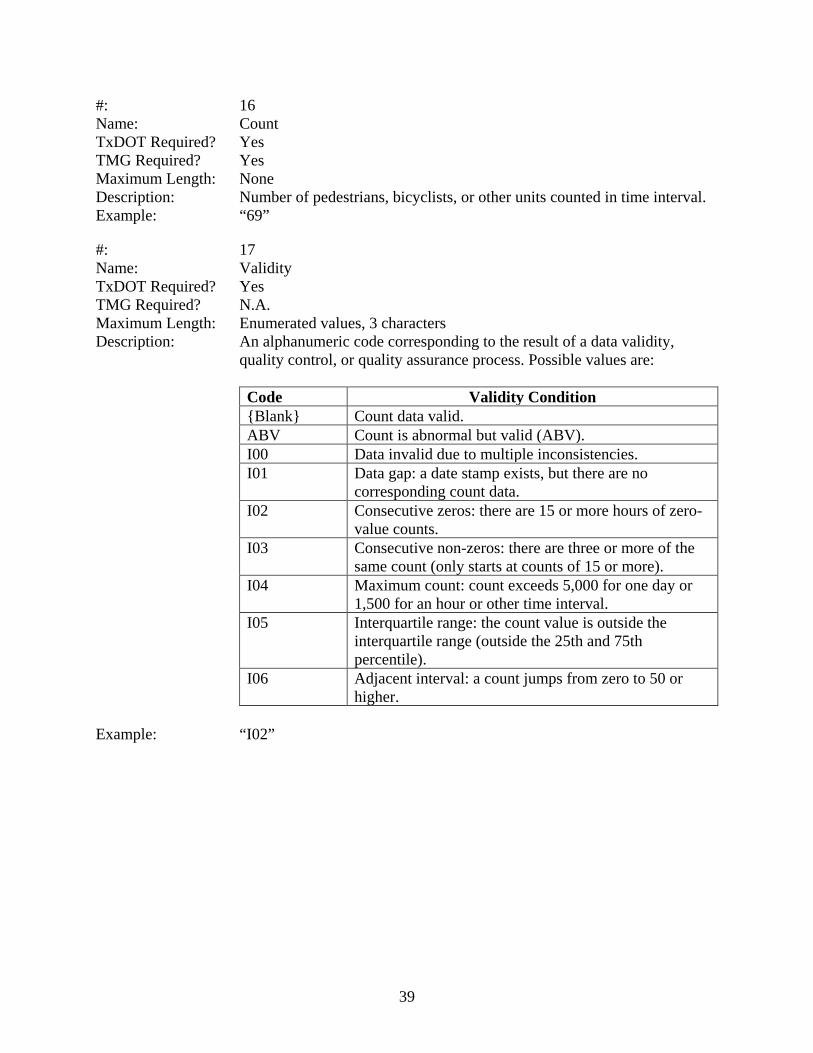
#: 16 Name: Count TxDOT Required? Yes TMG Required? Yes Maximum Length: None Description: Number of pedestrians, bicyclists, or other units counted in time interval. Example: “69”
#: 17 Name: Validity TxDOT Required? Yes TMG Required? N.A. Maximum Length: Enumerated values, 3 characters Description: An alphanumeric code corresponding to the result of a data validity,
quality control, or quality assurance process. Possible values are:
Code Validity Condition {Blank} Count data valid. ABV Count is abnormal but valid (ABV). I00 Data invalid due to multiple inconsistencies. I01 Data gap: a date stamp exists, but there are no
corresponding count data. I02 Consecutive zeros: there are 15 or more hours of zero-
value counts. I03 Consecutive non-zeros: there are three or more of the
same count (only starts at counts of 15 or more). I04 Maximum count: count exceeds 5,000 for one day or
1,500 for an hour or other time interval. I05 Interquartile range: the count value is outside the
interquartile range (outside the 25th and 75th percentile).
I06 Adjacent interval: a count jumps from zero to 50 or higher.
Example: “I02”


41
CHAPTER 4. ENSURING QUALITY DATA
This chapter provides an overview of data quality assurance and quality control (QAQC) procedures, including real-world examples that may be helpful in reviewing data. This chapter also illustrates common data errors that may occur and demonstrates how to identify and flag them in the data to ensure that what are ultimately used in performance measures and calculations are valid data.
THE IMPORTANCE OF QUALITY CONTROL
Ensuring that data are of the utmost quality is critical to providing useful information to end users. Data that include many errors, are mismatched with incorrect meta-information, or are incomplete are of no use. If data quality is extremely poor, then no data may actually be better than bad data. Performance measures calculated from data with poor quality or multiple errors may greatly overestimate or underestimate facility use. Over time, incomplete or inaccurate data could erode the credibility of the non-motorized count information. Ensuring that bicycle and pedestrian count information is as accurate as possible will not only improve overall measurement efforts for data-based decisions but also increase trust among users over time.
THE QAQC PROCESS OVERVIEW
The QAQC process commences even before counters begin to collect data. Careful attention to proper counter site location and installation will likely eliminate the vast majority of data errors that are commonly found (more information about properly choosing a count location and installing a counter can be found in Appendix B). Additionally, establishing a regular and frequent maintenance program for all counters will ensure that if an issue that causes errors arises, it can be identified and repaired quickly. Data loss due to unnoticed or neglected counter errors is generally the second largest cause of data errors. Ideally, the goal is to minimize the potential for errors and to be able to recognize and address errors quickly when they occur.
Finally, creating and maintaining an event log that lists organized bicyclist rides, events, parades, festivals, or other events that may dramatically (but validly) increase bicycle and pedestrian counts above normal usage and their dates and times will simplify the QAQC process as well as increase the overall accuracy of any performance measures calculated using the database.
Once data have been uploaded to the statewide database, a series of steps in the QAQC process should be taken to review the data and flag any counts that appear to be either invalid or abnormal. The following steps represent the base-level QAQC process:
1. Carefully review metadata information for accuracy with special attention to required data entries, including:
a. Station name matching the proper count (and removing any erroneous count data from stations that do not exist).
b. Latitude and longitude. c. Counter channels matching with proper station flow IDs (type of count and
direction).

42
d. Date matching to avoid data gaps and overlaps. e. Completeness and accuracy of station description information.
2. Visualize and inspect the counts as daily subtotals for the entire period by count type by direction (and for permanent counters, include at least one year of previous data) to check for anomalies and note areas needing more detailed inspection.
3. Visualize and inspect noted areas or the entire data set at a finer granularity (usually at the 15-minute or one-hour scale) for anomalies.
4. Flag suspect counts as either invalid or abnormal but valid (ABV). 5. Log flagged data and potential reasons for the errors and then save the edits.
Once the QAQC process has been completed, the count data can be appropriately filtered to calculate the necessary performance measures or used by agencies for their needed purpose.
One other important issue to note is that if a counter is not in use but is still sending data to the cloud, the counter’s data will be sent in a data dump to the database. It is crucial for the reporting agency to maintain notes or a log file when a counter is not in use to avoid the related data being put into the database.
QUALITY ASSURANCE AND QUALITY CONTROL FLAGS AND GENERAL RULES OF THUMB
While performing QAQC on motorized count data is more developed and automated, the inconsistent nature of non-motorized count data makes automating the QAQC process more difficult. In the motorized process, QC flags (or tests) on suspect count data are relatively straightforward. However, while some QC flags for non-motorized counts are similar, some have been modified or created to adapt to the unique nature of non-motorized counts.
Thresholds are also extremely difficult to establish for pedestrian and bicyclist count data: low-usage facilities have count patterns significantly different from high-usage facilities and should be treated differently. For example, on a low-usage facility, it may be perfectly acceptable to have days of zero counts (where this would be unacceptable for a high-usage facility).
Over several years, researchers have developed a unique set of QAQC flags to test non-motorized count data. Note that these flags/tests are merely tools to help sift through large amounts of count data. It is up to the reporting agency or data user to determine if an error actually occurred. While these flags are continually being developed and thresholds are under continual scrutiny, this guide recommends the use of the following flags (which correspond to the validity codes for Attribute #17 on page 39):
• Valid: Count appears to be normal, realistic, and acceptable given the facility’s history. (Note: valid data are not usually marked/flagged.)
• Invalid: Count appears to be in error and not representative of reality for the time period. Note that mass counter error over a long period of time may or may not trip the following flags but can usually be determined by looking at the larger pattern over time.
o Data Gap: A date stamp exists, but there are no count data. This discrepancy generally indicates a counter malfunction.
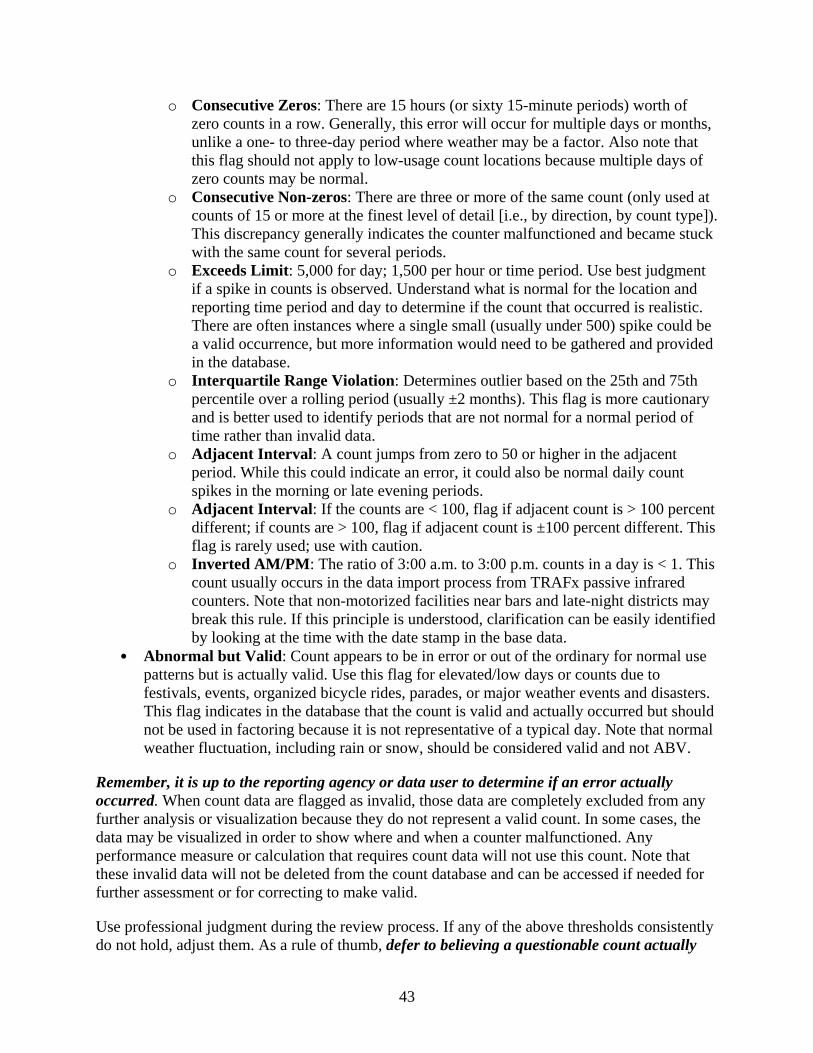
43
o Consecutive Zeros: There are 15 hours (or sixty 15-minute periods) worth of zero counts in a row. Generally, this error will occur for multiple days or months, unlike a one- to three-day period where weather may be a factor. Also note that this flag should not apply to low-usage count locations because multiple days of zero counts may be normal.
o Consecutive Non-zeros: There are three or more of the same count (only used at counts of 15 or more at the finest level of detail [i.e., by direction, by count type]). This discrepancy generally indicates the counter malfunctioned and became stuck with the same count for several periods.
o Exceeds Limit: 5,000 for day; 1,500 per hour or time period. Use best judgment if a spike in counts is observed. Understand what is normal for the location and reporting time period and day to determine if the count that occurred is realistic. There are often instances where a single small (usually under 500) spike could be a valid occurrence, but more information would need to be gathered and provided in the database.
o Interquartile Range Violation: Determines outlier based on the 25th and 75th percentile over a rolling period (usually ±2 months). This flag is more cautionary and is better used to identify periods that are not normal for a normal period of time rather than invalid data.
o Adjacent Interval: A count jumps from zero to 50 or higher in the adjacent period. While this could indicate an error, it could also be normal daily count spikes in the morning or late evening periods.
o Adjacent Interval: If the counts are < 100, flag if adjacent count is > 100 percent different; if counts are > 100, flag if adjacent count is ±100 percent different. This flag is rarely used; use with caution.
o Inverted AM/PM: The ratio of 3:00 a.m. to 3:00 p.m. counts in a day is < 1. This count usually occurs in the data import process from TRAFx passive infrared counters. Note that non-motorized facilities near bars and late-night districts may break this rule. If this principle is understood, clarification can be easily identified by looking at the time with the date stamp in the base data.
• Abnormal but Valid: Count appears to be in error or out of the ordinary for normal use patterns but is actually valid. Use this flag for elevated/low days or counts due to festivals, events, organized bicycle rides, parades, or major weather events and disasters. This flag indicates in the database that the count is valid and actually occurred but should not be used in factoring because it is not representative of a typical day. Note that normal weather fluctuation, including rain or snow, should be considered valid and not ABV.
Remember, it is up to the reporting agency or data user to determine if an error actually occurred. When count data are flagged as invalid, those data are completely excluded from any further analysis or visualization because they do not represent a valid count. In some cases, the data may be visualized in order to show where and when a counter malfunctioned. Any performance measure or calculation that requires count data will not use this count. Note that these invalid data will not be deleted from the count database and can be accessed if needed for further assessment or for correcting to make valid.
Use professional judgment during the review process. If any of the above thresholds consistently do not hold, adjust them. As a rule of thumb, defer to believing a questionable count actually
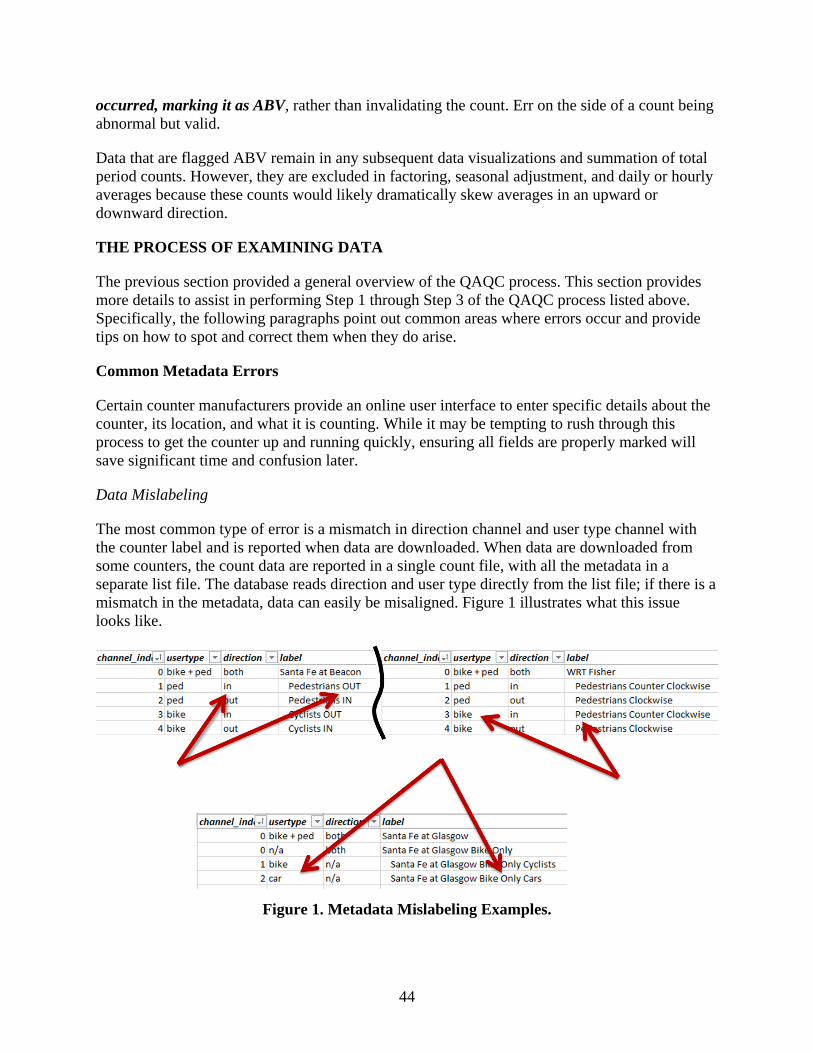
44
occurred, marking it as ABV, rather than invalidating the count. Err on the side of a count being abnormal but valid.
Data that are flagged ABV remain in any subsequent data visualizations and summation of total period counts. However, they are excluded in factoring, seasonal adjustment, and daily or hourly averages because these counts would likely dramatically skew averages in an upward or downward direction.
THE PROCESS OF EXAMINING DATA
The previous section provided a general overview of the QAQC process. This section provides more details to assist in performing Step 1 through Step 3 of the QAQC process listed above. Specifically, the following paragraphs point out common areas where errors occur and provide tips on how to spot and correct them when they do arise.
Common Metadata Errors
Certain counter manufacturers provide an online user interface to enter specific details about the counter, its location, and what it is counting. While it may be tempting to rush through this process to get the counter up and running quickly, ensuring all fields are properly marked will save significant time and confusion later.
Data Mislabeling
The most common type of error is a mismatch in direction channel and user type channel with the counter label and is reported when data are downloaded. When data are downloaded from some counters, the count data are reported in a single count file, with all the metadata in a separate list file. The database reads direction and user type directly from the list file; if there is a mismatch in the metadata, data can easily be misaligned. Figure 1 illustrates what this issue looks like.
Figure 1. Metadata Mislabeling Examples.
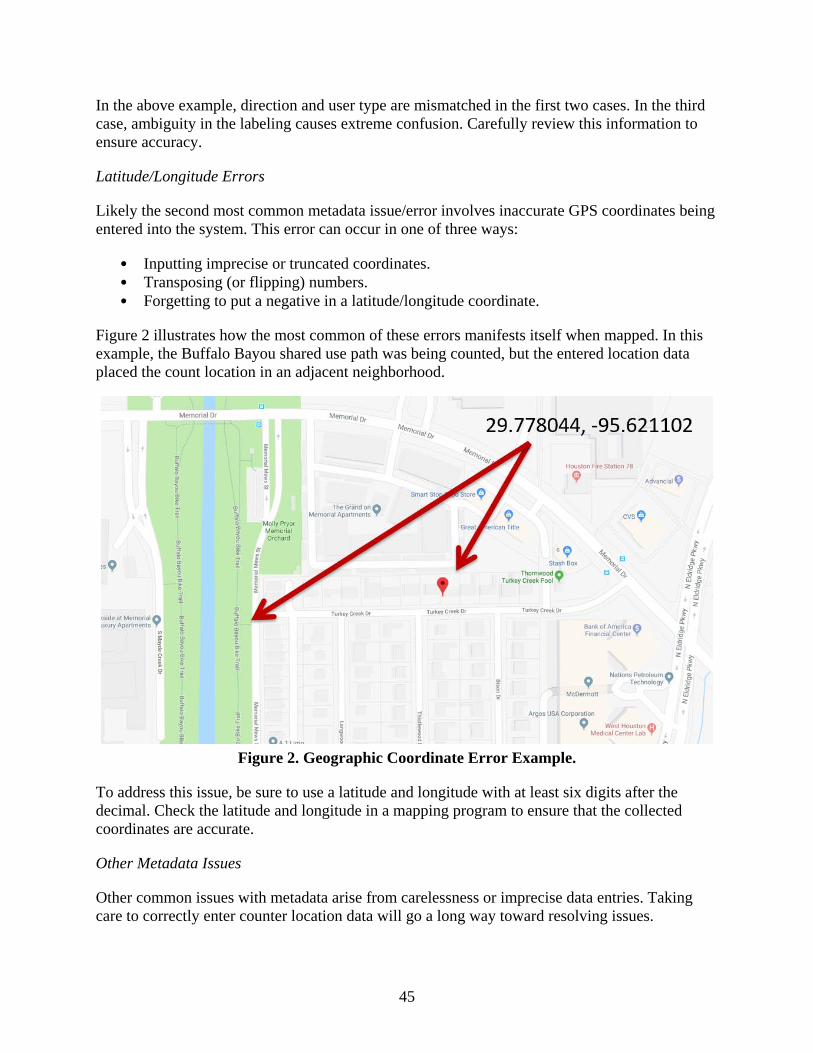
45
In the above example, direction and user type are mismatched in the first two cases. In the third case, ambiguity in the labeling causes extreme confusion. Carefully review this information to ensure accuracy.
Latitude/Longitude Errors
Likely the second most common metadata issue/error involves inaccurate GPS coordinates being entered into the system. This error can occur in one of three ways:
• Inputting imprecise or truncated coordinates. • Transposing (or flipping) numbers. • Forgetting to put a negative in a latitude/longitude coordinate.
Figure 2 illustrates how the most common of these errors manifests itself when mapped. In this example, the Buffalo Bayou shared use path was being counted, but the entered location data placed the count location in an adjacent neighborhood.
Figure 2. Geographic Coordinate Error Example.
To address this issue, be sure to use a latitude and longitude with at least six digits after the decimal. Check the latitude and longitude in a mapping program to ensure that the collected coordinates are accurate.
Other Metadata Issues
Other common issues with metadata arise from carelessness or imprecise data entries. Taking care to correctly enter counter location data will go a long way toward resolving issues.

46
Be sure that when entering metadata information, all fields have been entered as completely as possible. If appending newly collected data to previously collected data, ensure that data channels match the correct flow ID in the database and that there are no data date gaps or overlaps.
Visually Inspecting Count Data
The non-motorized count database allows for basic visualization on the count data. There are several different views that can be generated. The following figures show a standard daily subtotal view followed by hourly subtotals and raw data views. Figure 3 through Figure 5 illustrate what these views look like when users perform Steps 2 and 3 in the QAQC process.
When viewing the data in Steps 2 and 3, the primary goal is to get a feel for what is normal for that location. Take note of yearly patterns to ask the following question: are there consistent spikes once a year or slumps during the winter? It is also during this point that mass counter errors and malfunctions can easily be spotted. Viewing the data in several different ways will reveal nuances that only improve with time.
It is also helpful to zoom into the data (similar to Figure 5) to assess what the typical pattern during the day looks like. Take careful note of peaks, valleys, weekly patterns, and the normal range of variation between days. In good data sets, a strong weekday/weekend pattern can easily be seen. On low-usage facilities, take note of any patterns that can be discerned (this will be difficult).
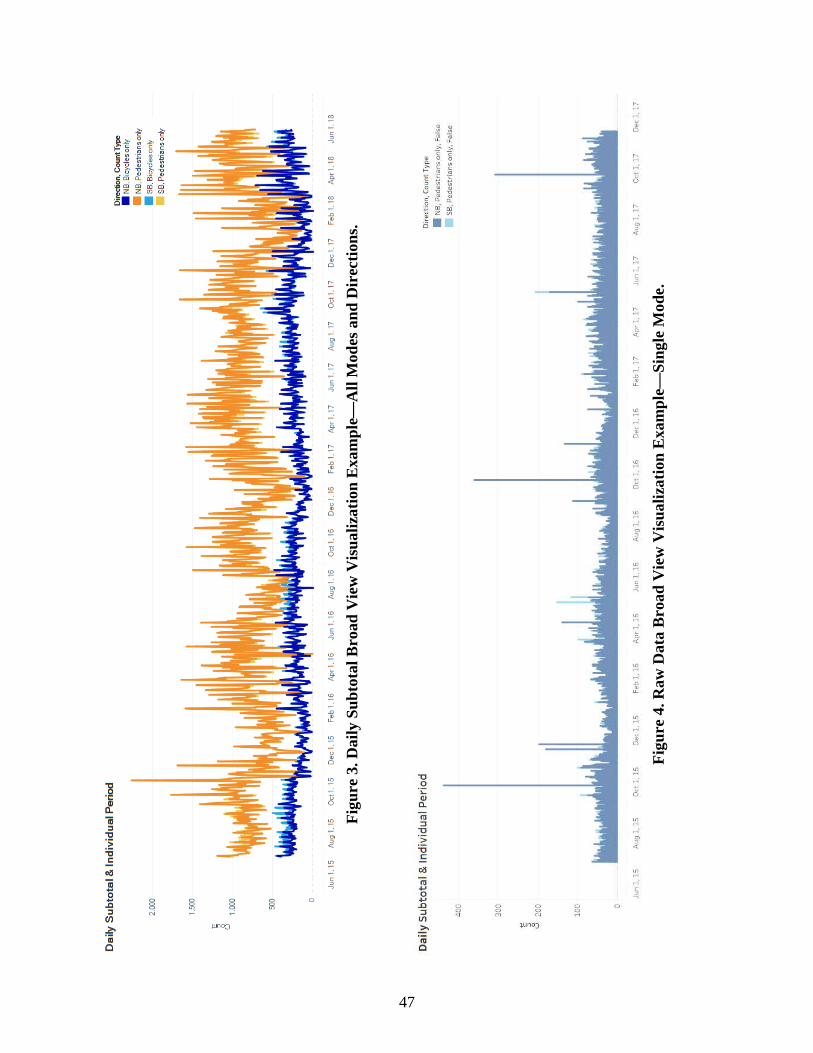
47
Fi
gure
3. D
aily
Sub
tota
l Bro
ad V
iew
Vis
ualiz
atio
n E
xam
ple—
All
Mod
es a
nd D
irec
tions
.
Fi
gure
4. R
aw D
ata
Bro
ad V
iew
Vis
ualiz
atio
n E
xam
ple—
Sing
le M
ode.
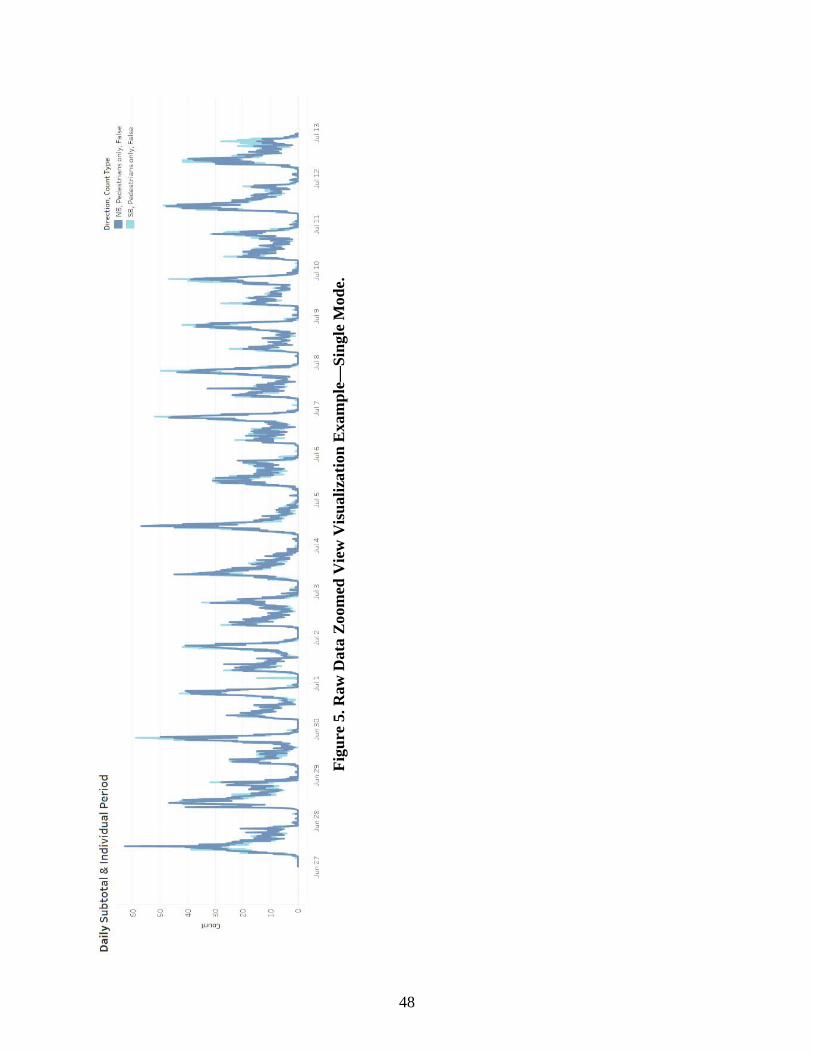
48
Fi
gure
5. R
aw D
ata
Zoom
ed V
iew
Vis
ualiz
atio
n E
xam
ple—
Sing
le M
ode.

49
GOOD VERSUS BAD DATA
This section discusses what different data patterns look like, including good, valid patterns; common invalid data patterns; and common ABV data patterns. While every count is different, many of these patterns can still be seen consistently in various locations.
Note that there is often a difference between bicycle and pedestrian count patterns: bicycle count patterns are usually more stable and consistent. Pedestrian patterns introduce more variation from day to day and month to month. Adjust judgment and expectations accordingly when looking for suspect data.
What Good Data Look Like
Good data exhibit a strong and consistent data pattern consistently over the course of a year. While there may be subtle fluctuations from time to time, the general use of the facility does not appear to change. Figure 6 through Figure 9 illustrate good and common data patterns.
Note that most of the examples (Figures 6 through 9) display some sort of stability—even with an occasional abnormal count spike. Figure 10 illustrates how weekend patterns can be identified from weekdays and a strong pattern of nightly use on weekdays can be clearly seen.
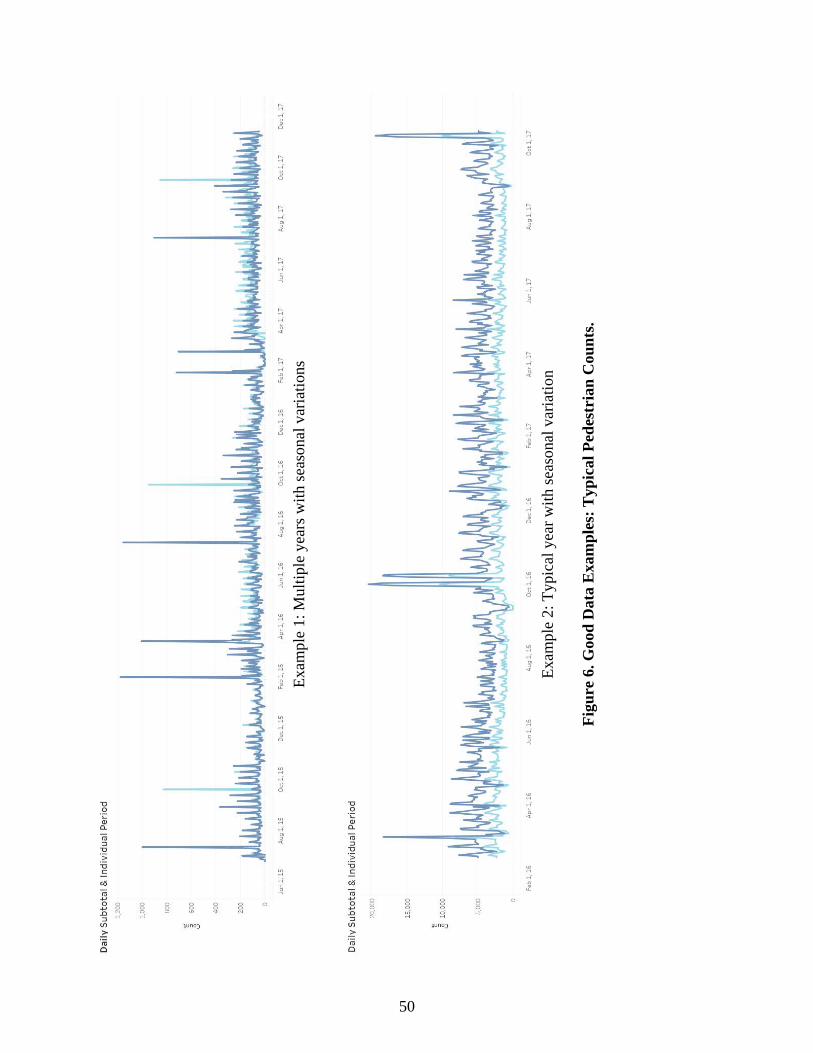
50
Ex
ampl
e 1:
Mul
tiple
yea
rs w
ith se
ason
al v
aria
tions
Ex
ampl
e 2:
Typ
ical
yea
r with
seas
onal
var
iatio
n
Figu
re 6
. Goo
d D
ata
Exa
mpl
es: T
ypic
al P
edes
tria
n C
ount
s.
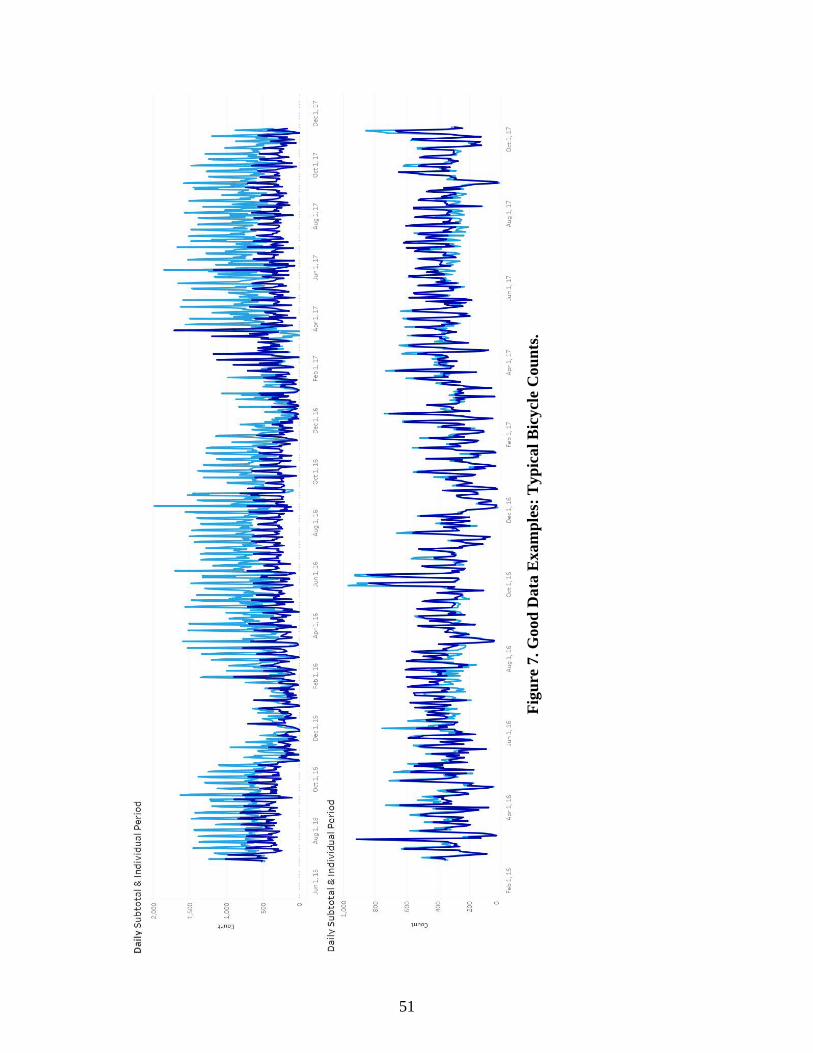
51
Fi
gure
7. G
ood
Dat
a E
xam
ples
: Typ
ical
Bic
ycle
Cou
nts.
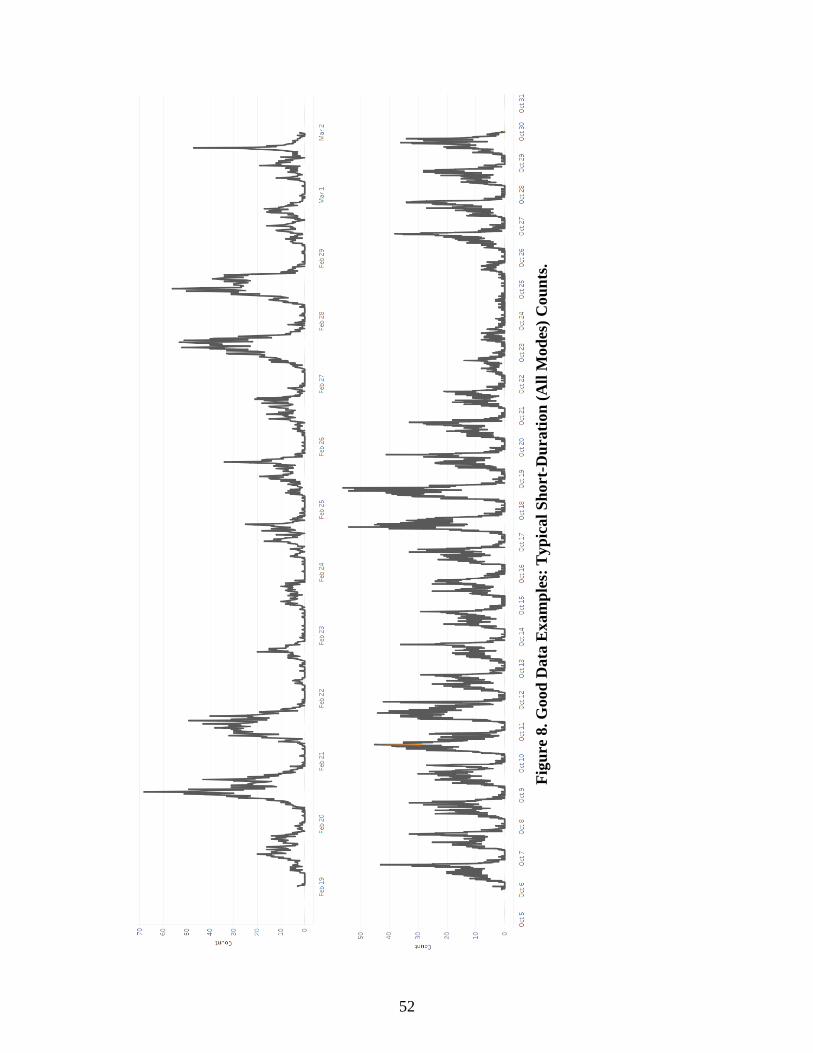
52
Fi
gure
8. G
ood
Dat
a E
xam
ples
: Typ
ical
Sho
rt-D
urat
ion
(All
Mod
es) C
ount
s.
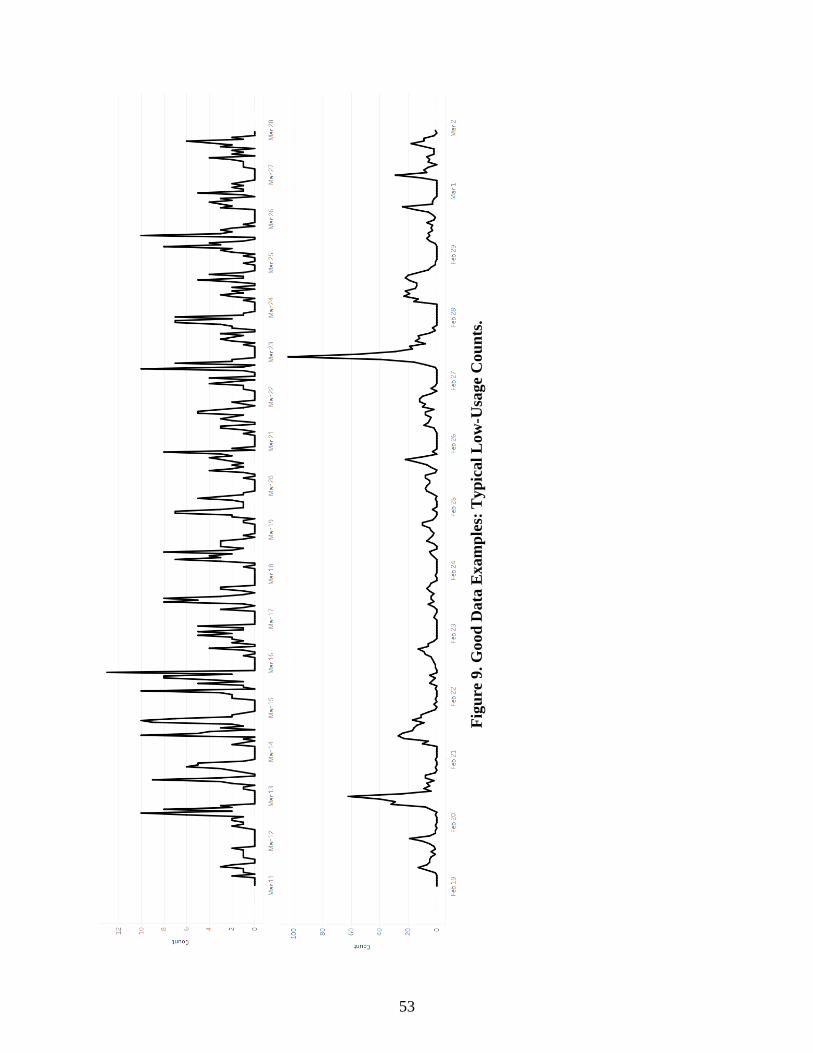
53
Fi
gure
9. G
ood
Dat
a E
xam
ples
: Typ
ical
Low
-Usa
ge C
ount
s.
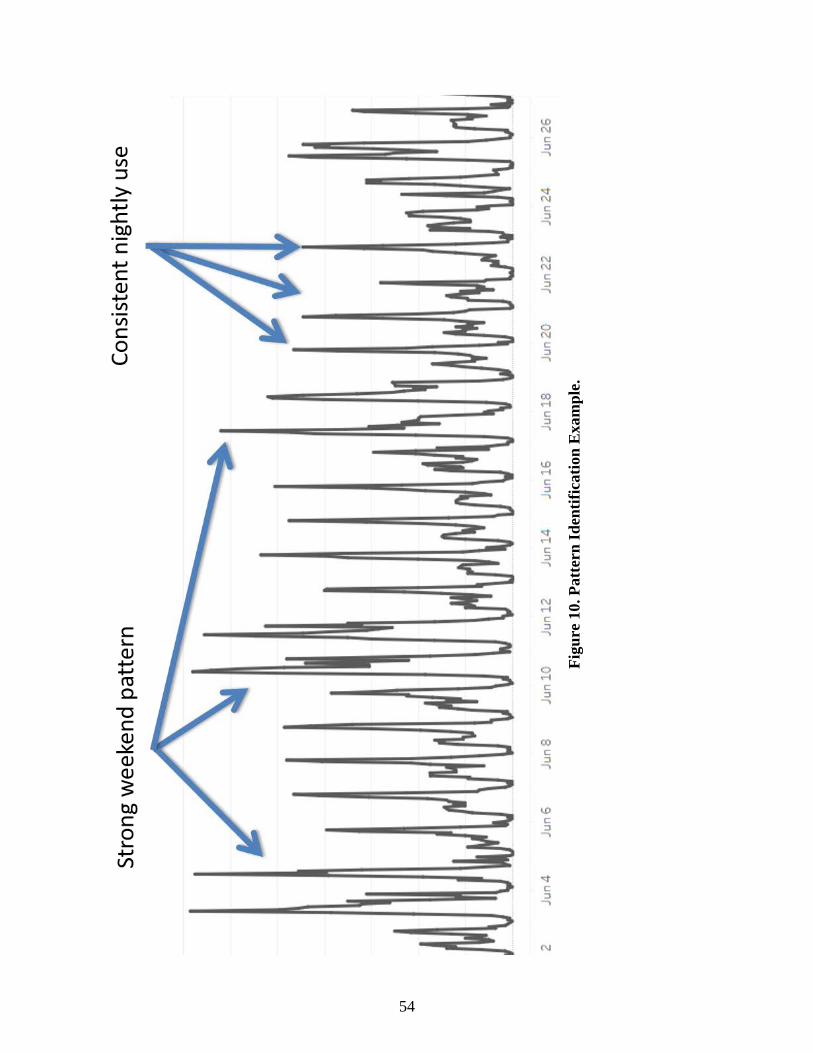
54
Fi
gure
10.
Pat
tern
Iden
tific
atio
n E
xam
ple.
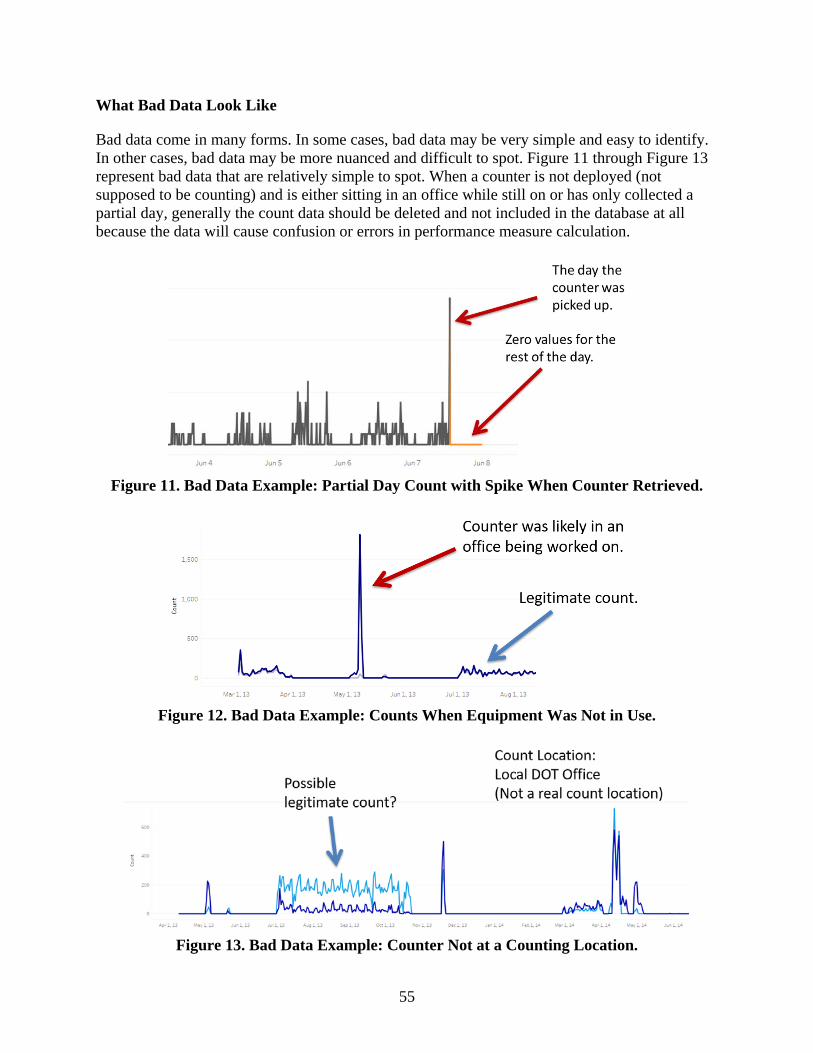
55
What Bad Data Look Like
Bad data come in many forms. In some cases, bad data may be very simple and easy to identify. In other cases, bad data may be more nuanced and difficult to spot. Figure 11 through Figure 13 represent bad data that are relatively simple to spot. When a counter is not deployed (not supposed to be counting) and is either sitting in an office while still on or has only collected a partial day, generally the count data should be deleted and not included in the database at all because the data will cause confusion or errors in performance measure calculation.
Figure 11. Bad Data Example: Partial Day Count with Spike When Counter Retrieved.
Figure 12. Bad Data Example: Counts When Equipment Was Not in Use.
Figure 13. Bad Data Example: Counter Not at a Counting Location.
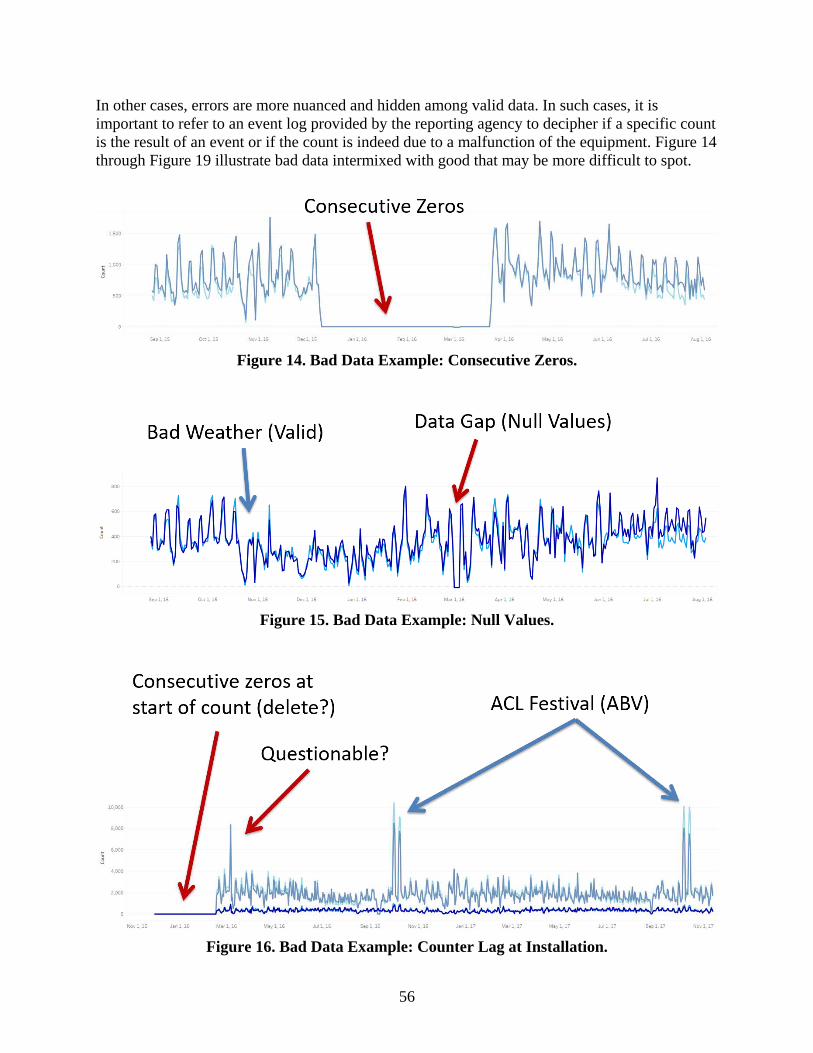
56
In other cases, errors are more nuanced and hidden among valid data. In such cases, it is important to refer to an event log provided by the reporting agency to decipher if a specific count is the result of an event or if the count is indeed due to a malfunction of the equipment. Figure 14 through Figure 19 illustrate bad data intermixed with good that may be more difficult to spot.
Figure 14. Bad Data Example: Consecutive Zeros.
Figure 15. Bad Data Example: Null Values.
Figure 16. Bad Data Example: Counter Lag at Installation.
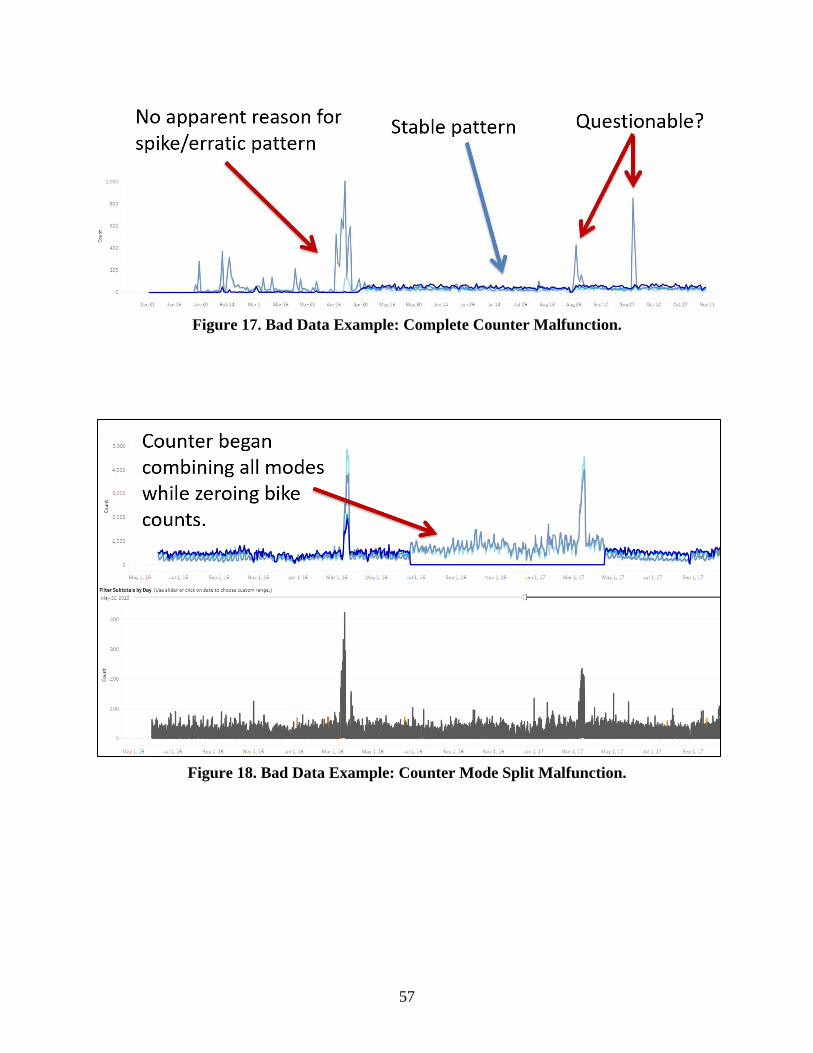
57
Figure 17. Bad Data Example: Complete Counter Malfunction.
Figure 18. Bad Data Example: Counter Mode Split Malfunction.
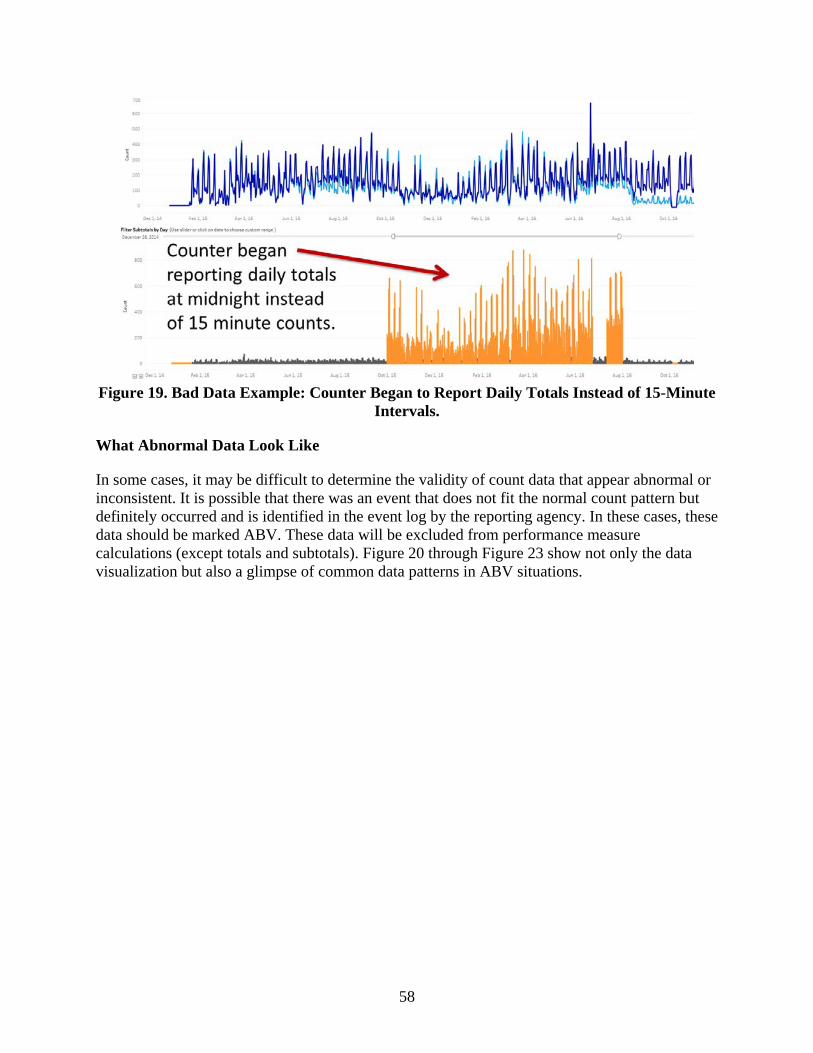
58
Figure 19. Bad Data Example: Counter Began to Report Daily Totals Instead of 15-Minute
Intervals.
What Abnormal Data Look Like
In some cases, it may be difficult to determine the validity of count data that appear abnormal or inconsistent. It is possible that there was an event that does not fit the normal count pattern but definitely occurred and is identified in the event log by the reporting agency. In these cases, these data should be marked ABV. These data will be excluded from performance measure calculations (except totals and subtotals). Figure 20 through Figure 23 show not only the data visualization but also a glimpse of common data patterns in ABV situations.
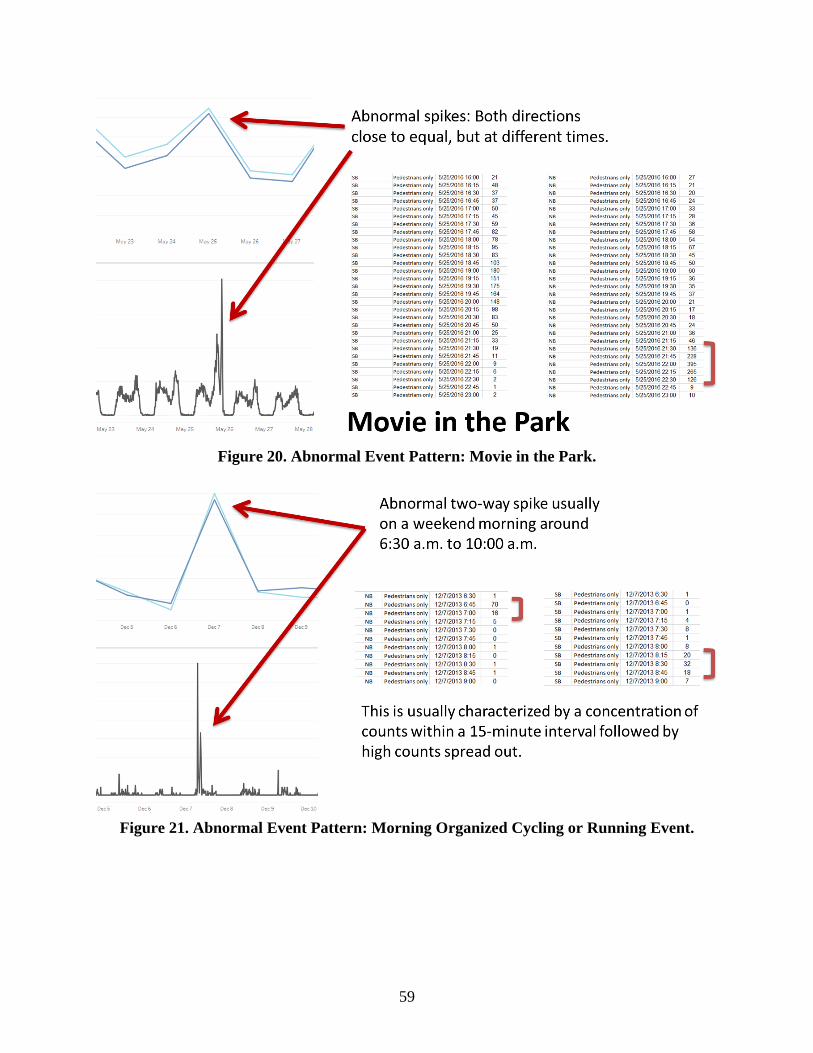
59
Figure 20. Abnormal Event Pattern: Movie in the Park.
Figure 21. Abnormal Event Pattern: Morning Organized Cycling or Running Event.
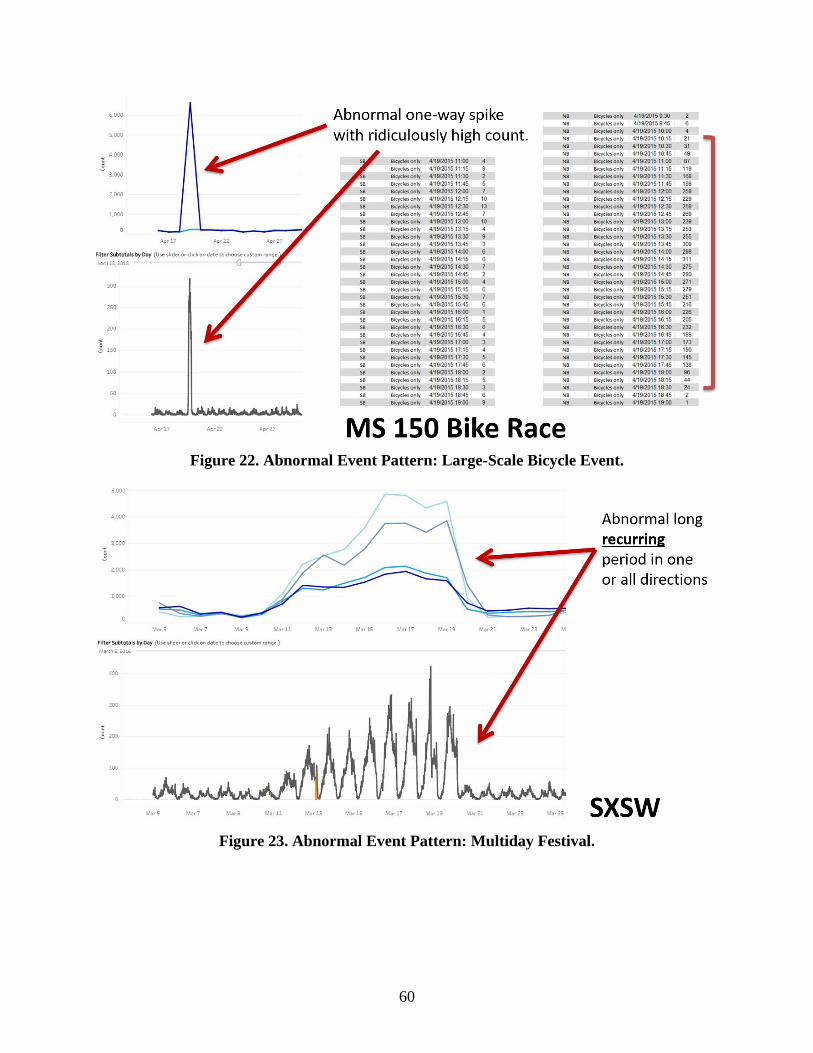
60
Figure 22. Abnormal Event Pattern: Large-Scale Bicycle Event.
Figure 23. Abnormal Event Pattern: Multiday Festival.
61
LOGGING COMMENTS
Keeping a detailed log (maintained by the agency that collected the data, outside of the formal data submittal process) is a critical element of the QAQC process. Simply flagging data as invalid or ABV does not allow a user of the data to spot trends that are more difficult to identify. For example, several of the ABV patterns discussed earlier are commonly discovered only after reviewing several anomalous periods in a log and identifying them as a specific event or user group.
As a general rule, every change made to count data or every flagged value should be logged in some way to identify these key elements:
• The timestamp of the count(s) flagged. • What flag was used/which QC test was failed. • The direction and mode of the count flagged. • The actual or suspected reason for the error. • Any commentary addressing the flag (if any). • Some identifier of the person entering the log with a date.
Additionally, changes made to metadata or other anomalous happenings should be logged following similar guidelines. These logs would include mass counter malfunctions where something physically happened to the counter that would explain months or years of bad data. For example, log when an inductive loop wire is cut (and subsequently repaired) or if a counter displays zero values for months immediately after being installed.
Other elements that could and should be logged include any pattern information such as:
• Judgments on the stability and apparent seasonality of the counts. • Noticeable and recurring spikes in counts that were ultimately not flagged as invalid or
ABV but are still worth noting.
Another habitual practice for reporting agencies to develop is to create and maintain an event log. This log will dramatically reduce the amount of time spent evaluating whether a count is invalid or ABV. Every time there is some event, rare weather occurrence, or festival, simply record the date and time, name, and locations impacted.
Ultimately, log everything and keep the logs organized. The logs should be maintained by the agency that collected the count data and are not required to be submitted to TxDOT. These data review logs can be used if/when questions arise about non-motorized count data.
TIPS ON WHAT TO LOOK FOR WHEN REVIEWING DATA
Below are several tips based on the researchers’ experience reviewing hundreds of thousands of data points that users may find helpful during the review process. These tips are not mandatory but recommended to streamline the review process and maximize accuracy.
• Start with the whole picture and then zoom: Always begin by looking at the daily subtotals for the entire period and then zoom into the data and scan through the entire
62
data for anomalies. This practice allows reporting agencies to quickly spot potential issues or events that occur on an annual basis. Do a web search on days where a dramatic spike in counts has been registered.
• Connect behavior with the count: Sometimes it may be difficult to look at numbers and tests to determine whether the data are valid or not. Try to imagine the time of day in question and how many users the count represents. For example, go outside and count in person if needed to visualize what 25 users looks like in a 15-minute period.
• Look for rainy or snowy days: If a count has a stable pattern and then suddenly drops to a low or zero number for a day or two, check the historical weather record. Sometimes a rainy day can look very similar to an error in the data. Consult Weather Underground (www.wunderground.com) for easy-to-read historical weather information.
• Look for overnight count spikes: Counts can dramatically elevate from zero to over 100 as early as 5:00 a.m. These spikes are usually normal and represent an exercise group or early commuters. Counts may again elevate in the later afternoon and evenings. As a general rule, do not mark these as abnormal. Instead, look for dramatic spikes during overnight periods because these are less likely to occur. Be sure the facility in question is not near a bar district or commercial businesses open late that might cause the spike.
• Be aware of wrong-way riders: For bicycle counts on on-street bikeways that measure direction, beware of counts showing a stable pattern in one direction and showing incredibly low and unstable counts in the other direction. These unstable patterns are the result of wrong-way riders. When calculating performance measures, those riders must be added to the correct direction on another count location.
• Pay attention to directional splits: In general, the count in one direction should be close to or related to the count in the other direction. A sudden departure from this pattern may indicate counter error. Counters that determine directionality are generally set to default indeterminable counts to a northbound or eastbound direction. If either of those two directions becomes abnormally high, that period may be in error.
• Look for spikes after or before null or zero values: One pattern sometimes seen occurs immediately before or after a counter begins to show an error. Sudden spikes, like the ones seen in Figure 11, may likely occur and should be flagged as invalid. The spike is likely the counter catching up with all the counts it missed over the error period, but there is no way to ensure the count validity.
63
APPENDIX A. TXDOT STATION DESCRIPTION DATA ENTRY FORM
The station description file includes 63 attributes (see Table 1) that describe various characteristics of each count station. Of the 63 total station description attributes, 28 attributes are required, and 45 attributes are optional. Several of the attributes are limited to a fixed number of possible choices (i.e., enumerated values) through point-and-click selections. To make data entry easier and more accurate, a station description data entry form was created in Excel. This data entry form uses the same color codes as Table 1 to indicate required and optional data attributes, and it uses Excel list data validation to ensure that users enter data correctly based on available list choices.
The TxDOT Station Description Data Entry Form in Excel contains the following worksheets:
• Station Entry Form: This worksheet (see Figure 24 and Figure 25) is a blank form that should be used to enter station description data for one count station location. This worksheet should be copied to create multiple forms if a user needs to enter station description data for more than one count station location. This form contains four columns because that is typically the highest number of columns needed for entering station metadata (e.g., counting pedestrians and bicyclists each in two separate directions uses four columns).
• Example 1 Bikes Shared Lane: This worksheet is the first of three completed examples using actual data. This example illustrates the entry of station description data for a bicyclist-only count station in a shared roadway lane in Corpus Christi.
• Example 2 Peds Bikes Path: This worksheet is the second of three completed examples using actual data. This example illustrates the entry of station description data for a directional pedestrian and bicyclist count station on a shared use path in San Antonio.
• Example 3 All Users Sidewalk: This worksheet is the last of three completed examples using actual data. This example illustrates the entry of station description data for all users (no directionality) on a sidewalk in Sugar Land.
• Lookup: This worksheet is protected and contains the list of valid values (e.g., lookup tables) for selected station description data attributes.

64
Fi
gure
24.
Scr
eens
hot o
f TxD
OT
Sta
tion
Des
crip
tion
Dat
a E
ntry
For
m, T
op P
ortio
n.
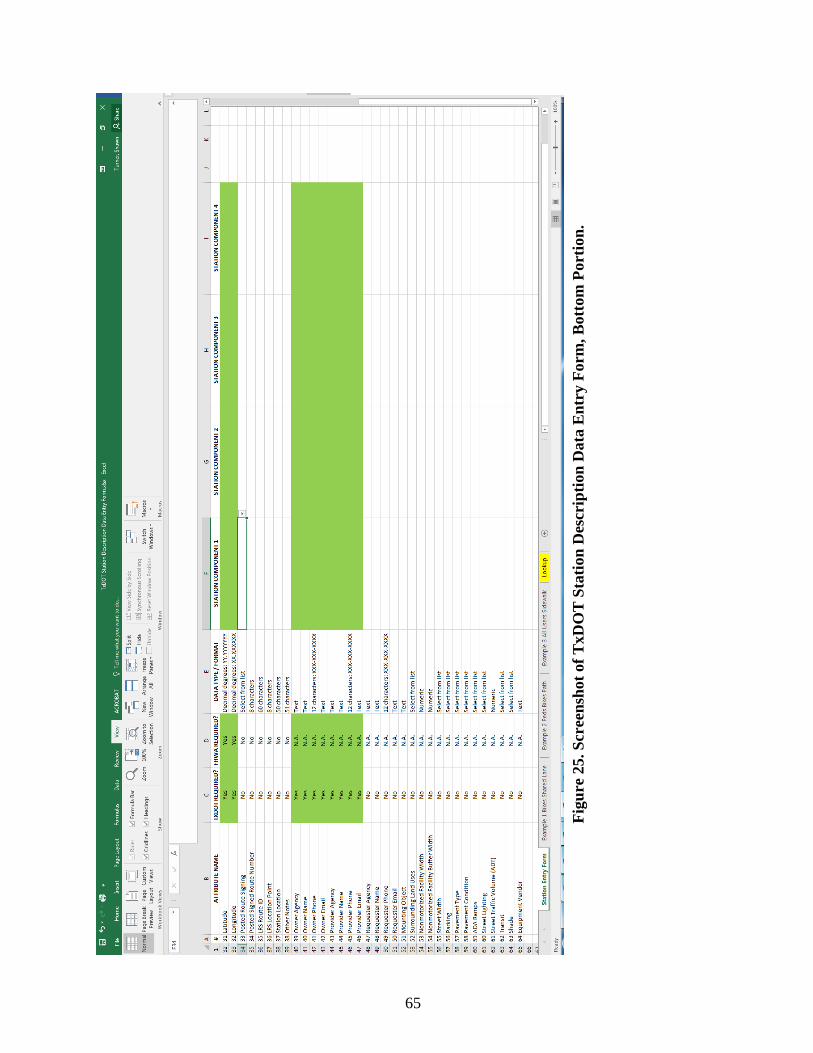
65
Fi
gure
25.
Scr
eens
hot o
f TxD
OT
Sta
tion
Des
crip
tion
Dat
a E
ntry
For
m, B
otto
m P
ortio
n.

67
APPENDIX B. NON-MOTORIZED COUNT PROGRAM GUIDELINES
This appendix provides recommendations for those considering the establishment of a non-motorized count program. It is divided into the following sections:
• Program design: permanent and short-duration counts. • Selecting equipment. • Selecting sites. • Coordination. • Summary of recommendations.
PROGRAM DESIGN: PERMANENT AND SHORT-DURATION COUNTS
Pedestrian and bicyclist counts can vary significantly by season, day of week, time of day, and even weather conditions. A successful pedestrian and bicyclist traffic monitoring program should account for this significant variability when establishing the number and type of count data collection sites. The FHWA TMG recommends the same overall monitoring program design that has been used for motor vehicle counts for more than 50 years:
• A modest number of permanent, continuously operating pedestrian and bicyclist count sites.
• A large number of short-duration pedestrian and bicyclist counts conducted using portable equipment.
As indicated in FHWA’s TMG:
The short duration counts provide the geographic coverage to understand traffic characteristics on individual roads, streets, shared use paths, and pedestrian facilities, as well as on specific segments of those facilities. They provide site-specific data on the time-of-day variation, can provide data on day-of-week variation in non-motorized travel, but are mostly intended to provide current general traffic volume information throughout the larger monitored network. However, short duration counts cannot be directly used to provide many of the required data items desired by users. Statistics such as annual average traffic cannot be accurately measured during a short duration count. Instead, data collected during short duration counts are factored or adjusted to create these annual average estimates.
The development of those factors requires the operation of at least a modest number of permanently operating traffic monitoring sites. Permanent data collection sites provide data on seasonal and day-of-week trends. Continuous count summaries also provide very precise measurements of changes in travel volumes and characteristics at a limited number of locations.
In summary, the continuous count sites provide extensive time coverage at a limited number of locations. The short-duration sites provide extensive geographic coverage for a limited time duration. When combined in a systematic manner, the continuous and short-duration count sites

68
provide a more comprehensive picture of pedestrian and bicyclist traffic levels, patterns, and trends. Sections 4.4 and 4.5 of FHWA’s TMG provide guidance and examples on combining continuous and short-duration counts in a pedestrian and bicyclist monitoring program. Table 3 includes key guidance for non-motorized count programs.
Table 3. Key Guidance Documents for Non-motorized Count Programs. Guidance Document or Report Useful Resources or Application
FHWA 2016 Traffic Monitoring Guide, Chapter 4: Traffic Monitoring for Non-Motorized Traffic https://www.fhwa.dot.gov/policyinformation/tmguide/
• Automatic counter technology and equipment • Systematic monitoring using combination of
permanent and short-duration count sites • Non-motorized traffic patterns • Standardized non-motorized traffic data format
Report FHWA-HEP-17-011, Coding Nonmotorized Station Location Information in the 2016 Traffic Monitoring Guide Format, 2016 https://www.fhwa.dot.gov/environment/bicycle_pedestrian/publications/tmg_coding/fhwahep17011.pdf
• Extensive guidance and interpretation on the standardized non-motorized traffic data format and attributes in the TMG
• Relevant for submitting non-motorized count data to FHWA’s Travel Monitoring Analysis System
Report FHWA-HEP-17-012, FHWA Bicycle-Pedestrian Count Technology Pilot Project—Summary Report, 2016 https://www.fhwa.dot.gov/environment/bicycle_pedestrian/countpilot/summary_report/fhwahep17012.pdf
• Automatic counter technology and equipment • Identification of suitable count locations • Practical lessons learned in collecting and using
count data
NCHRP Report 797, Guidebook on Pedestrian and Bicycle Volume Data Collection, 2014 http://www.trb.org/Main/Blurbs/171973.aspx
• Systematic monitoring of counts • Automatic counter technology and equipment,
calibration and validation, and technology evaluation
NCHRP Web-Only Document 229, Methods and Technologies for Pedestrian and Bicycle Data Collection: Phase 2, 2016 http://www.trb.org/Main/Blurbs/175860.aspx
• Extensive and most up-to-date evaluation of automatic counter technology
Report FHWA-HPL-16-026, Exploring Pedestrian Counting Procedures: A Review and Compilation of Existing Procedures, Good Practices, and Recommendations, May 2016 https://www.fhwa.dot.gov/policyinformation/travel_monitoring/pubs/hpl16026/
• Automatic counter technology and equipment • Automatic counter validation and calibration • Recommended count practices for various facility
types • Data management procedures (quality assurance,
metadata, data analysis) Alta Planning + Design, Innovation in Bicycle and Pedestrian Counts: A Review of Emerging Technology, 2016 http://altaplanning.com/wp-content/uploads/Innovative-Ped-and-Bike-Counts-White-Paper-Alta.pdf
• Automatic counter technology and equipment • Innovative and emerging technology for non-
motorized counts
North Central Texas Council of Governments Peer Exchange on Bicycle and Pedestrian Count Programs, Transportation Planning Capacity Building Peer Program, May 2013 https://www.planning.dot.gov/Peer/Texas/arlington_5-29-13.pdf
• Best practices for monitoring programs • Practical lessons learned in collecting and using
count data • Options for establishing a count program and the
associated costs and benefits
69
ORGANIZATIONAL MODELS—WHO DOES WHAT?
Numerous public agencies and stakeholders need or want pedestrian and bicyclist count data. In some cases, their data requirements are similar or overlapping. One of the key questions is “Who does what?” There is not a single easy answer, and who does what often depends on several contextual factors and criteria. This section discusses organization models (i.e., who does what) in more detail.
The traditional model for motor vehicle traffic monitoring has been a strong, centralized control and administration. State DOTs have been the agency responsible for monitoring and reporting motorized vehicle traffic, and their efforts have focused on those highways that are state-maintained and carry the most traffic. Cities and MPOs have primarily relied on their state DOT for traffic counts where they are available, but agencies will sometimes conduct their own limited counts as needed on a case-by-case basis. Recently, the increasing demand and requirements for more and better data are changing this strong central role of the state DOT in some states. Recognizing the difficulty and challenges, some state DOTs are cooperating more with cities and MPOs on data collection, whereby traffic monitoring is becoming a shared responsibility and cities and MPOs contribute to state DOT traffic monitoring efforts and to a statewide traffic data clearinghouse.
Conversely, non-motorized traffic monitoring has largely been undertaken by cities and MPOs, with little involvement by state DOTs. This practice is partially due to the tendency for most pedestrian and bicyclist traffic to be on city streets rather than on state highways. As with motorized traffic monitoring, however, some state DOTs are cooperating more with cities and MPOs on non-motorized data collection. The role of these cooperating state DOTs varies. In some cases, the state DOT serves as a clearinghouse, compiling all available non-motorized traffic counts within the state. In other cases, the state DOT maintains its own monitoring sites.
In Texas, the role of each agency (i.e., who does what) is partly predetermined by the current situation: numerous cities, MPOs, and local authorities are already collecting non-motorized count data for their own uses. TxDOT has initiated a statewide process for collecting non-motorized counts. Agency roles will be determined by what is feasible given current and projected resources, staffing, and expertise. Agency roles will also be determined by compatibility with an agency’s mission, goals, and objectives. Finally, agency roles should be openly discussed, debated, and communicated to clearly identify who is responsible for what.
Based on lessons learned by researchers in pilot tests and information gathered on existing practices in Texas, the following recommendations are provided regarding non-motorized traffic monitoring:
• Establish and maintain a statewide data clearinghouse: Further efforts are necessary to fully implement the statewide data clearinghouse function. The current statewide database may serve as an interim clearinghouse until an enterprise-level data clearinghouse is warranted/feasible. The enterprise-level clearinghouse will facilitate various data upload, reporting, and management functions. In the meantime, local agencies will continue to voluntarily and routinely upload their non-motorized count data to the statewide clearinghouse.
70
• Conduct supplemental monitoring on high-priority state roadways: Numerous local agencies are already collecting non-motorized count data on mostly local streets and shared use paths for their own uses. It is recommended that TxDOT focus additional efforts on supplemental monitoring of high-priority state roadways that have visible bicycle use and are not currently being monitored by local agencies. Ideally, state roadway-based monitoring systems would be maintained by TxDOT district staff or contractors who monitor motorized traffic.
• Facilitate coordination and share best practices: Agencies should facilitate coordination among partnering agencies and TxDOT districts to establish best practices among these groups. Some best practices have been identified and shared through this research project, but there are benefits to having ongoing communications and coordination among agencies within Texas that are monitoring non-motorized traffic. The Colorado DOT created a traffic data committee that meets monthly to share information about its plans and practices.
• Expedite counter deployment: Some local agencies or TxDOT districts have technical or financial difficulty purchasing and/or installing non-motorized counter equipment. Expediting counter deployment will enable local data to be uploaded into TxDOT’s statewide data clearinghouse. Agencies looking to start a program can expedite counter deployment by seeking (a) small grants to purchase equipment, and (b) loaner equipment that can be borrowed for up to one month from the local MPO or local TxDOT district office, where equipment may be available.
SELECTING EQUIPMENT
Documenting use of non-motorized facilities typically involves counting users, including cyclists, pedestrians, and other non-motorized (skating, scooters, equestrian, etc.) users. Counting non-motorized users is more difficult than counting motorized traffic. Non-motorized users start and stop, do not follow regular paths, can be grouped tighter, and are typically not confined to a path; such factors can make counting a challenge.
Several technologies can be used to count non-motorized activity, and all have advantages and disadvantages. These technologies and specific counters have been evaluated locally and nationally. A concise summary of these evaluations is presented in the TMG. Figure 26 shows the TMG summary of the technologies, counter capability, duration, and cost.
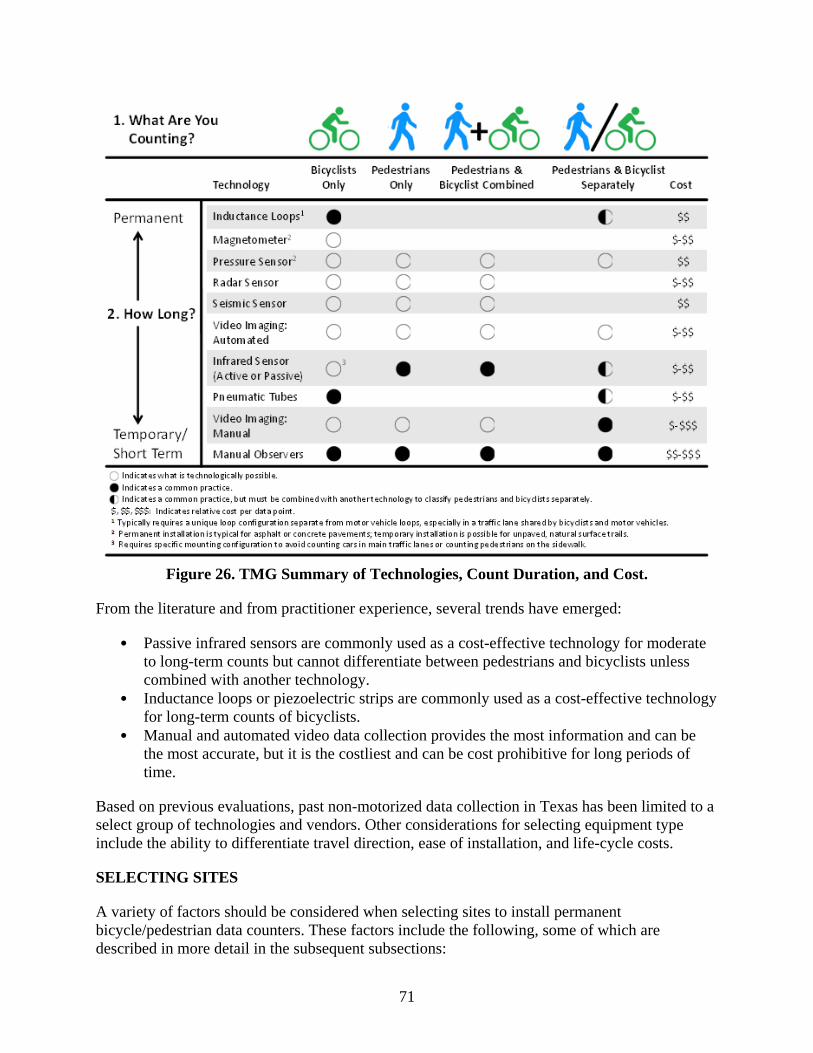
71
Figure 26. TMG Summary of Technologies, Count Duration, and Cost.
From the literature and from practitioner experience, several trends have emerged:
• Passive infrared sensors are commonly used as a cost-effective technology for moderate to long-term counts but cannot differentiate between pedestrians and bicyclists unless combined with another technology.
• Inductance loops or piezoelectric strips are commonly used as a cost-effective technology for long-term counts of bicyclists.
• Manual and automated video data collection provides the most information and can be the most accurate, but it is the costliest and can be cost prohibitive for long periods of time.
Based on previous evaluations, past non-motorized data collection in Texas has been limited to a select group of technologies and vendors. Other considerations for selecting equipment type include the ability to differentiate travel direction, ease of installation, and life-cycle costs.
SELECTING SITES
A variety of factors should be considered when selecting sites to install permanent bicycle/pedestrian data counters. These factors include the following, some of which are described in more detail in the subsequent subsections:

72
• Geographical regions of the area. • Area type/land use. • Facility type. • Counter capabilities, costs, and consistency. • Existing counts and other permanent counters in the area. • Coordination with agency partners and user groups. • Previous short-duration counts.
Urban/Rural Areas and Land Use
Urban/rural areas and land use are interconnected characteristics affecting non-motorized use. Adjacent land use is an important indicator of trip purpose that, in turn, influences time-of-day and day-of-week traffic patterns.
Urban areas typically include a mix of commercial, residential, office, and mixed-use land development. Urban areas tend to exhibit a higher population density with a greater proportion of multi-family residences than single-family structures compared with suburban and rural areas. Building types include multi-story development utilizing most of the buildable land. Suburban areas, located outside the city center, typically have lower population density, with residential areas separated from commercial areas. Rural areas, located outside of urban and suburban areas, generally present sparse development patterns.
Facility Type
A diverse set of facility types should be counted. Facility type should also be a consideration because there are different comfort levels, user experience levels/abilities, and trip purposes associated with different facilities. Along with land use, facility type is another important variable that affects weekly and daily non-motorized traffic trends. The facility types considered should include:
• Shared roadways. • Shoulders. • Designated bike lanes. • Cycle tracks. • Shared use paths. • Sidewalks.
Existing Counts and Other Permanent Counters in the Area
Pedestrian and bicyclist count data should be compared with all available bicycle/pedestrian data where potential data sources overlap: permanent, temporary, historical, proposed, and crowdsourced data. The location of existing permanent and temporary counts provides a background and progression of usage. The duration of the counts is important due to the variability in the non-motorized data. Longer periods of time demonstrate the patterns related to growth and decline, as well as the seasonal and temporal patterns, and help to differentiate those patterns from the large variability related to weather, security, and other issues that affect usage. Crowdsourced data provide a highly variable sample of data over long periods of time and large
73
geographic extent. Both the geographic area and time duration provide valuable information for evaluation and comparison of data sources.
COORDINATION
It is important for any agency considering a non-motorized count program to work closely with TxDOT and its agency partners and user groups in determining the sites for installing permanent and temporary data collection equipment.
SUMMARY OF RECOMMENDATIONS Agencies considering the establishment of a non-motorized count program should be mindful of the following identified elements that contribute to a successful non-motorized traffic monitoring program:
• Complement a modest number of permanent, continuous monitoring sites with a larger number of short-duration sites (using portable equipment). The continuous count sites provide extensive time coverage at a limited number of locations, while the short-duration sites provide extensive geographic coverage for a limited time duration.
• Facilitate cooperation, coordination, and communication between the state (TxDOT) and other local agencies to clearly define who does what regarding non-motorized traffic monitoring.
• Leverage partnerships with local agencies to access materials, labor, and equipment for installation and operation/maintenance of temporary and permanent counters and identify additional funds to purchase more counters.
• For maximizing short-duration count data, deploy equipment for at least two weeks to capture at least two weekends and an entire week in between. One way to do this is to deploy on Thursday, pick up 13 days later on Wednesday, download data, and re-deploy on Thursday again.
• Exercise caution when attempting to expand or factor data since short-duration counts are highly variable. Count data should be expressed as weekday averages and weekend averages or a range.
• Understand the advantages and disadvantages of short-duration counter equipment. For example, the advantages of TRAFx counters is that they are inexpensive and easy to deploy (install) and pick up. The disadvantages are that they only give a total number of users (pedestrians and bicyclists combined) and directional information is not recorded.
• Keep in mind the limitations or challenges of the different equipment options. One limitation is that counters using infrared sensors must be aimed away from motor vehicles or moving vegetation. Site location needs to be carefully chosen. Install infrared counters on a post or pole between the bicycle/pedestrian facility and the roadway travel lanes, aiming away from traffic to a fence or other fixed structure.
• Invest in permanent counters that provide maximum data collection possibilities. Knowing the count data for each mode separately and by direction will prove useful for variability and for applying adjustment factors using crowdsourced data.
• Install these counters in locations that provide a regional perspective about walking and bicycling.