National Institute for Natural Products, Vaccines & Biologicals

Guidance Manual- Quality Control of Blood Glucose Test Strips
Document ID No. NIB/ BK/GM/01 Effective Date: Page 1 of 29
GUIDANCE MANUAL
for “Quality Control of Blood Glucose Test Strips”
NATIONAL INSTITUTE OF BIOLOGICALS
Ministry of Health & Family Welfare
(Government of India)
A-32, Sector -62, Institutional Area NOIDA- 201307
Telephone: 0091-120-2400022, 2400072
Guidance Manual- Quality Control of Blood Glucose Test Strips
Document ID No. NIB/ BK/GM/01 Effective Date: Page 2 of 29
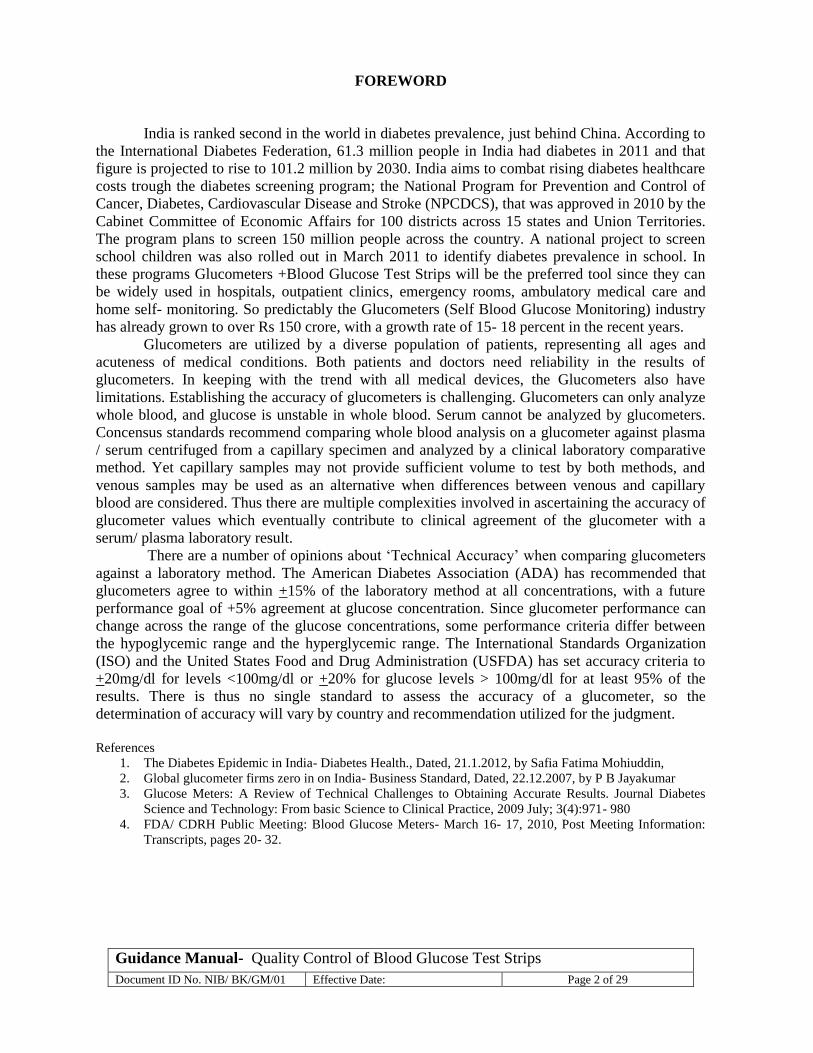
FOREWORD
India is ranked second in the world in diabetes prevalence, just behind China. According to
the International Diabetes Federation, 61.3 million people in India had diabetes in 2011 and that
figure is projected to rise to 101.2 million by 2030. India aims to combat rising diabetes healthcare
costs trough the diabetes screening program; the National Program for Prevention and Control of
Cancer, Diabetes, Cardiovascular Disease and Stroke (NPCDCS), that was approved in 2010 by the
Cabinet Committee of Economic Affairs for 100 districts across 15 states and Union Territories.
The program plans to screen 150 million people across the country. A national project to screen
school children was also rolled out in March 2011 to identify diabetes prevalence in school. In
these programs Glucometers +Blood Glucose Test Strips will be the preferred tool since they can
be widely used in hospitals, outpatient clinics, emergency rooms, ambulatory medical care and
home self- monitoring. So predictably the Glucometers (Self Blood Glucose Monitoring) industry
has already grown to over Rs 150 crore, with a growth rate of 15- 18 percent in the recent years.
Glucometers are utilized by a diverse population of patients, representing all ages and
acuteness of medical conditions. Both patients and doctors need reliability in the results of
glucometers. In keeping with the trend with all medical devices, the Glucometers also have
limitations. Establishing the accuracy of glucometers is challenging. Glucometers can only analyze
whole blood, and glucose is unstable in whole blood. Serum cannot be analyzed by glucometers.
Concensus standards recommend comparing whole blood analysis on a glucometer against plasma
/ serum centrifuged from a capillary specimen and analyzed by a clinical laboratory comparative
method. Yet capillary samples may not provide sufficient volume to test by both methods, and
venous samples may be used as an alternative when differences between venous and capillary
blood are considered. Thus there are multiple complexities involved in ascertaining the accuracy of
glucometer values which eventually contribute to clinical agreement of the glucometer with a
serum/ plasma laboratory result.
There are a number of opinions about ‘Technical Accuracy’ when comparing glucometers
against a laboratory method. The American Diabetes Association (ADA) has recommended that
glucometers agree to within +15% of the laboratory method at all concentrations, with a future
performance goal of +5% agreement at glucose concentration. Since glucometer performance can
change across the range of the glucose concentrations, some performance criteria differ between
the hypoglycemic range and the hyperglycemic range. The International Standards Organization
(ISO) and the United States Food and Drug Administration (USFDA) has set accuracy criteria to
+20mg/dl for levels <100mg/dl or +20% for glucose levels > 100mg/dl for at least 95% of the
results. There is thus no single standard to assess the accuracy of a glucometer, so the
determination of accuracy will vary by country and recommendation utilized for the judgment.
References
1. The Diabetes Epidemic in India- Diabetes Health., Dated, 21.1.2012, by Safia Fatima Mohiuddin,
2. Global glucometer firms zero in on India- Business Standard, Dated, 22.12.2007, by P B Jayakumar
3. Glucose Meters: A Review of Technical Challenges to Obtaining Accurate Results. Journal Diabetes
Science and Technology: From basic Science to Clinical Practice, 2009 July; 3(4):971- 980
4. FDA/ CDRH Public Meeting: Blood Glucose Meters- March 16- 17, 2010, Post Meeting Information:
Transcripts, pages 20- 32.

Guidance Manual- Quality Control of Blood Glucose Test Strips
Document ID No. NIB/ BK/GM/01 Effective Date: Page 3 of 29
ABBREVIATIONS USED
ADA American Diabetes Association
ADC(I) Additional Drugs Controller of India
CDSCO Central Drugs Standards Control Organization
CDRH Center for Devices and Radiological Health
CLSI Clinical Laboratory Standards Institute
CMC Comprehensive Maintenance Contract
CV Coefficient of Variation
DCG(I) Drugs Controller General of India
ICMR Indian Council of Medical Research
IPC Indian Pharmacopoeia Commission
ISO International Standards Organization
LL Lower Limit
NIB National Institute of Biologicals
NIST National Institute of Standards and Technology
NPCDCS National Program for Prevention and Control of Cancer, Diabetes,
Cardiovascular Disease and Stroke
QA Quality Assurance
QC Quality Control
SD Standard Deviation
SOP Standard Operating Procedure
SR&RDU Sample Receipt & Report Dispatch Unit
UL Upper Limit
USFDA United States Food and Drugs Administration
WHO World Health Organization
Guidance Manual- Quality Control of Blood Glucose Test Strips
Document ID No. NIB/ BK/GM/01 Effective Date: Page 4 of 29
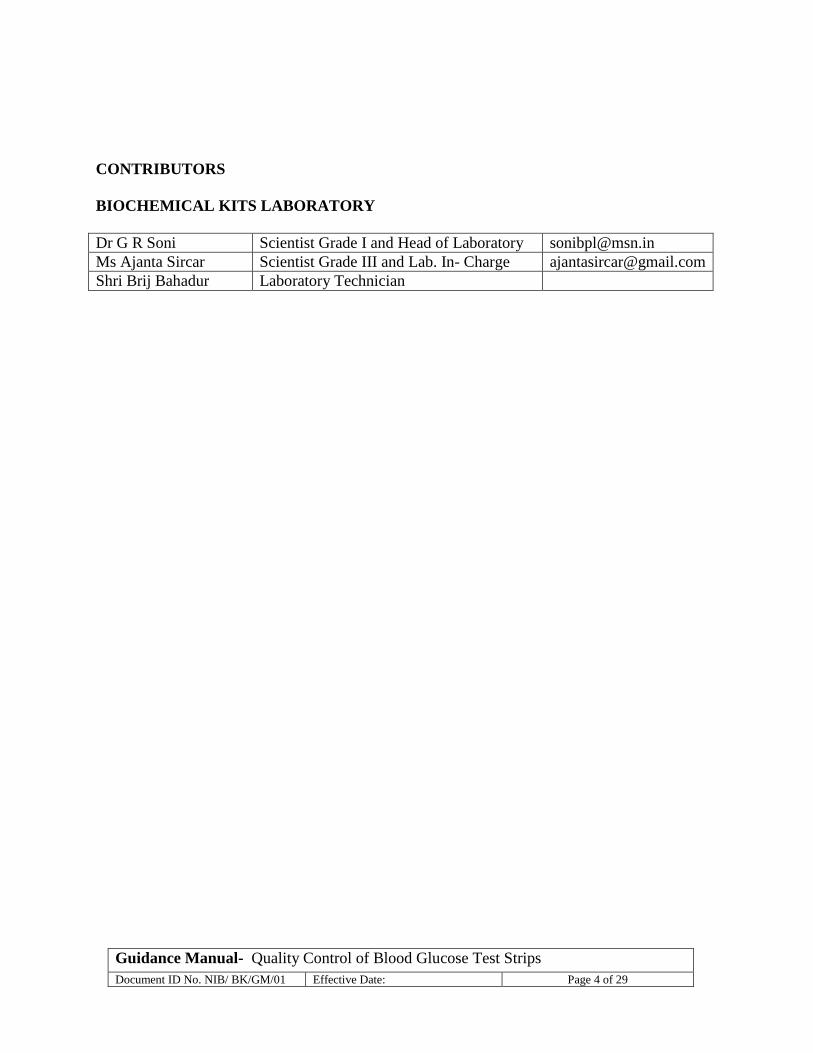
CONTRIBUTORS
BIOCHEMICAL KITS LABORATORY
Dr G R Soni Scientist Grade I and Head of Laboratory [email protected]
Ms Ajanta Sircar Scientist Grade III and Lab. In- Charge [email protected]
Shri Brij Bahadur Laboratory Technician

Guidance Manual- Quality Control of Blood Glucose Test Strips
Document ID No. NIB/ BK/GM/01 Effective Date: Page 5 of 29
ACKNOWLEDGEMENT
On behalf of the members of the Biochemical Kits Laboratory, expression of gratitude is
due to the visionary spirit of the Competent Authority for having taken this path breaking step
towards establishing Quality Control in the area of Biochemical Kits. Appreciation and praises are
also due to the committed efforts of the Biochemical Kits Laboratory team for meticulously
working through this challenge and making it successful. Sincere thanks are due to the Clinical
Laboratories of the neighboring hospitals; Metro Hospital, NOIDA and Pushpanjali Crosslay
Hospital, Vaishali, Ghaziabad, for enthusiastically providing us with leftover clinical samples; a
requirement, without which our project would not have seen the dawn of this day.
The encouragement provided by Dr. Surinder Singh- Director (i/c) to prepare this
document is deeply acknowledged. I hope the Guidance Manual on Quality Control of Blood
Glucose Test Strips will serve as a Reference Document, not only for the prospective
Manufacturer’s of such products but also for the Clinical Laboratories for putting a Quality System
in place.
Dr G R Soni,
Scientist Grade I and Head,
Biochemical Kits Laboratory

Guidance Manual- Quality Control of Blood Glucose Test Strips
Document ID No. NIB/ BK/GM/01 Effective Date: Page 6 of 29
CONTENTS
S No. Topic Page No.
1 Purpose 7
2 Scope 7
3 Introduction 8
4
Sample Receiving-
A. Procedure for Receiving the Sample in the Laboratory
B. Storage before Testing
C. Storage after Testing
D. Criteria for Acceptance of Samples
9- 10
5 Quality Assurance of Blood Glucose Test Strips-
A. Policy on Testing
B. Quality Control Testing
C. Procedure for Intermediate Precision Evaluation
D. Procedure for Repeatability Precision Evaluation
E. Procedure for Accuracy Evaluation
F. Data Analysis for System Accuracy Estimation
G. Data Analysis for Bias Estimation
H. Interpretation of Results
I. Procedure for Reporting
10- 26
6 Annexure A
Check List of Documents
27
7 Annexure B
Quality Control Tests, Acceptance Criteria and Result
28
8 Annexure C
Requirement of Blood Glucose Test Strips for performing the Quality
Control Tests
29
Guidance Manual- Quality Control of Blood Glucose Test Strips
Document ID No. NIB/ BK/GM/01 Effective Date: Page 7 of 29
PURPOSE
The purpose of this guidance manual is to explain to the prospective manufacturers/
importers of Glucometers + Blood glucose test strips in our country; the quality parameters, testing
requirements, and also the procedures adopted for testing the various quality parameters at NIB. It
may also help the institutions or laboratories who are currently engaged in the Government
programs for screening the population for diabetes cases, in understanding and correlating the
quality of these medical devices to their performance. The quality specifications and the maximum
and minimum limits for the ‘Acceptance criteria’ may help the end user to select a relatively better
product from a milieu of similar products. The manual may also serve to sensitize the interested
reader to the concepts of quality control in the area of Biochemical Kits/ Devices; an area which is
new and regarded to be in an evolutionary phase.
SCOPE
This guidance manual provides general information on procedures and practices in the area
of quality control of Clinical chemistry investigations and may be useful to the prospective
manufacturers of related products in developing and administering a QA program. Clinical
Laboratories may also follow these guidelines for standardizing and validating their test
procedures. The methodologies enumerated in this manual are applicable to all the clinical
chemistry investigations though the specifications/ acceptance criteria may vary with the analyte.
However, referring to the specifications/ limits of quality parameters laid out for various analytes
from a registered repertoire that is available in the public domain, the discussed methodologies can
be fruitfully used for any/ all clinical biochemistry investigations.

Guidance Manual- Quality Control of Blood Glucose Test Strips
Document ID No. NIB/ BK/GM/01 Effective Date: Page 8 of 29
INTRODUCTION
National Institute of Biologicals is an autonomous institute under the Ministry of Health &
Family Welfare set up for the quality assessment of biological products are manufactured
indigenously or imported in the country. It works in coordination with the Regulatory Authorities
such as the Drugs Controller General of India DCG (I) and the Indian Pharmacopoeia Commission.
The Biochemical Kits Laboratory was set up in July 2009 keeping in view the need for the
evaluation of the intrinsic quality of Biochemical Kits in terms of accuracy/specificity and of
related devices such as Glucometers in order to establish a system of quality control in this
area. The course envisages bringing about harmonization of clinical laboratory test results in
the country; thus improving the diagnostic accuracy. The process will also help/ guide
manufacturers in judging whether their routine test system is (a) sufficiently specific and
performs accurately enough for its intended application; (b) needs recalibration or (c) needs
general improvement of the intrinsic quality.
Clinical Laboratory Standards Institute (CLSI) guidelines and the International
Standards Organization (ISO) guidelines were referred for development of the experimental
design, data collection and statistical analysis for evaluation of the recommended QC
parameters; precision, accuracy, linearity, and range. The particulars of testing and the
‘Acceptance criteria’ based upon calculation of ‘Allowable Total Error’ limits were presented
before and vetted by an experts group that was represented by members of the CDSCO,
members coordinating the program related to systemic disorders and health care in the ICMR,
members who are experts in the field, members from WHO, IPC and members from the
industry who are engaged in the manufacture/ import and marketing of biochemical Kits and
Devices; during a meeting held at NIB on the 9th of December 2010. The ISO15197 based
modified procedure for evaluating batches of Blood Glucose Test Strips was also presented
during this meeting. The office of the DCG (I) was informed and a request was made for
receiving samples of the said kind. The laboratory has been receiving a steady supply of such
samples for evaluation since then and has evaluated about 87 batches of Blood Glucose Test
Strips/ Kits up till now.

Guidance Manual- Quality Control of Blood Glucose Test Strips
Document ID No. NIB/ BK/GM/01 Effective Date: Page 9 of 29
SAMPLE RECEIVING
Samples of Blood Glucose Test Strips are sent by the various offices of the DCG (I)/
ADC (I)/ Drug Inspectors. They are received by Sample Receipt and Report Dispatch Unit (SR
& RDU) at NIB. The samples are then sent to the Biochemical Kits Laboratory for Quality
Control evaluation.
A. PROCEDURE FOR RECEIVING THE SAMPLE IN THE LABORATORY
1. It is noted whether the cold chain has been maintained wherever it is required for a sample.
2. The samples are physically examined and the following details are documented in the
‘Sample receipt register’ of the laboratory.
Date of receiving in the laboratory
Name /type of the sample
Lot/ Batch No. and expiry of the Blood Glucose Test Strips
Pack size
No. of Test Strips submitted
No. of Glucometers submitted and whether they are in working condition
Sample Received in SR & RDU
Samples forwarded to the laboratory for testing
Testing
Test reports send for approval for On-line
submission of data
Reporting (On-Line generation of Certificate of Analysis CoA)
Approval of the CoA by Competent Authority
Dispatch of Report
T
U
R
N
A
R
O
U
N
D
T
I
M
E
F
O
R
T
E
S
T
I
N
G
Q
U
A
L
I
T
Y
C
O
N
T
R
O
L

Guidance Manual- Quality Control of Blood Glucose Test Strips
Document ID No. NIB/ BK/GM/01 Effective Date: Page 10 of 29
Details of manufacturer’s ‘Controls’ preparation
Whether sample submission complete with respect to requirements for testing
3. Any deficiencies noted regarding ‘sample submission’ is intimated to the SR & RDU with
the request to have the requirement fulfilled so as to enable the laboratory to initiate testing.
B. STORAGE BEFORE TESTING
1. Blood Glucose Test Strips and the Manufacturer’s Control solution received from SR &
RDU are stored at recommended temperature.
2. Only those samples which are under testing/ planned for testing are stored in the
laboratory.
C. STORAGE AFTER TESTING
1. Leftover strips of a batch of Blood Glucose test Strip are stored under stipulated storage
conditions in the ‘Store Room’.
2. Leftover manufacturer’s Controls if any are stored in the designated place in the laboratory.
D. CRITERIA FOR ACCEPTANCE OF SAMPLES
1. Type of Sample: Blood Glucose Test Strips designed for use with specific Glucometers
as a closed system that reports the human blood glucose values in mg/dL units.
2. Condition of Packing: Blood Glucose Test Strips should be packed in properly labeled
sealed containers that give the details of the manufacturer and/ or the importer and the
Range of values reported by the strips for the ‘Normal (Level I)’ and the ‘Pathological
(Level II)’ Control preparations.
3. Number of Samples Essential: 2400 Test Strips (1200 for the Laboratory and 1200 as
retained samples with the Sample Receipt unit) for testing one Batch by the Laboratory
4. Accessories Required: 10 Glucometers designated for use with the Blood Glucose Test
Strips as a closed system.
5. 3ml each of the manufacturer’s Normal/ Level I and Pathological/ Level II Glucose
control Solution for testing one batch of Blood Glucose Test Strips.
6. Documents Required: Documents to be submitted as per check list at Annexure-A.
QUALITY ASSURANCE OF BLOOD GLUCOSE TEST STRIPS
A. POLICY ON TESTING
1. 1200 Blood Glucose test strips shall be used by the laboratory for the testing of various
parameters (details as per Annexure C).
2. 1200 Blood Glucose test strips shall be kept by the Sample Receipt Unit as retained
sample.

Guidance Manual- Quality Control of Blood Glucose Test Strips
Document ID No. NIB/ BK/GM/01 Effective Date: Page 11 of 29
B. QUALITY CONTROL TESTING
1. Quality Control evaluation shall be based upon testing of various parameters, their
acceptance criteria and interpretation is as mentioned in Annexure- B.
2. Validation of Tests: Records of validation of individual tests shall be maintained in the
laboratory.
3. Calibration of Equipment: Calibrated pipettes and Weighing Balance shall be used.
Other equipments as the Biochemical Analyzer, Biosafety cabinet, Walk-in cold room
shall be maintained at their optimum functional status through CMC with respective
manufacturer.
4. Verification of Reports and Signature: The worksheets shall be verified by Lab. in-
charge (Supervisor). Test report of each parameter shall be signed by the Analyst and
the Head of the Laboratory.
5. Presentation of Results: The Certificate of Analysis shall mention the values obtained
for each test parameter and depending whether they meet with the respective
‘acceptance criteria’, the results shall be designated as ‘Complies’ or ‘Does not
Comply’.
6. Approval of the Certificate of Analysis: Certificate of Analysis shall be signed by
Analyst and the Head of Division. Approval of the same shall be done by the Director,
NIB.
7. Turn around Time for testing a batch of Blood Glucose Test Strips shall be 20 working
days from the date of receipt of sample in the laboratory.
8. Retention of samples and Report: 1200 strips will be retained by the Sample Receipt
department as retained sample. One copy of Test Report will be retained by Sample
Receipt and Dispatch Unit in archives.
9. Administrative Review: The Reports shall be submitted for Administrative Review as
per SOP of QA department.
10. Disposal of Samples and retention of Reports: Samples shall be retained under specified
condition by the Sample Receipt and Dispatch Unit up to one year after the date of
expiry after which they will be disposed as per the procedures of the ‘Waste Disposal
Committee’. Reports/ documents shall be retained in Archives as per SOP of QA
department.
C. PROCEDURE FOR INTERMEDIATE PRECISION EVALUATION
1. The manufacturer’s instructions are read for using the Glucometer Strip together with
its specific glucometer.
2. The range of the values for the normal and the pathological Control solutions provided
by the manufacturer together with the Lot# and the Expiry date for each preparation is
noted together with the details of the Glucometer Strip Lot# and Expiry date and the
Device Serial Nos. on the Data recording format.
3. The Control Solutions are loaded on the ‘Glucometer strip + glucometer’ test system to
see whether it reproduces a value that is within the range claimed by the manufacturer
for each of the Control preparations.

Guidance Manual- Quality Control of Blood Glucose Test Strips
Document ID No. NIB/ BK/GM/01 Effective Date: Page 12 of 29
4. If values obtained found to be within range, then using 10 glucometers and a Control
preparation, the values of each Control preparation are recorded in replicates of 10 each
day; for a period of 10 days.
5. The values obtained each day with each Control preparations are recorded in respective
Data recording formats as follows.
NATIONAL INSTITUTE OF BIOLOGICALS, NOIDA
BIOCHEMICAL KITS LABORATORY
INTERMEDIATE PRECISION EVALUATION EXPERIMENT DATA GLUCOMETER STRIP DETAILS: …name of strip..., Lot#......, Expiry:…….. PERIOD OF TESTING: ………………… CONTROL SOLUTION USED: …name of Normal Control Solution…., Lot#.........., Expiry, ……. GLUCOSE CONCENTRATION: INTERVAL (….to….mg/dL)
Sno.
Name and
Device Serial No.
READINGS
DAY1 DAY2 DAY3 DAY4 DAY5 DAY6 DAY7 DAY8 DAY9 DAY10 1
2
3
4
5
6
7
8
9
10
Test Done by: Verified by
Approved by:……………………………. Head, BK Laboratory
NATIONAL INSTITUTE OF BIOLOGICALS, NOIDA
BIOCHEMICAL KITS LABORATORY
INTERMEDIATE PRECISION EVALUATION EXPERIMENT DATA
GLUCOMETER STRIP DETAILS: …name of strip..., Lot#......, Expiry:…….. PERIOD OF TESTING: ………………… CONTROL SOLUTION USED: …name of Pathological Control Solution…., Lot#.........., Expiry, ……. GLUCOSE CONCENTRATION: INTERVAL (….to….mg/dL)
Sno.
Name and
Device Serial No.
READINGS
DAY1 DAY2 DAY3 DAY4 DAY5 DAY6 DAY7 DAY8 DAY9 DAY10 1
2
3
4
5
6
7
8
9
10
Test Done by: Verified by:…………………………….. Approved by:……………………………. Head, BK Laboratory

Guidance Manual- Quality Control of Blood Glucose Test Strips
Document ID No. NIB/ BK/GM/01 Effective Date: Page 13 of 29
6. At the end of 10 days, the mean value, standard deviation and coefficient of variation for
each meter is calculated from the ten measurements.
7. The grand mean, the pooled standard deviation and the pooled CV is calculated.
8. Interpretation of Result
The % Coefficient of Variation (%CV) is calculated using the following equation-
%CV = pooled SD
___________________________________ X 100
Grand mean of value for each control material
The %CV is a measure of Imprecision of ‘Glucometer strip + Glucometer’ test
system at that particular concentration of the analyte Glucose.
To qualify for intended use, the value of %CV obtained is required to fall between
< 3.0-7.1 which is the limit prescribed in WHO: Laboratory Diagnosis and
Monitoring of Diabetes Mellitus, 2002.
REFERENCES
1. International Standards ISO; 15197: In vitro diagnostic test systems- Requirements for blood- glucose
monitoring systems for self- testing in managing diabetes mellitus.
2. Manufacturer’s instructions for use of Glucometer+ Strip together with the Control Preparations as
applicable.
D PROCEDURE FOR REPEATABILITY PRECISION EVALUATION
1. Sample used is human venous blood samples collected in tubes containing anticoagulant
and preservative (fluoride) and hematocrit adjusted to 36% (700µl plasma + 400µl of
packed cells).
2. At least 1ml volume of three such samples, each having glucose concentrations falling
between 51- 110mg/dL, 111- 150mg/dL and 151- 250mg/dL respectively is used.
3. The manufacturer’s instructions are read for using the Glucometer Strip together with its
specific glucometer.
4. At a time only one sample is used. The sample loaded on a ‘Glucometer strip +
glucometer’ test system and the reading noted down. This is repeated with 9 other
meters.
5. The step at 4 is repeated nine more times to collect the set of 100 observations per
sample
6. The values for each sample are recorded in respective Data recording formats as follows.

Guidance Manual- Quality Control of Blood Glucose Test Strips
Document ID No. NIB/ BK/GM/01 Effective Date: Page 14 of 29
NATIONAL INSTITUTE OF BIOLOGICALS, NOIDA BIOCHEMICAL KITS LABORATORY
REPEATABILITY EVALUATION EXPERIMENT DATA
GLUCOMETER STRIP DETAILS: …name of strip..., Lot#......, Expiry:…….. DATE OF TESTING :…………… SAMPLE DETAILS: Human venous blood sample GLUCOSE CONCENTRATION: INTERVAL II (51- 110mg/dL)
S.no. Name and Device
Serial No.
READINGS
1 2 3 4 5 6 7 8 9 10
1
2
3
4
5
6
7
8
9
10
Test Done by: Verified by:……………(Analyst) Signature: Approved by:…………(Head, BK Laboratory)
NATIONAL INSTITUTE OF BIOLOGICALS, NOIDA
BIOCHEMICAL KITS LABORATORY
REPEATABILITY EVALUATION EXPERIMENT DATA
GLUCOMETER STRIP DETAILS: …name of strip..., Lot#......, Expiry:…….. DATE OF TESTING :…………… SAMPLE DETAILS: Human venous blood sample GLUCOSE CONCENTRATION: INTERVAL II (111- 150mg/dL)
S.no. Name and Device
Serial No.
READINGS
1 2 3 4 5 6 7 8 9 10 1
2
3
4
5
6
7
8
9
10
Test Done by: Verified by:……………(Analyst)
Signature: Approved by:…………(Head, BK aboratory)
NATIONAL INSTITUTE OF BIOLOGICALS, NOIDA
BIOCHEMICAL KITS LABORATORY
REPEATABILITY EVALUATION EXPERIMENT DATA
GLUCOMETER STRIP DETAILS: …name of strip..., Lot#......, Expiry:…….. DATE OF TESTING :…………… SAMPLE DETAILS: Human venous blood sample GLUCOSE CONCENTRATION: INTERVAL II (151- 250mg/dL)
S.no. Name and Device
Serial No.
READINGS
1 2 3 4 5 6 7 8 9 10 1
2
3
4
5
6
7
8
9
10
Test Done by: Verified by:……………(Analyst)
Signature: Approved by:…………(Head, BKLab)

Guidance Manual- Quality Control of Blood Glucose Test Strips
Document ID No. NIB/ BK/GM/01 Effective Date: Page 15 of 29
7. For the set of 100 values obtained for each sample, the mean value, standard deviation
and coefficient of variation for each meter is calculated from the ten measurements.
8. The grand mean, the pooled standard deviation and the pooled %CV calculated.
9. Interpretation of Result
The % Coefficient of Variation (%CV) calculated using the following equation-
%CV = pooled SD
___________________________________ X 100
Grand mean of value for each sample
The %CV is a measure of Repeatability of ‘Glucometer strip + Glucometer’ test
system at that particular concentration of the analyte Glucose.
10. To qualify for intended use, the value of %CV obtained is required to fall between <
3.0-7.1 which is the limit prescribed in WHO: Laboratory Diagnosis and Monitoring of
Diabetes Mellitus, 2002.
REFERENCES 1. International Standards ISO; 15197: In vitro diagnostic test systems- Requirements for blood- glucose
monitoring systems for self- testing in managing diabetes mellitus.
2. Manufacturer’s instructions for use of Glucometer+ Strip together with the Control Preparations as
applicable.
E PROCEDURE FOR ACCURACY EVALUATION
Principle
Individual glucose measurements in human blood samples by the blood glucose
monitoring system (Glucose test strips + Glucometer) are collected within two hours of
analysis of the same set of samples using the laboratory Reference method. Following
the fulfillment of the basic requirement i.e.; the laboratory Reference method is in
proper quality control throughout the evaluation period, data generated using both the
blood glucose monitoring system and the laboratory Reference methods for a set of
samples covering the required range of analyte- glucose concentrations is statistically
analyzed to compute the bias/ expected difference between two methods at the ‘clinical
decision level’ of 100mg/dL for analyte glucose. The data is also analyzed to compute
the system accuracy findings as per the method and criteria specified in the ISO
guideline 15197.
1. Leftover human venous blood samples containing anticoagulant and preservative
(fluoride) are used and the hematocrit is adjusted to suit the requirements of the
Glucometer.
2. 150 samples collected to suffice the numbers in the recommended ‘Range’ of glucose
concentration as per table below

Guidance Manual- Quality Control of Blood Glucose Test Strips
Document ID No. NIB/ BK/GM/01 Effective Date: Page 16 of 29
3. Table : Glucose concentrations of samples for system accuracy evaluation
Percentage of
samples (%)
Glucose concentration (mg/dL)
5 <50
15 50 to 80
20 80 to 120
30 120 to 200
15 201 to 300
10 301 to 400
5 > 400
4. 20 human venous samples are analyzed on the Laboratory Reference method (Analyzer
based Method).
5. The manufacturer’s instructions are read and followed for using the glucose test strips
with the specific Glucometer for estimation of glucose in the samples.
6. Within two hours of estimation using the Reference method, the same samples are
analyzed on the glucose test strips + Glucometer test system, in duplicate, after
reconstitution as per step 1.
7. The values are recorded in the data recording sheets as below:
NATIONAL INSTITUTE OF BIOLOGICALS, NOIDA
BIOCHEMICAL KITS LABORATORY
SYSTEM ACCURACY EVALUATION EXPERIMENT DATA
PERIOD/ DATE OF TESTING:
GLUCOMETER STRIP DETAILS
Sno. Sample Code
Glm
tr/S
no.
Glm
tr/S
no.
Glm
tr/S
no.
Glm
tr/S
no.
Glm
tr/S
no.
Glm
tr/S
no.
Glm
tr/S
no.
Result 1
Result 2
Result 1
Result 2
Result 1
Result 2
Result 1
Result 2
Result 1
Result 2
Result 1
Result 2
Result 1
Result 2
1
2
3
8. In this way approximately 150 samples are analyzed over 7-8 working days.
F DATA ANALYSIS FOR SYSTEM ACCURACY ESTIMATION
1. The samples are categorized into two groups viz., <75mg/dL and >75mg/dL with
respect to their values obtained from the laboratory reference method.
2. The values obtained using the laboratory Reference method and the Blood glucose
monitoring system (Glucometer+Strips) for these two categories of samples are
tabulated and analyzed separately as shown in table below.

Guidance Manual- Quality Control of Blood Glucose Test Strips
Document ID No. NIB/ BK/GM/01 Effective Date: Page 17 of 29
SYSTEM ACCURACY EVALUATION EXPERIMENT DATA TABULATION FOR SAMPLES WITH>80mg% GLUCOSE
Sno. Code Glmtr
Result1 Glmtr
Result2 analyzr Result1
analyzr Result2
Diff Y-X (mg%)
Diff Y-X (mg%)
5% analyzr
Val
5% analyzr
Val
10% analyzr
Val
10% analyzr
Val
15% analyzr
Val
15% analyzr
Val
20% analyzr
Val
20% analyzr
Val
1 G129 134 133 139.7 141.6 -5.7 -8.6 6.985 7.08 13.97 14.16 20.96 21.24 27.94 28.32
2 G129 129 134 132.4 132.9 -3.4 1.1 6.62 6.645 13.24 13.29 19.86 19.94 26.48 26.58
3 G129 92 91 86.2 85.2 5.8 5.8 4.31 4.26 8.62 8.52 12.93 12.78 17.24 17.04
SYSTEM ACCURACY EVALUATION EXPERIMENT DATA TABULATION FOR SAMPLES WITH
< 80mg% GLUCOSE CONCENTRATION
Sno. Code Glmtr
Result1 Glmtr
Result2 analyzr Result1
analyzr Result2
minus 5mg
analyzr val
minus 5mg
analyzr val
plus 5mg
analyzr val
plus 5mg
analyzr Val
minus 10mg
analyzr val
minus 10mg
analyzr val
plus 10mg Anlzr Val
plus 10mg Anlzr Val
minus 15mg
analyzr val
minus 15mg
analyzr val
plus 15mg
analyzr val
plus 15mg
analyzr val
1
G139 87 88 78.1 77.4 73.1 72.4 83.1 82.4 68.1 67.4 88.1 87.4 63.1 62.4 93.1 92.4
2
G144 69 69 78.2 76.3 73.2 71.3 83.2 81.3 68.2 66.3 88.2 86.3 63.2 61.3 93.2 91.3
3
G146 46 47 48.7 48.2 43.7 43.2 53.7 53.2 38.7 38.2 58.7 58.2 33.7 33.2 63.7 63.2
4 G146 14 17 10.6 10.7 5.6 5.7 15.6 15.7 0.6 0.7 20.6 20.7 -4.4 -4.3 25.6 25.7
3. In the > 75mg/dL category, the number of results which show a difference of < 5%,
<10%, <15% and <20% from the Reference method values are counted separately.
4. In the < 75mg/dL category, the number of results which show a difference of < 5
mg/dL <10 mg/dL , and <15 mg/dL from the Reference method values are counted
separately.
5. The percentage of results that fall in the group ‘within 20% of the reference method
value’ for samples in the >80mg/dL category is calculated.
6. The percentage of results that fall in the group ‘within 15mg/dL of the reference
method value’ for samples in the <80mg/dL category calculated.
G DATA ANALYSIS FOR BIAS ESTIMATION
1. The Reference Method is designated - (X) and the Test Method (Blood Glucose
Monitoring System) - (Y), and the data is tabulated as shown in the table below and the
mean is compute at the bottom of each column.
Sno. Sample ID
Test Method(Y) Ref. Method(X)
Mean(Y) Mean(X)
Test(Y) Ref.(X)
Rep1 Rep2 Rep1 Rep2
Rep1-
Rep2
[DYi]
Rep1-
Rep2
[DXi]
1 G1 114.2 114 117.6 125.2 114.1 121.4 0.2 -7.6
2 G2 107.1 108.5 111.2 111.8 107.8 111.5 -1.4 -0.6
3 G3 145.8 146.8 153.5 154.7 146.3 154.1 -1 -1.2
Mean Mean Mean(DY) Mean(DX)

Guidance Manual- Quality Control of Blood Glucose Test Strips
Document ID No. NIB/ BK/GM/01 Effective Date: Page 18 of 29
2. For detecting outliers the mean DX and DY values are multiplied by 4 (Range). Any
data point whose individual DXi or DYi value is more than this value is eliminated.
3. Further analysis is continued by extending the computation of data as per the following
table:
MeanY-
MeanX
Aver of
MeanX&Y DXi' DYi' Ei1 Ei2 Ei1' Ei2'
Ei1'plus
Ei2' -7.3 117.75 -0.0626 0.001753 -3.4 -11.2 -0.02891 -0.08946 -0.11837
-3.7 109.65 -0.00538 -0.01299 -4.1 -3.3 -0.03687 -0.02952 -0.06639
-4.75 126.175 0.010113 0 -5.4 -4.1 -0.0418 -0.03206 -0.07385
-7.3 117.75 -0.0626 0.001753 -3.4 -11.2 -0.02891 -0.08946 -0.11837
Mean Mean Sum/2N
Where,
DXi’ and DYi’ are relative absolute difference of methods obtained by dividing the
Difference by the Mean;
Ei1 & Ei2 are absolute difference between methods obtained from the difference
between
rep1 of X&Y, rep2 of X&Y and
Ei1’ & Ei2’ are relative absolute difference between methods obtained by dividing Ei1
by the value of rep1 of X and Ei2 by the value of rep2 of X .
4. More outliers are detected by multiplying the mean DX' and DY' values obtained by 4
(Relative Range). Any data point whose individual DXi' or DYi' value is more than this
value is eliminated.
5. Further analysis is continued by extending the computation of data as per the following
table:
Ei1plus
Ei2
Xij-
meanX
Yij-
meanY
square of
Xij-
meanX
square of
Yij-
meanY
(Xij-
meanX)
(Yij-
meanY) Yij Xij b into Xij
-14.6 -22.09 -22.29 487.9681 496.8441 492.3861 114.2 117.6 118.3056
-7.4 -28.49 -29.39 811.6801 863.7721 837.3211 107.1 111.2 111.8672
-9.5 -10.49 -12.69 110.0401 161.0361 133.1181 123.8 129.2 129.9752
Sum/2N Sum (1) Sum(2) Sum (3)
6. The sums of Ei1' plus Ei2' and Ei1plus Ei2 are divided by 2N respectively and
multiplied by 4 to get the test limits (TL). Any data point whose individual Ei1' plus
Ei2' or Ei1plus Ei2 exceed these limits is eliminate.
7. Only 2.5% of the data is principally eliminated as outliers. If more data qualifies for
elimination then the complete data set is rejected and a new set of data is generated.
8. Adequate range of X is calculated by the formula-
correlation coefficient r, = ___(3)_____
√ (1) X √ (2)
For acceptability r should be > 0.975
9. The data is further analyzed to calculate the ‘Predicted value’, ‘Residual’ and the
‘Squared Residual’ as follows:

Guidance Manual- Quality Control of Blood Glucose Test Strips
Document ID No. NIB/ BK/GM/01 Effective Date: Page 19 of 29
Predicted value Residual
Squared
Residual
114.1876 0.0124 0.000154
107.7492 -0.6492 0.421461
125.8572 -2.0572 4.232072
Sum (4)
10. Slope b is calculated = (3)
(1)
b should be ~ 1 for linear relationship
Intercept a is calculated as-
a = mean y – b * mean x
Where, y = overall mean of method Y and x = overall mean of method X
Predicted value Ŷ is obtained by, a + b * xij
Residual is obtained by subtracting the predicted value from yij
11. The Standard error of estimate calculated as below-
Standard error of estimate (Sy.x) = √ (4)
2N-2
12. The estimate of predicted bias, Bc at a given Medical Decision level, Xc (100 for analyte
Glucose) is calculated as-
Bc = a + b. Xc
13. The 95% confidence interval for true bias is calculated as-
Bc (at Xc) = Bc + 2Sy.x √ 1 + (Xc-mean x)2
√ 2N (1)
H INTERPRETATION OF RESULT
For System Accuracy
System Accuracy requirement: 95% of the individual Glucometer results shall fall
within + 15mg/dL of the results of the ‘Reference Method’ at glucose concentrations
<75mg/dL and within +20% at glucose concentrations >75mg/dL (ISO guideline
15197)
For Bias
Maximum allowable deviation should be less than 15% (Who: Laboratory Diagnosis
and Monitoring of Diabetes Mellitus, 2002)
REFERENCES
1. International Standards ISO; 15197: In vitro diagnostic test systems- Requirements for blood- glucose
monitoring systems for self- testing in managing diabetes mellitus.
2. Clinical Laboratory Standards Institute; EP9-A2, Vol. 22, No. 19: Method comparison and Bias
estimation using patient samples; Approved Guidelines – Second Edition. 3. Manufacturer’s instructions for using the Glucometer Strips and the Laboratory Reference Method.

Guidance Manual- Quality Control of Blood Glucose Test Strips
Document ID No. NIB/ BK/GM/01 Effective Date: Page 20 of 29
I PROCEDURE FOR REPORTING
1. The results of Precision parameters for the Glucose Test Strips sample is reported in the
following format:
NATIONAL INSTITUTE OF BIOLOGICALS
(BIOCHEMICAL KITS LABORATORY)
REPORT FOR PRECISION PERFORMANCE EVALUATION
Title: Evaluation of Precision of Glucometer Strips
Proforma No.: PRO/GLMTRSTRP/PREC Page 1 of 1
Revision No.: 0 Department: Biochemical Kits Laboratory
Reference
Name of the Product ------------------------ NA
Lot No. Lot#-------------- NA
Expiry --------------- NA
Period of Testing:
Repeatability
Intermediate Precision
From -------------- to------------
From--------------- to ------------
NA
Details of Controls used Repeatability: Human venous blood samples
Intermediate Precision: Manufacturer’s Control Solution, Lot#---------, Expiry, -------------
NA
Experimental design (Intermediate
Precision) Normal Control and Pathological Control preparations (supplied
by the manufacturer/ in-house) tested in replicates of 10 using 10
Glucometer Devices+ strips over 10 days.
Statistical analysis of data to compute ‘Precision Standard Deviation’ and % Coefficient of Variation (CV).
ISO15197
Experimental design (Repeatability)
Human venous samples with Glucose concentrations falling in the concentration intervals- 51- 100mg/dL, 111- 150mg/dL, 151-
250mg/dL tested in replicates of 10 using each of the 10 Glucometer Devices+ strips
Statistical analysis of data to compute ‘Precision Standard
Deviation’ and % Coefficient of Variation (CV).
ISO15197
Criteria for acceptance Value of %CV obtained between < 3.0-7.1 WHO: Laboratory
Diagnosis and Monitoring
of Diabetes Mellitus, 2002
% CV obtained for
Intermediate Precision at
Low concentration - --------
Pathological concentration - ---------
‘Annexure’
Pg (---to---)
% CV obtained for
Repeatability at Glucose
conc.
51- 100mg/dL - --------
111- 150mg/dL - --------
151- 250mg/dL - -------
‘Annexure’
Pg(--- to---)
Test done by:…………………………….. Verified by……………………….
(Name & Signature) (Signature)
Approved by…………………………..
(Signature)

Guidance Manual- Quality Control of Blood Glucose Test Strips
Document ID No. NIB/ BK/GM/01 Effective Date: Page 21 of 29
2. The daily Quality Control Chart during the period of testing for the laboratory
‘Reference Method’ at both the Normal and the Pathological Control Levels is
documented in the following format-
A. Monthly QC Chart for Reference Method at Normal Control Level
Glucose Reagent name….. Lot#/ Expiry……
Name of the Control Preparation…………………, Lot#/ Expiry…………….
Period of Testing…………………..
Test done by:…………………………….. Verified by……………………….
(Name & Signature) (Signature)
Approved by…………………………..
(Signature)

Guidance Manual- Quality Control of Blood Glucose Test Strips
Document ID No. NIB/ BK/GM/01 Effective Date: Page 22 of 29
B. Monthly QC Chart for Reference Method at Pathological Control Level
Glucose Reagent name….. Lot#/ Expiry……
Name of the Control Preparation…………………, Lot#/ Expiry…………….
Period of Testing…………………..
Test done by:…………………………….. Verified by……………………….
(Name & Signature) (Signature)
Approved by…………………………..
(Signature)

Guidance Manual- Quality Control of Blood Glucose Test Strips
Document ID No. NIB/ BK/GM/01 Effective Date: Page 23 of 29
3. The Linearity and Range for the laboratory reference method obtained using the
International Reference Preparation’ NIST 917c is documented in the following format:
Test done by:…………………………….. Verified by……………………….
(Name & Signature) (Signature)
Approved by…………………………..
(Signature)
4. Reference Method ‘Process In- control’ during the ‘Period of Testing’ at normal and
pathological glucose concentration levels is documented by the ‘Data Analysis Sheets’
for precision estimates of the reference method at these ‘Control Levels’.
Linearity (Range) Plot of …name… (Reference Method/Glucose -------- sample)
0
0.2
0.4
0.6
0.8
1
1.2
1.4
0 50 100 150 200 250 300 350 400 450 Concentration of D-Glucose (NIST917c) in mg/dL
Absorban
ce
Guidance Manual- Quality Control of Blood Glucose Test Strips
Document ID No. NIB/ BK/GM/01 Effective Date: Page 24 of 29
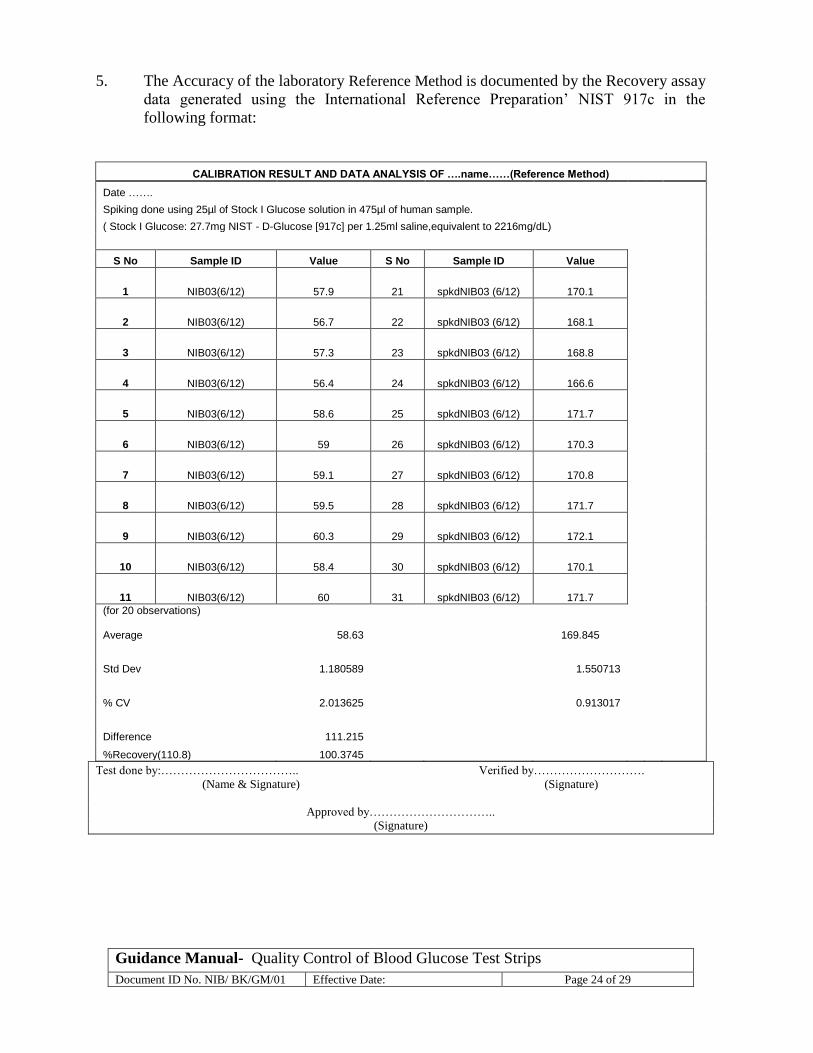
5. The Accuracy of the laboratory Reference Method is documented by the Recovery assay
data generated using the International Reference Preparation’ NIST 917c in the
following format:
CALIBRATION RESULT AND DATA ANALYSIS OF ….name……(Reference Method)
Date …….
Spiking done using 25µl of Stock I Glucose solution in 475µl of human sample.
( Stock I Glucose: 27.7mg NIST - D-Glucose [917c] per 1.25ml saline,equivalent to 2216mg/dL)
S No Sample ID Value S No Sample ID Value
1 NIB03(6/12) 57.9 21 spkdNIB03 (6/12) 170.1
2 NIB03(6/12) 56.7 22 spkdNIB03 (6/12) 168.1
3 NIB03(6/12) 57.3 23 spkdNIB03 (6/12) 168.8
4 NIB03(6/12) 56.4 24 spkdNIB03 (6/12) 166.6
5 NIB03(6/12) 58.6 25 spkdNIB03 (6/12) 171.7
6 NIB03(6/12) 59 26 spkdNIB03 (6/12) 170.3
7 NIB03(6/12) 59.1 27 spkdNIB03 (6/12) 170.8
8 NIB03(6/12) 59.5 28 spkdNIB03 (6/12) 171.7
9 NIB03(6/12) 60.3 29 spkdNIB03 (6/12) 172.1
10 NIB03(6/12) 58.4 30 spkdNIB03 (6/12) 170.1
11 NIB03(6/12) 60 31 spkdNIB03 (6/12) 171.7
(for 20 observations) Average 58.63 169.845
Std Dev 1.180589 1.550713
% CV 2.013625 0.913017
Difference 111.215
%Recovery(110.8) 100.3745
Test done by:…………………………….. Verified by……………………….
(Name & Signature) (Signature)
Approved by…………………………..
(Signature)

Guidance Manual- Quality Control of Blood Glucose Test Strips
Document ID No. NIB/ BK/GM/01 Effective Date: Page 25 of 29
6. The results of Bias estimation experiment for the Glucose Test Strip sample is reported
in the following format-
NATIONAL INSTITUTE OF BIOLOGICALS
(BIOCHEMICAL KITS LABORATORY)
REPORT FOR ESTIMATION OF BIAS
Title: Bias estimation of Glucometer Strips
Proforma No.: PRO/ GLMTRSTRP /BIAS Page 1 of 1
Revision No.: 0 Department: Biochemical Kits Laboratory
Reference
Name of the Product ------------------- NA
Lot No. Lot#---------------- NA
Expiry -------------------- NA
Period of Testing --------------- TO ----------------- NA
Reference Method Erba System Pack Glucose,
Lot No.:-----------------, Expry: --------------
NA
Details of Equipment used Erba XL300, Sr. No. 30153 NA
Reference method performance characteristics
Daily QC plot for the normal and pathological control preparations are within limits of + 1SD
Precision
%CV at normal concentration= --------- %CV at pathological concentration=----------
Accuracy
% Recovery of NIST917c= --------------
Linearity & Range= Linear (between ---------to---------mg/dL)
‘Annexure’ Pgs (--- to---)
Details of clinical samples used Human venous Blood Samples (IDs as shown in column ‘Code’ of Data sheets ) NA
Experimental design At least 150 patient samples covering the entire physiologic range, tested in duplicate using 2 Glucometer Devices+ strips and the ‘Reference method’ through
at least 5 working days.
The difference between individual results from the Glucometers and the mean
of the reference values is calculated and the magnitude of the difference analysed as per system accuracy requirement.
Statistical analysis of data to compute ‘True Bias’ at the Clinical decision level and ‘% Inaccuracy’ at 95% confidence interval
ISO15197
ISO15197
CLSI EP9-A2
Criteria for acceptance System Accuracy requirement: 95% of the individual Glucometer results shall fall within + 15mg/dL of the results of the ‘Reference Method’ at glucose
concentrations <75mg/dL and within +20% at glucose concentrations >75mg/dL
Maximum allowable deviation should be less than 15%
ISO15197
Who:
Laboratory
Diagnosis and Monitoring of
Diabetes
Mellitus, 2002
System Accuracy Results
obtained --------% of individual glucometer results are within +15mg/dL of the results
of the ‘Reference Method’ at glucose concentrations <75mg/dL
---------% of individual glucometer results are within +20% of the results of the ‘Reference Method’ at glucose concentrations >75mg/dL
Annexure
Pgs(--- to---)
% Inaccuracy obtained
------% (Lower limit at 95% confidence interval) ‘Annexure’ Pgs (---to---) ------% (Upper limit at 95% confidence interval )
Test done by:…………………………….. Verified
by……………………….
(Name & Signature) (Signature) Approved by…………………………..
(Signature)

Guidance Manual- Quality Control of Blood Glucose Test Strips
Document ID No. NIB/ BK/GM/01 Effective Date: Page 26 of 29
7. The final report for onward transmission is submitted in the following format-
File No.: N.9----/2011-SRRD/BCL
NATIONAL INSTITUTE OF BIOLOGICALS, NOIDA BIOCHEMICAL KITS LABORATORY
CERTIFICATE OF ANALYSIS
Dated the -----------
Analytical Report No. : NIB/BK/2011/REP/ GLMTR-STRP/---
Name of Product and dosage Form : ------------- Test Strips , (2X25 Strips per pack)
Lot No. : Lot#-------------- Expiry Date : Expiry:-----------
Name of the Manufacturer : M/s--------------------------
Importer : M/s --------------------------.
S.No Test Specifications/ limits Results
1 PRECISION
EVALUATION
Value of %CV obtained between
< 3.0-7.1
(WHO: Laboratory Diagnosis and Monitoring of Diabetes Mellitus, 2002)
Intermediate precision –
%CV= ------- (with Low Control)
%CV= ------- (with Pathological/ High Control) Repeatability –
%CV= ---- (at 51-100mg/dL glucose)
%CV= ---- (at 111-150mg/dL glucose) %CV= ---- (at 151-250mg/dL glucose)
2 SYSTEM
ACCURACY AND BIAS
EVALUATION
System Accuracy requirement: 95% of the individual
Glucometer results shall fall within
+15mg/dL of the results of the ‘Reference method’ at glucose
concentrations <75mg/dL and within
+20% at glucose concentrations >75mg/dL (ISO15197)
Maximum allowable deviation should be < 15% (WHO: Laboratory Diagnosis and Monitoring
of Diabetes Mellitus, 2002)
-----% of individual glucometer results are within +15mg/dL of the results of the ‘Reference Method’ at
glucose concentrations <75mg/dL
-----% of individual glucometer results are within +20% of the results of the ‘Reference Method’ at glucose concentrations >75mg/dL
% Inaccuracy obtained –
-----% (LL at 95% confidence interval)
-----% (UL at 95% confidence interval )
CONCLUSION: Based upon the findings of the test parameters, the above mentioned product complies/ does not comply to the requirements as mentioned in the guidelines; ISO15197 and WHO: Laboratory Diagnosis and Monitoring of Diabetes Mellitus, 2002 and its performance
with respect to Precision and System Accuracy and Bias is acceptable/ not acceptable.
Signature of the Analyst Signature……………… Scientist- III Head, Biochemical Kits Lab
Date: ----------- Date: -----------

Guidance Manual- Quality Control of Blood Glucose Test Strips
Document ID No. NIB/ BK/GM/01 Effective Date: Page 27 of 29
ANNEXURE A
CHECK LIST OF DOCUMENTS
Documents required to be submitted along with batch of sample for Quality Control
evaluation-
1. Forwarding letter from the Authorized official(s) of CDSCO/ Zonal, Sub zonal and
Port offices etc.
2. Quality Control Protocols specific for the product.
3. Batch specific Certificate of Analysis and Quality Control Test Results.
4. Batch Release Certificate from the country of origin of product.
5. Copy of Import License/ test license/ manufacturing license issued by the DCG (I)
/ Drug Licensing Authority.

Guidance Manual- Quality Control of Blood Glucose Test Strips
Document ID No. NIB/ BK/GM/01 Effective Date: Page 28 of 29
ANNEXURE B
QUALITY CONTROL TESTS, ACCEPTANCE CRITERIA AND RESULT
S No. Test(s) conducted Acceptance criteria Results
1. Intermediate Precision Normal Control and Pathological Control
preparations (supplied by the
manufacturer) tested in replicates of 10
using 10 Glucometer Devices and the
Blood Glucose Strip sample over 10 days.
Statistical analysis of data to compute
‘Precision Standard Deviation’ and %
Coefficient of Variation (CV).
Value of %CV obtained
should be < 3.0-7.1
Complies
2. Repeatability Human venous samples with Glucose
concentrations falling in the concentration
intervals- 51- 100mg/dL, 111- 150mg/dL,
151- 250mg/dL tested in replicates of 10
using each of the 10 Glucometer Devices
and the Blood Glucose Strip sample.
Statistical analysis of data to compute
‘Precision Standard Deviation’ and %
Coefficient of Variation (CV).
Value of %CV obtained
should be < 3.0-7.1
Complies
3. System Accuracy At least 150 patient samples covering the
entire physiologic range, tested in duplicate
using 2 Glucometer Devices + the blood
glucose test strip sample and the ‘Reference
method’ through at least 5 working days.
The difference between individual results
from the Glucometers and the mean of the
reference values is calculated and the
magnitude of the difference analyzed as per
system accuracy requirement. Statistical
analysis of data to compute ‘True Bias’ at
the Clinical decision level and ‘%
Inaccuracy’ at 95% confidence interval.
System Accuracy
requirement: 95% of the
individual Glucometer results
shall fall within + 15mg/dL of
the results of the ‘Reference
Method’ at glucose
concentrations <75mg/dL and
within +20% at glucose
concentrations >75mg/dL.
---
% Inaccuracy or Maximum
allowable deviation (Bias)
should be less than 15%
Complies
Guidance Manual- Quality Control of Blood Glucose Test Strips
Document ID No. NIB/ BK/GM/01 Effective Date: Page 29 of 29
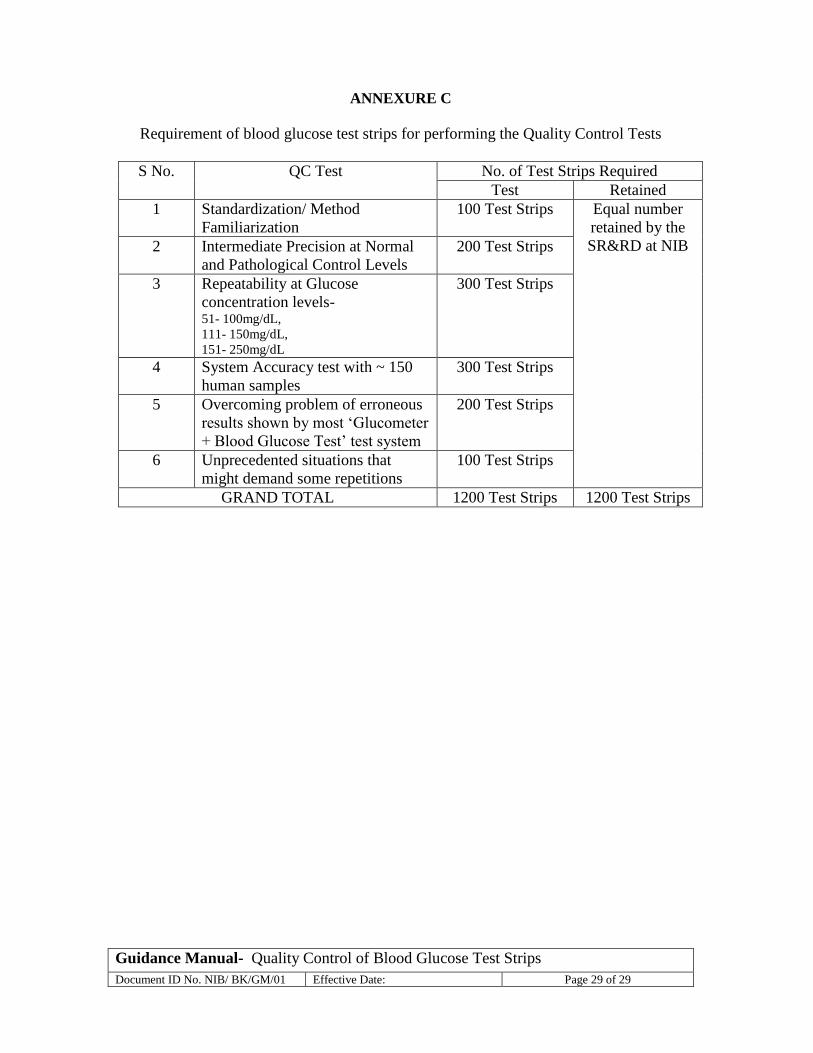
ANNEXURE C
Requirement of blood glucose test strips for performing the Quality Control Tests
S No. QC Test No. of Test Strips Required
Test Retained
1 Standardization/ Method
Familiarization
100 Test Strips Equal number
retained by the
SR&RD at NIB 2 Intermediate Precision at Normal
and Pathological Control Levels
200 Test Strips
3 Repeatability at Glucose
concentration levels- 51- 100mg/dL,
111- 150mg/dL,
151- 250mg/dL
300 Test Strips
4 System Accuracy test with ~ 150
human samples
300 Test Strips
5 Overcoming problem of erroneous
results shown by most ‘Glucometer
+ Blood Glucose Test’ test system
200 Test Strips
6 Unprecedented situations that
might demand some repetitions
100 Test Strips
GRAND TOTAL 1200 Test Strips 1200 Test Strips