Guerrilla Approaches to Finding and Evaluating...
96
Guerrilla Approaches to Finding and Evaluating Stocks Marc H. Gerstein [email protected] Portfolio123.com AAII/Better Investing, Washington DC – 4/18/2015 1
Transcript of Guerrilla Approaches to Finding and Evaluating...
Guerrilla Approaches to Finding
and Evaluating Stocks
Marc H. Gerstein
Portfolio123.com
AAII/Better Investing, Washington DC – 4/18/2015
1
Marc H. Gerstein spent his career analyzing stocks, educating investors, and
helping to develop stock screening platforms at Value Line and various web
sites. He is presently Director of Research at Portfolio123 and Editor of Forbes
Low-Priced Stock Report. His commentary can be found on SeekingAlpha.com,
Forbes.com and Harvest (hvst.com). He has authored three books, Screening
the Market (Wiley, 2002), The Value Connection (Wiley 2003), Atlas Upgrades:
Objectivism 2.0 (Create Space, 2013). He is presently working on a novel with
a Wall Street setting, and a book with Stanford’s Dr. Charles Lee based on the
latter’s course in “Alphanomics.”
2
The Agenda
• Recalibrating the Investment Mindset
• Case Studies: Developing Strategies
• Easy-to-Use Excel Valuation Tools
– Organizing and Summarizing your analysis of a stock
consistent with the approach to be discussed today
– Measuring the relative roles of “Noise” and “Value” in
a stock price
– A very simple, practical, usable discounted cash flow
type model based on “Residual Income”
3

Recalibrating the Investment Mindset
4
The Starting Point• Own great companies whose shares can be purchased
at great (cheap!) prices
• Own companies with sustainable competitive advantages
• Own companies with wide economic moats
• Own companies with great management teams
• Don’t chase a lot of stocks but be patient and wait to swing at a “fat pitch”
• Research the daylights out of prospective investments and put the lion’s share of your money into just a few “best ideas”
• Etc., etc., etc.
5
Oops
6

It Sounds Wonderful On Paper,
But in the Real World . . .
7
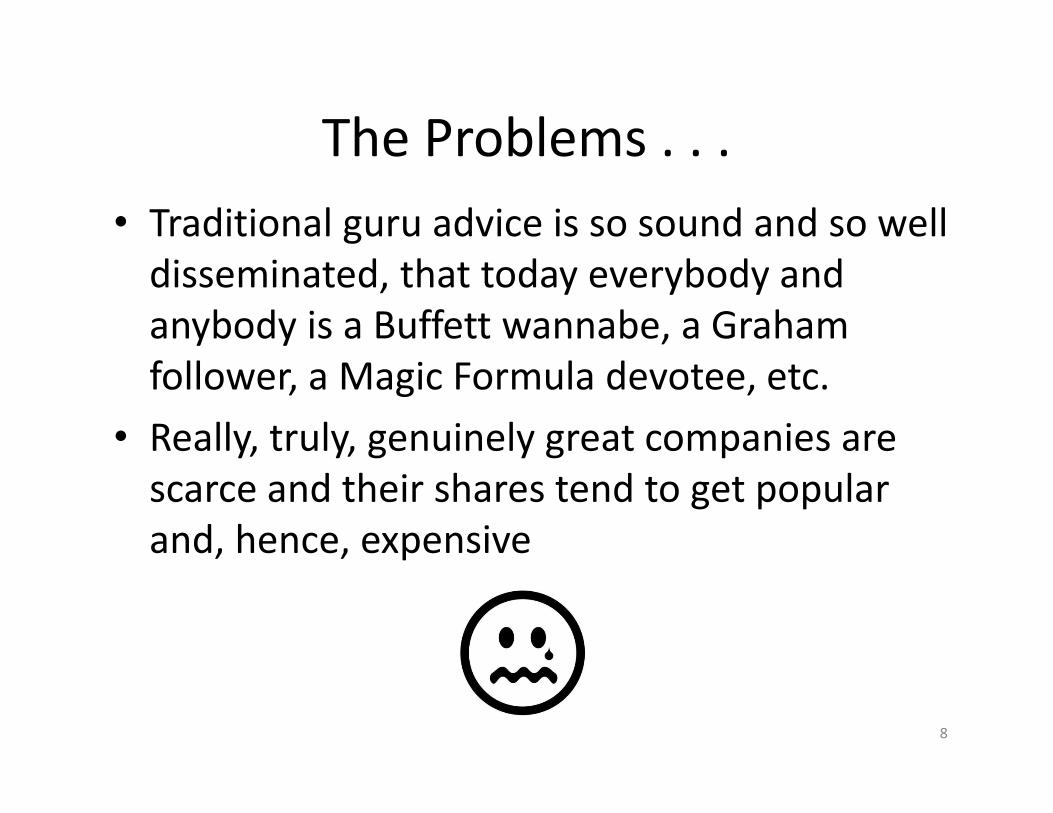
The Problems . . .
• Traditional guru advice is so sound and so well
disseminated, that today everybody and
anybody is a Buffett wannabe, a Graham
follower, a Magic Formula devotee, etc.
• Really, truly, genuinely great companies are
scarce and their shares tend to get popular
and, hence, expensive
8
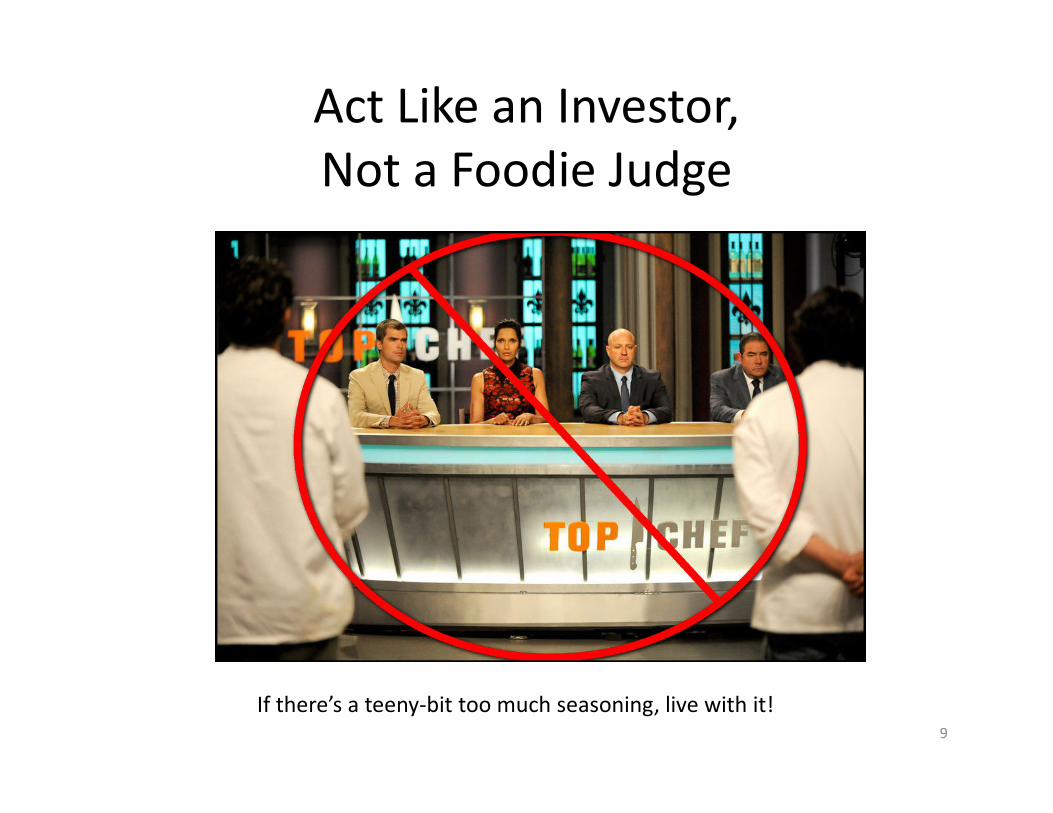
Act Like an Investor,
Not a Foodie Judge
9
If there’s a teeny-bit too much seasoning, live with it!

My Investment Hero:
Monroe Milstein (Founder of Burlington Coat Factory)
10
The “Milstein Moment”• The Bloodletting
– On a circa 1990s conference call, Wall Street analyst were taking the
Burlington Coat Factory CFO to task, and rather harshly, for disappointing sales
numbers
– The CFO was having trouble articulating a reason that was considered
satisfactory by the analysts
• The Rescue
– CEO Monroe Milstein, who typically said little during these calls, broke in:
– “Gentlemen,” he said. “I’ve been in this business for many years. We have
good months and we have bad months. This was a bad month.”
• The outcome
– Prolonged silence
– The analysts were rendered speechless
– The call then proceeded to an uneventful conclusion
• Epilogue
– Milstein cashed in huge when the company was sold to Bain Capital in 2006
for $2.06 billion 11

Don’t Rush to Judgment
12
Life is Harsh:
Learn to Accept Corporate Warts• Too many investors are devoting too many hours to quests
for perfection, and finding themselves disappointed by when– Subsequent events reveal that the supposedly great company
was more human than they had realized, and/or
– The price they paid for the great-company shares turned out to be fart less of a bargain than they had originally supposed
• On the other hand, too few investors appreciate the opportunities available in companies that are plain-vanilla, mundane, ordinary, mediocre or downright lousy– The shares can benefit as the companies improve (i.e. from
horrendous up to mundane)
– The shares tend to be cheaper• It can be great to buy a company with 25 units of Pathetic if the stock
is priced as if the company had 40 units of Pathetic
13

Divine Revelation
14

On Predictions
• Disciple (a/k/a John Denver): “God, can you predict
the future?”
• God (a/k/a George Burns): “Of course I can predict
the future; as soon as it becomes the past.”– Source: “Oh God!” (Warner Bros. 1977)
15
Human Insight - Aristotle
• “[T]he habits of perfected Self-Mastery and Courage are
spoiled by the excess and defect, but by the mean state are
preserved.”
• “At all events thus much is plain, that the mean state is in all
things praiseworthy, and that practically we must deflect
sometimes towards excess sometimes towards defect,
because this will be the easiest method of hitting on the
mean, that is, on what is right.”
– From Nicomachean Ethics, Book II (D.P. Chase Translation)16

Human Insight – Lao Tzu
• Holding a cup and overfilling it – Cannot be as good as stopping short – Pounding a blade and sharpening it —Cannot be kept for long
• Gold and jade fill up the room – No one is able to protect them – Wealth and position bring arrogance – And leave disasters upon oneself
• When achievement is completed, fame is attained – Withdraw oneself – This is the Tao of Heaven– Lao Tzu, Tao Te Ching, Ch. 9 (Derek Lin Translation)
17
Relevant Buzz Words• Buzz Words for Aristotle and Lao Tzu
– Virtue
– The Mean
– Withholding
– Stopping Short
• Buzz Word for Us– Mean Reversion
– Corrections
– Overbought and Oversold
– Business Cycles
– Economic Excesses
– Supply and Demand (market forces correct excesses and deficiencies in pricing and units)
– Company Transition (as growth companies mature)
– The overpowering of economic moats
18

19
The Destination
• Be an Investor, not a foodie judge– Don’t obsess over finding perfection
• What looks to some “gurus” like a fat pitch is more likely a slow-moving knuckle ball that breaks erratically and flutters frustratingly past your frantic swing
– Don’t be judgmental• Accept normal warts
– Recognize that extremes are not sustainable• Embrace the ordinary, or worse
– Embrace the ordinary
• Invest like a human– Recognize and even embrace our inability to know the future
• Diversify, diversify an diversify– Focused portfolios (most money in a few best ideas) are nonsense. They presume too
much about our ability to know the future, and if we could know the future, there’d be no reason not to put 1200% of assets into one’s single favorite idea
– Accept that it’s better to be “vaguely right than precisely wrong”• British Philosopher-Logician Carveth Read
– Don’t fret about being wrong, just try to be less wrong than others• Dr. Aswath Damodaran, NYU Stern School of Business
20

Case Study: Developing a Strategy
21
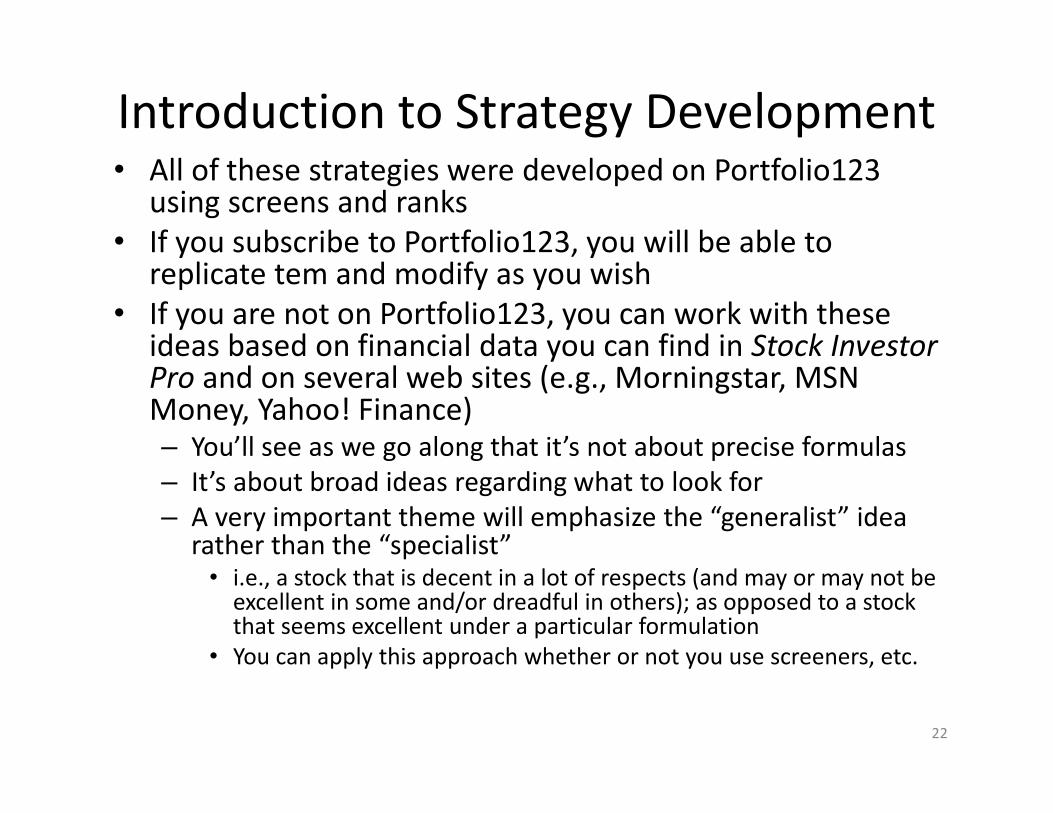
Introduction to Strategy Development• All of these strategies were developed on Portfolio123
using screens and ranks
• If you subscribe to Portfolio123, you will be able to replicate tem and modify as you wish
• If you are not on Portfolio123, you can work with these ideas based on financial data you can find in Stock Investor Pro and on several web sites (e.g., Morningstar, MSN Money, Yahoo! Finance)– You’ll see as we go along that it’s not about precise formulas
– It’s about broad ideas regarding what to look for
– A very important theme will emphasize the “generalist” idea rather than the “specialist”• i.e., a stock that is decent in a lot of respects (and may or may not be
excellent in some and/or dreadful in others); as opposed to a stock that seems excellent under a particular formulation
• You can apply this approach whether or not you use screeners, etc.
22
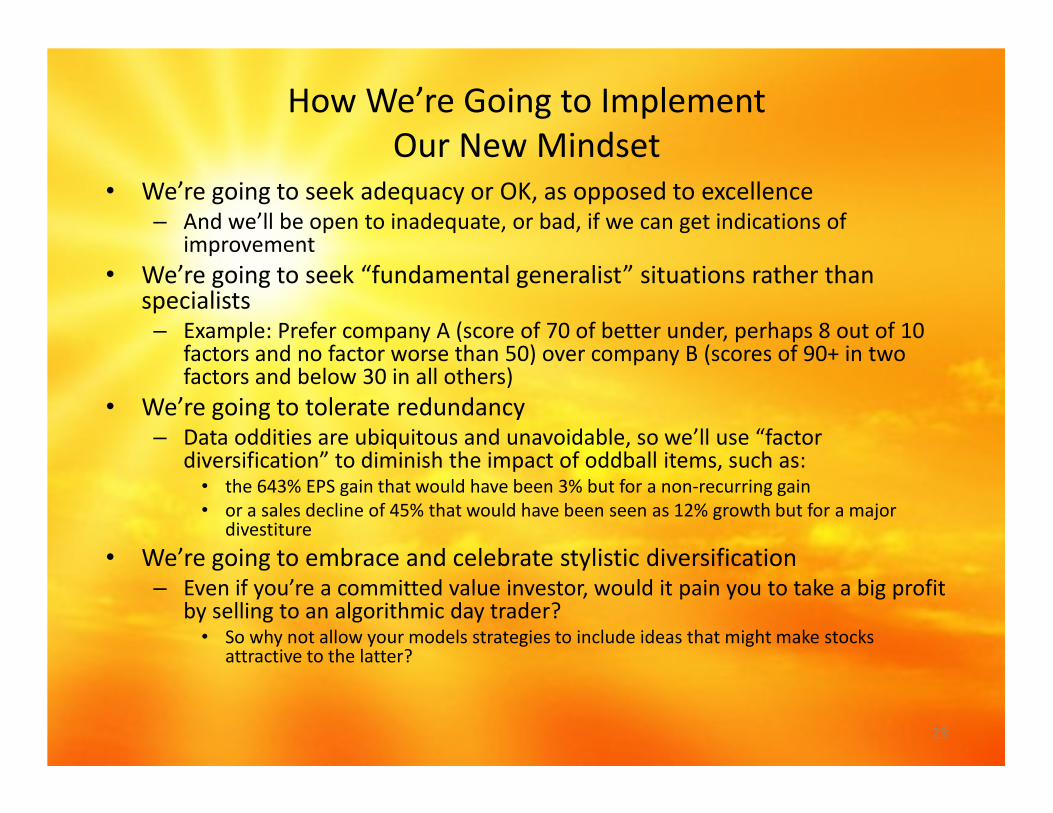
How We’re Going to Implement
Our New Mindset• We’re going to seek adequacy or OK, as opposed to excellence
– And we’ll be open to inadequate, or bad, if we can get indications of improvement
• We’re going to seek “fundamental generalist” situations rather than specialists– Example: Prefer company A (score of 70 of better under, perhaps 8 out of 10
factors and no factor worse than 50) over company B (scores of 90+ in two factors and below 30 in all others)
• We’re going to tolerate redundancy– Data oddities are ubiquitous and unavoidable, so we’ll use “factor
diversification” to diminish the impact of oddball items, such as:• the 643% EPS gain that would have been 3% but for a non-recurring gain
• or a sales decline of 45% that would have been seen as 12% growth but for a major divestiture
• We’re going to embrace and celebrate stylistic diversification– Even if you’re a committed value investor, would it pain you to take a big profit
by selling to an algorithmic day trader?• So why not allow your models strategies to include ideas that might make stocks
attractive to the latter?
23
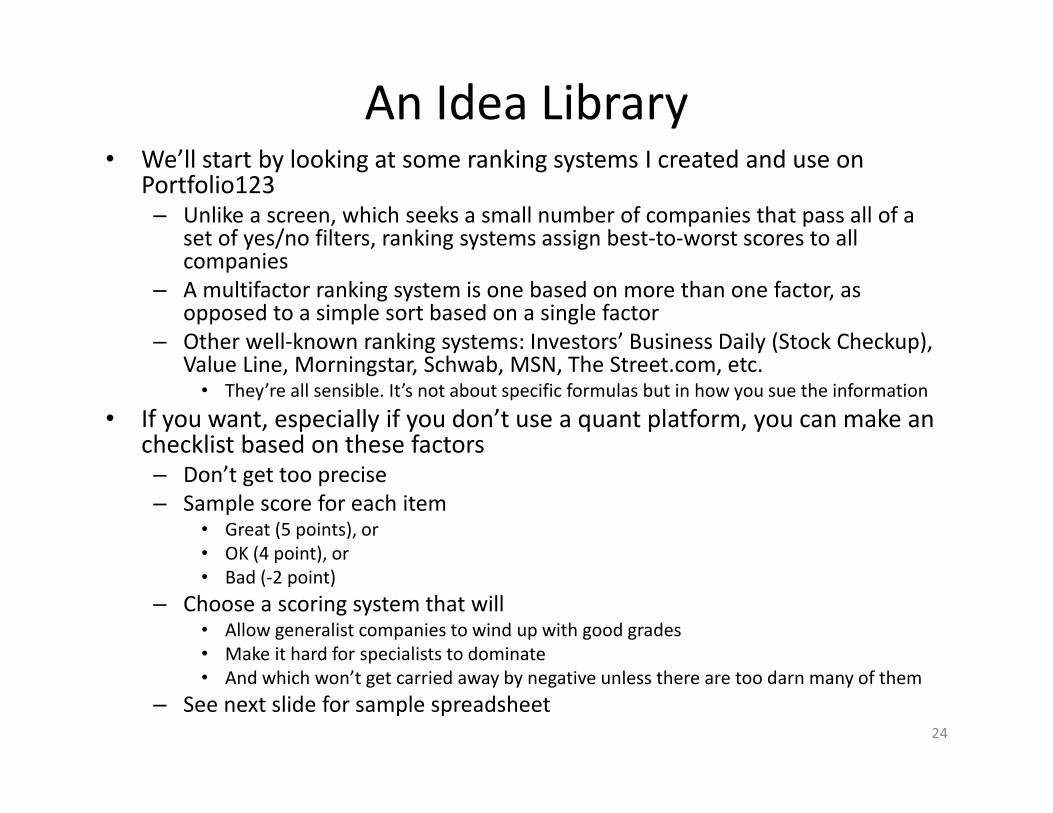
An Idea Library• We’ll start by looking at some ranking systems I created and use on
Portfolio123– Unlike a screen, which seeks a small number of companies that pass all of a
set of yes/no filters, ranking systems assign best-to-worst scores to all companies
– A multifactor ranking system is one based on more than one factor, as opposed to a simple sort based on a single factor
– Other well-known ranking systems: Investors’ Business Daily (Stock Checkup), Value Line, Morningstar, Schwab, MSN, The Street.com, etc.• They’re all sensible. It’s not about specific formulas but in how you sue the information
• If you want, especially if you don’t use a quant platform, you can make an checklist based on these factors– Don’t get too precise
– Sample score for each item• Great (5 points), or
• OK (4 point), or
• Bad (-2 point)
– Choose a scoring system that will• Allow generalist companies to wind up with good grades
• Make it hard for specialists to dominate
• And which won’t get carried away by negative unless there are too darn many of them
– See next slide for sample spreadsheet24

The Portfolio123
Comprehensive: QVGM Ranking System
• Basic: Quality Ranking System (25%)
• Basic: Value Ranking System (25%)
• Basic: Growth Ranking System (25%)
• Basic: Momentum Ranking System (25%)
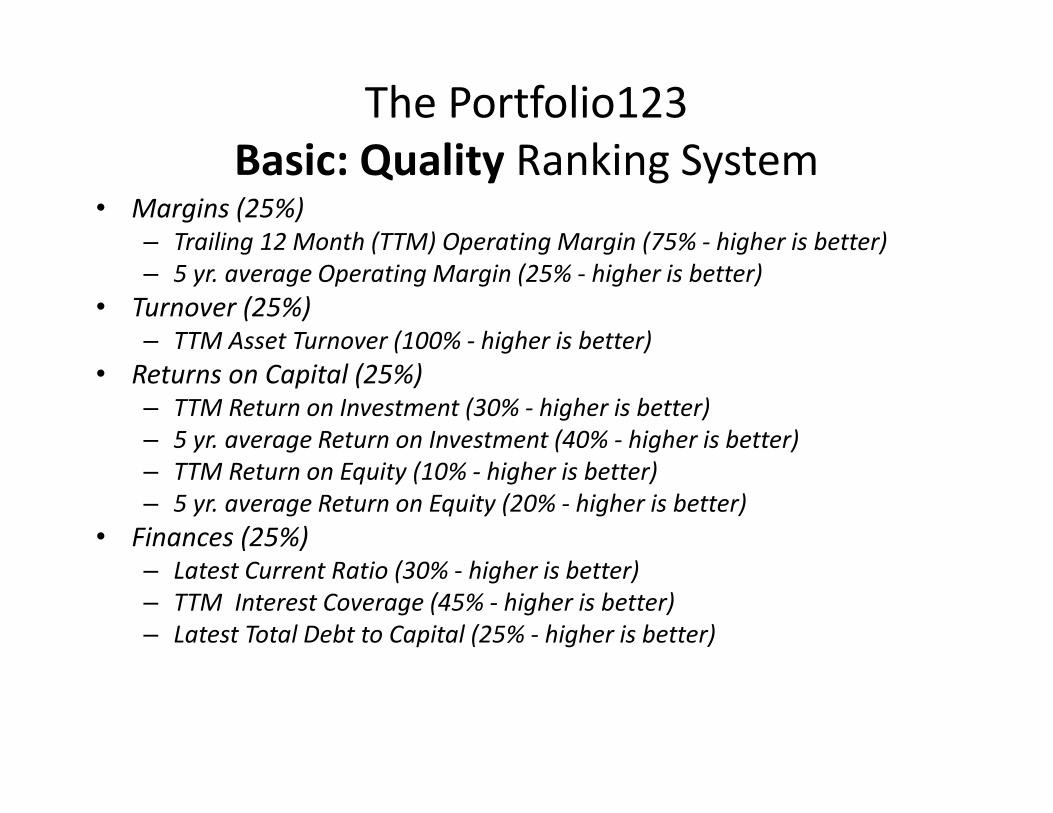
The Portfolio123
Basic: Quality Ranking System• Margins (25%)
– Trailing 12 Month (TTM) Operating Margin (75% - higher is better)
– 5 yr. average Operating Margin (25% - higher is better)
• Turnover (25%)
– TTM Asset Turnover (100% - higher is better)
• Returns on Capital (25%)
– TTM Return on Investment (30% - higher is better)
– 5 yr. average Return on Investment (40% - higher is better)
– TTM Return on Equity (10% - higher is better)
– 5 yr. average Return on Equity (20% - higher is better)
• Finances (25%)
– Latest Current Ratio (30% - higher is better)
– TTM Interest Coverage (45% - higher is better)
– Latest Total Debt to Capital (25% - higher is better)
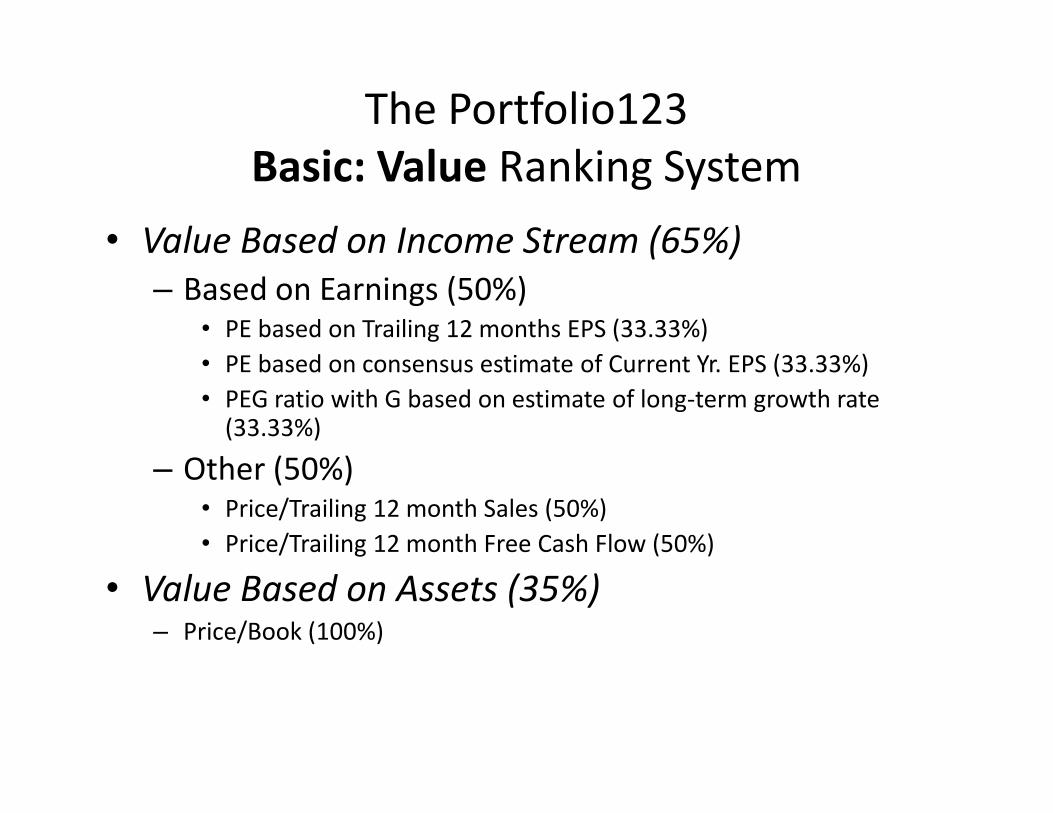
The Portfolio123
Basic: Value Ranking System
• Value Based on Income Stream (65%)
– Based on Earnings (50%)• PE based on Trailing 12 months EPS (33.33%)
• PE based on consensus estimate of Current Yr. EPS (33.33%)
• PEG ratio with G based on estimate of long-term growth rate (33.33%)
– Other (50%)• Price/Trailing 12 month Sales (50%)
• Price/Trailing 12 month Free Cash Flow (50%)
• Value Based on Assets (35%)– Price/Book (100%)

The Portfolio123
Basic: Growth Ranking System• EPS Growth (75%)
– Basic Growth (50%)• YTY growth in latest quarter (higher is better – 33%)
• Trailing 12 Month (TTM) growth (higher is better – 33%)
• 5 year growth rate (higher is better – 33%)
– Acceleration in Growth (50%)• Latest qtr. growth compared to TTM (higher is better – 50%)
• TTM growth compared to 5-year growth TTM (higher is better – 50%)
• Sales Growth (25%)– Basic Growth (75%)
• YTY growth in latest quarter (higher is better – 33%)
• Trailing 12 Month (TTM) growth (higher is better – 33%)
• 5 year growth rate (higher is better – 33%)
– Acceleration in Growth (25%)• Latest qtr. growth compared to TTM (higher is better – 50%)
• TTM growth compared to 5-year growth TTM (higher is better – 50%)
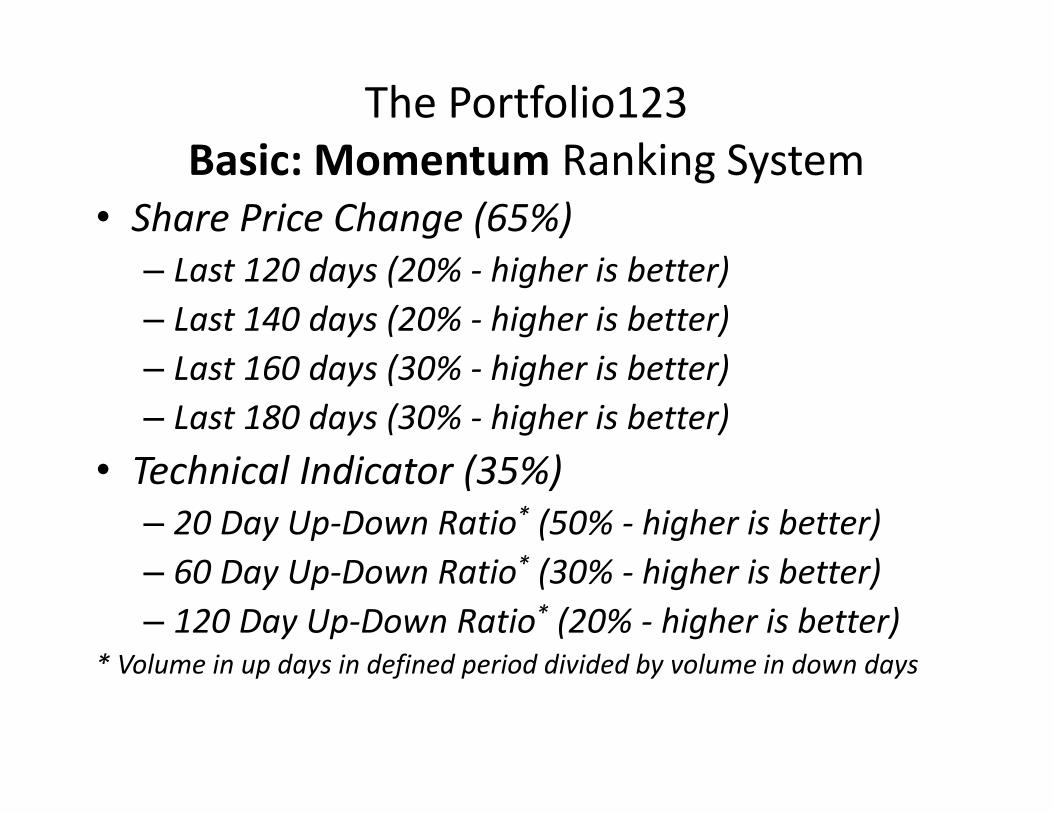
The Portfolio123
Basic: Momentum Ranking System
• Share Price Change (65%)
– Last 120 days (20% - higher is better)
– Last 140 days (20% - higher is better)
– Last 160 days (30% - higher is better)
– Last 180 days (30% - higher is better)
• Technical Indicator (35%)
– 20 Day Up-Down Ratio* (50% - higher is better)
– 60 Day Up-Down Ratio* (30% - higher is better)
– 120 Day Up-Down Ratio* (20% - higher is better)
* Volume in up days in defined period divided by volume in down days

The Portfolio123
Basic: Sentiment Ranking System
• Estimates (50%)– % 4 Week Change in Consensus Current Yr. EPS Est. (higher is better -
33.33%)
– % 4 Week Change in Consensus Current Qtr. EPS Est. (higher is better -33.33%)
– Standard Deviation of Current Qtr. EPS estimates/absolute value of consensus estimate (lower is better - 33.33%)
• EPS Surprise (30%)– Surprise % most recent quarter (higher is better - 65%)
– Surprise % second most recent quarter (lower is better - 35%)
• Analyst Recommendations (20%)– 4-week change in consensus recommendation (more bullish is better -
75%)
– Current consensus recommendation (more bullish is better - 25%)
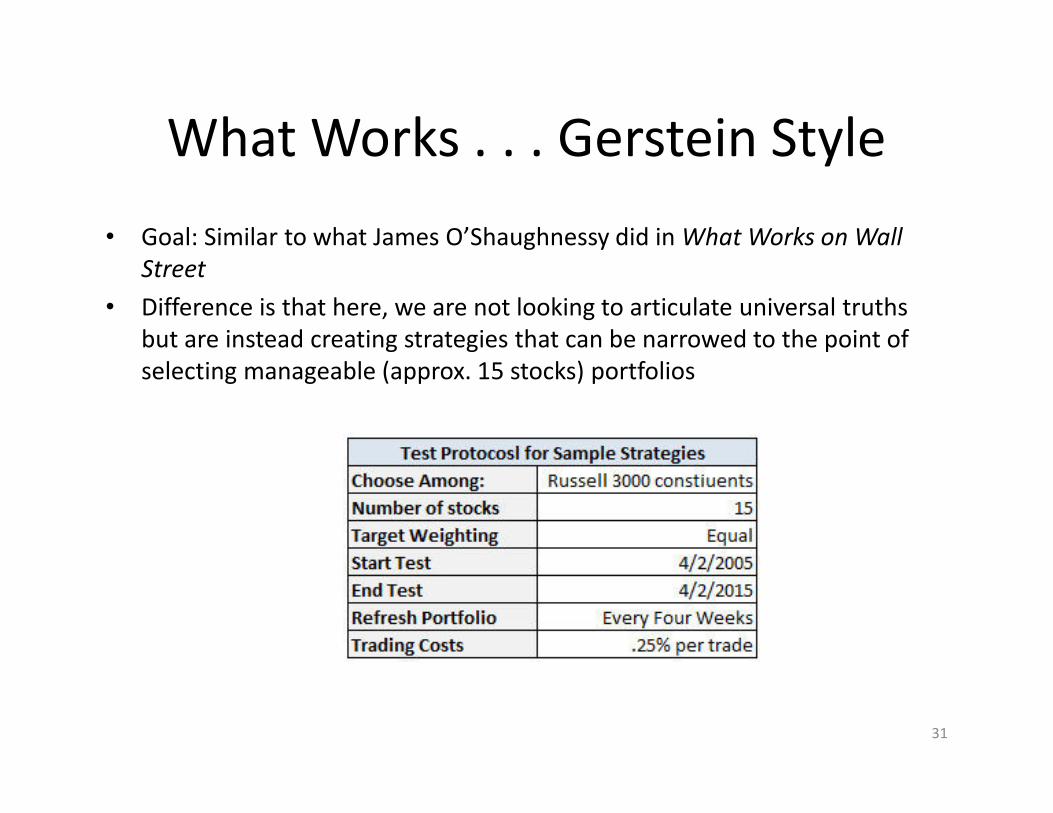
What Works . . . Gerstein Style
• Goal: Similar to what James O’Shaughnessy did in What Works on Wall
Street
• Difference is that here, we are not looking to articulate universal truths
but are instead creating strategies that can be narrowed to the point of
selecting manageable (approx. 15 stocks) portfolios
31

Testing Value Factors
32
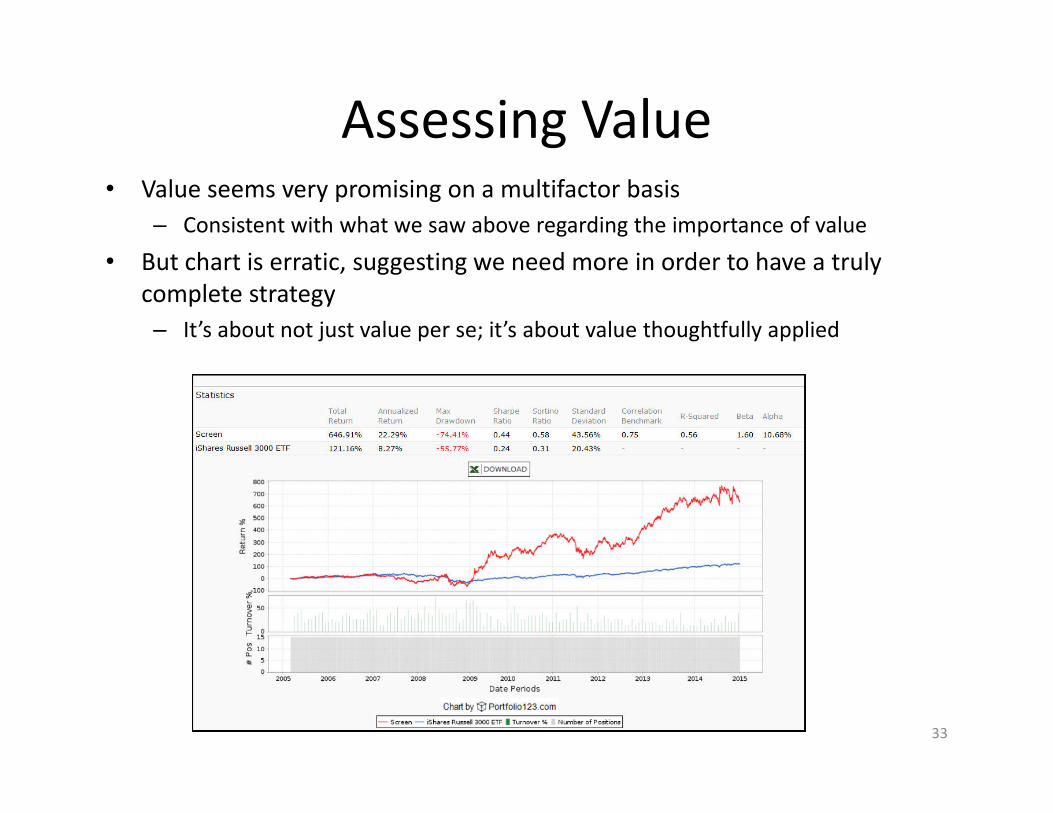
Assessing Value• Value seems very promising on a multifactor basis
– Consistent with what we saw above regarding the importance of value
• But chart is erratic, suggesting we need more in order to have a truly
complete strategy
– It’s about not just value per se; it’s about value thoughtfully applied
33
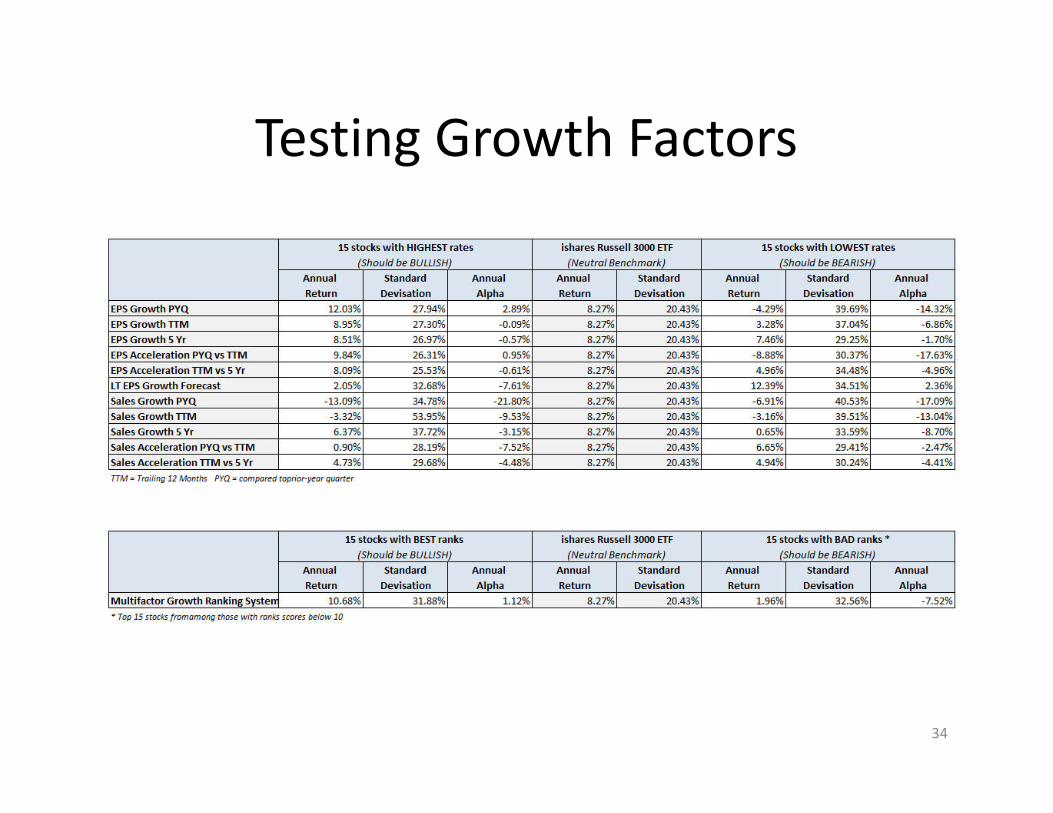
Testing Growth Factors
34
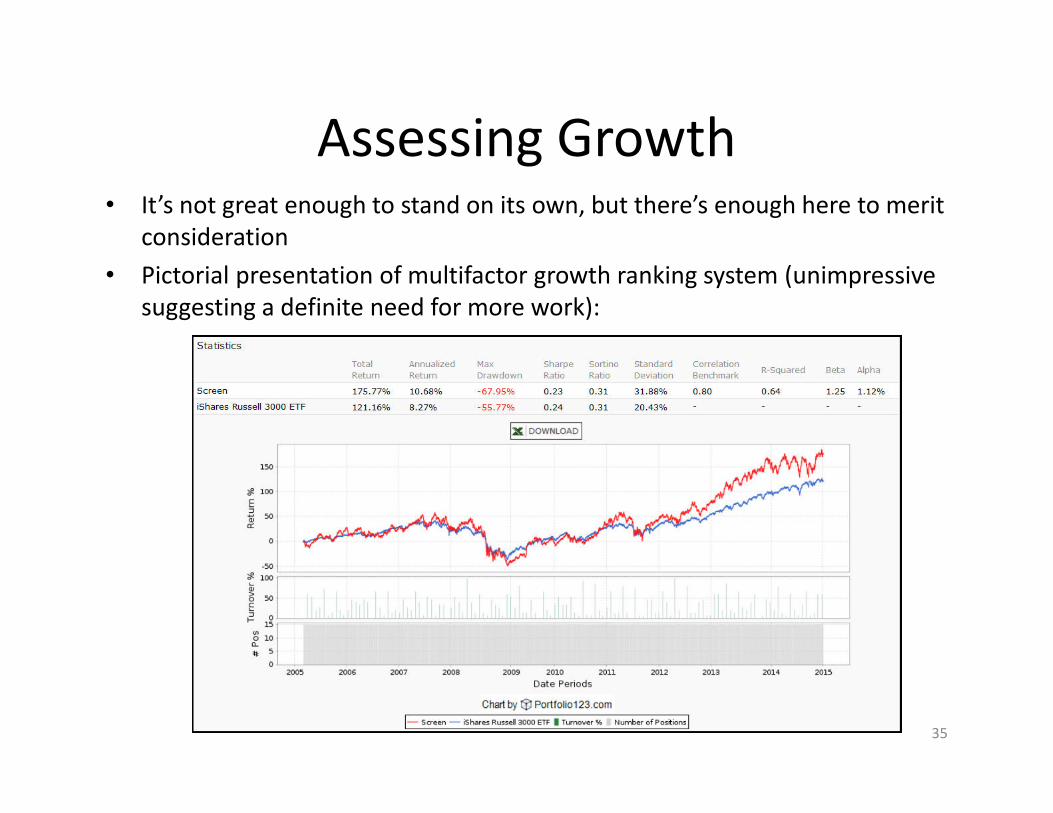
Assessing Growth• It’s not great enough to stand on its own, but there’s enough here to merit
consideration
• Pictorial presentation of multifactor growth ranking system (unimpressive
suggesting a definite need for more work):
35

Testing Quality Factors
• Surprisingly lackluster considering the
theoretical strength of these metrics
– ROE is the penultimate measure of a “good
company”
36
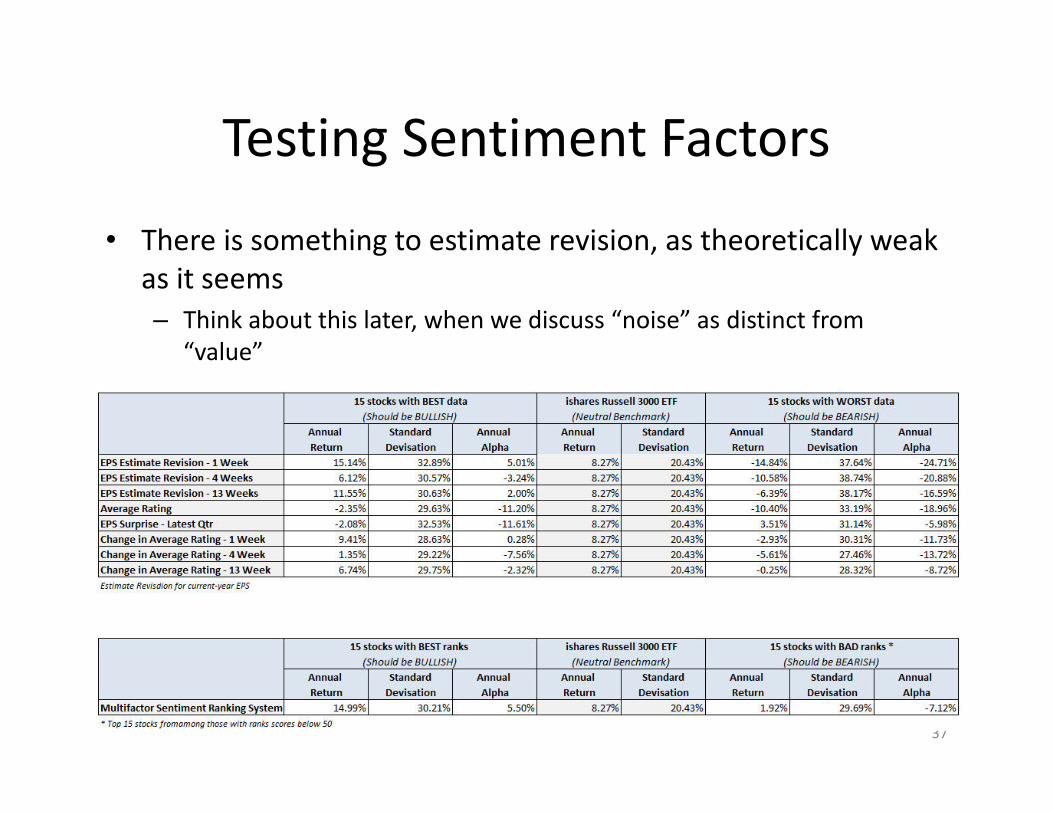
Testing Sentiment Factors
• There is something to estimate revision, as theoretically weak
as it seems
– Think about this later, when we discuss “noise” as distinct from
“value”
37
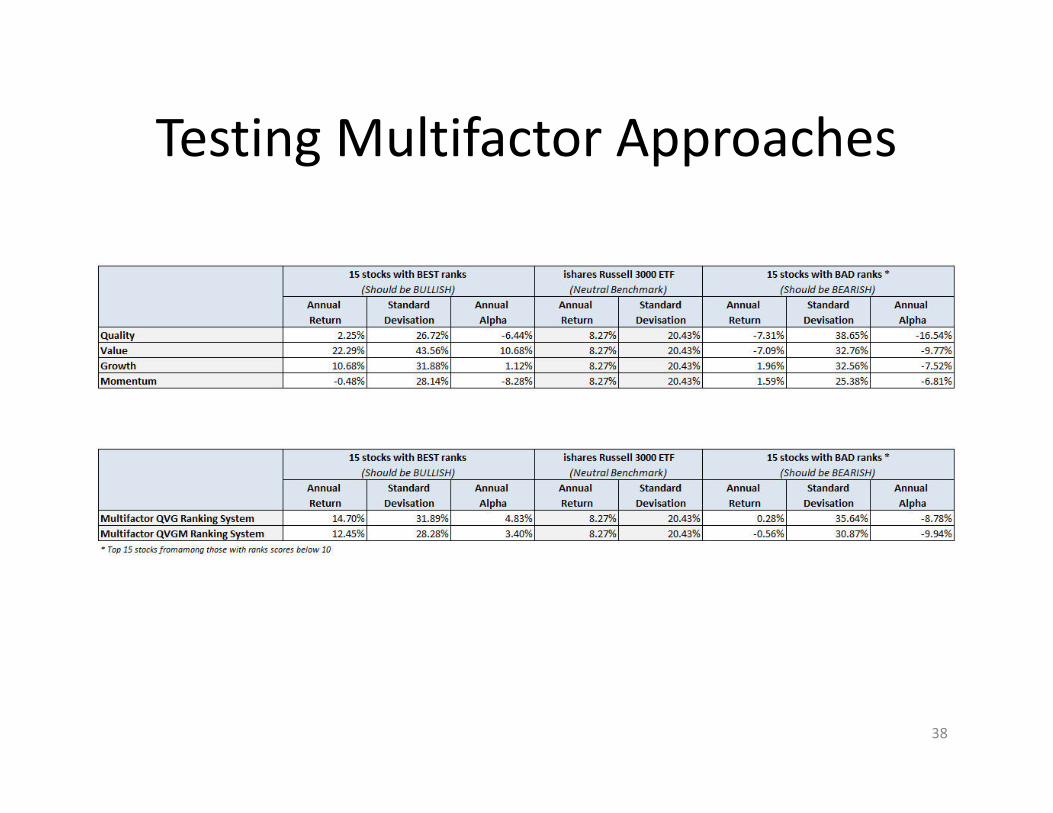
Testing Multifactor Approaches
38

Top 15 per QVG Ranking System
39
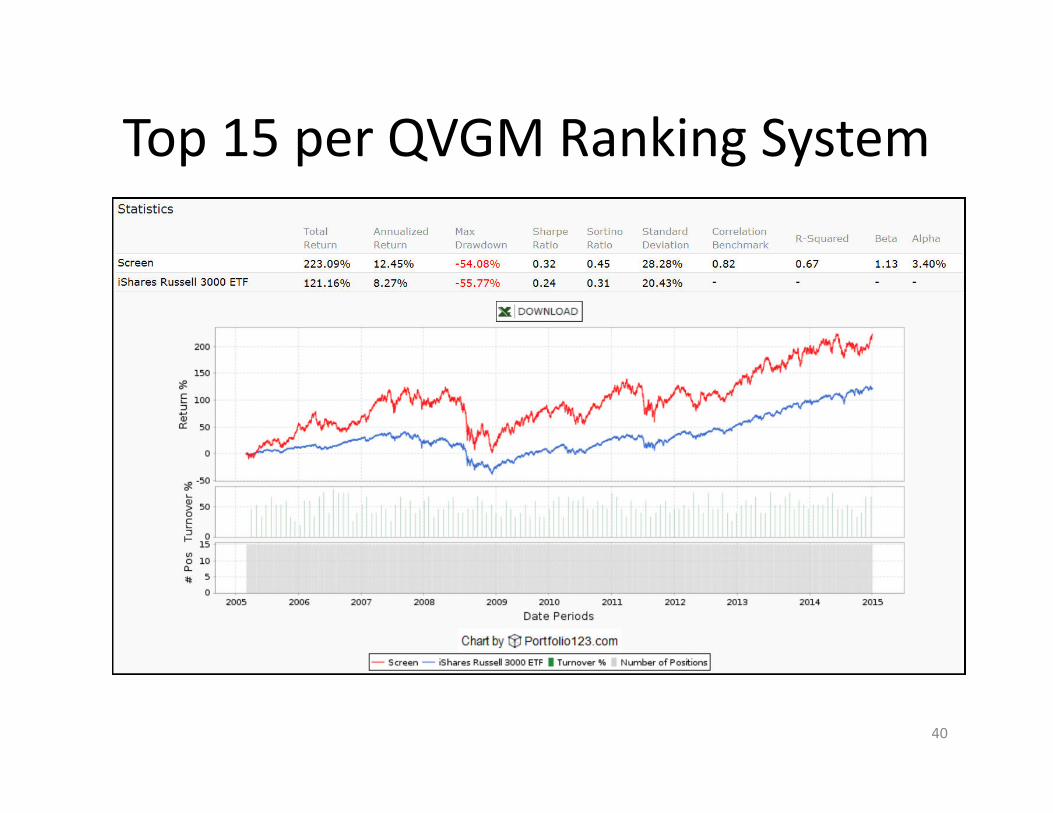
Top 15 per QVGM Ranking System
40
QVG vs. QVGM
• Based purely on overall 10-year backtest results, QVG looks slightly superior– Not clear the difference is especially significant
• Consideration of the charts, however, suggests a nod to QVGM– More consistent performance over longer periods of time
• These multifactor sorting/ranking approaches, although not perfect, do show promise– The key is to do what successful sales people do; prospect
from “pre-qualified” lists (as opposed to, say, the white pages)
– Screens are a great way to create pre-qualified lists
41
A Very Simple Screen
• Choose stocks from within Russell 3000
universe
• PE (using estimate of next year’s EPS) < 15
• ROE trailing 12 months > 25%
• EPS gain vs. year-ago quarter < 15%
42
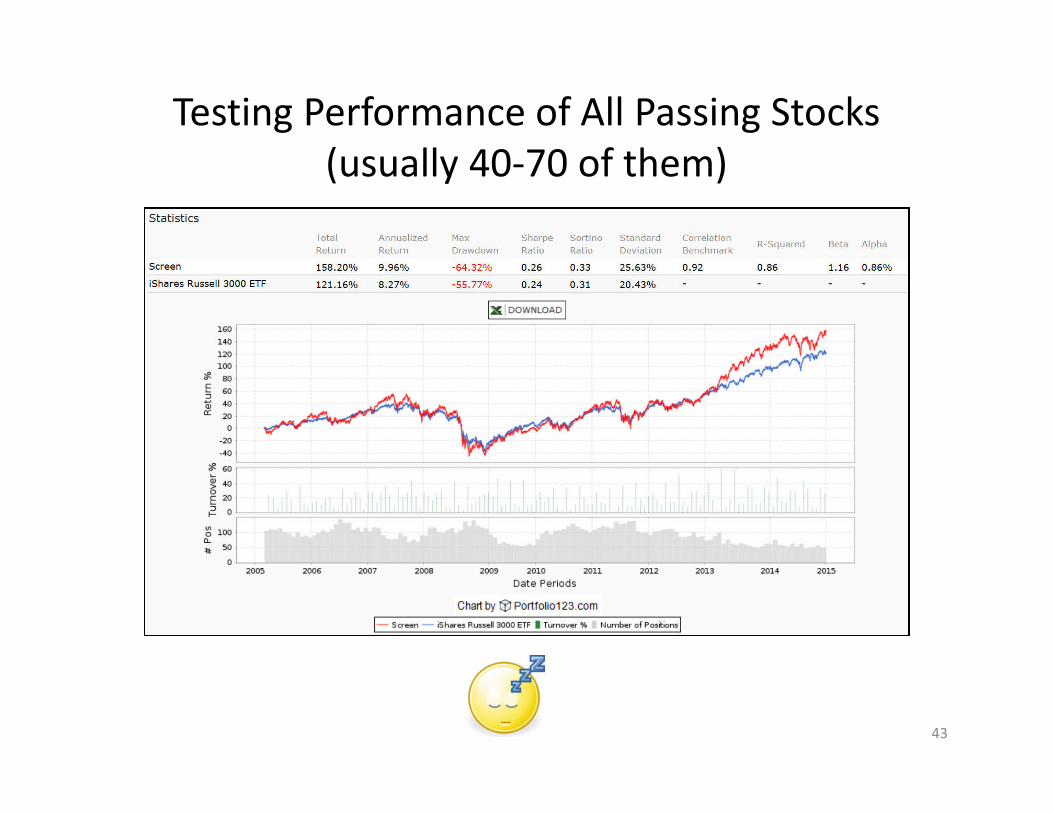
Testing Performance of All Passing Stocks
(usually 40-70 of them)
43
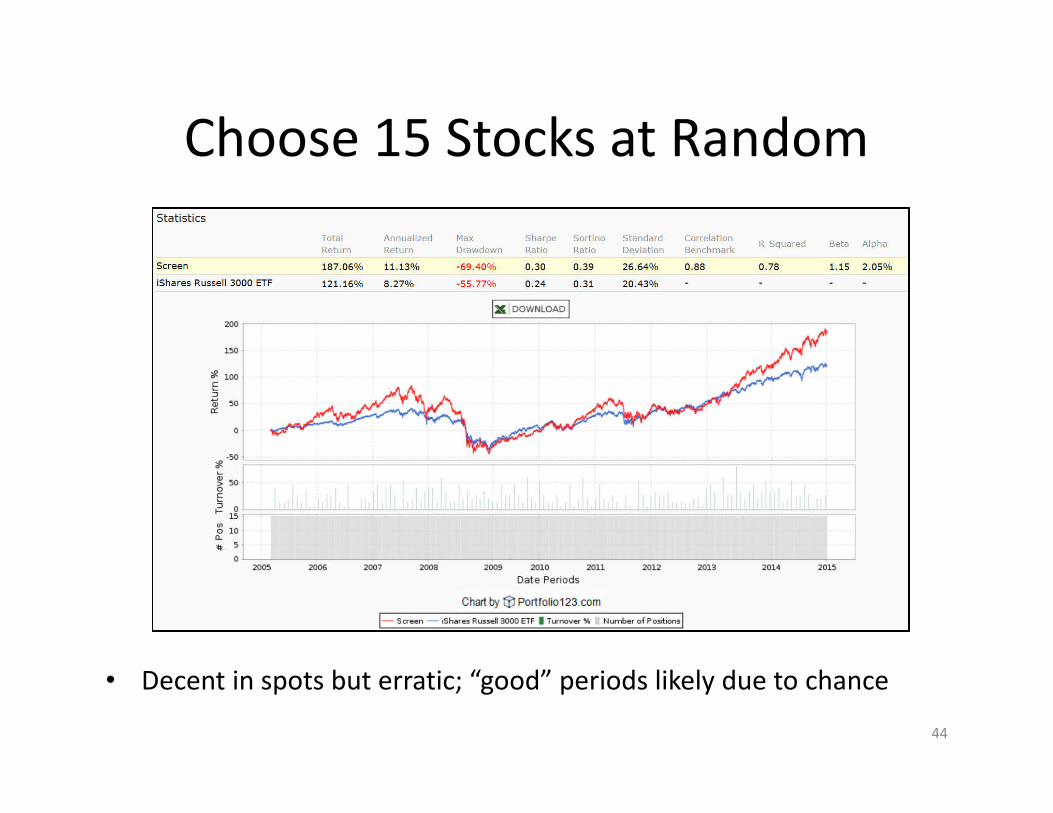
Choose 15 Stocks at Random
• Decent in spots but erratic; “good” periods likely due to chance
44

Top 15 per Value Ranking System
• Well that’s disappointing! The value ranking system
seemed promising on its own.
45
Let’s Change The Screen
• There’s a dramatic increase in the number of factors being considered (note the addition of two rules using multi-factor ranking systems), and the carryover rules now are much less demanding in terms of excellence– Choose stocks from within Russell 3000 universe
– Forward PE is in the bottom 65% of the universe
– Trailing 12 month ROE is in the top 25%
– EPS growth rate vs. year ago quarter in top 25%
– Score under Sentiment ranking system is above 80
– Score under QVGM ranking system is above 80
46
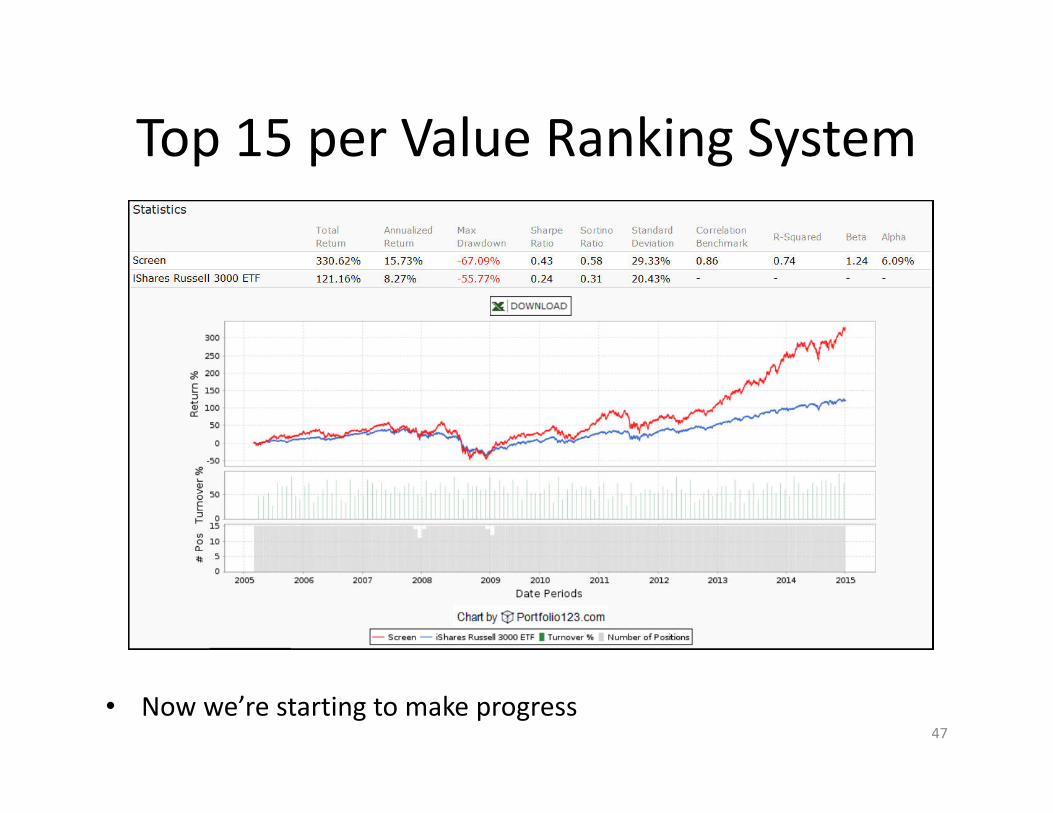
Top 15 per Value Ranking System
• Now we’re starting to make progress 47
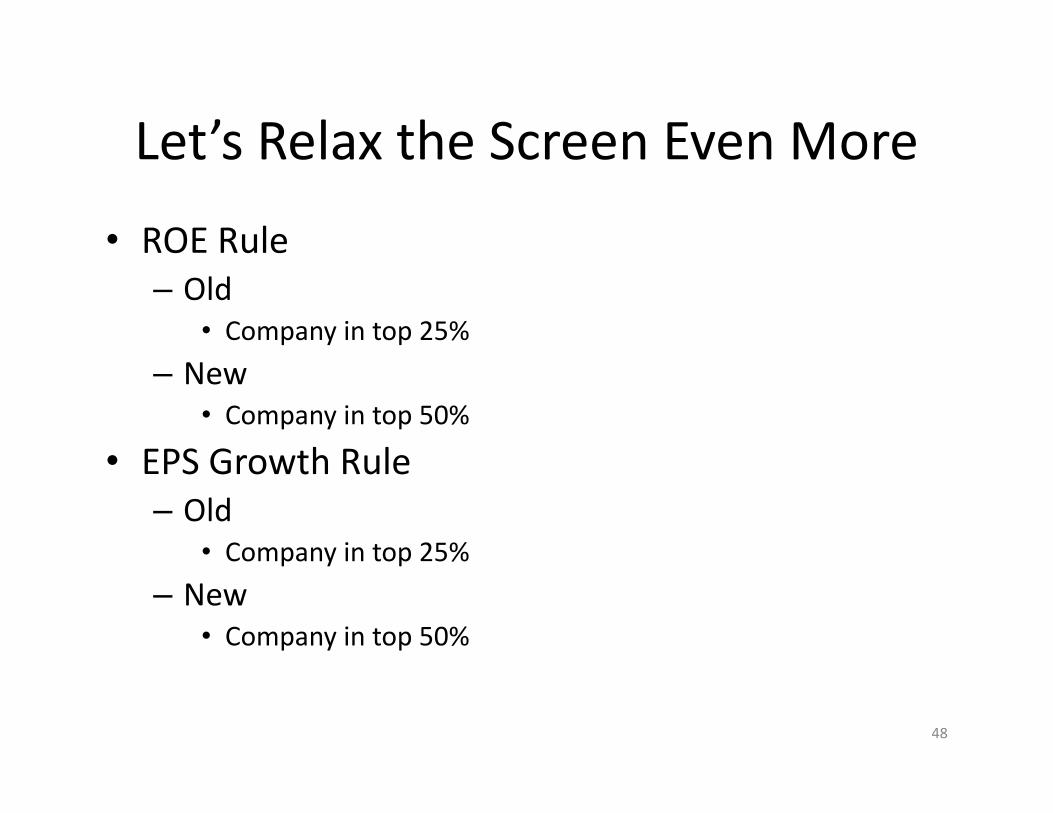
Let’s Relax the Screen Even More
• ROE Rule
– Old
• Company in top 25%
– New
• Company in top 50%
• EPS Growth Rule
– Old
• Company in top 25%
– New
• Company in top 50%
48
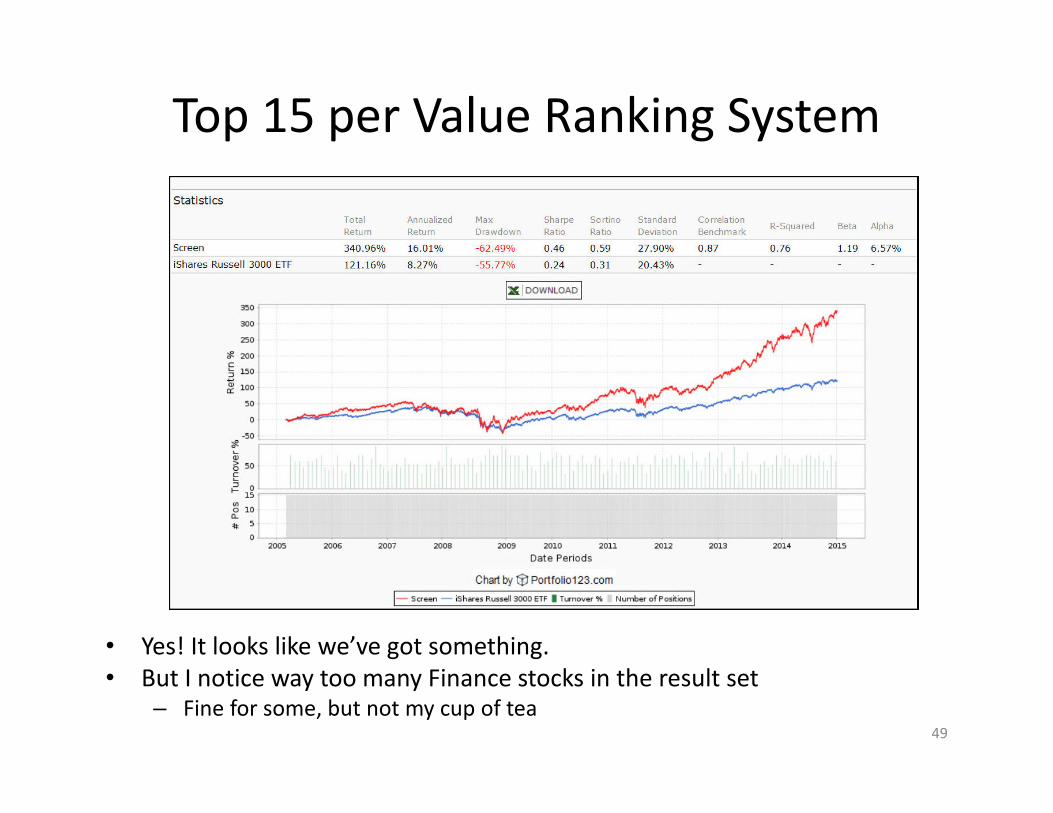
Top 15 per Value Ranking System
• Yes! It looks like we’ve got something.
• But I notice way too many Finance stocks in the result set– Fine for some, but not my cup of tea
49

Tweaking the Screen Again
• Add a rule eliminating companies in the
Financial Sector
• Tweak the PE rule
– I still want bottom 65%
– But instead of bottom 65% relative to all stocks, I
now want bottom 65% relative to industry peers
• The original rule caused the portfolio to tilt heavily
toward Financial; stocks, which normally carry relatively
low PEs
50
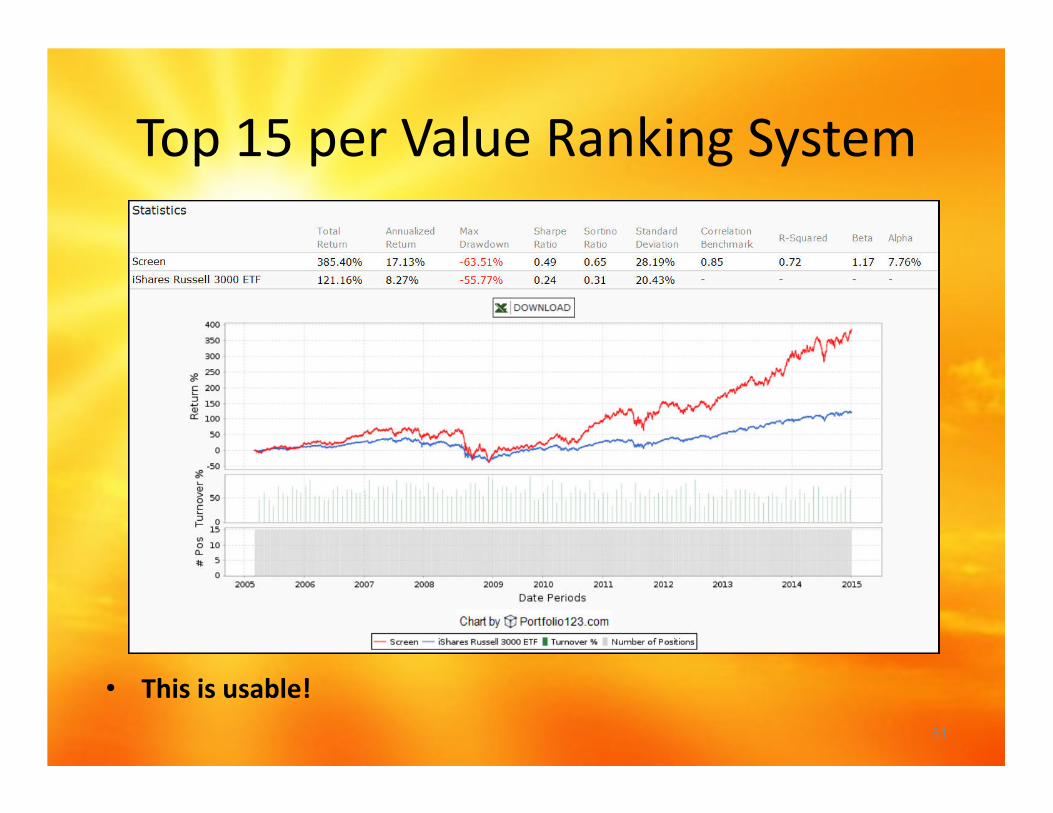
Top 15 per Value Ranking System
• This is usable!
51
Easy-to-Use Excel Valuation Tools
52

Tool 1: Stock Analysis Excel Template
53
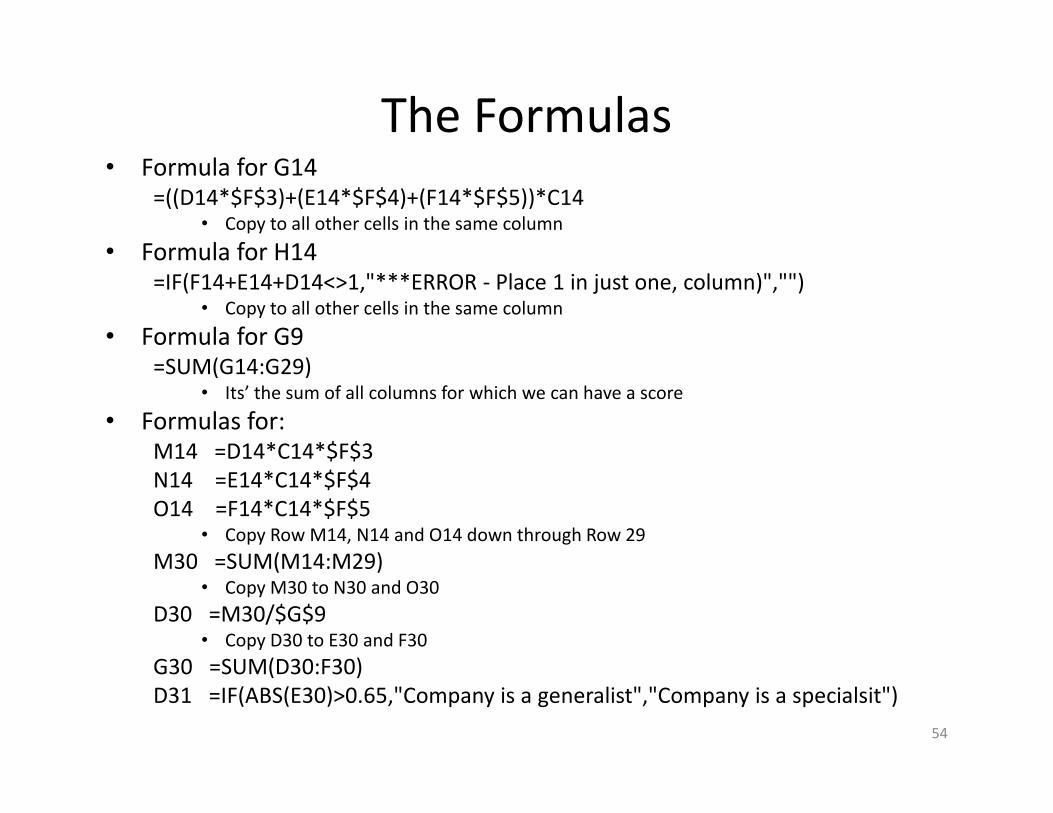
The Formulas• Formula for G14
=((D14*$F$3)+(E14*$F$4)+(F14*$F$5))*C14• Copy to all other cells in the same column
• Formula for H14=IF(F14+E14+D14<>1,"***ERROR - Place 1 in just one, column)","")
• Copy to all other cells in the same column
• Formula for G9=SUM(G14:G29)
• Its’ the sum of all columns for which we can have a score
• Formulas for:M14 =D14*C14*$F$3
N14 =E14*C14*$F$4
O14 =F14*C14*$F$5• Copy Row M14, N14 and O14 down through Row 29
M30 =SUM(M14:M29)• Copy M30 to N30 and O30
D30 =M30/$G$9• Copy D30 to E30 and F30
G30 =SUM(D30:F30)
D31 =IF(ABS(E30)>0.65,"Company is a generalist","Company is a specialsit")
54
Tool 1: Noise-Value Calibrator
1. The Idea
2. The Calculations
3. The Excel Spreadsheet
55

Noise-Value Calibrator:
The Idea
56

Starting Point: “Beat the Gun”• Traditional notion– Investors buy stocks they believe will deliver good returns
• John Maynard Keynes– [T]he professional investor is forced to concern himself
with the anticipation of impending changes, in the news or in the atmosphere, of the kind by which experience shows that the mass psychology of the market is most influenced . . . . The social object of skilled investment should be to defeat the dark forces of time and ignorance which envelop our future. The actual, private object of the most skilled investment to-day is “to beat the gun”, as the Americans so well express it, to outwit the crowd, and to pass the bad, or depreciating, half-crown to the other fellow.• John Maynard Keynes, The General Theory of Employment, Interest
and Money (Signalman Publishing, 2010 Kindle Ed.), p. 101, Emphasis supplied.
57
Implications of “Beat The Gun”
• We recognize that some will trade on the basis
of reasons that aren’t “right” and . . .
• That many who do so are knowledgeable
investors who really ought to know what’s
right and what isn’t, and . . .
• That what they’re doing is perfectly rational
– It’s perfectly rational to pay $50 for a stock you
know is worth $40 if you expect it to go to $60
58
Fisher Black
• He not only acknowledges the existence of such “noise” trading but goes further to state that it’s essential to the functioning of the market
– If all traders did only what’s “right,” no trading could ever take place since one party would have to be willing to make a mistake. But . . .
– “Noise trading provides the essential missing ingredient . . . . With a lot of noise traders in the market, it now pays for those with information to trade. It even pays for people to seek out costly information which they will then trade on.” • Fisher Black, Noise Papers and Proceedings of the Forty-Fourth Annual Meeting of the America
Finance Association, New York, New York, December 20-30, 1985, Journal of Finance, Vol. 41, Issue 3
(July 1986), p. 529-543 at 531 )
59
Implications of Black
• Noise trading is not only understandable, but
the market can’t function without it
• We can’t hope improved investor education or
an outbreak of mass rationality will eliminate
noise and cause everybody to do the right
thing
• It simply won’t happen, not now, not ever
60

The Next Step: Robert Shiller
• The market consists of two types of traders
– Smart-money investors
• Make decisions based on information relevant to valuation subject only to wealth constraints
– Ordinary Investors
• Everyone else; i.e., those who do “not respond to expected returns as optimally forecasted”
– They often over-react to news and follow fads since they “have no model or at best a very incomplete model of the behavior of stock prices . . . .”
– Robert J. Shiller, Stock Prices and Social Dynamics Brookings Papers on Economic Activity, Vol. 2 (1984) p. 477
61
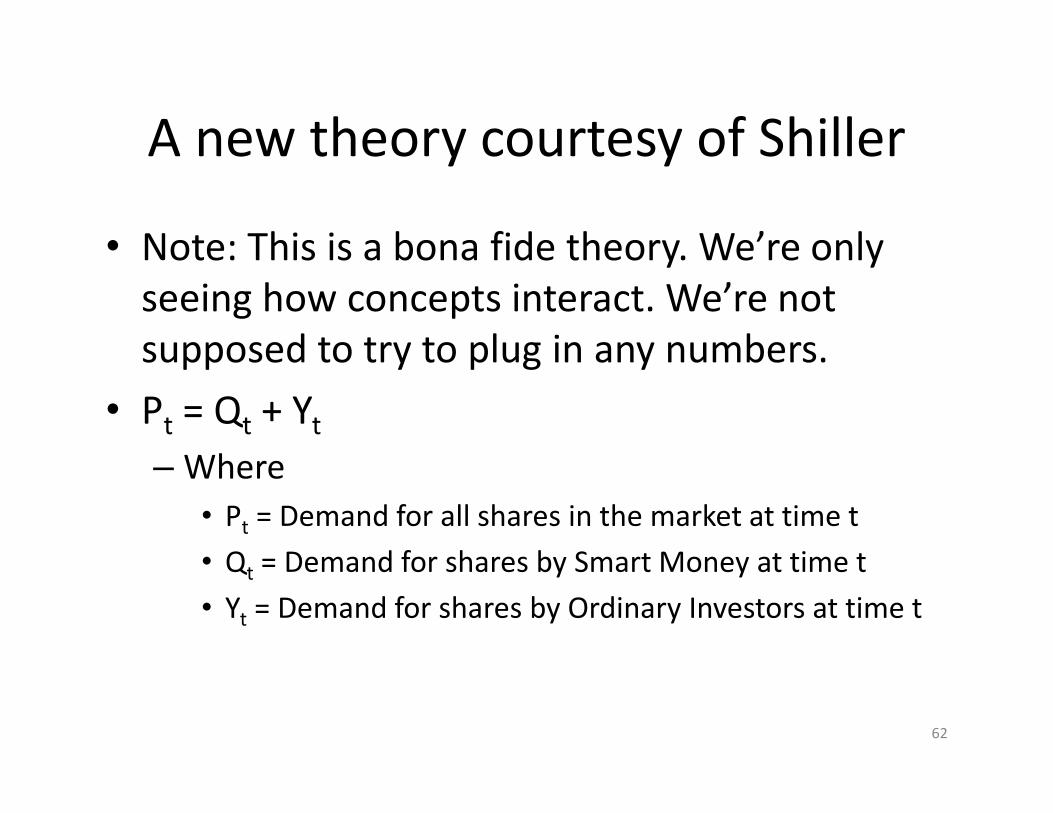
A new theory courtesy of Shiller
• Note: This is a bona fide theory. We’re only
seeing how concepts interact. We’re not
supposed to try to plug in any numbers.
• Pt = Qt + Yt
– Where
• Pt = Demand for all shares in the market at time t
• Qt = Demand for shares by Smart Money at time t
• Yt = Demand for shares by Ordinary Investors at time t
62
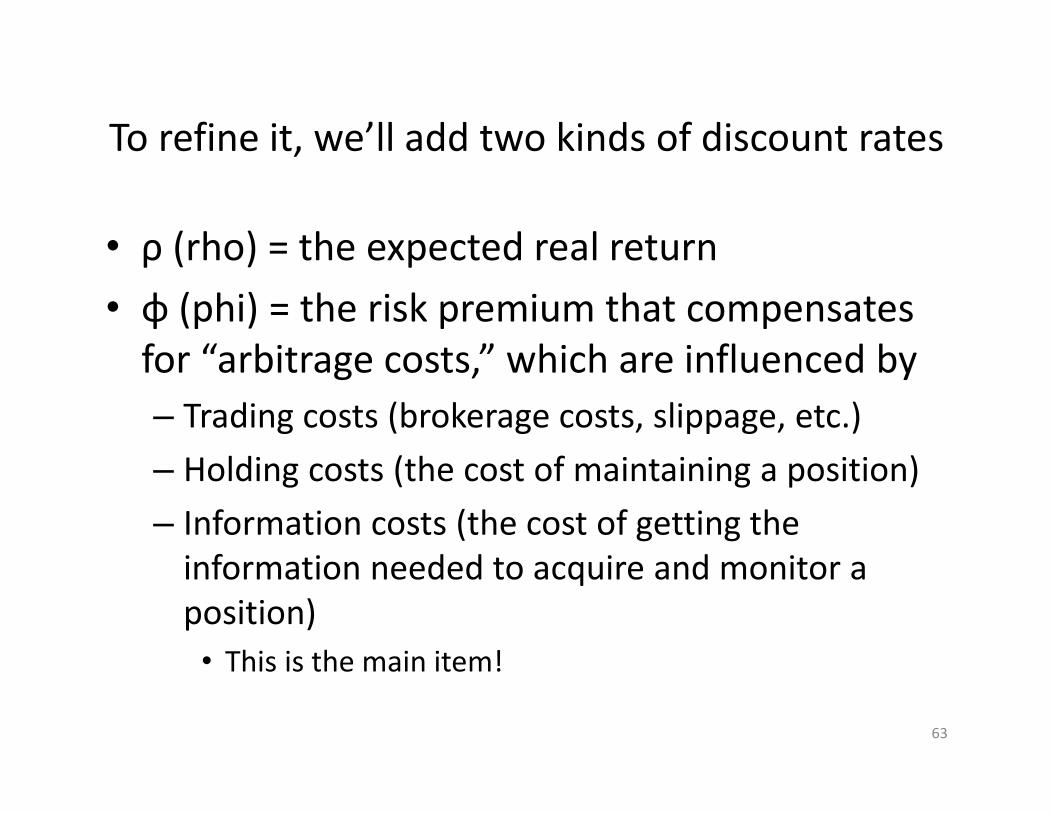
To refine it, we’ll add two kinds of discount rates
• ρ (rho) = the expected real return
• φ (phi) = the risk premium that compensates
for “arbitrage costs,” which are influenced by
– Trading costs (brokerage costs, slippage, etc.)
– Holding costs (the cost of maintaining a position)
– Information costs (the cost of getting the
information needed to acquire and monitor a
position)
• This is the main item!
63

The Refined Theory
• Pt = Σ (Et (Dt+k) + φEt(Yt+k)) / (1 + ρ + φ)– Gag, gag, retch . . .
– RELAX• This is just a theoretical framework. We’re not going to try
to plug in any numbers.
• Generally, this can be translated to English as stock prices are equal to . . . .– The present value of all expected future dividends
• Nothing new here; we know all about this
– Plus the sum of all future ordinary-trader demand multiplied by arbitrage costs• This is new
64
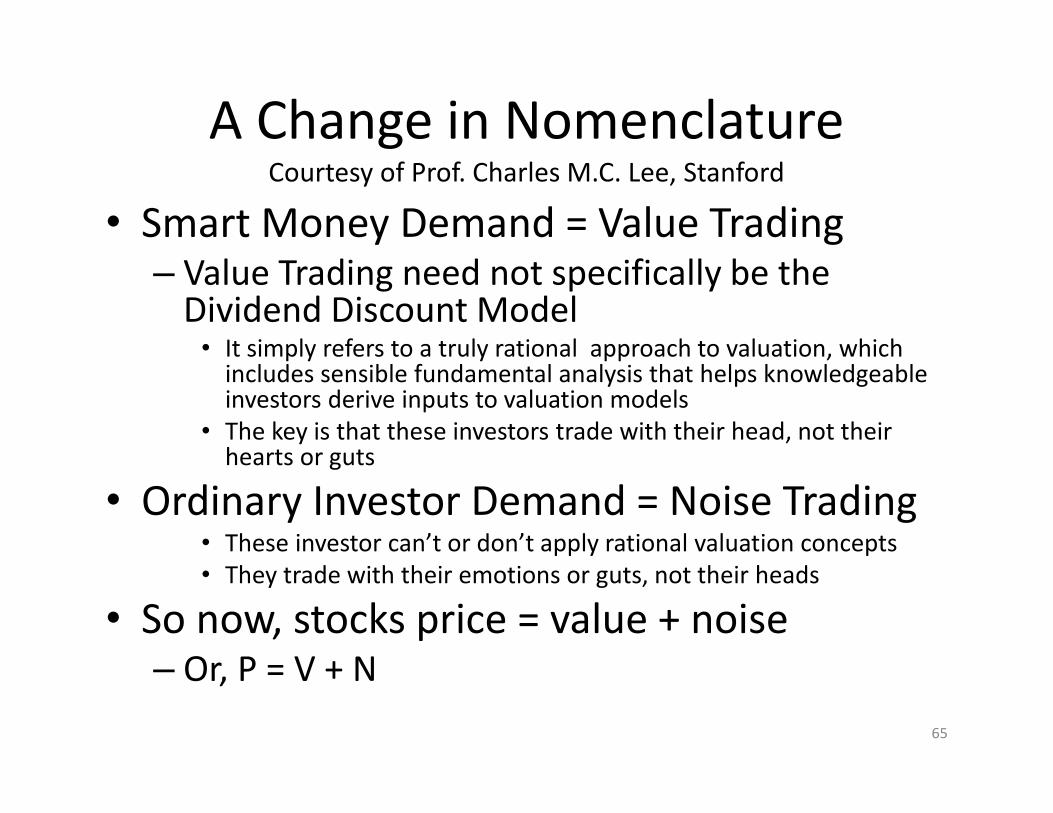
A Change in Nomenclature Courtesy of Prof. Charles M.C. Lee, Stanford
• Smart Money Demand = Value Trading– Value Trading need not specifically be the
Dividend Discount Model• It simply refers to a truly rational approach to valuation, which
includes sensible fundamental analysis that helps knowledgeable investors derive inputs to valuation models
• The key is that these investors trade with their head, not their hearts or guts
• Ordinary Investor Demand = Noise Trading• These investor can’t or don’t apply rational valuation concepts
• They trade with their emotions or guts, not their heads
• So now, stocks price = value + noise– Or, P = V + N
65
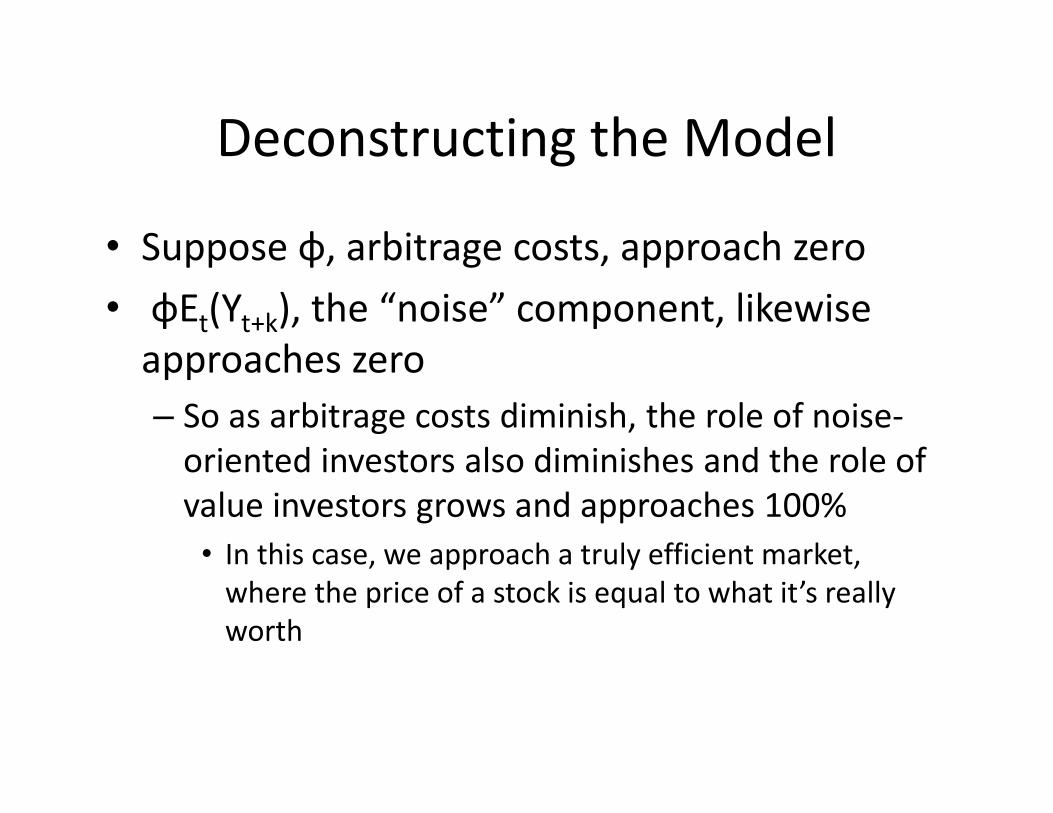
Deconstructing the Model
• Suppose φ, arbitrage costs, approach zero
• φEt(Yt+k), the “noise” component, likewise
approaches zero
– So as arbitrage costs diminish, the role of noise-
oriented investors also diminishes and the role of
value investors grows and approaches 100%
• In this case, we approach a truly efficient market,
where the price of a stock is equal to what it’s really
worth
Deconstruction - Continued
• Suppose φ, arbitrage costs, rise and approach
infinity
• φEt(Yt+k), the “noise” component, likewise
approaches rises and would eventually
approach 100%
– So as arbitrage costs rise, value investors become
increasingly drowned out by noise
Focusing on the Information-Cost
Component of φ (Arbitrage Costs) . . . .• As information becomes harder and more expensive to get, the role
of value diminishes– We see this all the time
• In some global markets, where information is largely unavailable and/or unreliable, the markets are very much or, in some cases entirely noise based
• Smaller segments of the U.S. market, where analytic coverage tends to be skimpier, we tend to see less efficient pricing
• As information becomes more accessible, i.e. as information costs decline), the role of valuation increases– Domestically, the S&P 500 stocks, for which information is most readily
available, prices tend to be more efficient than in other parts of the market as value plays a bigger role
– The nature of the business is another aspect• As it becomes more feasible to value stocks, value traders become more
prominent and noise trading diminishes
• As conventional valuation becomes more difficult, noise investors find happier hunting ground– See, e.g., Tesla, Amazon, many start-ups, many boiotechs
68
Practical Implication
• Since arbitrage costs are not likely to reach zero, we cannot expect stock prices to truly match “value”
• Noise is a normal part of the market’s equilibrium condition
• It cannot be dismissed as an unfortunate circumstance
• We cannot sit back and sneer or hope it will be conquered by investor education
• We CAN factor it into our approaches to stock finding and analysis
• P = V + N, or Price = Value + Noise
69
Noise-Value Calibrator:
The Calculations
70
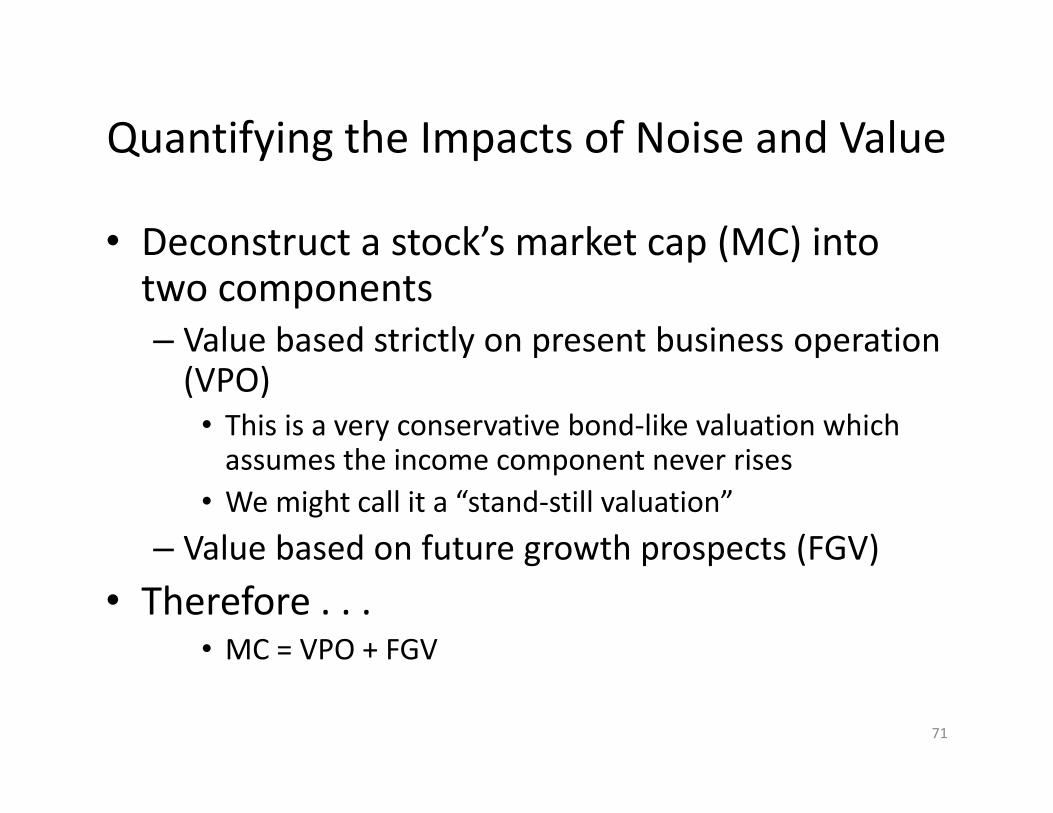
Quantifying the Impacts of Noise and Value
• Deconstruct a stock’s market cap (MC) into two components
– Value based strictly on present business operation (VPO)
• This is a very conservative bond-like valuation which assumes the income component never rises
• We might call it a “stand-still valuation”
– Value based on future growth prospects (FGV)
• Therefore . . .• MC = VPO + FGV
71

VPO is easy to calculate
• VPO = NOPAT / CC– Where
• NOPAT = Net Operating Profit After Tax
• CC = Cost of Capital
• NOPAT = Operating profit * (1 – tax rate)– For this purpose, Operating Profit = EBIT
– We see many abnormal tax rates in the real world• You can simply eliminate such stocks, or just assume all tax rates are
normal; i.e. NOPAT = Oper Prof * .65
• CC can be incredibly difficult to calculate– For our purposes, it’s OK to just pick a simple heuristic
assumption, like .07
• Therefore, VPO = (OpProf *.65) / .07
72
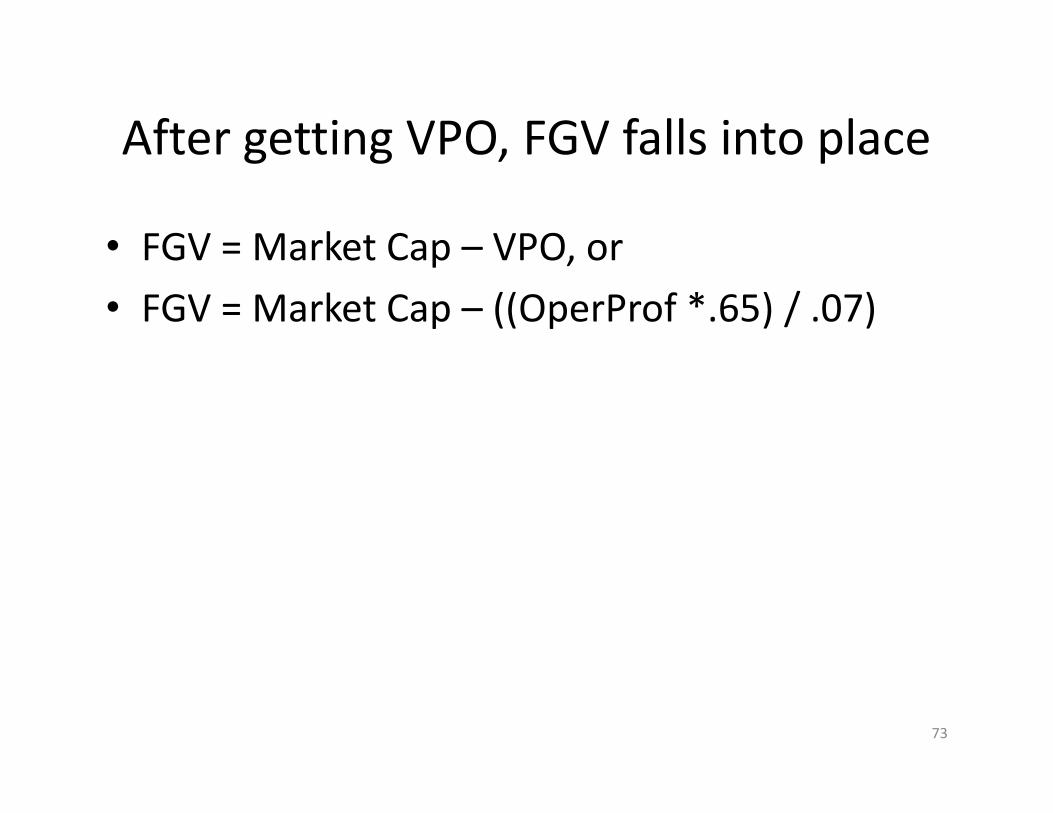
After getting VPO, FGV falls into place
• FGV = Market Cap – VPO, or
• FGV = Market Cap – ((OperProf *.65) / .07)
73
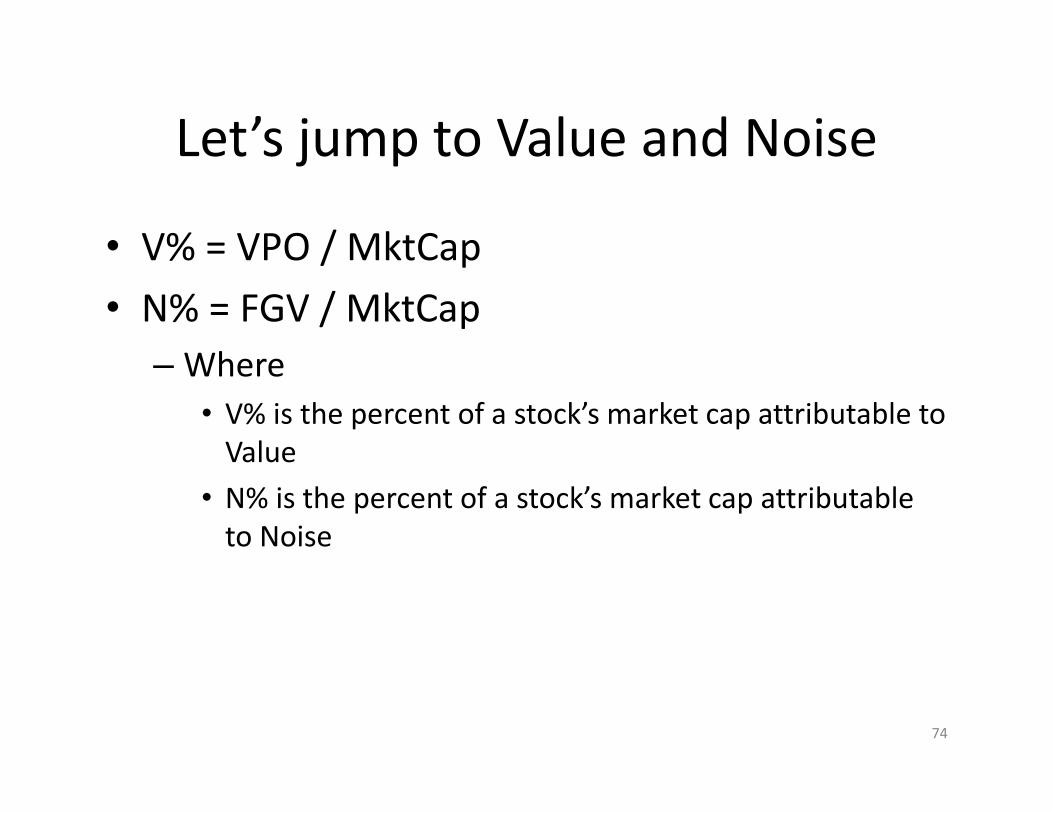
Let’s jump to Value and Noise
• V% = VPO / MktCap
• N% = FGV / MktCap
– Where
• V% is the percent of a stock’s market cap attributable to
Value
• N% is the percent of a stock’s market cap attributable
to Noise
74

A Simple Back-of-the-Envelope Formula to
Calculate the Impact of Noise in a Stock Price
• N = (Mkt Cap – ((OperProf *0.65) / 0.07))/MktCap
– Recall that
• OperProf, for this purpose, is the same as EBIT
• 0.65 is a simplistic across-the-board assumption for 1-TaxRate
• 0.07 is a shorthand heuristic assumption for cost of capital

A Bit of Cheating
• We assumed that FGV = Noise, based on an assumed “standstill valuation”
• In truth, we know that FGV = RG + NG + PN– Where
• RG = realistic growth expectations
• NG = noise-based growth expectations
• PN = pure noise
• To go forward, we’ll have to assume that RG is always zero– We’ll live with that
• Value gurus often talk about a margin of safety; here it is
– Unlike with DDM, DCF, etc. etc. etc., we’re not going to pretend to be more precise than we can actually be
– Our estimate of Noise is likely to be a bit overstated, but as long as we understand that and refrain from getting carried away with specifics, we can live with this, and even use it for screening and analysis
76

Value as a % or Market Cap• Quantified using the previously-described technique – sector medians
• Value is important, but it doesn’t stand alone
• Value tends to be more stable
– Many near- and intermediate-term stock price are likely to be noise driven
• Can you see a link between value % and ability to calculate value?
77
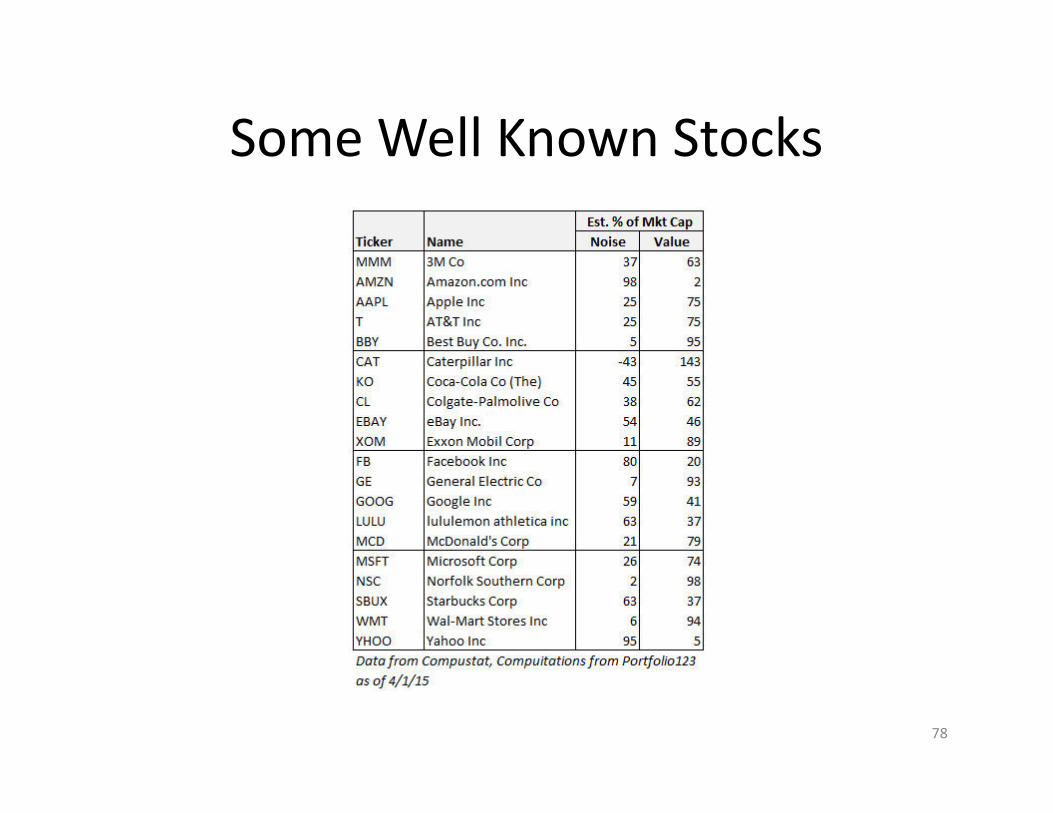
Some Well Known Stocks
78
What it Means
• Unless we expect arbitrage costs to be zero (which is not the case), we cannot expect stock prices to strictly be equal to value
• Noise is a normal part of the market’s equilibrium condition
– It cannot be dismissed as an unfortunate circumstance
– We cannot sit back and sneer or hope it will be conquered by investor education
– We CAN factor it into our approaches to stock finding and analysis
79
Noise-Value Calibrator:
The Excel Spreadsheet
80
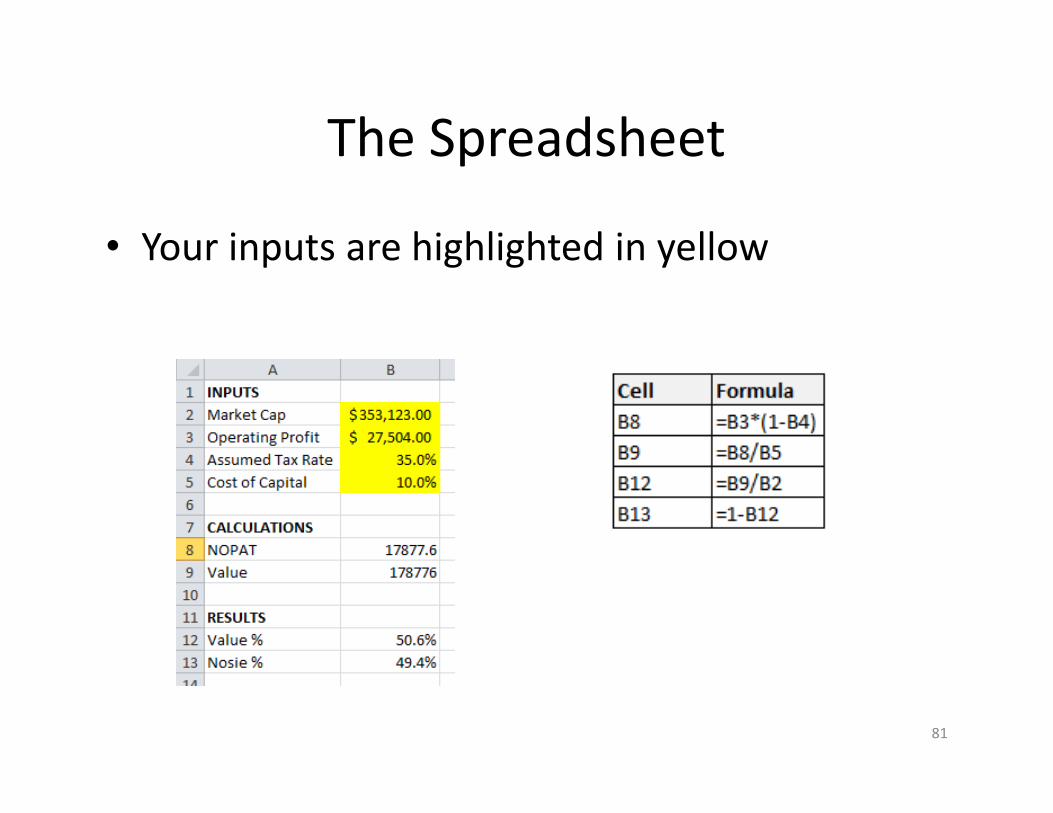
The Spreadsheet
• Your inputs are highlighted in yellow
81
Tool 2: Residual Income
Model (RIM) Calculator
1. The Approach
2. The Items
3. The Excel Spreadsheet
82
The RIM Approach
83
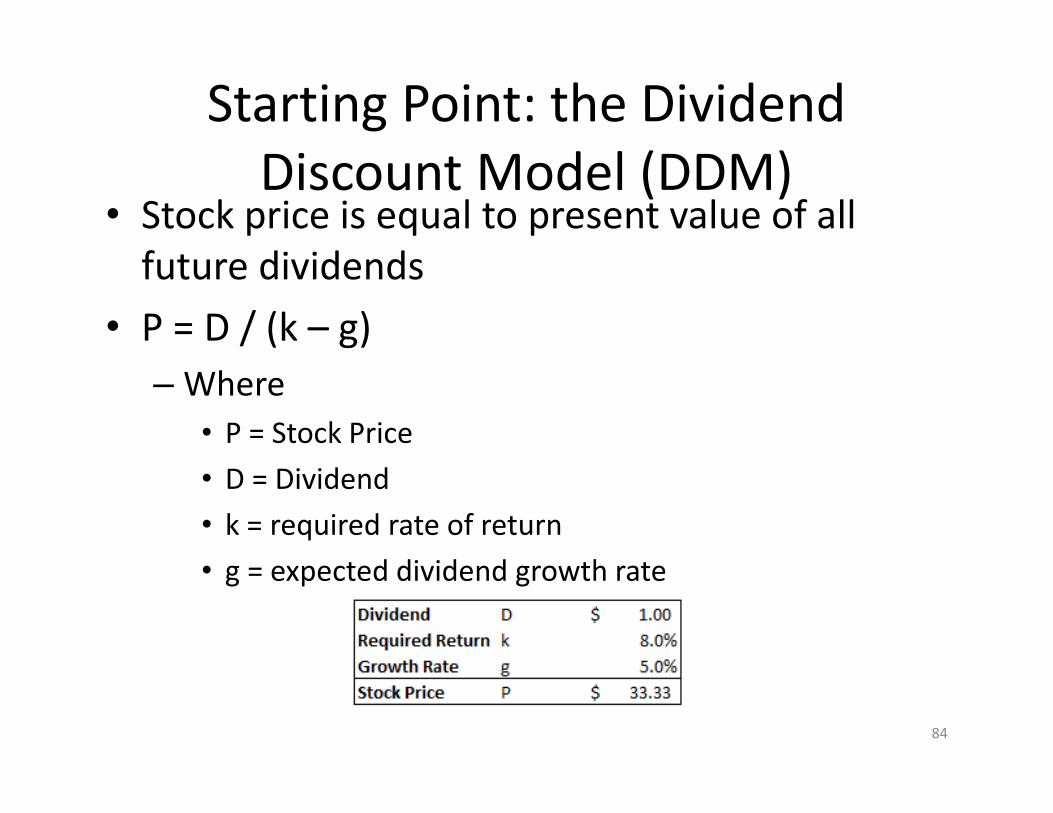
Starting Point: the Dividend
Discount Model (DDM)• Stock price is equal to present value of all
future dividends
• P = D / (k – g)
– Where
• P = Stock Price
• D = Dividend
• k = required rate of return
• g = expected dividend growth rate
84
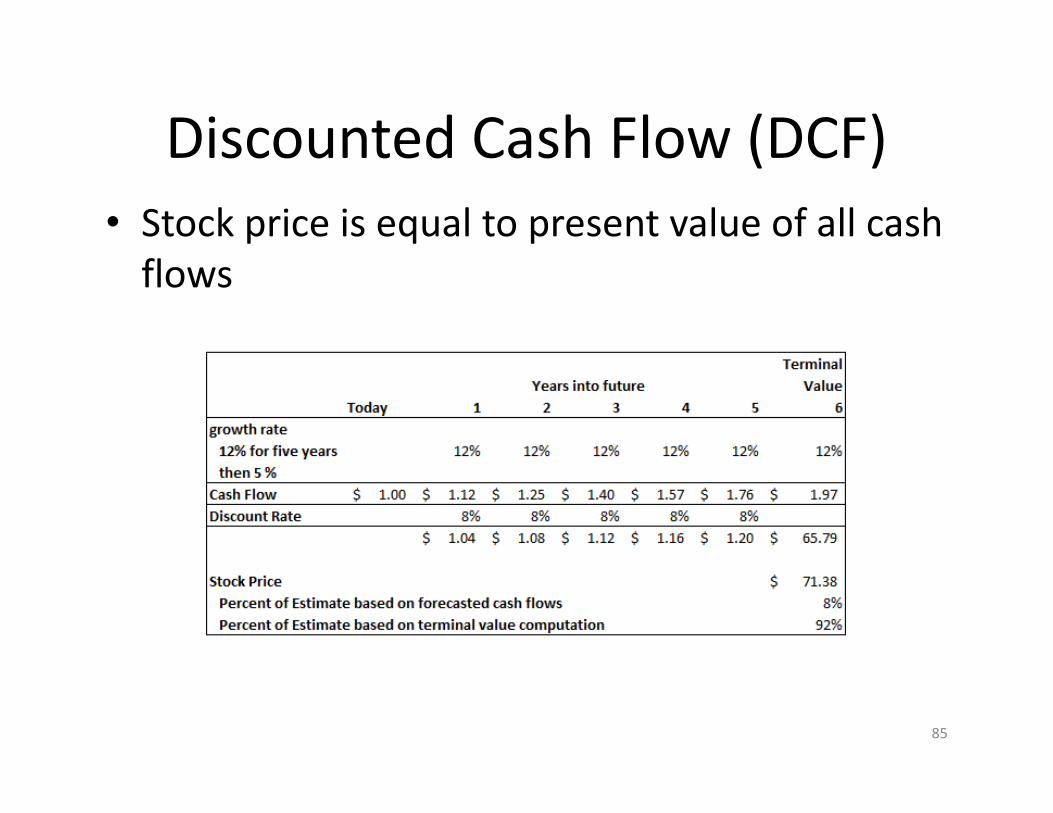
Discounted Cash Flow (DCF)
• Stock price is equal to present value of all cash
flows
85

Problems with DCF
• It’s hard enough to predict one quarter ahead
• Do we seriously think it’s possible to predict cash flows five, 10 or haven forbid 15 years ahead! – I know I talked about being vaguely right or being less wrong
than other, but there have to be limits to everything• There’s a difference between being imprecise or less wrong, versus
being just-plain whacky
• Although we can never eliminate the need to predict, we should, at least, try our best to cope by:– Making as smaller number of predictions as possible, and
– Trying to have as many of those predictions be of items that are less unpredictable
• DCF doe not mitigate the predictability problem. It maximizes it!
86
RIM as an Alternative to DCF
• Its Much Simpler
– Only 8 inputs into an Excel spreadsheet (one of
which is the current stock price)
• Its More effective
– The main driver of this model is return on equity,
a metric that’s extremely relevant to determining
company quality and which tends to be stable
over time
• It minimizes the unpredictability problem
87
RIM Calculator:
The Items
88
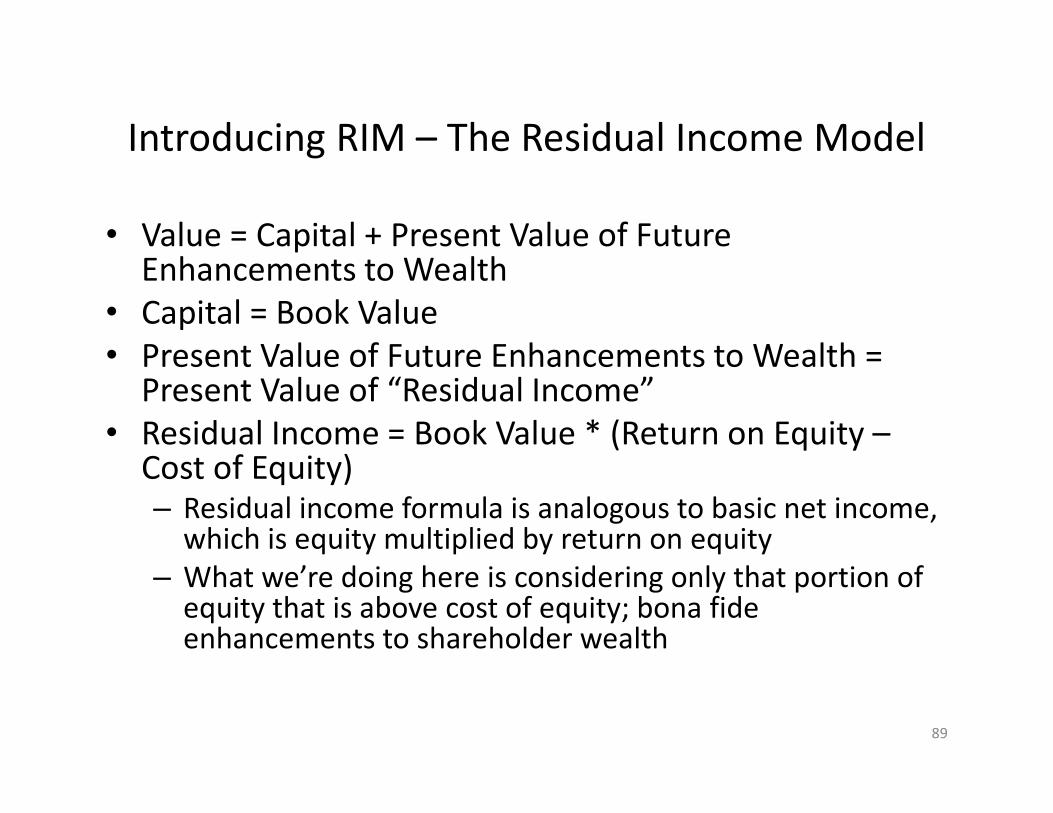
Introducing RIM – The Residual Income Model
• Value = Capital + Present Value of Future Enhancements to Wealth
• Capital = Book Value
• Present Value of Future Enhancements to Wealth = Present Value of “Residual Income”
• Residual Income = Book Value * (Return on Equity –Cost of Equity)– Residual income formula is analogous to basic net income,
which is equity multiplied by return on equity
– What we’re doing here is considering only that portion of equity that is above cost of equity; bona fide enhancements to shareholder wealth
89
RIM Calculator:
The Spreadsheet
90
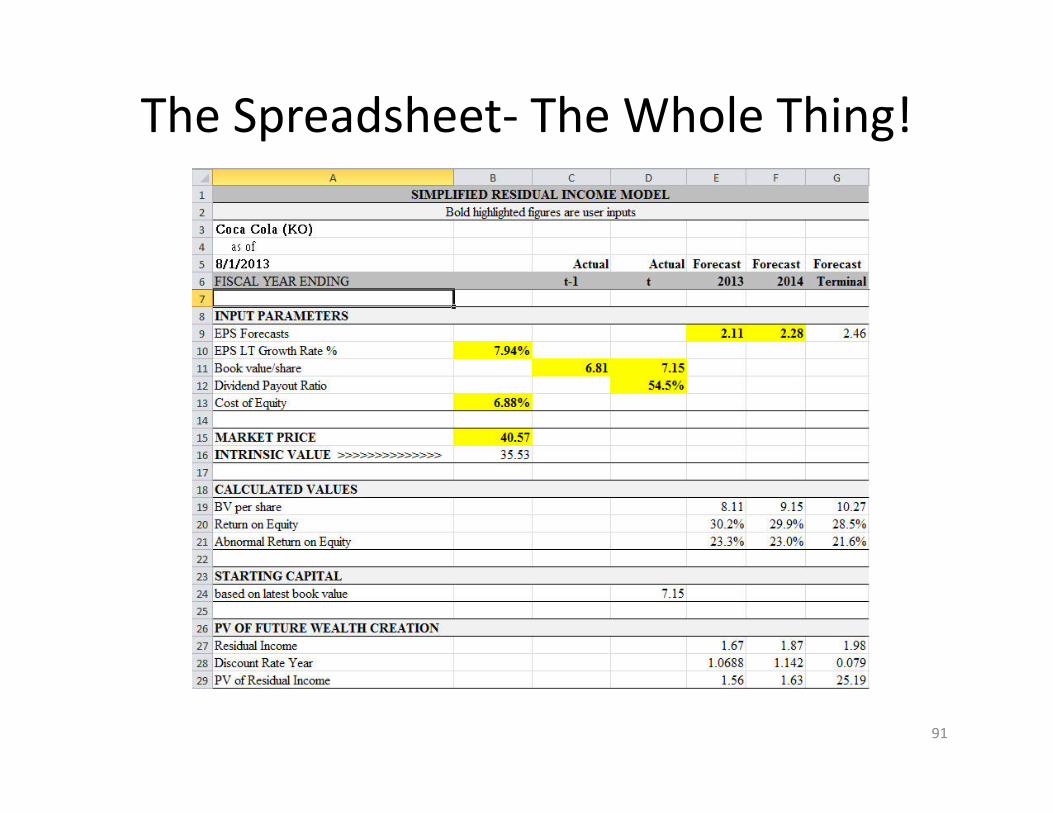
The Spreadsheet- The Whole Thing!
91
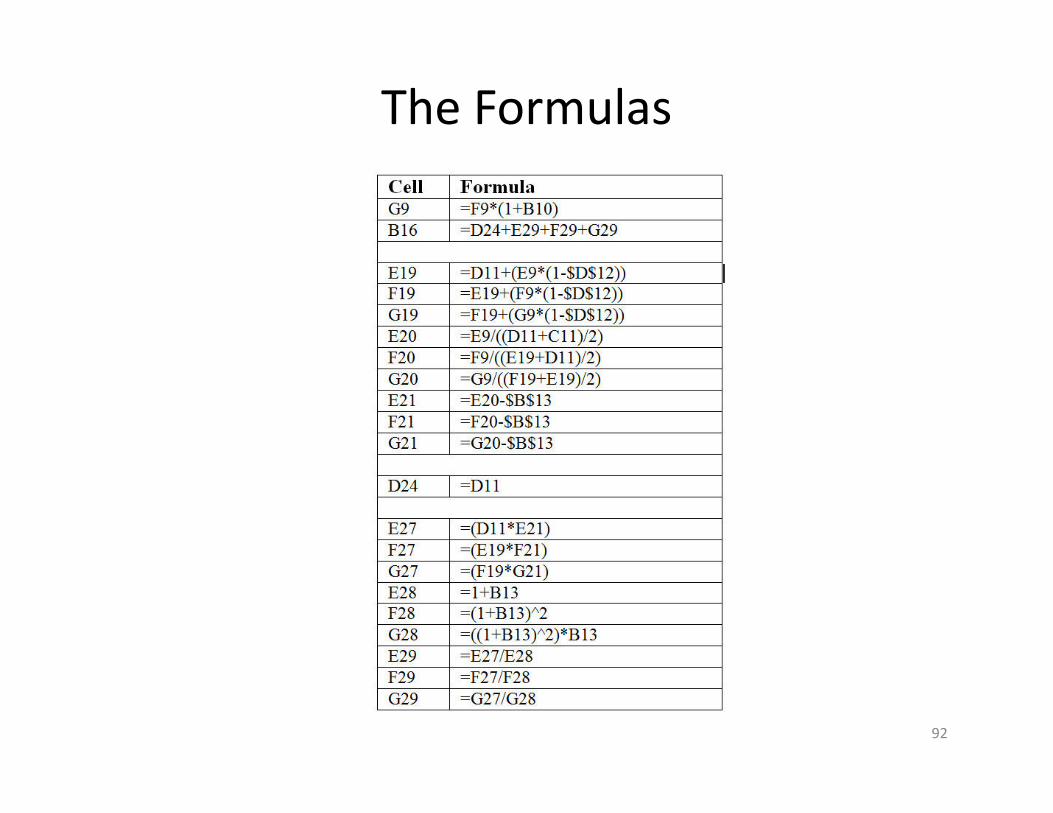
The Formulas
92
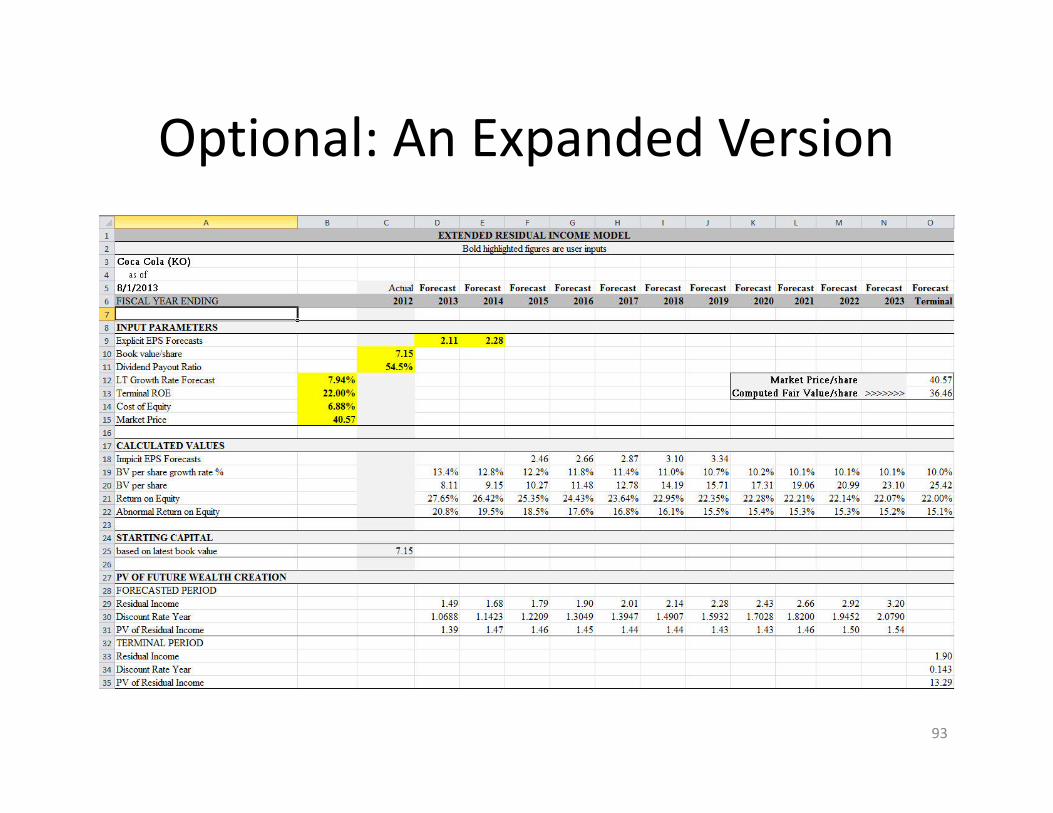
Optional: An Expanded Version
93
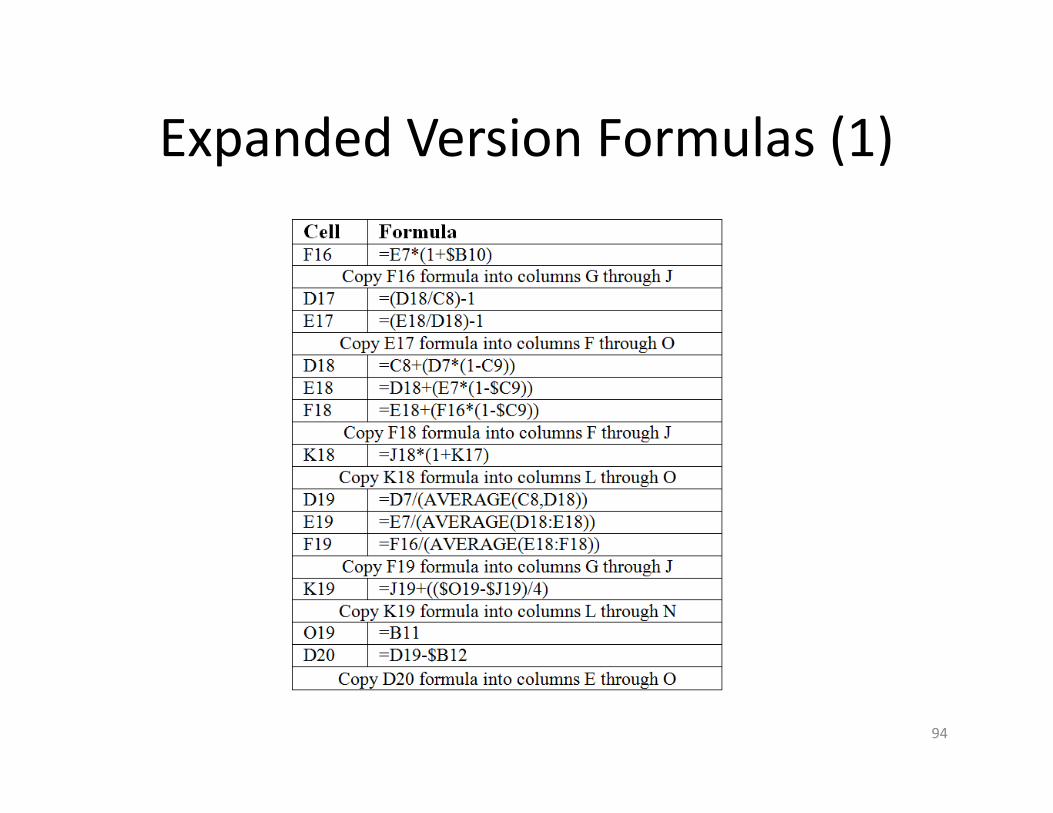
Expanded Version Formulas (1)
94
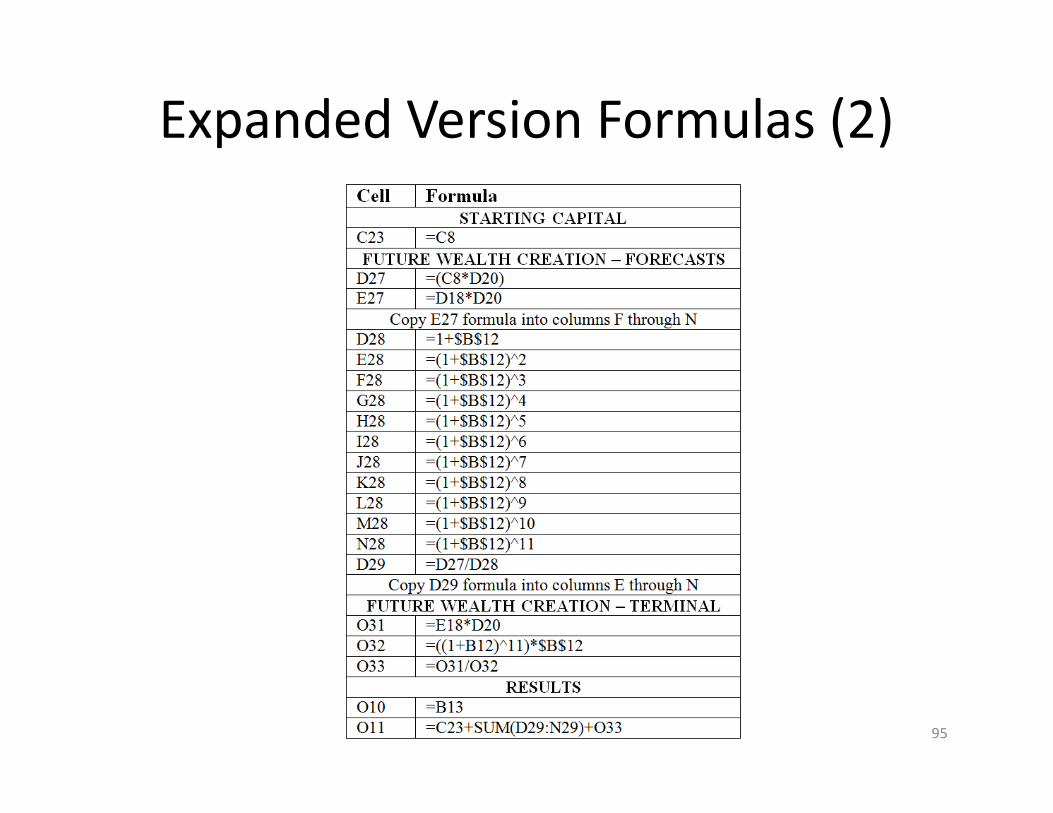
Expanded Version Formulas (2)
95

Thank You!
96