Guelph’s Financial Strategy...
74
Guelph’s Financial Strategy 2014
Transcript of Guelph’s Financial Strategy...

Guelph’s Financial Strategy 2014

City of Guelph – Capital Investment Strategy: 2014–2023 proposed Capital Budget and Forecast
GUELPH’S FINANCIAL STRATEGY
Guelph is one of Canada’s most livable cities - a testament to this community’s commitment to Guelph’s vision: “Be a city that makes a di� erence acting locally and globally to improve the lives of residents, the broader community and the world.” Guelph is a dynamic, collaborative and innovative urban centre o� ering a high quality of life for residents, and a sustainable, prosperous environment for businesses and community bene� t organizations.
Despite several years of global economic crisis, Guelph’s � nancial position remains strong and stable, and steadily improves as re� ected in its increasing credit rating. Because the City integrates strategic and � nancial planning, Guelph has a solid foundation that drives the decisions which sustain our local competitive edge, and attract diversity, talent, and innovative business opportunities.
This solid foundation is built on Guelph’s Corporate Strategic Plan—a transformational plan focused on shaping an exceptional community. It anticipates a range of capital projects and programs and services ensuring Guelph continues to be a well-designed, safe, inclusive and appealing city. The plan includes an ambitious program for change in local government with focus on innovation; delivering exceptional municipal service, value and excellence; and running an exceptional municipal government. It sets priorities and provides a road map of strategic directions and key performance indictors to guide Council’s annual budget decision making.
Guelph’s Financial Strategy brings together several capital and operating strategies informed by the work of the Corporation including Council-approved strategies, master plans, program and service assessments, reports and workshops. It includes expenses and revenues which are tax-supported, non-tax-supported and secured from other funding sources, and explains the City’s controllable and uncontrollable obligations. The strategy includes the budgets of Local Boards and Shared Service agencies which meet their capital and operating needs according to a range of strategies, plans and proposals.
Together, the Corporate Strategic Plan and Guelph’s Financial Strategy seek to balance a wide range of competing needs within a multi-year budget framework built to provide greater transparency, con� dence, predictability and prosperity for residents today and for the generations to come.
Guelph’s Financial Strategy will be presented to City Council in four sections:• Capital Investment Strategy: 2014-2023 proposed Capital Budget and Forecast• Non Tax-supported Strategy: 2014 proposed Operating and Capital Budget and Forecast• Tax-supported Operating Strategy: 2014 proposed Operating Budget and Forecast• Local Boards and Shared Services Strategy: 2014 proposed Operating and Capital Budget
>> Introduction

Capital Investment Strategy2014–2023 proposed Capital Budget and Forecast

City of Guelph – Capital Investment Strategy: 2014–2023 proposed Capital Budget and Forecast
CAPITAL INVESTMENT STRATEGY: 2014–2023
The proposed 2014-2023 Capital Budget and Forecast represents management’s response to the challenge of balancing a wide and complex range of short-term and long-term needs within existing resources.
The sta� -recommended 2014 capital budget represents funding at 18 per cent of last year’s net tax levy; two per cent lower than the Council-approved capital funding guideline of 20 per cent.
When planning capital investments the City looks for innovative ways to fund capital projects like grants, partnerships, and funding from other levels of government to reduce the burden on Guelph taxpayers.
This document re� ects direction from Guelph City Council, continued input from community members, and the strategic focus areas of the City’s Corporate Strategic Plan —organizational excellence, innovation in local government and city building.
>> Taking care of what we ownWhen prioritizing investments in land, buildings, roads, sewers, parks, trails, vehicles, and other capital assets, the City’s � rst consideration is the health and safety of people living, working, studying, visiting and travelling in Guelph.
Keeping Guelph’s facilities and infrastructure in good repair, ensuring accessibility, and meeting Guelph’s legislated requirements are critical parts of every municipal budget, and have been at the core of Guelph’s capital investment strategy for several years.
The table below shows how the City ensures su� cient funds are available to renew and enhance its capital infrastructure. Guelph’s infrastructure renewal reserves re� ect a percentage of the net book value of its assets as reported in the most recent � nancial statements.
Infrastructure Renewal Guidelines (‘000s)2010 2011 2012 2013 2014
Buildings $1,750 $2,950 $3,252 $5,483 $5,191
Guideline = 2% 1.79% 2.38% 2.35% 3.38% 3.14%
Transportation and Stormwater $4,022 $7,378 $8,598 $8,716 $9,535
Guideline = 2-3% 1.64% 2.95% 3.26% 3.01% 2.95%
Vehicle and Equipment $6,132 $5,977 $9,548 $11,191 $9,106
Guideline = 10% 10.16% 9.33% 13.97% 18.26% 12.19%

City of Guelph – Capital Investment Strategy: 2014–2023 proposed Capital Budget and Forecast
CAPITAL INVESTMENT STRATEGY: 2014–2023
>> Enhancing Guelph’s quality of lifeTo respond to the needs of Guelph’s increasingly diverse and growing community, the City invests in new facilities and infrastructure designed to enhance Guelph’s quality of life. These strategic investments are driven by the City’s mission “to build an exceptional city, by providing outstanding municipal service and value”.
Once the City determines which investments are necessary to maintain critical infrastructure and capital assets, any new projects are evaluated based on direction from City Council, input from community members, the City’s Corporate Strategic Plan, Guelph’s � nancial policies, and the impact on Guelph’s annual operating budget and property taxes. This way, the City ensures new community enhancement projects are a� ordable for taxpayers, and maintain Guelph’s strong � nancial position.
City of Guelph – Capital Investment Strategy: 2014–2023 proposed Capital Budget and Forecast
CAPITAL INVESTMENT STRATEGY: 2014–2023
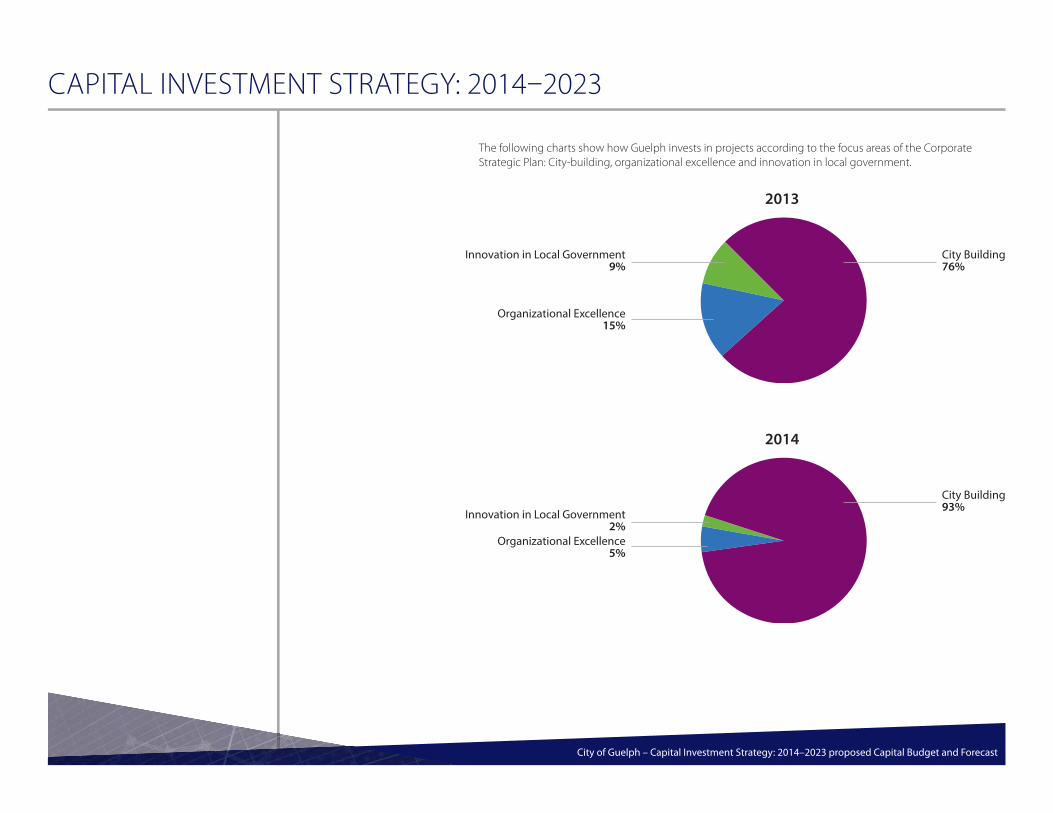
Innovation in Local Government9%
Organizational Excellence15%
City Building76%
2013
Innovation in Local Government2%
Organizational Excellence5%
City Building93%
2014
The following charts show how Guelph invests in projects according to the focus areas of the Corporate Strategic Plan: City-building, organizational excellence and innovation in local government.

City of Guelph – Capital Investment Strategy: 2014–2023 proposed Capital Budget and Forecast
CAPITAL INVESTMENT STRATEGY: 2014–2023
>> Dealing with debtThe City’s recently upgraded AA+ credit rating re� ects Guelph’s responsible debt management, and shows how Guelph’s � nancial policies are serving taxpayers and the organization well.
To further strengthen the City’s overall � nancial position, Guelph plans to continue reducing its use of debt to fund capital projects. With very few exceptions, debt-� nanced projects are not included in the proposed 10-year capital forecast. These exceptions are outlined in the highlights section, and a full debt continuity schedule is included in Appendix A.

City of Guelph – Capital Investment Strategy: 2014–2023 proposed Capital Budget and Forecast
CAPITAL INVESTMENT STRATEGY: 2014–2023
The following graph shows Guelph’s plans to signi� cantly reduce its outstanding debt balances over the next 10 years to less than $63.7 million. It also compares the City’s total debt to the maximum set out in Guelph’s Council-approved Debt Policy.
Debt balanceCurrent and proposed (’000s)
$200,000
$250,000
$150,000
$100,000
$50,000
$0
20132010 2011 20122009 2014 20162015 20182017 2020 2021 2022 20232019
Current and 2014 proposed
Current and Ten year proposed
Maximum as per Debt Policy
Current obligations
Maximum as per Debt Policy – maximum allowable under Council-approved Debt Policy (55% of own source revenue) increases with Guelph’s tax base
Current obligations – all current and approved debt obligations (refer to following table)
Current and 2014 proposed – impact of debt funding included in the proposed 2014 capital budget; the two peaks correspond with legislatively required $11.9 million investment in the Wellington Du� erin Guelph Public Health Facility, and $34 million investment in required upgrades at the Guelph Police Headquarters
Current and ten year proposed – impact of debt funding in the proposed 2015–2023 capital forecast; subject to change based on Council approval of any future debt funded projects with sound business cases.

City of Guelph – Capital Investment Strategy: 2014–2023 proposed Capital Budget and Forecast
CAPITAL INVESTMENT STRATEGY: 2014–2023
Current approved and proposed debt funding (‘000s)Current approved obligations 2014-2023 proposed
Project descriptionYear of issue Amount
Tax, DC or other funded debt
Year of issue Amount
Tax, DC or other funded debt
Previously Issued Debt Various $103,698 Various
Downtown Public Realm (RD0168) 2014 $5,163 Tax
Carden Street (RD0263) 2014 $1,200 Tax
Baker St. Redevelopment (SS0007, SS0018, SS0019, SS0020) 2014 $5,295 Tax 2014 $755 Tax
Automated Waste Collection Carts (WC0001) 2014 $5,200 Tax
Victoria Road Recreation Centre Renovation (RF0051) 2015–2016 $150 Tax 2015–2016 $7,000 Tax
Police Headquarters Renovations (PS0033) 2016–2017 $1,157 Tax 2016–2017 $20,408 Tax
Clair/Laird Interchange (RD0267) 2015–2016 $500 DC 2015–2016 $13,000 DC
Public Health Facilitiy - City contribution (GG0227) 2014 $11,889 Tax
Wellington Park - Downtown Secondary Plan (PK0071) 2023 $9,000 Other
Notes: The � rst section (Current approved obligations) shows Guelph’s outstanding debt balance as of December 31, 2013 and all debt-funded projects already approved by Council for which the debt has not yet been issued.
The second section shows debt-funded projects in the proposed 2014-2023 Capital Budget and Forecast.
Construction of the Laird/Clair/Hanlon Interchange, a $13.5 million project legislatively required by the province, drives the City over the Council-approved Development Charge-funded debt limit in 2016. As the project proceeds, the City will continue reporting on its DC funded debt.

City of Guelph – Capital Investment Strategy: 2014–2023 proposed Capital Budget and Forecast
HIGHLIGHTS OF GUELPH’S CAPITAL INVESTMENT STRATEGY
The 2014 proposed capital budget is largely focused on keeping Guelph’s facilities and infrastructure in good repair, ensuring accessibility, and meeting Guelph’s legislated requirements. Here are a few highlights:
Taking care of what we ownBuilding maintenance and repairs• $23.5 million over the next 10 years• Most high and medium risk structural assessments are complete and repairs are scheduled or underway • $5.2 million in repairs are scheduled over the next three years• $1.3 million in continued structural assessments and repairs are scheduled for the next three years of the
capital forecast
Vehicle and equipment projects • $8.2 million in 2014 and $123.5 over the next 10 years• Ongoing replacement of existing assets
Victoria Road Recreation Centre• $7.2 million renovation scheduled for 2014 to 2016 • Upgrade aging facility to meet accessibility requirements and accommodate growth
Transportation network rehabilitation• $5.5 million in 2014• To help address Guelph’s aging infrastructure, upgrades to the city’s existing transportation network include:
improving pavement condition, road rehabilitation and street light replacement• Ongoing infrastructure maintenance and capital asset management
>> What’s in, and why
When determining how best to meet the long-term needs of the community while ensuring a� ordability for taxpayers, the City carefully assesses and prioritizes more than 350 capital plans and projects.
To maintain the City’s critical infrastructure and enhance Guelph’s quality of life, the City considers which investments are important to make and when, how much the City can a� ord each year, how much it will need to save for future years, and how to ensure contingency funds are available in the event of a crisis.

City of Guelph – Capital Investment Strategy: 2014–2023 proposed Capital Budget and Forecast
HIGHLIGHTS OF GUELPH’S CAPITAL INVESTMENT STRATEGY
Enhancing Guelph’s Quality of LifeMajor road expansion projects • Clair/Laird/Hanlon Interchange—$13.5 million DC debt-funded project is required as part of agreement
mandated by the province (Ontario Municipal Board decision)• Silvercreek Parkway/CN Rail Grade Separation—$10.0 million required as part of redevelopment of Lafarge lands• Stone Road expansion from Evergreen Road to Victoria Road—$5.2 including enhanced pedestrian and
cycling facilities
Wellington Street Park Lands• $16 million in 2022, of which $9 million is debt-funded • Land purchase is critical to implementing the Council-approved Downtown Secondary Plan• Project will improve active transportation and trail connections and enhance community spaces along the
Speed River
Eastview Community Park• $200,000 in 2014• additional $6.5 million over the next 5 years• ongoing implementation of Council-approved Community Park Master Plan
Active transportation• $150,000 study in 2014 to better understand the need for pedestrian and cycling facilities in the community• Annual funding of $300,000 starting in 2014 to design and build active transportation facilities • Woodlawn Road is an immediate priority, and the City has identi� ed other areas where funding will be
allocated over the next three years
Skateboard Facility • $100,000 for design in 2014• $700,000 for construction in 2015

City of Guelph – Capital Investment Strategy: 2014–2023 proposed Capital Budget and Forecast
HIGHLIGHTS OF GUELPH’S CAPITAL INVESTMENT STRATEGY
Wellington Du� erin Guelph Public Health• $11.9 million debt-funded City contribution • Legislatively required costs associated with building new, local public health facility
>> What’s changed, and whyEach year, the City reviews its annual capital budget and 10-year forecast to make any necessary adjustments to ensure Guelph’s long-term plans and investments continue to re� ect the needs of the community and the organization.
Taking care of what we ownGuelph Police Headquarters• In 2012 Council approved $13.6 million to upgrade Guelph Police Headquarters • $20.4 million in 2014, total budget $34 million of which $31.6 million is debt-funded• Guelph Police provided updated information about required improvements to upgrade the aging facility,
address legislative and health and safety concerns, accommodate growth, and enhance services. • The proposed capital budget includes this debt-funded project next year with the provision that
Guelph Police Services provides a business case outlining the options considered and substantiating all project costs.
Corporate Technology Strategy• Due to slower than expected launch, development and implementation of the Corporate Technology
Strategy will take place over � ve years rather than three • $259,000 investment is scheduled for 2014, and the progress of the project will be re-evaluated mid-year• Invest $1 million less than forecasted in 2014-15• Invest $600,000 in 2016–17 for a net reduction of $400,000

City of Guelph – Capital Investment Strategy: 2014–2023 proposed Capital Budget and Forecast
HIGHLIGHTS OF GUELPH’S CAPITAL INVESTMENT STRATEGY
In keeping with the City’s commitment to ensure a� ordability for taxpayers, renew essential infrastructure and reduce its use of debt, several sought-after new facilities are not included in the proposed capital budget and forecast. In reviewing and prioritizing hundreds of capital plans and projects each year, many are not included in the forecast due to lack of funding, or incomplete project plans.
The City is working to prepare the following projects for implementation and, when each is supported by a comprehensive business case re� ecting all aspects of funding, planning, building, and operations, the City can schedule an a� ordable and sustainable investment in its long-term � nancial plan. In creating these business cases, the City can consider di� erent funding options including grants or subsidies from other levels of government, partnerships, fundraising or crowd-sourcing, selling existing assets, user fees, special taxes or levies etc.
The City recognizes the importance of these projects and how they will enhance Guelph’s quality of life. The City remains committed to delivering these facilities in future years, and will continue providing updates on these and similar projects at least once a year through the capital budget process.
Enhancing Guelph’s quality of lifeBaker Street Redevelopment• To renew and revitalize Guelph’s downtown, Guelph is planning multi-use development involving public
and private partners• City assembling several properties on and around Baker Street in preparation • City exploring partnership opportunities with other levels of government and the private sector to
determine what to build and how it can be � nanced• Financial commitment would depend on the con� guration of the development and partnership arrangements
Downtown Library• Guelph has outgrown its main library, and recognizes the need for a di� erent facility• City and Library sta� are working to understand the scope and size of facility required, and the potential
impact on the operation of existing Library network• Di� cult to determine potential cost of project when the size and scope have not been established
>> What’s not, and why

City of Guelph – Capital Investment Strategy: 2014–2023 proposed Capital Budget and Forecast
HIGHLIGHTS OF GUELPH’S CAPITAL INVESTMENT STRATEGY
South End Community Centre• The City appreciates the need for a multi-use community facility in Guelph’s south end• An assessment is underway to better understand current and future needs in the area, with an expected
report to council in mid-2014 • The City will develop a business case and funding plan based on the assessment � ndings regarding the
required size of the facility and appropriate amenities
Fire/Emergency Services/Police Joint Training Facility• The three departments are beginning to discuss the need for a joint training facility, and the bene� ts of
sharing a single space
Guelph Farmer’s Market• Renovations made this year ensure it is a safe and functional place to work• City, vendors, and shoppers agree the Guelph Farmers’ Market requires a larger facility• The City is evaluating the needs to determine what actions are appropriate to facilitate the Guelph Farmers’
Market’s continued success
Watson Road Transit Facility Expansion• As the City grows, so does its need for public transit• Guelph Transit requires additional space as service levels continue to expand• The City is investigating the future needs for the facility to ensure any expansion is appropriate and
a� ordable

City of Guelph – Capital Investment Strategy: 2014–2023 proposed Capital Budget and Forecast
2014–2023 PROPOSED CAPITAL BUDGET AND FORECAST
The 10-year capital budget and forecast demonstrates the Corporation’s focus on taking care of what we own and ensuring Guelph’s quality of life.
Types of projects included in the City’s capital budget and forecast include:• Road, bridge and storm water construction• Transit• Vehicle and equipment replacement• Facilities and building asset management• Parks and recreation facilities and amenities• Protective services

City of Guelph – Capital Investment Strategy: 2014–2023 proposed Capital Budget and Forecast
2014–2023 PROPOSED CAPITAL BUDGET AND FORECAST
The City of Guelph’s 2014 Capital Budget total expenditure is $79.7 million allocated by project category and funding sources as shown in the table below. Detailed project listing are included in Appendix B.
2014 Capital Budget by project category and funding source (‘000s)
Project categoryProjectcost
Grants andsubsidies
Federal GasTax Other
DevelopmentCharges (DCs)
DCDebt
Equipmentreplacement
Cityreserves Debt
Roads and Stormwater Systems $23,975 $6,310 $2,865 $4,800 $6,500 $3,500
Policy Planning Studies $581 $331 $250
Solid Waste Management $1,688 $600 $150 $938
Public Works $2,798 $1,613 $1,185
Bylaw Compliance, Security and Licensing —
Park Design and Maintenance $3,423 $2,383 $476 $564
Transit $2,395 $205 $34 $1,902 $254
Culture, Entertainment and Recreation Facilities $2,965 $250 $215 $2,500
Corporate Buildings $2,829 $2,829
Economic Development —
Finance and Public Health $11,889 $11,889
Downtown Improvements $1,400 $645 $755
Community Energy $986 $296 $690
Emergency Services $1,282 $456 $826
Information Technology $1,311 $43 $998 $270
Local Boards $22,222 $8 $1,517 $289 $20,408
Total 2014 $79,744 $205 $6,910 $4,068 $8,193 $6,500 $8,270 $10,046 $35,552

City of Guelph – Capital Investment Strategy: 2014–2023 proposed Capital Budget and Forecast
2014–2023 PROPOSED CAPITAL BUDGET AND FORECAST
Equipment replacement10%
Other5%
DC Debt8%
City reserves13%
Debt 45%
Federal Gas Tax9%
Development Charges10%
2014 Capital Budget by funding source$79.7 million
Emergency Services2%
Solid Waste Management2%
Transit%
Culture, Entertainment and Recreation Facilities4%
Downtown Improvement2%
Finance and other15%
Corporate Buildings4%
Information Technology2%
Local Boards28%
Community Energy1%
Roads and Stormwater Systems 30%
Policy Planning Studies1%
Public Works4%Park Design and Maintenance4%
2014 Capital Budget by project category$79.7 million

City of Guelph – Capital Investment Strategy: 2014–2023 proposed Capital Budget and Forecast
2014–2023 PROPOSED CAPITAL BUDGET AND FORECAST
The City’s 9-year capital forecast is $466.2 million allocated by project category and funding sources as shown in the table below
2015–2023 Capital Budget by project category and funding source (‘000s)
Project CategoryProjectCost
Grants andSubsidies
Federal GasTax Other
DevelopmentCharges (DCs)
DCDebt
EquipmentReplacement
CityReserves Debt
Roads and Stormwater Systems $172,697 $66,643 $10,284 $30,371 $58,899
Policy Planning Studies $3,774 $1,850 $1,924
Solid Waste Management $25,070 $600 $550 $6,500 $12,815 $11,105
Public Works $59,228 $2,334 $38,591 $18,303
Bylaw Compliance, Security and Licensing
$2,255 $2,255
Park Design and Maintenance $69,725 $7,575 $29,590 $4,379 $19,181 $9,000
Transit $29,037 $3,535 $22,163 $3,339
Culture, Entertainment and Recreation Facilities
$8,755 $4,255 $4,500
Corporate Buildings $22,730 $22,730
Economic Development $14,514 $14,514
Finance and other $140 $113 $27
Downtown Improvements —
Community Energy $11,022 $3,307 $7,715
Emergency Services $14,662 $3,868 $652 $10,106 $36
Information Technology $15,547 $468 $13,359 $1,720
Local Boards $16,996 $72 $520 $13,869 $2,535
Total 2015–2023 $466,152 $67,243 $40,638 $68,965 $6,500 $115,282 $154,024 $13,500

City of Guelph – Capital Investment Strategy: 2014–2023 proposed Capital Budget and Forecast
2014–2023 PROPOSED CAPITAL BUDGET AND FORECAST
Equipment replacement25%
Other9%
City reserves33%
Debt 3%
Federal Gas Tax15%
Development Charges15%
2015–2023 Capital Budget by funding source$466.2 million
Emergency Services3%
Solid Waste Management5%
Transit6%
Culture, Entertainment and Recreation Facilities2%
Economic Development3%
Corporate Buildings5%
Information Technology3%
Local Boards4%
Community Energy2%
Roads and Stormwater Systems 37%
Policy Planning Studies1%
Public Works13%
Park Design and Maintenance15%
2015–2023 Capital Budget by project category$466.2 million

City of Guelph – Capital Investment Strategy: 2014–2023 proposed Capital Budget and Forecast
CAPITAL FUNDING SOURCES
When evaluating and prioritizing capital plans and projects, the City considers several di� erent kinds of funding options including but not limited to tax-funded capital reserves, Development Charges, grants or subsidies from other levels of government, partnerships, fundraising, selling existing assets, user fees, special taxes or levies etc.
Di� erent funds can be used for certain types of projects and, in preparing the proposed capital budget, the City balances and combines several funding options to make the best use of all available resources.
Key sources of funding are discussed below, and a complete list of capital funding sources is included in Appendix C.
Reserve funds play a critical role in funding current and future capital projects. According to the City’s capital funding guideline, the City can use up to 20 per cent of the previous year’s net tax levy to fund capital projects; allocating these funds to capital reserves or using them to pay back debt (debt servicing).
The City allocated 18 per cent of last year’s net tax levy to its capital budget to ensure a� ordability for taxpayers and a sustainable � nancial future. The amount is consistent with Guelph’s 2013 budget, and sets the foundation for a predictable and sustainable capital funding plan. These calculations are provided in the following table:
2014–2023 Tax-supported Capital Funding Guideline (‘000s)2014 2015 2016 2017 2018 2019 2020 2021 2022 2023
Assumptions
Levy and Growth Rate Increase % 5% 5% 5% 5% 5% 5% 5% 5% 5% 5%
Prior Year Net Tax Levy A $185,188 $194,447 $204,170 $214,378 $225,097 $236,352 $248,170 $260,578 $273,607 $287,287
Approved Levy and Growth Rate Increase $9,259 $9,722 $10,208 $10,719 $11,255 $11,818 $12,408 $13,029 $13,680 $14,364
Net Taxation Requirement $194,447 $204,170 $214,378 $225,097 $236,352 $248,170 $260,578 $273,607 $287,287 $301,652
% of Net Tax Levy for Capital B 18% 20% 20% 20% 20% 20% 20% 20% 20% 20%
Capital Funding/Debt Servicing (max 20% of Prior Yr Net Tax Levy)
C = B*A $33,334 $38,889 $40,834 $42,876 $45,019 $47,270 $49,634 $52,116 $54,721 $57,457
Debt Servicing (P&I) D $12,474 $14,653 $15,163 $14,860 $16,901 $15,669 $14,848 $14,648 $9,390 $9,703
Capital Funding Available for Projects and Reserves = C - D $20,859 $24,237 $25,671 $28,016 $28,119 $31,601 $34,785 $37,468 $45,331 $47,754
>> Reserve Funds

City of Guelph – Capital Investment Strategy: 2014–2023 proposed Capital Budget and Forecast
CAPITAL FUNDING SOURCES
The proposed 2014 tax-supported capital budget assumes $20.9 million is available for reserve contributions which fund capital projects. This level of funding, while below the maximum that is allowable, is consistent with last year’s budget.
The total proposed budget for debt funding and capital reserve contributions is $33.3 million. This $1.8 million increase over last year re� ects an additional $710,000 to pay back debt, and another $1.1 million to put toward capital reserve funds.
This funding has been allocated between the various reserve types highlighted below, and more detailed information is provided in Appendix D:
2014 Reserve Fund Contributions (‘000s)Capital Tax $2,605
DC Exemption $850
Road Infrastructure $2,385
Building Lifecycle $2,629
Vehicle and Equipment Replacement $9,590
Departmental Reserves $2,800
Total Reserve Contributions $20,859
>> Development ChargesThe City is currently updating its Development Charges (DC) Background Study with a new by-law scheduled for early 2014.
Appendix E identi� es projects that are included in the draft DC Background Study but do not appear in the proposed 2015–2023 Capital Budget and Forecast. As the City secures funding through new sources or reallocates existing capital funds, the capital forecast will be revisited and projects will be re-scheduled to ensure a� ordability for taxpayers, and a sustainable � nancial future for Guelph. The table blow shows the future operating costs associated with projects included in the proposed capital budget and forecast.

City of Guelph – Capital Investment Strategy: 2014–2023 proposed Capital Budget and Forecast
OPERATING IMPACT FROM CAPITAL PROJECTS
2014 Tax Supported Capital Budget Operating Impact (000’s)FTEs 2014 2015 2016
Baker Street Redevelopment Ph4 (SS0020) $30 $63
City wide Skatepark Facility (PK0048) $2
Eastview Community Park (PK0014) $6
Guelph Trails (PK0002) 0.5 $39 $56
IT Strategic Plan (IT0024) 3 $250 $95
Jubilee Park (PK0004) $83
Orin Reid Park - Phase 2 (PK0057) $5
Public Health New 2013 (GG0227) $476 $990
South End Community Park (PK0001) $6
Victoria Road Northview (PK0007) $42
VRRC Expansion/Renovation (RF0051) $882
Total 3.5 $762 $1,230 $1,033

City of Guelph – Capital Investment Strategy: 2014–2023 proposed Capital Budget and Forecast
CAPITAL ASSET MANAGEMENT
The City is developing a Corporate Asset Management Program Policy to standardize and enhance the organization’s approach to capital asset management.
Because of the amount of information available, and priorities established by the Ontario Ministry of Infrastructure when determining eligibility for future provincial funding programs, Guelph will continue to focus on road, water, wastewater and stormwater assets in 2014.
By the end of 2013, the Finance department will present a Corporate Asset Management Program Policy and an overview of the forecasted initiatives for 2014.
In developing this policy, Guelph has taken inventory and tracked all existing assets, their historical costs and expected useful lives, and departments reviewed the current condition and use of speci� c capital assets, to understand the City’s ongoing needs.
As departments gather information and implement new processes, the focus of Guelph’s asset management program will continue to evolve.


City of Guelph
2014 Tax Supported Capital Budget
2015 to 2023 Tax Supported Capital Forecast
Roads
Total
Next Project Grants & Federal DC Net Cost Equipment City
Project Number & Description 2014 2015 2016 2017 2018 5 Years Cost Subsidies Gas Tax Other DC's Debt to City Replacement Reserves Debt
11 Roads Growth
RD0118 TRANSPORT STRATEGY & TDM INIT 100.0 300.0 400.0 200.0 200.0 200.0
RD0122 EASTVIEW - STARWOOD-WATSON 1,200.0 200.0 1,400.0 400.0 700.0 300.0 300.0
RD0265 GORDON- CLAIR TO MALTBY 500.0 2,500.0 2,900.0 5,900.0 4,130.0 1,770.0 1,770.0
RD0267 CLAIR/LAIRD & HANLON INTERCHNG 6,500.0 6,500.0 13,000.0 13,000.0
RD0269 LAIRD: CLAIR TO SOUTHGATE 1,000.0 500.0 1,500.0 1,500.0
RD0270 YORK- VICTORIA TO EAST CITY LIMITS 500.0 5,000.0 4,000.0 1,000.0 10,500.0 5,208.9 3,688.8 1,602.3 1,602.3
RD0271 STONE - EVERGREEN TO VICTORIA 2,500.0 2,700.0 5,200.0 290.0 3,350.0 1,560.0 1,560.0
RD0272 VICTORIA- YORK TO STONE II 350.0 3,300.0 300.0 3,950.0 2,765.0 1,185.0 1,185.0
RD0273 SILVERCREEK PKWY/CN SEP 5,000.0 5,000.0 10,000.0 5,000.0 3,500.0 1,500.0 1,500.0
RD0274 INT SPEEDVALE & DELHI 1,000.0 1,000.0 500.0 500.0 500.0
RD0285 STARWOOD- WATSON TO GRANGE (SA) 190.0 190.0 190.0
RD0286 NISKA BRIDGE REPL 1,750.0 250.0 2,000.0 1,400.0 600.0 600.0
RD0308 ELMIRA: FIFE TO WR124 EXTENSION 5,000.0 5,000.0 3,500.0 1,500.0 1,500.0
RD0309 CITYVIEW 125.0 125.0 125.0
RD0310 GORDON: EDINBURGH TO LOWES 150.0 1,350.0 1,500.0 750.0 750.0
RD0312 INT COLLEGE & SCOTTSDALE 1,600.0 1,600.0 800.0 800.0 800.0
RD0313 INT SPEEDVALE & SILVERCREEK 1,800.0 1,800.0 900.0 900.0 900.0
RD0316 INT DOWNEY & NISKA 200.0 200.0 100.0 100.0 100.0
RD0318 HART'S LANE WEST GORDON TO WEST 100.0 1,250.0 150.0 1,500.0 750.0 750.0
RD0319 COLLEGE: VICTORIA TO DUNDAS LANE 200.0 1,500.0 300.0 2,000.0 2,000.0
RD0320 VICTORIA: ARKELL TO CLAIR 6,000.0 6,000.0 750.0 2,250.0 3,000.0 3,000.0
RD0321 ACTIVE TRANSPORTATION 300.0 300.0 300.0 300.0 300.0 1,500.0 3,000.0 1,500.0 900.0 600.0 600.0
RD0322 ACTIVE TRANSPORTATION STUDY 150.0 150.0 150.0
TF0001 STARWOOD & WATSON TRAFFIC SIGNALS 150.0 150.0 150.0
Total 11 Roads Growth 15,725.0 17,200.0 9,690.0 6,650.0 8,400.0 20,400.0 78,065.0 1,500.0 13,148.9 34,298.8 13,000.0 16,117.3 16,117.3
12 Roads Non-Growth
PL0040 SITE MONITORING & REMEDIATION 50.0 75.0 75.0 700.0 900.0
RB0002 SPEEDVALE AVE BRIDGE 1,500.0 1,500.0 1,200.0 300.0 300.0
RB0003 BRIDGE RECONSTRUCTION 300.0 200.0 200.0 2,700.0 3,400.0 400.0 3,000.0 3,000.0
RD0168 DOWNTOWN PUBLIC REALM 1,000.0 600.0 4,800.0 6,400.0 800.0 5,600.0 5,600.0
RD0276 PAVEMENT DEFICIT 2,000.0 2,000.0 2,000.0 2,000.0 2,500.0 17,082.0 27,582.0 22,065.6 5,516.4 5,516.4
RD0277 CIP ROAD UPGRADES 250.0 1,000.0 1,000.0 1,000.0 1,000.0 5,000.0 9,250.0 7,100.0 2,150.0 2,150.0
RD0278 WYNDHAM- CARDEN TO WOOLWICH 400.0 1,500.0 1,000.0 300.0 3,200.0 1,400.0 1,800.0 1,800.0
RD0280 MAJOR ROAD RECONSTRUCTION 2,250.0 1,500.0 1,500.0 1,500.0 2,500.0 13,950.0 23,200.0 18,210.0 4,990.0 4,990.0
RD0281 MINOR ROAD RECONSTRUCTION 350.0 350.0 350.0 500.0 500.0 2,450.0 4,500.0 2,000.0 2,500.0 2,500.0
RD0284 STRUCTURE REHABILITATION 150.0 150.0 1,300.0 1,600.0 520.0 1,080.0 1,080.0
RD0317 INT WOOLWICH & SPEEDVALE 750.0 750.0 750.0 750.0
SL0001 INFRA SUSTAIN- STREETLIGHTS 300.0 300.0 300.0 300.0 500.0 2,100.0 3,800.0 960.0 2,840.0 2,840.0
Total 12 Roads Non-Growth 5,850.0 6,650.0 7,850.0 6,875.0 8,025.0 50,832.0 86,082.0 54,655.6 30,526.4 30,526.4
Total Roads 21,575.0 23,850.0 17,540.0 13,525.0 16,425.0 71,232.0 164,147.0 56,155.6 13,148.9 34,298.8 13,000.0 46,643.7 46,643.7
Gross Project Cost ('000s) Sources of External Funding
3.1
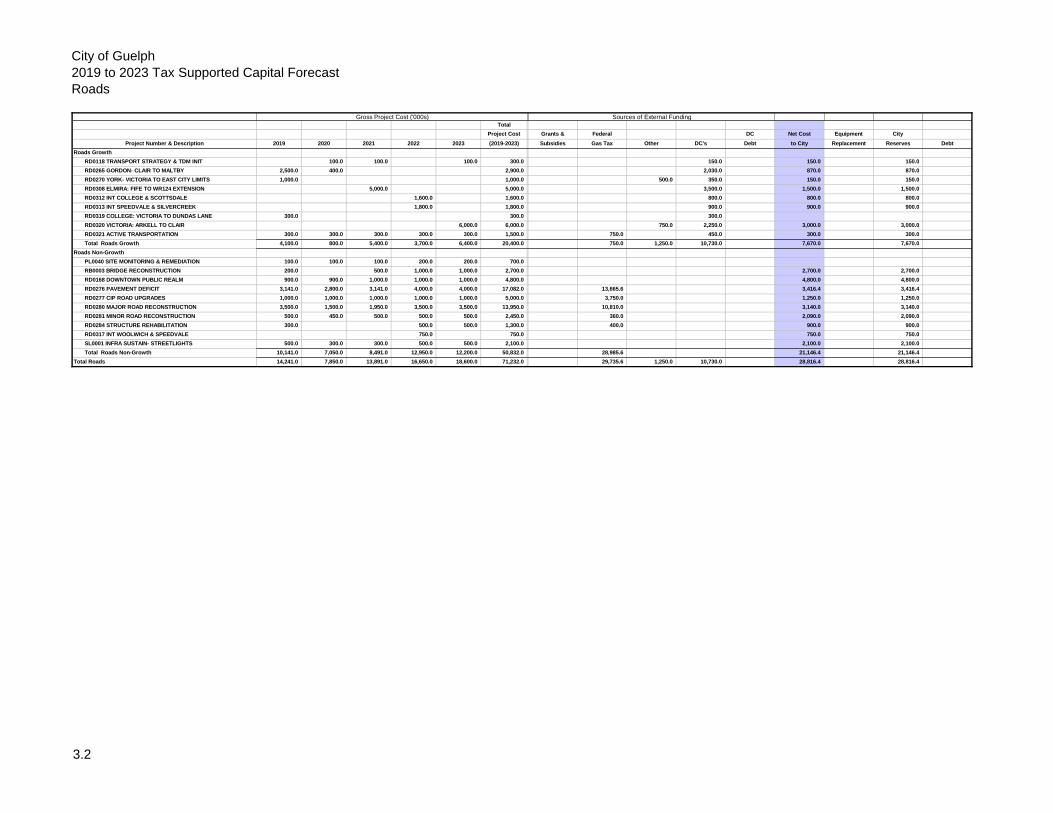
City of Guelph
2019 to 2023 Tax Supported Capital Forecast
Roads
Total
Project Cost Grants & Federal DC Net Cost Equipment City
Project Number & Description 2019 2020 2021 2022 2023 (2019-2023) Subsidies Gas Tax Other DC's Debt to City Replacement Reserves Debt
Roads Growth
RD0118 TRANSPORT STRATEGY & TDM INIT 100.0 100.0 100.0 300.0 150.0 150.0 150.0
RD0265 GORDON- CLAIR TO MALTBY 2,500.0 400.0 2,900.0 2,030.0 870.0 870.0
RD0270 YORK- VICTORIA TO EAST CITY LIMITS 1,000.0 1,000.0 500.0 350.0 150.0 150.0
RD0308 ELMIRA: FIFE TO WR124 EXTENSION 5,000.0 5,000.0 3,500.0 1,500.0 1,500.0
RD0312 INT COLLEGE & SCOTTSDALE 1,600.0 1,600.0 800.0 800.0 800.0
RD0313 INT SPEEDVALE & SILVERCREEK 1,800.0 1,800.0 900.0 900.0 900.0
RD0319 COLLEGE: VICTORIA TO DUNDAS LANE 300.0 300.0 300.0
RD0320 VICTORIA: ARKELL TO CLAIR 6,000.0 6,000.0 750.0 2,250.0 3,000.0 3,000.0
RD0321 ACTIVE TRANSPORTATION 300.0 300.0 300.0 300.0 300.0 1,500.0 750.0 450.0 300.0 300.0
Total Roads Growth 4,100.0 800.0 5,400.0 3,700.0 6,400.0 20,400.0 750.0 1,250.0 10,730.0 7,670.0 7,670.0
Roads Non-Growth
PL0040 SITE MONITORING & REMEDIATION 100.0 100.0 100.0 200.0 200.0 700.0
RB0003 BRIDGE RECONSTRUCTION 200.0 500.0 1,000.0 1,000.0 2,700.0 2,700.0 2,700.0
RD0168 DOWNTOWN PUBLIC REALM 900.0 900.0 1,000.0 1,000.0 1,000.0 4,800.0 4,800.0 4,800.0
RD0276 PAVEMENT DEFICIT 3,141.0 2,800.0 3,141.0 4,000.0 4,000.0 17,082.0 13,665.6 3,416.4 3,416.4
RD0277 CIP ROAD UPGRADES 1,000.0 1,000.0 1,000.0 1,000.0 1,000.0 5,000.0 3,750.0 1,250.0 1,250.0
RD0280 MAJOR ROAD RECONSTRUCTION 3,500.0 1,500.0 1,950.0 3,500.0 3,500.0 13,950.0 10,810.0 3,140.0 3,140.0
RD0281 MINOR ROAD RECONSTRUCTION 500.0 450.0 500.0 500.0 500.0 2,450.0 360.0 2,090.0 2,090.0
RD0284 STRUCTURE REHABILITATION 300.0 500.0 500.0 1,300.0 400.0 900.0 900.0
RD0317 INT WOOLWICH & SPEEDVALE 750.0 750.0 750.0 750.0
SL0001 INFRA SUSTAIN- STREETLIGHTS 500.0 300.0 300.0 500.0 500.0 2,100.0 2,100.0 2,100.0
Total Roads Non-Growth 10,141.0 7,050.0 8,491.0 12,950.0 12,200.0 50,832.0 28,985.6 21,146.4 21,146.4
Total Roads 14,241.0 7,850.0 13,891.0 16,650.0 18,600.0 71,232.0 29,735.6 1,250.0 10,730.0 28,816.4 28,816.4
Gross Project Cost ('000s) Sources of External Funding
3.2

City of Guelph
2014 Tax Supported Capital Budget
2015 to 2023 Tax Supported Capital Forecast
Storm Water Management
Total
Next Project Grants & Federal DC Net Cost Equipment City
Project Number & Description 2014 2015 2016 2017 2018 5 Years Cost Subsidies Gas Tax Other DC's Debt to City Replacement Reserves Debt
11 Storm Water Growth
SW0049 HANLON CREEK STORM 200.0 200.0 200.0
SW0061 WATERSHED STUDY UPDATES 100.0 100.0 72.0 28.0 28.0
SW0066 STORMWATER DRAINAGE OVERSIZING 150.0 150.0 300.0 300.0
SW0068 SERVICING STUDIES 300.0 300.0 300.0
Total 11 Storm Water Growth 150.0 350.0 100.0 300.0 900.0 872.0 28.0 28.0
12 Storm Water Non-Growth
SW0051 SWM POND REHABILITATION 350.0 350.0 1,700.0 2,400.0 280.0 2,120.0 2,120.0
SW0056 CIP STORM SEWER REPL 2011 750.0 750.0 250.0 1,000.0 500.0 5,000.0 8,250.0 6,325.0 1,925.0 1,925.0
SW0057 STORM SEWER REPLACEMENT 750.0 300.0 750.0 500.0 500.0 6,750.0 9,550.0 7,352.5 2,197.5 2,197.5
SW0059 HANLON CREEK/MILL CREEK WATERSHED 100.0 100.0 100.0 100.0
SW0062 STORM SEWER RELINE/REPAIR 500.0 300.0 500.0 1,300.0 400.0 900.0 900.0
SW0063 STORM SYSTEM UPGRADES 750.0 300.0 750.0 750.0 3,500.0 6,050.0 2,040.0 4,010.0 4,010.0
SW0067 DOWNTOWN STORM SEWERS 3,475.0 3,475.0 3,475.0 3,475.0
SW0070 WYNDHAM/CARDEN TO WOOLWICH 300.0 200.0 500.0 400.0 100.0 100.0
Total 12 Storm Water Non-Growth 2,250.0 2,100.0 1,950.0 3,100.0 1,300.0 20,925.0 31,625.0 16,797.5 14,827.5 14,827.5
Total Storm Water Management 2,400.0 2,450.0 1,950.0 3,200.0 1,600.0 20,925.0 32,525.0 16,797.5 872.0 14,855.5 14,855.5
Gross Project Cost ('000s) Sources of External Funding
3.3

City of Guelph
2019 to 2023 Tax Supported Capital Forecast
Storm Water Management
Total
Project Cost Grants & Federal DC Net Cost Equipment City
Project Number & Description 2019 2020 2021 2022 2023 (2019-2023) Subsidies Gas Tax Other DC's Debt to City Replacement Reserves Debt
Storm Water Non-Growth
SW0051 SWM POND REHABILITATION 350.0 350.0 500.0 500.0 1,700.0 1,700.0 1,700.0
SW0056 CIP STORM SEWER REPL 2011 1,000.0 1,000.0 1,000.0 1,000.0 1,000.0 5,000.0 3,750.0 1,250.0 1,250.0
SW0057 STORM SEWER REPLACEMENT 750.0 1,000.0 1,000.0 2,000.0 2,000.0 6,750.0 5,137.5 1,612.5 1,612.5
SW0062 STORM SEWER RELINE/REPAIR 500.0 500.0 500.0 500.0
SW0063 STORM SYSTEM UPGRADES 1,000.0 250.0 250.0 1,000.0 1,000.0 3,500.0 3,500.0 3,500.0
SW0067 DOWNTOWN STORM SEWERS 500.0 500.0 500.0 1,975.0 3,475.0 3,475.0 3,475.0
Total Storm Water Non-Growth 3,600.0 3,250.0 3,100.0 6,475.0 4,500.0 20,925.0 8,887.5 12,037.5 12,037.5
Total Storm Water Management 3,600.0 3,250.0 3,100.0 6,475.0 4,500.0 20,925.0 8,887.5 12,037.5 12,037.5
Gross Project Cost ('000s) Sources of External Funding
3.4

City of Guelph
2014 Tax Supported Capital Budget
2015 to 2023 Tax Supported Capital Forecast
Policy Planning
Total
Next Project Grants & Federal DC Net Cost Equipment City
Project Number & Description 2014 2015 2016 2017 2018 5 Years Cost Subsidies Gas Tax Other DC's Debt to City Replacement Reserves Debt
11 Policy Planning Growth
PL0004 OFFICIAL PLAN REVIEW 100.0 227.3 456.4 783.7 548.6 235.1 235.1
PL0007 BROWNFIELDS INITIATIVES 66.0 55.7 121.7 79.1 42.6 42.6
PL0008 COMMUNITY IMPROVEMENT STUDIES 200.0 447.0 647.0 64.7 582.3 582.3
PL0012 HOUSING INITIATIVES 92.0 92.0 46.0 46.0 46.0
PL0014 URBAN DESIGN GUIDELINES 220.0 231.8 451.8 225.9 225.9 225.9
PL0020 ENVIRONMENTAL INITIATIVES 60.5 60.5 15.1 45.4 45.4
PL0021 ZONING BY-LAW REVIEW 174.1 183.5 198.3 159.4 715.3 536.5 178.8 178.8
PL0022 CLAIR/MALTBY SECONDARY PLAN 270.0 244.7 514.7 257.4 257.4 257.4
PL0024 HERITAGE INITIATIVES 85.6 171.8 257.4 38.0 219.4 219.4
PL0036 MIXED USE NODES & CORRIDORS 50.0 55.0 60.0 39.3 300.0 504.3 337.8 166.6 166.6
PL0046 INFILL & TOWNHOUSE DESIGN GUID 40.6 40.6 20.3 20.3 20.3
PL0051 GID SECONDARY PLAN IMPLEMENTATION 46.4 46.4 11.6 34.8 34.8
Total 11 Policy Planning Growth 581.1 483.2 443.9 552.6 352.5 1,822.1 4,235.4 2,181.0 2,054.6 2,054.6
12 Policy Planning Non-Growth
PL0039 WELLINGTON ST DAM EA 120.0 120.0 120.0 120.0
Total 12 Policy Planning Non-Growth 120.0 120.0 120.0 120.0
Total Policy Planning 581.1 483.2 563.9 552.6 352.5 1,822.1 4,355.4 2,181.0 2,174.6 2,174.6
Gross Project Cost ('000s) Sources of External Funding
3.5

City of Guelph
2019 to 2023 Tax Supported Capital Forecast
Policy Planning
Total
Project Cost Grants & Federal DC Net Cost Equipment City
Project Number & Description 2019 2020 2021 2022 2023 (2019-2023) Subsidies Gas Tax Other DC's Debt to City Replacement Reserves Debt
Policy Planning Growth
PL0004 OFFICIAL PLAN REVIEW 217.5 238.9 456.4 319.5 136.9 136.9
PL0007 BROWNFIELDS INITIATIVES 55.7 55.7 36.2 19.5 19.5
PL0008 COMMUNITY IMPROVEMENT STUDIES 87.0 180.0 180.0 447.0 44.7 402.3 402.3
PL0014 URBAN DESIGN GUIDELINES 147.8 36.2 47.8 231.8 115.9 115.9 115.9
PL0021 ZONING BY-LAW REVIEW 86.9 72.5 159.4 119.5 39.9 39.9
PL0024 HERITAGE INITIATIVES 132.0 39.8 171.8 25.2 146.6 146.6
PL0036 MIXED USE NODES & CORRIDORS 300.0 300.0 201.0 99.0 99.0
Total Policy Planning Growth 366.7 413.2 382.2 480.0 180.0 1,822.1 862.0 960.1 960.1
Total Policy Planning 366.7 413.2 382.2 480.0 180.0 1,822.1 862.0 960.1 960.1
Gross Project Cost ('000s) Sources of External Funding
3.6

City of Guelph
2014 Tax Supported Capital Budget
2015 to 2023 Tax Supported Capital Forecast
Solid Waste Resources
Total
Next Project Grants & Federal DC Net Cost Equipment City
Project Number & Description 2014 2015 2016 2017 2018 5 Years Cost Subsidies Gas Tax Other DC's Debt to City Replacement Reserves Debt
12 SWR Non-Growth
SC0017 EASTVIEW SANITARY SEWER UPGRADES 750.0 350.0 1,100.0 600.0 500.0
WC0002 TRANSFER STATION UPGRADES 150.0 600.0 750.0 750.0 750.0
WC0003 ADMIN BLDG RETROFIT 2,225.0 2,225.0 2,225.0 2,225.0
WC0004 VEHICLE STORAGE & MTCE BLDG 600.0 600.0 600.0 600.0
WC0005 NEW COLLECTION VEHICLE 325.0 725.0 1,050.0 1,050.0 1,050.0
WC0006 WRIC EQUIPMENT REPLACEMENT 937.8 850.0 645.0 800.0 866.0 10,254.0 14,352.8 600.0 13,752.8 13,752.8
WC0007 DOUBLE DESK FIBRE SCREEN 950.0 950.0 950.0 950.0
WC0010 AUTOMATE TRANSFER STATION SCALE 80.0 80.0 80.0 80.0
WM0040 HHW EXPANSION 500.0 500.0 500.0 500.0
WP0002 MATERIAL SHREDDER 900.0 900.0 900.0 900.0
WP0004 EASTVIEW METHANE COLLECTION SY 100.0 100.0 200.0 200.0
WP0005 COMMERCIAL OUTBOUND SCALE 250.0 250.0 250.0 250.0
WR0001 MRF BUILDING UPGRADE 200.0 3,000.0 3,200.0 3,200.0 3,200.0
WR0002 REUSE CENTRE 600.0 600.0 600.0 600.0
Total 12 SWR Non-Growth 1,687.8 2,250.0 895.0 2,005.0 866.0 19,054.0 26,757.8 1,200.0 700.0 24,857.8 13,752.8 11,105.0
Total Solid Waste Resources 1,687.8 2,250.0 895.0 2,005.0 866.0 19,054.0 26,757.8 1,200.0 700.0 24,857.8 13,752.8 11,105.0
Gross Project Cost ('000s) Sources of External Funding
3.7

City of Guelph
2019 to 2023 Tax Supported Capital Forecast
Solid Waste Resources
Total
Project Cost Grants & Federal DC Net Cost Equipment City
Project Number & Description 2019 2020 2021 2022 2023 (2019-2023) Subsidies Gas Tax Other DC's Debt to City Replacement Reserves Debt
SWR Non-Growth
WC0003 ADMIN BLDG RETROFIT 225.0 2,000.0 2,225.0 2,225.0 2,225.0
WC0004 VEHICLE STORAGE & MTCE BLDG 600.0 600.0 600.0 600.0
WC0005 NEW COLLECTION VEHICLE 350.0 375.0 725.0 725.0 725.0
WC0006 WRIC EQUIPMENT REPLACEMENT 1,773.0 1,206.0 2,465.0 2,285.0 2,525.0 10,254.0 10,254.0 10,254.0
WM0040 HHW EXPANSION 500.0 500.0 500.0 500.0
WP0002 MATERIAL SHREDDER 900.0 900.0 900.0 900.0
WP0005 COMMERCIAL OUTBOUND SCALE 250.0 250.0 250.0 250.0
WR0001 MRF BUILDING UPGRADE 3,000.0 3,000.0 3,000.0 3,000.0
WR0002 REUSE CENTRE 600.0 600.0 600.0 600.0
Total SWR Non-Growth 3,273.0 4,781.0 4,965.0 2,285.0 3,750.0 19,054.0 19,054.0 10,254.0 8,800.0
Total Solid Waste Resources 3,273.0 4,781.0 4,965.0 2,285.0 3,750.0 19,054.0 19,054.0 10,254.0 8,800.0
Gross Project Cost ('000s) Sources of External Funding
3.8

City of Guelph
2014 Tax Supported Capital Budget
2015 to 2023 Tax Supported Capital Forecast
Fleet, Traffic & Roadways
Total
Next Project Grants & Federal DC Net Cost Equipment City
Project Number & Description 2014 2015 2016 2017 2018 5 Years Cost Subsidies Gas Tax Other DC's Debt to City Replacement Reserves Debt
11 Fleet
GG0187 FLEET VEH & EQUIP RPLCMNT 1,057.1 2,001.5 4,344.1 2,165.5 2,259.3 19,766.5 31,594.0 31,594.0 31,594.0
GG0208 MUNICIPAL ST BLDG EXPANSION 1,350.0 1,350.0 1,350.0
GG0231 45 MUNICIPAL BUILDING UPGRADES 200.0 200.0 200.0 200.0
Total 11 Fleet 1,057.1 2,001.5 4,344.1 3,515.5 2,259.3 19,966.5 33,144.0 1,350.0 31,794.0 31,594.0 200.0
12 Traffic Signals
TF0002 NEW SIGNAL INSTALLATION 110.0 121.0 127.0 735.0 1,093.0 983.7 109.3 109.3
TF0003 TRAFFIC SIGNAL EQUIP REPL 303.0 300.0 380.0 390.0 400.0 2,150.0 3,923.0 3,923.0 3,923.0
TF0004 INTERSECTION- SIGNAL REBUILD 252.5 200.0 300.0 1,950.0 2,702.5 2,702.5 2,702.5
TF0005 SIGNALIZED CONTROL SYSTEM 225.0 425.0 1,000.0 1,650.0 1,650.0 1,650.0
TF0006 SIGNALIZED CONTROL SYSTEM/STUDY 100.0 100.0 200.0 200.0 200.0
TF0007 LED SIGNAL REPLACEMENT 150.0 150.0 150.0 450.0 450.0 450.0
TF0008 TRAFFIC MGMT INITIATIVES 250.0 1,850.0 2,100.0 2,100.0 2,100.0
TF0009 ACCESSIBLE PEDESTRIAN SIGNALS 168.0 171.0 910.0 1,249.0 1,249.0 1,249.0
TF0010 PEDESTRIAN COUNTDOWN HEADS 135.0 150.0 285.0 285.0 285.0
Total 12 Traffic Signals 880.5 835.0 530.0 1,414.0 1,148.0 8,845.0 13,652.5 983.7 12,668.8 8,609.5 4,059.3
13 Roadside Operations
RD0293 SNOW DUMP CONSTRUCTION 200.0 200.0 200.0 200.0
RD0295 ROAD INFR SUSTAINABILITY 300.0 600.0 900.0 900.0 900.0
RD0306 SURFACE INFRASTRUCTURE SUSTAINABILITY 200.0 200.0 200.0 200.0
WN0001 WINTER CONTROL UPGRADE 200.0 200.0 200.0 200.0
Total 13 Roadside Operations 300.0 1,200.0 1,500.0 1,500.0 1,500.0
Total Fleet, Traffic & Roadways 1,937.6 2,836.5 4,874.1 5,229.5 3,407.3 30,011.5 48,296.5 2,333.7 45,962.8 40,203.5 5,759.3
Gross Project Cost ('000s) Sources of External Funding
3.9

City of Guelph
2019 to 2023 Tax Supported Capital Forecast
Fleet, Traffic & Roadways
Total
Project Cost Grants & Federal DC Net Cost Equipment City
Project Number & Description 2019 2020 2021 2022 2023 (2019-2023) Subsidies Gas Tax Other DC's Debt to City Replacement Reserves Debt
Fleet
GG0187 FLEET VEH & EQUIP RPLCMNT 3,959.2 2,289.0 2,416.0 3,228.5 7,873.8 19,766.5 19,766.5 19,766.5
GG0231 45 MUNICIPAL BUILDING UPGRADES 200.0 200.0 200.0 200.0
Total Fleet 3,959.2 2,289.0 2,416.0 3,428.5 7,873.8 19,966.5 19,966.5 19,766.5 200.0
Traffic Signals
TF0002 NEW SIGNAL INSTALLATION 133.0 140.0 147.0 154.0 161.0 735.0 661.5 73.5 73.5
TF0003 TRAFFIC SIGNAL EQUIP REPL 410.0 420.0 430.0 440.0 450.0 2,150.0 2,150.0 2,150.0
TF0004 INTERSECTION- SIGNAL REBUILD 350.0 350.0 400.0 400.0 450.0 1,950.0 1,950.0 1,950.0
TF0005 SIGNALIZED CONTROL SYSTEM 500.0 500.0 1,000.0 1,000.0 1,000.0
TF0006 SIGNALIZED CONTROL SYSTEM/STUDY 100.0 100.0 100.0 100.0
TF0008 TRAFFIC MGMT INITIATIVES 350.0 350.0 300.0 400.0 450.0 1,850.0 1,850.0 1,850.0
TF0009 ACCESSIBLE PEDESTRIAN SIGNALS 175.0 178.0 182.0 185.0 190.0 910.0 910.0 910.0
TF0010 PEDESTRIAN COUNTDOWN HEADS 150.0 150.0 150.0 150.0
Total Traffic Signals 1,418.0 1,438.0 2,059.0 2,079.0 1,851.0 8,845.0 661.5 8,183.5 5,160.0 3,023.5
Roadside Operations
RD0293 SNOW DUMP CONSTRUCTION 200.0 200.0 200.0 200.0
RD0295 ROAD INFR SUSTAINABILITY 300.0 300.0 600.0 600.0 600.0
RD0306 SURFACE INFRASTRUCTURE SUSTAINABILITY 200.0 200.0 200.0 200.0
WN0001 WINTER CONTROL UPGRADE 200.0 200.0 200.0 200.0
Total Roadside Operations 200.0 500.0 500.0 1,200.0 1,200.0 1,200.0
Total Fleet, Traffic & Roadways 5,377.2 3,927.0 4,975.0 6,007.5 9,724.8 30,011.5 661.5 29,350.0 24,926.5 4,423.5
Gross Project Cost ('000s) Sources of External Funding
3.10

City of Guelph
2014 Tax Supported Capital Budget
2015 to 2023 Tax Supported Capital Forecast
Forestry
Total
Next Project Grants & Federal DC Net Cost Equipment City
Project Number & Description 2014 2015 2016 2017 2018 5 Years Cost Subsidies Gas Tax Other DC's Debt to City Replacement Reserves Debt
11 Forestry
PO0009 TREE & SHRUB REPLACEMENT 10.0 10.0 10.0 70.0 100.0 100.0 100.0
PO0013 EMERALD ASH BORER STRATEGY 200.0 400.0 400.0 400.0 400.0 2,500.0 4,300.0 4,300.0 4,300.0
Total 11 Forestry 210.0 400.0 400.0 410.0 410.0 2,570.0 4,400.0 4,400.0 4,400.0
Total Forestry 210.0 400.0 400.0 410.0 410.0 2,570.0 4,400.0 4,400.0 4,400.0
Gross Project Cost ('000s) Sources of External Funding
3.11

City of Guelph
2019 to 2023 Tax Supported Capital Forecast
Forestry
Total
Project Cost Grants & Federal DC Net Cost Equipment City
Project Number & Description 2019 2020 2021 2022 2023 (2019-2023) Subsidies Gas Tax Other DC's Debt to City Replacement Reserves Debt
Forestry
PO0009 TREE & SHRUB REPLACEMENT 10.0 15.0 15.0 15.0 15.0 70.0 70.0 70.0
PO0013 EMERALD ASH BORER STRATEGY 500.0 500.0 500.0 500.0 500.0 2,500.0 2,500.0 2,500.0
Total Forestry 510.0 515.0 515.0 515.0 515.0 2,570.0 2,570.0 2,570.0
Total Forestry 510.0 515.0 515.0 515.0 515.0 2,570.0 2,570.0 2,570.0
Gross Project Cost ('000s) Sources of External Funding
3.12

City of Guelph
2014 Tax Supported Capital Budget
2015 to 2023 Tax Supported Capital Forecast
Parking
Total
Next Project Grants & Federal DC Net Cost Equipment City
Project Number & Description 2014 2015 2016 2017 2018 5 Years Cost Subsidies Gas Tax Other DC's Debt to City Replacement Reserves Debt
12 Parking Non-Growth
PG0056 EAST PARKADE- STRUCTURAL REHAB 300.0 600.0 900.0 900.0 900.0
PG0057 WEST PARKADE- STRUCTURAL REHAB 750.0 750.0 750.0 750.0
PG0058 PARKADE ANNUAL STRUCTURAL REHA 250.0 300.0 410.0 375.0 245.0 2,405.0 3,985.0 3,985.0 3,985.0
PG0059 PARK YOURSELF UNITS- REPL 180.0 400.0 580.0 580.0 580.0
PG0061 PARKING METER- REPL 70.0 100.0 170.0 170.0 170.0
PG0063 COMPUTER TICKET WRITERS 40.0 84.0 124.0 124.0 124.0
PG0064 WEST PARKADE ROOF DECK 500.0 500.0 500.0 500.0
PG0065 PARKING CONTROL HARDWARE 100.0 200.0 300.0 300.0 300.0
PG0066 PARKADE ELEVATOR REPL 150.0 450.0 600.0 600.0 600.0
PG0070 PARKING SIGN UPGRADES 150.0 150.0 300.0 300.0 300.0
PG0073 SURFACE LOT ANNUAL REHAB 250.0 650.0 900.0 900.0 900.0
PG0075 PARKING SYSTEM STUDY 100.0 120.0 220.0 220.0 220.0
Total 12 Parking Non-Growth 650.0 1,050.0 740.0 1,485.0 245.0 5,159.0 9,329.0 9,329.0 9,329.0
Total Parking 650.0 1,050.0 740.0 1,485.0 245.0 5,159.0 9,329.0 9,329.0 9,329.0
Gross Project Cost ('000s) Sources of External Funding
3.13
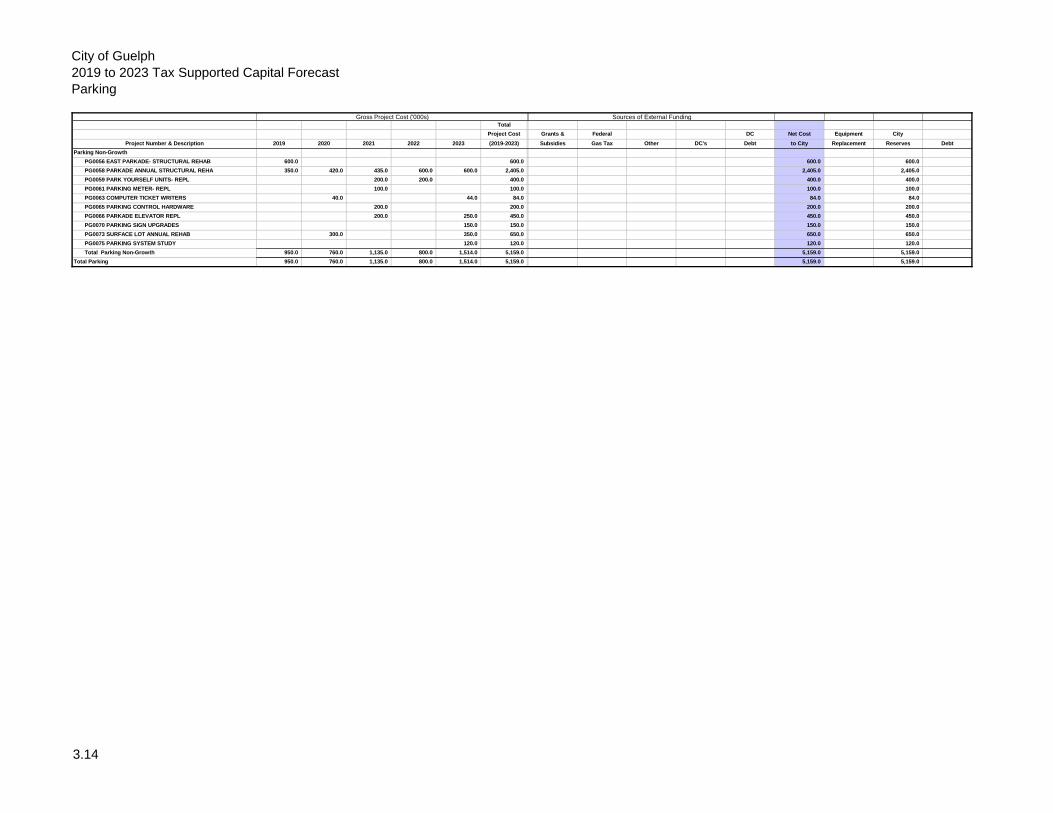
City of Guelph
2019 to 2023 Tax Supported Capital Forecast
Parking
Total
Project Cost Grants & Federal DC Net Cost Equipment City
Project Number & Description 2019 2020 2021 2022 2023 (2019-2023) Subsidies Gas Tax Other DC's Debt to City Replacement Reserves Debt
Parking Non-Growth
PG0056 EAST PARKADE- STRUCTURAL REHAB 600.0 600.0 600.0 600.0
PG0058 PARKADE ANNUAL STRUCTURAL REHA 350.0 420.0 435.0 600.0 600.0 2,405.0 2,405.0 2,405.0
PG0059 PARK YOURSELF UNITS- REPL 200.0 200.0 400.0 400.0 400.0
PG0061 PARKING METER- REPL 100.0 100.0 100.0 100.0
PG0063 COMPUTER TICKET WRITERS 40.0 44.0 84.0 84.0 84.0
PG0065 PARKING CONTROL HARDWARE 200.0 200.0 200.0 200.0
PG0066 PARKADE ELEVATOR REPL 200.0 250.0 450.0 450.0 450.0
PG0070 PARKING SIGN UPGRADES 150.0 150.0 150.0 150.0
PG0073 SURFACE LOT ANNUAL REHAB 300.0 350.0 650.0 650.0 650.0
PG0075 PARKING SYSTEM STUDY 120.0 120.0 120.0 120.0
Total Parking Non-Growth 950.0 760.0 1,135.0 800.0 1,514.0 5,159.0 5,159.0 5,159.0
Total Parking 950.0 760.0 1,135.0 800.0 1,514.0 5,159.0 5,159.0 5,159.0
Gross Project Cost ('000s) Sources of External Funding
3.14

City of Guelph
2014 Tax Supported Capital Budget
2015 to 2023 Tax Supported Capital Forecast
Transit
Total
Next Project Grants & Federal DC Net Cost Equipment City
Project Number & Description 2014 2015 2016 2017 2018 5 Years Cost Subsidies Gas Tax Other DC's Debt to City Replacement Reserves Debt
11 Transit Growth
TC0004 COIN EQUIPMENT 30.0 37.0 67.0 15.1 51.9 51.9
TC0006 SATELLITE LOCAL CLAIR/GORDON 300.0 50.0 350.0 175.0 175.0 175.0
TC0023 BASE SERVICE INCREASE- LAFARGE 1,050.0 1,050.0 945.0 105.0 105.0
TC0024 BASE SERVICE INCREASE- SOUTH END 1,050.0 1,050.0 945.0 105.0 105.0
TC0028 FAREBOX UPGRADE 100.0 406.0 506.0 113.8 392.1 392.1
TC0041 BUS STOP ACCESS UPGRADE 2011 52.0 53.1 54.1 55.2 56.3 299.8 570.5 128.4 442.1 442.1
TC0045 INTER-REGIONAL SERVICE EXPANSION 1,000.0 1,000.0 500.0 500.0 500.0
TM0001 MOBILITY VAN NEW 220.0 470.0 690.0 569.3 120.8 120.8
TM0002 MOBILITY VAN NEW 215.0 215.0 177.4 37.6 37.6
Total 11 Transit Growth 152.0 789.1 54.1 1,375.2 1,321.3 1,806.8 5,498.5 3,569.0 1,929.5 1,929.5
12 Transit Non-Growth
TC0007 BUS STOP SIGNS 50.0 50.0 50.0 50.0
TC0008 TRANSIT VEH & EQUIP REPLACE 2,107.3 1,800.0 1,950.0 2,208.1 2,821.4 13,383.4 24,270.2 205.0 24,065.2 24,065.2
TC0010 EXISTING BUS STOP- UPGRADE 31.2 31.8 30.0 33.1 34.0 180.2 340.3 340.3 340.3
TC0018 TERMINAL IMPROVE AT SUB-NODES 105.0 105.0 210.0 210.0 210.0
TC0043 BUS SHELTER PURCHASE 52.0 53.0 54.0 285.0 444.0 444.0 444.0
TC0047 TRANSIT MASTER PLAN UPDATE 300.0 300.0 300.0 300.0
Total 12 Transit Non-Growth 2,243.5 1,831.8 2,032.0 2,699.2 2,909.4 13,898.6 25,614.5 205.0 25,409.5 24,065.2 1,344.3
Total Transit 2,395.5 2,620.9 2,086.1 4,074.4 4,230.7 15,705.4 31,113.0 205.0 3,569.0 27,339.0 24,065.2 3,273.8
Gross Project Cost ('000s) Sources of External Funding
3.15

City of Guelph
2019 to 2023 Tax Supported Capital Forecast
Transit
Total
Project Cost Grants & Federal DC Net Cost Equipment City
Project Number & Description 2019 2020 2021 2022 2023 (2019-2023) Subsidies Gas Tax Other DC's Debt to City Replacement Reserves Debt
Transit Growth
TC0004 COIN EQUIPMENT 37.0 37.0 8.3 28.7 28.7
TC0041 BUS STOP ACCESS UPGRADE 2011 57.4 58.6 59.8 61.0 63.0 299.8 67.4 232.4 232.4
TC0045 INTER-REGIONAL SERVICE EXPANSION 1,000.0 1,000.0 500.0 500.0 500.0
TM0001 MOBILITY VAN NEW 230.0 240.0 470.0 387.8 82.3 82.3
Total Transit Growth 287.4 298.6 1,096.8 61.0 63.0 1,806.8 963.5 843.4 843.4
Transit Non-Growth
TC0007 BUS STOP SIGNS 50.0 50.0 50.0 50.0
TC0008 TRANSIT VEH & EQUIP REPLACE 2,675.6 2,280.8 3,083.0 2,672.0 2,672.0 13,383.4 13,383.4 13,383.4
TC0010 EXISTING BUS STOP- UPGRADE 34.6 35.1 35.9 36.6 38.0 180.2 180.2 180.2
TC0043 BUS SHELTER PURCHASE 55.0 56.0 57.0 58.0 59.0 285.0 285.0 285.0
Total Transit Non-Growth 2,765.2 2,421.9 3,175.9 2,766.6 2,769.0 13,898.6 13,898.6 13,383.4 515.2
Total Transit 3,052.6 2,720.5 4,272.7 2,827.6 2,832.0 15,705.4 963.5 14,742.0 13,383.4 1,358.6
Gross Project Cost ('000s) Sources of External Funding
3.16

City of Guelph
2014 Tax Supported Capital Budget
2015 to 2023 Tax Supported Capital Forecast
Fire & Land Ambulance
Total
Next Project Grants & Federal DC Net Cost Equipment City
Project Number & Description 2014 2015 2016 2017 2018 5 Years Cost Subsidies Gas Tax Other DC's Debt to City Replacement Reserves Debt
12 Fire & Land Ambulance Non-Growth
AM0001 LAND AMBULANCE VEH REPL 2012 550.0 420.9 519.8 437.7 540.6 2,622.1 5,091.1 2,036.5 3,054.6 3,054.6
AM0002 LAND AMBULANCE EQUIP REPL 2012 88.8 8.8 26.0 50.4 507.0 244.3 925.3 370.1 555.2 555.2
AM0008 LAND AMBULANCE BASE FURNITURE REPL 10.0 50.0 60.0 24.0 36.0 36.0
FS0030 FIRE VEHICLE REPL 444.3 31.0 1,567.2 86.8 1,195.2 1,551.9 4,876.4 1,374.8 652.0 2,849.6 2,849.6
FS0031 FIRE EQUIP REPL 128.7 254.9 212.0 190.8 668.1 1,802.5 3,257.0 517.9 2,739.1 2,739.1
FS0032 FIRE RADIO REPL 11 69.4 71.5 73.6 33.0 735.9 983.4 983.4 983.4
FS0045 RADIO INFRASTRUCTURE REPLACEMENT 750.0 750.0 750.0 750.0
Total 12 Fire & Land Ambulance Non-Growth 1,281.2 787.1 3,148.6 775.7 2,943.9 7,006.7 15,943.2 4,323.3 652.0 10,967.9 10,931.9 36.0
Total Fire & Land Ambulance 1,281.2 787.1 3,148.6 775.7 2,943.9 7,006.7 15,943.2 4,323.3 652.0 10,967.9 10,931.9 36.0
Gross Project Cost ('000s) Sources of External Funding
3.17

City of Guelph
2019 to 2023 Tax Supported Capital Forecast
Fire & Land Ambulance
Total
Project Cost Grants & Federal DC Net Cost Equipment City
Project Number & Description 2019 2020 2021 2022 2023 (2019-2023) Subsidies Gas Tax Other DC's Debt to City Replacement Reserves Debt
Fire & Land Ambulance Non-Growth
AM0001 LAND AMBULANCE VEH REPL 2012 607.2 464.7 574.0 483.3 492.9 2,622.1 1,048.9 1,573.2 1,573.2
AM0002 LAND AMBULANCE EQUIP REPL 2012 41.9 58.3 8.5 135.6 244.3 97.7 146.6 146.6
AM0008 LAND AMBULANCE BASE FURNITURE REPL 10.0 10.0 10.0 10.0 10.0 50.0 20.0 30.0 30.0
FS0030 FIRE VEHICLE REPL 77.4 828.9 159.6 486.0 1,551.9 651.0 900.9 900.9
FS0031 FIRE EQUIP REPL 81.2 257.0 221.9 303.7 938.7 1,802.5 337.6 1,464.9 1,464.9
FS0032 FIRE RADIO REPL 11 649.9 86.0 735.9 735.9 735.9
Total Fire & Land Ambulance Non-Growth 817.7 2,268.8 974.0 1,418.6 1,527.6 7,006.7 2,155.2 4,851.5 4,821.5 30.0
Total Fire & Land Ambulance 817.7 2,268.8 974.0 1,418.6 1,527.6 7,006.7 2,155.2 4,851.5 4,821.5 30.0
Gross Project Cost ('000s) Sources of External Funding
3.18

City of Guelph
2014 Tax Supported Capital Budget
2015 to 2023 Tax Supported Capital Forecast
Bylaw Compliance, Security
Total
Next Project Grants & Federal DC Net Cost Equipment City
Project Number & Description 2014 2015 2016 2017 2018 5 Years Cost Subsidies Gas Tax Other DC's Debt to City Replacement Reserves Debt
12 Bylaw Compliance, Security and Licensing Non-Growth
PG0071 SECURITY INFRA REPL 100.0 100.0 261.0 200.0 1,339.0 2,000.0 2,000.0 2,000.0
PG0072 LICENCE PLATE RECOGNITION 2015 77.0 177.9 254.9 254.9 254.9
Total 12 Bylaw Compliance, Security and Licensing Non-Growth 100.0 100.0 338.0 200.0 1,516.9 2,254.9 2,254.9 2,254.9
Total Bylaw Compliance, Security and Licensing 100.0 100.0 338.0 200.0 1,516.9 2,254.9 2,254.9 2,254.9
Gross Project Cost ('000s) Sources of External Funding
3.19

City of Guelph
2019 to 2023 Tax Supported Capital Forecast
Bylaw Compliance, Security
Total
Project Cost Grants & Federal DC Net Cost Equipment City
Project Number & Description 2019 2020 2021 2022 2023 (2019-2023) Subsidies Gas Tax Other DC's Debt to City Replacement Reserves Debt
Bylaw Compliance, Security and Licensing Non-Growth
PG0071 SECURITY INFRA REPL 350.0 350.0 239.0 200.0 200.0 1,339.0 1,339.0 1,339.0
PG0072 LICENCE PLATE RECOGNITION 2015 84.7 93.2 177.9 177.9 177.9
Total Bylaw Compliance, Security and Licensing Non-Growth 350.0 434.7 239.0 200.0 293.2 1,516.9 1,516.9 1,516.9
Total Bylaw Compliance, Security and Licensing 350.0 434.7 239.0 200.0 293.2 1,516.9 1,516.9 1,516.9
Gross Project Cost ('000s) Sources of External Funding
3.20

City of Guelph
2014 Tax Supported Capital Budget
2015 to 2023 Tax Supported Capital Forecast
Parks, Recreation Programs
Total
Next Project Grants & Federal DC Net Cost Equipment City
Project Number & Description 2014 2015 2016 2017 2018 5 Years Cost Subsidies Gas Tax Other DC's Debt to City Replacement Reserves Debt
11 VRRC
RF0046 VRRC- BULKHEADS 110.0 110.0 110.0 110.0
RF0051 VRRC EXPANSION/RENOVATION 2,500.0 4,500.0 7,000.0 7,000.0 7,000.0
Total 11 VRRC 2,500.0 4,500.0 110.0 7,110.0 7,110.0 110.0 7,000.0
12 Centennial
RF0047 CENTENNIAL POOL- MEETING ROOMS 10.0 10.0 10.0 10.0
RF0059 CENTENNIAL ARENA RENO 300.0 300.0 300.0 300.0
Total 12 Centennial 300.0 10.0 310.0 310.0 310.0
13 Exhibition
RF0058 EXHIBITION- UPGRADE LOBBY 25.0 25.0 25.0 25.0
Total 13 Exhibition 25.0 25.0 25.0 25.0
14 WECC
RF0027 WECC- SAND FILTER CONVERSION 50.0 50.0 50.0 50.0
RF0062 WECC FITNESS ROOM EQUIP 60.0 60.0 60.0 60.0
RF0070 WECC EXTERIOR FACILITY SIGNAGE 15.0 15.0 15.0 15.0
Total 14 WECC 60.0 15.0 50.0 125.0 125.0 125.0
15 Lyons
RF0037 LYONS- WALL REMOVAL 20.0 20.0 20.0 20.0
Total 15 Lyons 20.0 20.0 20.0 20.0
17 Parks Planning Growth
PK0001 SOUTH END COMMUNITY PARK 35.0 375.0 650.0 1,060.0 954.0 106.0 106.0
PK0002 GUELPH TRAILS 885.0 550.0 5,400.0 6,835.0 6,151.5 683.5 683.5
PK0004 JUBILEE PARK 1,095.0 730.0 1,825.0 1,642.5 182.5 182.5
PK0007 VICTORIA RD NORTHVIEW 125.0 705.0 470.0 1,300.0 1,170.0 130.0 130.0
PK0014 EASTVIEW COMMUNITY PARK 200.0 2,500.0 2,000.0 2,000.0 6,700.0 6,030.0 670.0 670.0
PK0016 PERGOLA PROPERTY 200.0 200.0 180.0 20.0 20.0
PK0021 GRANGEHILL PHASE 5 300.0 300.0 270.0 30.0 30.0
PK0026 HOWITT PARK 500.0 500.0 450.0 50.0 50.0
PK0030 CITYVIEW HEIGHTS PARKETTE 50.0 295.0 345.0 310.5 34.5 34.5
PK0034 KORTRIGHT NEIGHBOURHOOD PARK 100.0 705.0 470.0 1,275.0 1,147.5 127.5 127.5
PK0036 CITYVIEW DRIVE PARK 100.0 100.0 90.0 10.0 10.0
PK0037 KORTRIGHT SPORTS COMPLEX 2,000.0 2,000.0 1,800.0 200.0 200.0
PK0038 GRANGEHILL PHASE 7 50.0 50.0 45.0 5.0 5.0
PK0039 IMICO PROPERTY PARK 550.0 550.0 495.0 55.0 55.0
PK0040 PETER MISERSKY 100.0 100.0 90.0 10.0 10.0
PK0042 YORK OPEN SPACE DEVELOPMENT 600.0 600.0 540.0 60.0 60.0
PK0043 EASTVIEW OPEN SPACE 500.0 500.0 450.0 50.0 50.0
PK0045 VALLEY ROAD PARK 600.0 600.0 540.0 60.0 60.0
PK0047 MITCHELL FARM 50.0 205.0 255.0 229.5 25.5 25.5
PK0048 CITYWIDE SKATEPARK FACILITY 100.0 700.0 800.0 720.0 80.0 80.0
PK0049 270 GRANGE ROAD - NEW PARKETTE 100.0 100.0 90.0 10.0 10.0
PK0050 YORK DISTRICT COMMUNITY PARK 1,000.0 1,000.0 900.0 100.0 100.0
PK0051 VICTORIA ROAD N COMMUNITY PARK 1,650.0 1,650.0 1,485.0 165.0 165.0
PK0057 ORIN REID PARK - PHASE 2 100.0 600.0 500.0 1,200.0 1,080.0 120.0 120.0
PK0060 WOODS SUB PH 1 PARK 600.0 600.0 540.0 60.0 60.0
PK0061 WOODS SUB PH 2 PARK 600.0 600.0 540.0 60.0 60.0
PK0062 LEASH FREE ZONES POLICY REVIEW 50.0 50.0 45.0 5.0 5.0
PK0063 PROPERTY DEMARCATION POICY REVIEW 50.0 50.0 45.0 5.0 5.0
PK0064 NATURALIZATION POLICY REVIEW 50.0 50.0 45.0 5.0 5.0
PK0068 EAST NODE NEIGHBOURHOOD PARK 600.0 600.0 540.0 60.0 60.0
Gross Project Cost ('000s) Sources of External Funding
3.21
City of Guelph
2014 Tax Supported Capital Budget
2015 to 2023 Tax Supported Capital Forecast
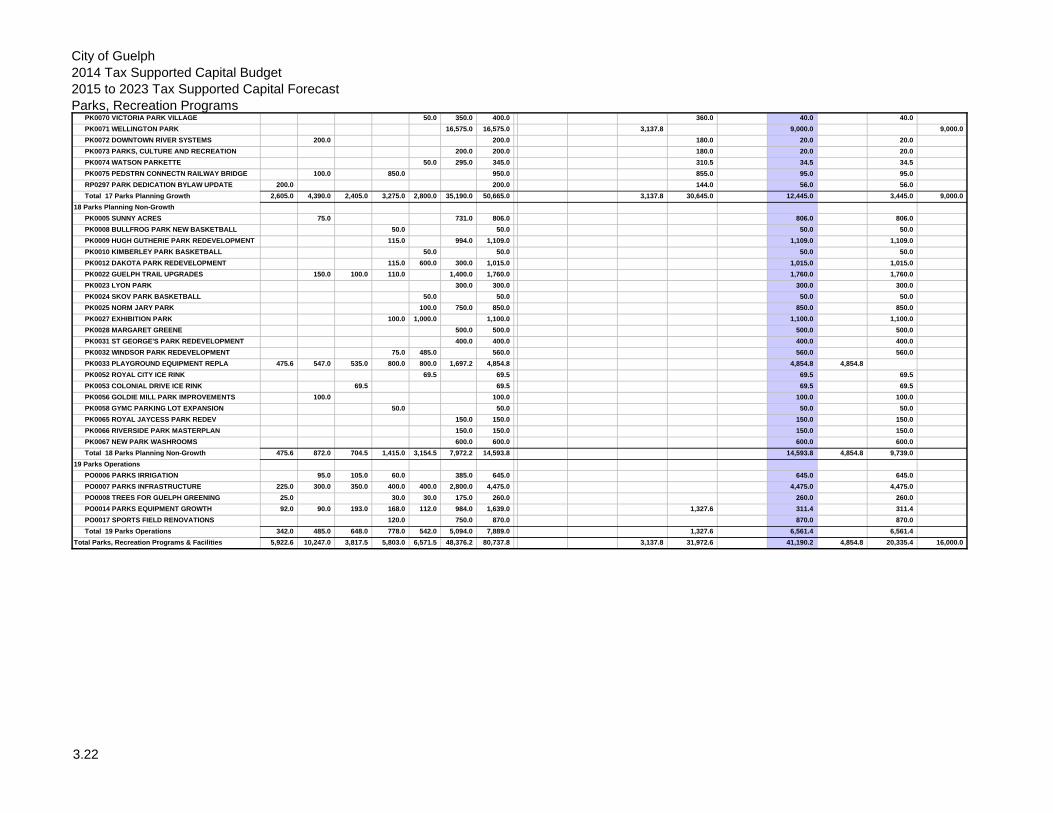
Parks, Recreation Programs PK0070 VICTORIA PARK VILLAGE 50.0 350.0 400.0 360.0 40.0 40.0
PK0071 WELLINGTON PARK 16,575.0 16,575.0 3,137.8 9,000.0 9,000.0
PK0072 DOWNTOWN RIVER SYSTEMS 200.0 200.0 180.0 20.0 20.0
PK0073 PARKS, CULTURE AND RECREATION 200.0 200.0 180.0 20.0 20.0
PK0074 WATSON PARKETTE 50.0 295.0 345.0 310.5 34.5 34.5
PK0075 PEDSTRN CONNECTN RAILWAY BRIDGE 100.0 850.0 950.0 855.0 95.0 95.0
RP0297 PARK DEDICATION BYLAW UPDATE 200.0 200.0 144.0 56.0 56.0
Total 17 Parks Planning Growth 2,605.0 4,390.0 2,405.0 3,275.0 2,800.0 35,190.0 50,665.0 3,137.8 30,645.0 12,445.0 3,445.0 9,000.0
18 Parks Planning Non-Growth
PK0005 SUNNY ACRES 75.0 731.0 806.0 806.0 806.0
PK0008 BULLFROG PARK NEW BASKETBALL 50.0 50.0 50.0 50.0
PK0009 HUGH GUTHERIE PARK REDEVELOPMENT 115.0 994.0 1,109.0 1,109.0 1,109.0
PK0010 KIMBERLEY PARK BASKETBALL 50.0 50.0 50.0 50.0
PK0012 DAKOTA PARK REDEVELOPMENT 115.0 600.0 300.0 1,015.0 1,015.0 1,015.0
PK0022 GUELPH TRAIL UPGRADES 150.0 100.0 110.0 1,400.0 1,760.0 1,760.0 1,760.0
PK0023 LYON PARK 300.0 300.0 300.0 300.0
PK0024 SKOV PARK BASKETBALL 50.0 50.0 50.0 50.0
PK0025 NORM JARY PARK 100.0 750.0 850.0 850.0 850.0
PK0027 EXHIBITION PARK 100.0 1,000.0 1,100.0 1,100.0 1,100.0
PK0028 MARGARET GREENE 500.0 500.0 500.0 500.0
PK0031 ST GEORGE'S PARK REDEVELOPMENT 400.0 400.0 400.0 400.0
PK0032 WINDSOR PARK REDEVELOPMENT 75.0 485.0 560.0 560.0 560.0
PK0033 PLAYGROUND EQUIPMENT REPLA 475.6 547.0 535.0 800.0 800.0 1,697.2 4,854.8 4,854.8 4,854.8
PK0052 ROYAL CITY ICE RINK 69.5 69.5 69.5 69.5
PK0053 COLONIAL DRIVE ICE RINK 69.5 69.5 69.5 69.5
PK0056 GOLDIE MILL PARK IMPROVEMENTS 100.0 100.0 100.0 100.0
PK0058 GYMC PARKING LOT EXPANSION 50.0 50.0 50.0 50.0
PK0065 ROYAL JAYCESS PARK REDEV 150.0 150.0 150.0 150.0
PK0066 RIVERSIDE PARK MASTERPLAN 150.0 150.0 150.0 150.0
PK0067 NEW PARK WASHROOMS 600.0 600.0 600.0 600.0
Total 18 Parks Planning Non-Growth 475.6 872.0 704.5 1,415.0 3,154.5 7,972.2 14,593.8 14,593.8 4,854.8 9,739.0
19 Parks Operations
PO0006 PARKS IRRIGATION 95.0 105.0 60.0 385.0 645.0 645.0 645.0
PO0007 PARKS INFRASTRUCTURE 225.0 300.0 350.0 400.0 400.0 2,800.0 4,475.0 4,475.0 4,475.0
PO0008 TREES FOR GUELPH GREENING 25.0 30.0 30.0 175.0 260.0 260.0 260.0
PO0014 PARKS EQUIPMENT GROWTH 92.0 90.0 193.0 168.0 112.0 984.0 1,639.0 1,327.6 311.4 311.4
PO0017 SPORTS FIELD RENOVATIONS 120.0 750.0 870.0 870.0 870.0
Total 19 Parks Operations 342.0 485.0 648.0 778.0 542.0 5,094.0 7,889.0 1,327.6 6,561.4 6,561.4
Total Parks, Recreation Programs & Facilities 5,922.6 10,247.0 3,817.5 5,803.0 6,571.5 48,376.2 80,737.8 3,137.8 31,972.6 41,190.2 4,854.8 20,335.4 16,000.0
3.22

City of Guelph
2019 to 2023 Tax Supported Capital Forecast
Parks, Recreation Programs
Total
Project Cost Grants & Federal DC Net Cost Equipment City
Project Number & Description 2019 2020 2021 2022 2023 (2019-2023) Subsidies Gas Tax Other DC's Debt to City Replacement Reserves Debt
VRRC
RF0046 VRRC- BULKHEADS 110.0 110.0 110.0 110.0
Total VRRC 110.0 110.0 110.0 110.0
Centennial
RF0047 CENTENNIAL POOL- MEETING ROOMS 10.0 10.0 10.0 10.0
Total Centennial 10.0 10.0 10.0 10.0
Parks Planning Growth
PK0002 GUELPH TRAILS 1,400.0 1,500.0 2,500.0 5,400.0 4,860.0 540.0 540.0
PK0014 EASTVIEW COMMUNITY PARK 2,000.0 2,000.0 1,800.0 200.0 200.0
PK0016 PERGOLA PROPERTY 200.0 200.0 180.0 20.0 20.0
PK0021 GRANGEHILL PHASE 5 300.0 300.0 270.0 30.0 30.0
PK0026 HOWITT PARK 500.0 500.0 450.0 50.0 50.0
PK0034 KORTRIGHT NEIGHBOURHOOD PARK 470.0 470.0 423.0 47.0 47.0
PK0036 CITYVIEW DRIVE PARK 100.0 100.0 90.0 10.0 10.0
PK0037 KORTRIGHT SPORTS COMPLEX 1,000.0 1,000.0 2,000.0 1,800.0 200.0 200.0
PK0039 IMICO PROPERTY PARK 100.0 450.0 550.0 495.0 55.0 55.0
PK0042 YORK OPEN SPACE DEVELOPMENT 600.0 600.0 540.0 60.0 60.0
PK0043 EASTVIEW OPEN SPACE 500.0 500.0 450.0 50.0 50.0
PK0045 VALLEY ROAD PARK 600.0 600.0 540.0 60.0 60.0
PK0049 270 GRANGE ROAD - NEW PARKETTE 100.0 100.0 90.0 10.0 10.0
PK0050 YORK DISTRICT COMMUNITY PARK 1,000.0 1,000.0 900.0 100.0 100.0
PK0051 VICTORIA ROAD N COMMUNITY PARK 150.0 1,000.0 500.0 1,650.0 1,485.0 165.0 165.0
PK0060 WOODS SUB PH 1 PARK 600.0 600.0 540.0 60.0 60.0
PK0061 WOODS SUB PH 2 PARK 600.0 600.0 540.0 60.0 60.0
PK0068 EAST NODE NEIGHBOURHOOD PARK 600.0 600.0 540.0 60.0 60.0
PK0070 VICTORIA PARK VILLAGE 350.0 350.0 315.0 35.0 35.0
PK0071 WELLINGTON PARK 75.0 16,000.0 500.0 16,575.0 3,137.8 9,000.0 9,000.0
PK0073 PARKS, CULTURE AND RECREATION 200.0 200.0 180.0 20.0 20.0
PK0074 WATSON PARKETTE 295.0 295.0 265.5 29.5 29.5
Total Parks Planning Growth 5,165.0 2,450.0 6,175.0 20,900.0 500.0 35,190.0 3,137.8 16,753.5 10,861.5 1,861.5 9,000.0
Parks Planning Non-Growth
PK0005 SUNNY ACRES 500.0 231.0 731.0 731.0 731.0
PK0009 HUGH GUTHERIE PARK REDEVELOPMENT 600.0 394.0 994.0 994.0 994.0
PK0012 DAKOTA PARK REDEVELOPMENT 300.0 300.0 300.0 300.0
PK0022 GUELPH TRAIL UPGRADES 250.0 400.0 150.0 600.0 1,400.0 1,400.0 1,400.0
PK0023 LYON PARK 300.0 300.0 300.0 300.0
PK0025 NORM JARY PARK 400.0 350.0 750.0 750.0 750.0
PK0028 MARGARET GREENE 500.0 500.0 500.0 500.0
PK0031 ST GEORGE'S PARK REDEVELOPMENT 400.0 400.0 400.0 400.0
PK0033 PLAYGROUND EQUIPMENT REPLA 413.0 354.2 285.3 644.7 1,697.2 1,697.2 1,697.2
PK0065 ROYAL JAYCESS PARK REDEV 150.0 150.0 150.0 150.0
PK0066 RIVERSIDE PARK MASTERPLAN 150.0 150.0 150.0 150.0
PK0067 NEW PARK WASHROOMS 300.0 300.0 600.0 600.0 600.0
Total Parks Planning Non-Growth 2,263.0 2,998.2 1,466.3 1,244.7 7,972.2 7,972.2 1,697.2 6,275.0
Parks Operations
PO0006 PARKS IRRIGATION 125.0 65.0 65.0 65.0 65.0 385.0 385.0 385.0
PO0007 PARKS INFRASTRUCTURE 450.0 550.0 600.0 600.0 600.0 2,800.0 2,800.0 2,800.0
PO0008 TREES FOR GUELPH GREENING 30.0 30.0 35.0 40.0 40.0 175.0 175.0 175.0
PO0014 PARKS EQUIPMENT GROWTH 55.0 105.0 324.0 250.0 250.0 984.0 797.0 187.0 187.0
PO0017 SPORTS FIELD RENOVATIONS 150.0 150.0 150.0 150.0 150.0 750.0 750.0 750.0
Total Parks Operations 810.0 900.0 1,174.0 1,105.0 1,105.0 5,094.0 797.0 4,297.0 4,297.0
Total Parks, Recreation Programs & Facilities 8,348.0 6,358.2 8,815.3 23,249.7 1,605.0 48,376.2 3,137.8 17,550.5 23,250.7 1,697.2 12,553.5 9,000.0
Gross Project Cost ('000s) Sources of External Funding
3.23

City of Guelph
2014 Tax Supported Capital Budget
2015 to 2023 Tax Supported Capital Forecast
Arts, Culture & Entertainmet
Total
Next Project Grants & Federal DC Net Cost Equipment City
Project Number & Description 2014 2015 2016 2017 2018 5 Years Cost Subsidies Gas Tax Other DC's Debt to City Replacement Reserves Debt
11 Museum
MU0013 MCCRAE COACH HOUSE RENOS 20.0 20.0 20.0 20.0
MU0015 MCCRAE HOUSE MAIN GALLERY RENOS 30.0 30.0 30.0 30.0
MU0017 CIVIC MUSEUM PH 2 EXTERIOR 250.0 350.0 600.0 250.0 350.0 350.0
MU0019 Civic Museum - Replace Permanent Gallery Exhibitions 250.0 250.0 250.0 250.0
Total 11 Museum 280.0 350.0 20.0 250.0 900.0 250.0 650.0 650.0
12 River Run
RR0101 FRONT OF HOUSE 100.0 25.0 373.0 498.0 498.0 498.0
RR0102 BOX OFFICE / OTHER 25.0 60.0 25.0 110.0 110.0 110.0
RR0103 TECHNICAL / THEATRE 50.0 65.0 45.0 200.0 973.0 1,333.0 1,333.0 1,333.0
Total 12 River Run 75.0 165.0 105.0 25.0 200.0 1,371.0 1,941.0 1,941.0 1,941.0
13 Sleeman Centre
RF0028 SLEEMAN- REPL CONSESSION EQUIP 25.0 60.0 85.0 85.0 85.0
RF0029 SLEEMAN- SEATING UPGRADE 30.0 30.0 30.0 30.0
RF0030 SLEEMAN- REPL RINK MESH & WINCH 45.0 45.0 45.0 45.0
RF0033 SLEEMAN- VIDEO SCORE CLOCK REPL 450.0 450.0 450.0 450.0
RF0052 SLEEMAN SPONSORSHIP PROJECT 65.0 70.0 70.0 70.0 70.0 74.0 419.0 419.0 419.0
RF0063 SLEEMAN FRIDGES/FREEZERS 20.0 20.0 20.0 20.0
RF0064 SLEEMAN VENDING MACHINES 20.0 20.0 20.0 20.0
RF0078 Sleeman - Audio replacement 95.0 95.0 95.0 95.0
RF0079 Sleeman - POS System Replacement 125.0 125.0 125.0 125.0
Total 13 Sleeman Centre 110.0 70.0 95.0 70.0 90.0 854.0 1,289.0 1,289.0 1,289.0
Total Arts, Culture & Entertainment 465.0 585.0 200.0 95.0 310.0 2,475.0 4,130.0 250.0 3,880.0 3,880.0
Gross Project Cost ('000s) Sources of External Funding
3.24

City of Guelph
2019 to 2023 Tax Supported Capital Forecast
Arts, Culture & Entertainmet
Total
Project Cost Grants & Federal DC Net Cost Equipment City
Project Number & Description 2019 2020 2021 2022 2023 (2019-2023) Subsidies Gas Tax Other DC's Debt to City Replacement Reserves Debt
Museum
MU0019 Civic Museum - Replace Permanent Gallery Exhibitions 250.0 250.0 250.0 250.0
Total Museum 250.0 250.0 250.0 250.0
River Run
RR0101 FRONT OF HOUSE 288.0 85.0 373.0 373.0 373.0
RR0102 BOX OFFICE / OTHER 25.0 25.0 25.0 25.0
RR0103 TECHNICAL / THEATRE 425.0 125.0 283.0 75.0 65.0 973.0 973.0 973.0
Total River Run 425.0 125.0 571.0 160.0 90.0 1,371.0 1,371.0 1,371.0
Sleeman Centre
RF0028 SLEEMAN- REPL CONSESSION EQUIP 30.0 30.0 60.0 60.0 60.0
RF0029 SLEEMAN- SEATING UPGRADE 30.0 30.0 30.0 30.0
RF0033 SLEEMAN- VIDEO SCORE CLOCK REPL 450.0 450.0 450.0 450.0
RF0052 SLEEMAN SPONSORSHIP PROJECT 74.0 74.0 74.0 74.0
RF0063 SLEEMAN FRIDGES/FREEZERS 20.0 20.0 20.0 20.0
RF0078 Sleeman - Audio replacement 95.0 95.0 95.0 95.0
RF0079 Sleeman - POS System Replacement 125.0 125.0 125.0 125.0
Total Sleeman Centre 74.0 510.0 20.0 220.0 30.0 854.0 854.0 854.0
Total Arts, Culture & Entertainment 499.0 635.0 591.0 380.0 370.0 2,475.0 2,475.0 2,475.0
Gross Project Cost ('000s) Sources of External Funding
3.25
City of Guelph
2014 Tax Supported Capital Budget
2015 to 2023 Tax Supported Capital Forecast
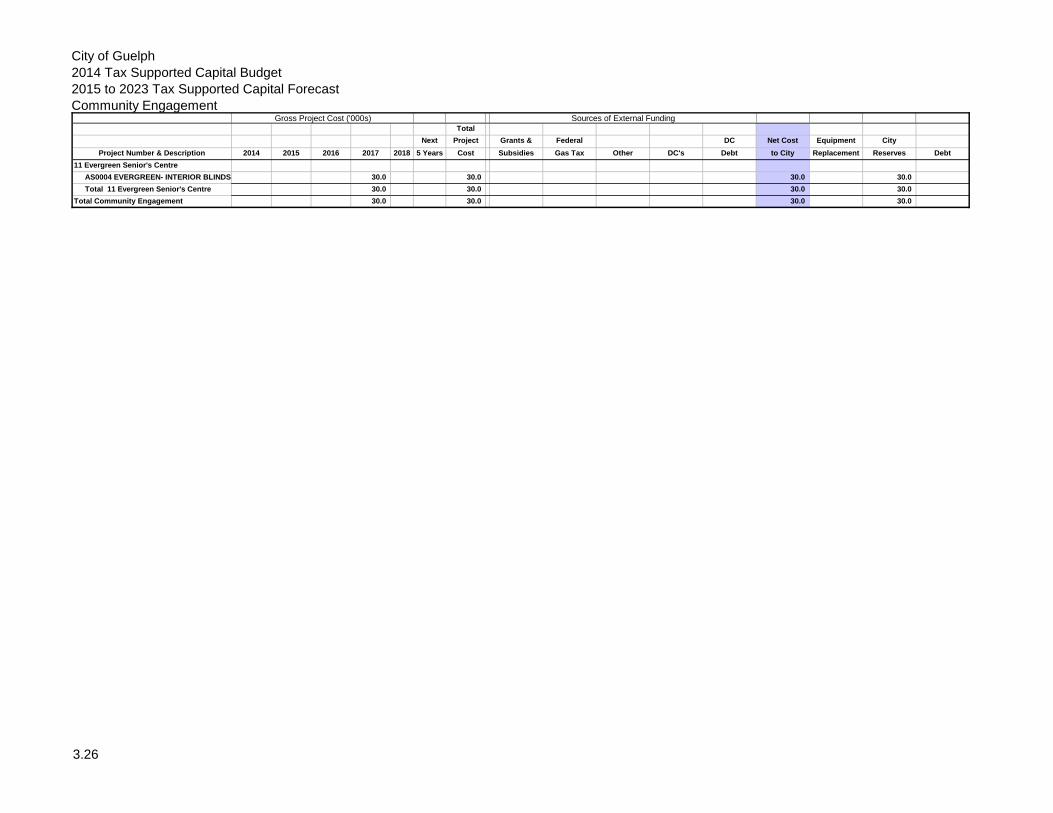
Community Engagement
Total
Next Project Grants & Federal DC Net Cost Equipment City
Project Number & Description 2014 2015 2016 2017 2018 5 Years Cost Subsidies Gas Tax Other DC's Debt to City Replacement Reserves Debt
11 Evergreen Senior's Centre
AS0004 EVERGREEN- INTERIOR BLINDS 30.0 30.0 30.0 30.0
Total 11 Evergreen Senior's Centre 30.0 30.0 30.0 30.0
Total Community Engagement 30.0 30.0 30.0 30.0
Gross Project Cost ('000s) Sources of External Funding
3.26

City of Guelph
2014 Tax Supported Capital Budget
2015 to 2023 Tax Supported Capital Forecast
Corporate Building (Capital)
Total
Next Project Grants & Federal DC Net Cost Equipment City
Project Number & Description 2014 2015 2016 2017 2018 5 Years Cost Subsidies Gas Tax Other DC's Debt to City Replacement Reserves Debt
11 Life Cycle
FS0054 FIRE LIFECYCLE 566.0 314.5 145.0 414.5 1,440.0 1,440.0 1,440.0
GG0232 ADMIN LIFECYCLE 517.0 85.0 65.0 199.0 530.0 1,396.0 1,396.0 1,396.0
GG0233 OPERATIONS AND TRANSIT LIFECYCLE 162.0 53.5 508.5 1,213.5 1,224.0 3,161.5 3,161.5 3,161.5
LB0023 LIFE CYCLE - LIBRARY 68.0 15.0 690.0 773.0 773.0 773.0
PO0021 PARKS LIFECYCLE 340.0 330.0 320.0 301.0 30.0 1,012.0 2,333.0 2,333.0 2,333.0
RF0080 RECREATION LIFECYCLE 751.0 1,575.5 503.0 115.0 1,083.0 7,312.5 11,340.0 11,340.0 11,340.0
WC0012 LIFE CYCLE WET/DRY ADMIN 125.0 100.0 225.0 225.0 225.0
Total 11 Life Cycle 2,174.0 2,152.5 876.5 1,372.0 2,810.5 11,283.0 20,668.5 20,668.5 20,668.5
12 Structural
GG0234 STRUCTURAL 455.0 475.0 350.0 400.0 225.0 925.0 2,830.0 2,830.0 2,830.0
Total 12 Structural 455.0 475.0 350.0 400.0 225.0 925.0 2,830.0 2,830.0 2,830.0
13 Accessibility
GG0180 ACCESSIBILITY IMPROVEMENTS 100.0 100.0 200.0 200.0 200.0 1,000.0 1,800.0 1,800.0 1,800.0
GG0181 GUELPH LAKE ACCESSIBILITY 50.0 50.0 50.0 50.0
LB0025 LIBRARY BULLFROG ACCESSIBILITY 50.0 50.0 50.0 50.0
RF0014 CENTENNIAL ARENA ACCESSIBILITY 50.0 50.0 50.0 50.0
Total 13 Accessibility 200.0 100.0 200.0 200.0 200.0 1,050.0 1,950.0 1,950.0 1,950.0
14 City Hall
GG0163 ENERGY CONSERVATION INITIATIVES 80.0 80.0 80.0 80.0
Total 14 City Hall 80.0 80.0 80.0 80.0
Total Corporate Building (Capital) Maintenance 2,829.0 2,727.5 1,426.5 1,972.0 3,235.5 13,338.0 25,528.5 25,528.5 25,528.5
Gross Project Cost ('000s) Sources of External Funding
3.27

City of Guelph
2019 to 2023 Tax Supported Capital Forecast
Corporate Building (Capital)
Total
Project Cost Grants & Federal DC Net Cost Equipment City
Project Number & Description 2019 2020 2021 2022 2023 (2019-2023) Subsidies Gas Tax Other DC's Debt to City Replacement Reserves Debt
Life Cycle
FS0054 FIRE LIFECYCLE 67.0 72.0 150.5 50.0 75.0 414.5 414.5 414.5
GG0232 ADMIN LIFECYCLE 150.0 95.0 200.0 85.0 530.0 530.0 530.0
GG0233 OPERATIONS AND TRANSIT LIFECYCLE 664.0 460.0 75.0 25.0 1,224.0 1,224.0 1,224.0
LB0023 LIFE CYCLE - LIBRARY 140.0 181.0 369.0 690.0 690.0 690.0
PO0021 PARKS LIFECYCLE 300.0 50.0 315.0 347.0 1,012.0 1,012.0 1,012.0
RF0080 RECREATION LIFECYCLE 1,340.0 1,915.0 1,248.0 1,455.0 1,354.5 7,312.5 7,312.5 7,312.5
WC0012 LIFE CYCLE WET/DRY ADMIN 100.0 100.0 100.0 100.0
Total Life Cycle 1,857.0 2,936.0 1,858.5 2,376.0 2,255.5 11,283.0 11,283.0 11,283.0
Structural
GG0234 STRUCTURAL 225.0 225.0 225.0 125.0 125.0 925.0 925.0 925.0
Total Structural 225.0 225.0 225.0 125.0 125.0 925.0 925.0 925.0
Accessibility
GG0180 ACCESSIBILITY IMPROVEMENTS 200.0 200.0 200.0 200.0 200.0 1,000.0 1,000.0 1,000.0
LB0025 LIBRARY BULLFROG ACCESSIBILITY 50.0 50.0 50.0 50.0
Total Accessibility 200.0 250.0 200.0 200.0 200.0 1,050.0 1,050.0 1,050.0
City Hall
GG0163 ENERGY CONSERVATION INITIATIVES 80.0 80.0 80.0 80.0
Total City Hall 80.0 80.0 80.0 80.0
Total Corporate Building (Capital) Maintenance 2,282.0 3,491.0 2,283.5 2,701.0 2,580.5 13,338.0 13,338.0 13,338.0
Gross Project Cost ('000s) Sources of External Funding
3.28

City of Guelph
2014 Tax Supported Capital Budget
2015 to 2023 Tax Supported Capital Forecast
Information Technology
Total
Next Project Grants & Federal DC Net Cost Equipment City
Project Number & Description 2014 2015 2016 2017 2018 5 Years Cost Subsidies Gas Tax Other DC's Debt to City Replacement Reserves Debt
12 Information Technology Non-Growth
IT0001 FOLDING MACHING REPL 30.0 35.0 65.0 65.0 65.0
IT0011 DOWNTOWN FIBRE OPTIC NETWORK 75.0 75.0 75.0 75.0
IT0013 DATA ARCHIVAL SYSTEM 65.5 65.5 131.0 131.0 131.0
IT0015 LAND AMBULANCE ITS REPL 89.4 202.2 93.0 70.4 166.1 539.1 1,160.2 464.2 696.0 696.0
IT0016 DESKTOP REPLACEMENT 122.2 281.7 297.2 395.7 140.2 1,588.4 2,825.4 2,825.4 2,825.4
IT0017 NETWORK EQUIP REPLACEMENT 369.6 340.3 194.7 197.9 200.0 1,441.5 2,744.0 2,744.0 2,744.0
IT0018 SERVER REPLACEMENT 141.2 218.5 248.5 440.1 150.0 1,742.2 2,940.5 2,940.5 2,940.5
IT0019 SOFTWARE UPGRADE REPL 206.0 206.0 546.9 141.0 300.0 1,677.9 3,077.8 3,077.8 3,077.8
IT0020 PRINTER REPLACEMENT 31.1 152.3 15.6 34.9 287.3 521.2 521.2 521.2
IT0024 IT STRATEGIC PLAN 259.0 854.0 300.0 300.0 1,713.0 1,713.0 1,713.0
IT0025 IT VOIP SYSTEM REPLACEMENT 73.8 177.9 197.1 14.7 1,022.7 1,486.2 1,486.2 1,486.2
IT0027 IT STRATEGIC PLAN - LAND AMBUL 17.8 58.6 20.6 20.6 117.6 47.0 70.6 70.6
Total 12 Information Technology Non-Growth 1,310.1 2,339.2 1,853.2 1,873.9 1,005.9 8,474.6 16,856.9 511.2 16,345.7 14,356.1 1,989.6
Total Information Technology 1,310.1 2,339.2 1,853.2 1,873.9 1,005.9 8,474.6 16,856.9 511.2 16,345.7 14,356.1 1,989.6
Gross Project Cost ('000s) Sources of External Funding
3.29

City of Guelph
2019 to 2023 Tax Supported Capital Forecast
Information Technology
Total
Project Cost Grants & Federal DC Net Cost Equipment City
Project Number & Description 2019 2020 2021 2022 2023 (2019-2023) Subsidies Gas Tax Other DC's Debt to City Replacement Reserves Debt
Information Technology Non-Growth
IT0001 FOLDING MACHING REPL 35.0 35.0 35.0 35.0
IT0011 DOWNTOWN FIBRE OPTIC NETWORK 75.0 75.0 75.0 75.0
IT0013 DATA ARCHIVAL SYSTEM 65.5 65.5 65.5 65.5
IT0015 LAND AMBULANCE ITS REPL 90.4 90.5 188.9 85.1 84.2 539.1 215.7 323.4 323.4
IT0016 DESKTOP REPLACEMENT 322.2 374.5 440.8 131.9 319.0 1,588.4 1,588.4 1,588.4
IT0017 NETWORK EQUIP REPLACEMENT 298.0 415.1 232.9 293.2 202.3 1,441.5 1,441.5 1,441.5
IT0018 SERVER REPLACEMENT 314.6 339.0 397.0 271.1 420.5 1,742.2 1,742.2 1,742.2
IT0019 SOFTWARE UPGRADE REPL 411.0 141.0 491.9 411.0 223.0 1,677.9 1,677.9 1,677.9
IT0020 PRINTER REPLACEMENT 32.4 6.8 209.8 15.1 23.2 287.3 287.3 287.3
IT0025 IT VOIP SYSTEM REPLACEMENT 363.5 202.8 20.8 21.3 414.3 1,022.7 1,022.7 1,022.7
Total Information Technology Non-Growth 1,832.1 1,635.2 1,982.1 1,338.7 1,686.5 8,474.6 215.7 8,258.9 8,118.4 140.5
Total Information Technology 1,832.1 1,635.2 1,982.1 1,338.7 1,686.5 8,474.6 215.7 8,258.9 8,118.4 140.5
Gross Project Cost ('000s) Sources of External Funding
3.30

City of Guelph
2014 Tax Supported Capital Budget
2015 to 2023 Tax Supported Capital Forecast
Police
Total
Next Project Grants & Federal DC Net Cost Equipment City
Project Number & Description 2014 2015 2016 2017 2018 5 Years Cost Subsidies Gas Tax Other DC's Debt to City Replacement Reserves Debt
11 Police Growth
PS0033 POLICE HQ RENOVATIONS 20,407.7 20,407.7 20,407.7 20,407.7
PS0041 JOINT FIRE/POLICE TRAINING FACILITY 1,039.0 1,039.0 519.5 519.5 519.5
Total 11 Police Growth 20,407.7 1,039.0 21,446.7 519.5 20,927.2 519.5 20,407.7
12 Police Non-Growth
PS0032 POLICE VEHICLES NEW 22.6 61.9 63.2 130.4 278.1 278.1 278.1
PS0044 POLICE IT HARDWARE 552.6 161.5 335.2 260.6 509.1 2,639.1 4,458.1 4,458.1 4,458.1
PS0045 POLICE BODY ARMOUR 73.0 28.4 65.4 64.7 61.4 323.4 616.3 616.3 616.3
PS0046 POLICE FURNITURE 16.4 16.8 17.2 17.6 18.0 95.2 181.2 181.2 181.2
PS0047 POLICE VEHICLE BASED EQUIPMENT 66.2 98.2 81.1 108.8 111.8 610.2 1,076.3 1,076.3 1,076.3
PS0048 POLICE TACTICAL EQUIPMENT 17.8 84.9 16.1 25.2 55.7 271.8 471.5 471.5 471.5
PS0049 POLICE EQUIPMENT GENERAL 103.3 179.0 120.9 178.7 59.9 404.8 1,046.6 1,046.6 1,046.6
PS0057 POLICE VEHICLE REPL 712.0 552.1 426.1 576.9 570.6 3,345.5 6,183.2 80.0 6,103.2 6,103.2
PS0059 Radio System Infrastructure 1,000.0 1,000.0 1,000.0 1,000.0
PS0060 Telecom Equipment 400.0 400.0 400.0 400.0
PS0061 HQ IT Equipment 100.0 100.0 200.0 200.0 200.0
PS0062 RADIO RISK STUDY 25.0 25.0 25.0 25.0
PS0063 POLICE PC RADAR 13.9 13.9 13.9 13.9
Total 12 Police Non-Growth 1,588.9 1,220.9 2,623.9 1,232.5 1,449.7 7,834.3 15,950.2 80.0 15,870.2 15,385.9 484.3
Total Police 21,996.6 1,220.9 2,623.9 1,232.5 1,449.7 8,873.3 37,396.9 80.0 519.5 36,797.4 15,385.9 1,003.8 20,407.7
Gross Project Cost ('000s) Sources of External Funding
3.31

City of Guelph
2019 to 2023 Tax Supported Capital Forecast
Police
Total
Project Cost Grants & Federal DC Net Cost Equipment City
Project Number & Description 2019 2020 2021 2022 2023 (2019-2023) Subsidies Gas Tax Other DC's Debt to City Replacement Reserves Debt
Police Growth
PS0041 JOINT FIRE/POLICE TRAINING FACILITY 1,039.0 1,039.0 519.5 519.5 519.5
Total Police Growth 1,039.0 1,039.0 519.5 519.5 519.5
Police Non-Growth
PS0032 POLICE VEHICLES NEW 64.5 65.9 130.4 130.4 130.4
PS0044 POLICE IT HARDWARE 702.1 407.8 765.7 150.4 613.1 2,639.1 2,639.1 2,639.1
PS0045 POLICE BODY ARMOUR 80.6 31.4 72.2 71.4 67.8 323.4 323.4 323.4
PS0046 POLICE FURNITURE 18.4 18.8 19.2 19.2 19.6 95.2 95.2 95.2
PS0047 POLICE VEHICLE BASED EQUIPMENT 119.3 104.3 98.4 160.7 127.5 610.2 610.2 610.2
PS0048 POLICE TACTICAL EQUIPMENT 25.6 26.3 30.2 58.2 131.5 271.8 271.8 271.8
PS0049 POLICE EQUIPMENT GENERAL 77.0 105.5 66.3 68.3 87.7 404.8 404.8 404.8
PS0057 POLICE VEHICLE REPL 645.1 641.6 557.2 780.5 721.1 3,345.5 40.0 3,305.5 3,305.5
PS0063 POLICE PC RADAR 13.9 13.9 13.9 13.9
Total Police Non-Growth 1,668.1 1,400.2 1,623.1 1,374.6 1,768.3 7,834.3 40.0 7,794.3 7,568.7 225.6
Total Police 1,668.1 1,400.2 1,623.1 1,374.6 2,807.3 8,873.3 40.0 519.5 8,313.8 7,568.7 745.1
Gross Project Cost ('000s) Sources of External Funding
3.32

City of Guelph
2014 Tax Supported Capital Budget
2015 to 2023 Tax Supported Capital Forecast
Library
Total
Next Project Grants & Federal DC Net Cost Equipment City
Project Number & Description 2014 2015 2016 2017 2018 5 Years Cost Subsidies Gas Tax Other DC's Debt to City Replacement Reserves Debt
12 Library Non-Growth
LB0018 RFID INVENTORY CONTROL SYSTEM 100.0 105.0 135.0 150.0 100.0 150.0 740.0 740.0 740.0
LB0019 LIBRARY SYSTEM/NETWORK UPGRDS 40.0 45.0 50.0 250.0 385.0 385.0 385.0
LB0020 MAIN LIBRARY UPGRADES 10.0 10.0 10.0 10.0 40.0 40.0 40.0
LB0021 BRANCH EXPANSION- BULLFROG 310.0 310.0 310.0 310.0
LB0032 LIBRARY OUTREACH SERV EXPANSIO 50.0 50.0 100.0 100.0 100.0
LB0033 BRANCH UPGRADES & SUSTAINABILITY 75.0 25.0 35.0 35.0 75.0 245.0 245.0 245.0
Total 12 Library Non-Growth 225.0 140.0 275.0 160.0 185.0 835.0 1,820.0 1,820.0 1,820.0
Total Library 225.0 140.0 275.0 160.0 185.0 835.0 1,820.0 1,820.0 1,820.0
Gross Project Cost ('000s) Sources of External Funding
3.33

City of Guelph
2019 to 2023 Tax Supported Capital Forecast
Library
Total
Project Cost Grants & Federal DC Net Cost Equipment City
Project Number & Description 2019 2020 2021 2022 2023 (2019-2023) Subsidies Gas Tax Other DC's Debt to City Replacement Reserves Debt
Library Non-Growth
LB0018 RFID INVENTORY CONTROL SYSTEM 150.0 150.0 150.0 150.0
LB0019 LIBRARY SYSTEM/NETWORK UPGRDS 200.0 50.0 250.0 250.0 250.0
LB0021 BRANCH EXPANSION- BULLFROG 310.0 310.0 310.0 310.0
LB0032 LIBRARY OUTREACH SERV EXPANSIO 50.0 50.0 50.0 50.0
LB0033 BRANCH UPGRADES & SUSTAINABILITY 35.0 40.0 75.0 75.0 75.0
Total Library Non-Growth 235.0 310.0 90.0 200.0 835.0 835.0 835.0
Total Library 235.0 310.0 90.0 200.0 835.0 835.0 835.0
Gross Project Cost ('000s) Sources of External Funding
3.34

City of Guelph
2014 Tax Supported Capital Budget
2015 to 2023 Tax Supported Capital Forecast
Economic Development
Total
Next Project Grants & Federal DC Net Cost Equipment City
Project Number & Description 2014 2015 2016 2017 2018 5 Years Cost Subsidies Gas Tax Other DC's Debt to City Replacement Reserves Debt
12 Economic Development Non-Growth
SS0002 HANLON CREEK BUSINESS PARK 14,514.3 14,514.3 14,514.3
Total 12 Economic Development Non-Growth 14,514.3 14,514.3 14,514.3
Total Economic Development 14,514.3 14,514.3 14,514.3
Gross Project Cost ('000s) Sources of External Funding
3.35

City of Guelph
2019 to 2023 Tax Supported Capital Forecast
Economic Development
Total
Project Cost Grants & Federal DC Net Cost Equipment City
Project Number & Description 2019 2020 2021 2022 2023 (2019-2023) Subsidies Gas Tax Other DC's Debt to City Replacement Reserves Debt
Economic Development Non-Growth
SS0002 HANLON CREEK BUSINESS PARK 380.4 8,369.0 5,764.9 14,514.3 14,514.3
Total Economic Development Non-Growth 380.4 8,369.0 5,764.9 14,514.3 14,514.3
Total Economic Development 380.4 8,369.0 5,764.9 14,514.3 14,514.3
Gross Project Cost ('000s) Sources of External Funding
3.36

City of Guelph
2014 Tax Supported Capital Budget
2015 to 2023 Tax Supported Capital Forecast
Finance & Other
Total
Next Project Grants & Federal DC Net Cost Equipment City
Project Number & Description 2014 2015 2016 2017 2018 5 Years Cost Subsidies Gas Tax Other DC's Debt to City Replacement Reserves Debt
11 Finance
GG0024 DC STUDY 2013 140.0 140.0 113.4 26.6 26.6
Total 11 Finance 140.0 140.0 113.4 26.6 26.6
12 Other Funding Requests
GG0227 PUBLIC HEALTH NEW 2013 11,888.5 11,888.5 11,888.5 11,888.5
Total 12 Other Funding Requests 11,888.5 11,888.5 11,888.5 11,888.5
Total Finance & Other 11,888.5 140.0 12,028.5 113.4 11,915.1 26.6 11,888.5
Gross Project Cost ('000s) Sources of External Funding
3.37
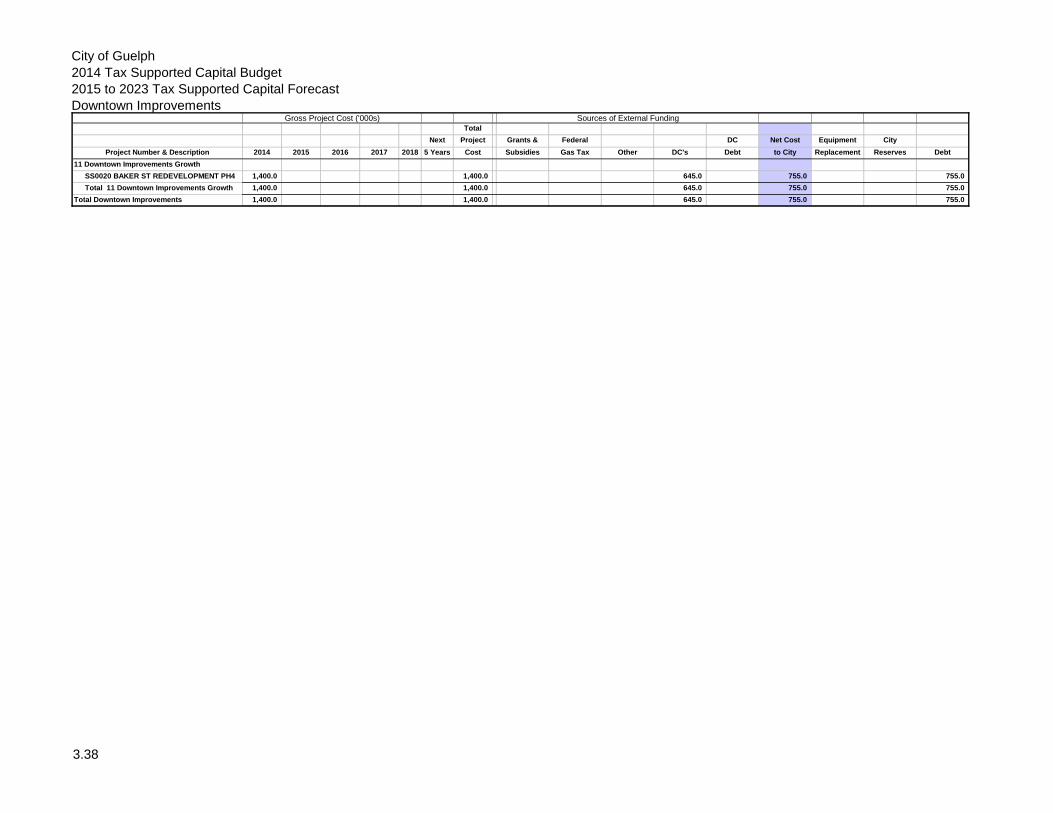
City of Guelph
2014 Tax Supported Capital Budget
2015 to 2023 Tax Supported Capital Forecast
Downtown Improvements
Total
Next Project Grants & Federal DC Net Cost Equipment City
Project Number & Description 2014 2015 2016 2017 2018 5 Years Cost Subsidies Gas Tax Other DC's Debt to City Replacement Reserves Debt
11 Downtown Improvements Growth
SS0020 BAKER ST REDEVELOPMENT PH4 1,400.0 1,400.0 645.0 755.0 755.0
Total 11 Downtown Improvements Growth 1,400.0 1,400.0 645.0 755.0 755.0
Total Downtown Improvements 1,400.0 1,400.0 645.0 755.0 755.0
Gross Project Cost ('000s) Sources of External Funding
3.38

City of Guelph
2014 Tax Supported Capital Budget
2015 to 2023 Tax Supported Capital Forecast
Community Energy Plan
Total
Next Project Grants & Federal DC Net Cost Equipment City
Project Number & Description 2014 2015 2016 2017 2018 5 Years Cost Subsidies Gas Tax Other DC's Debt to City Replacement Reserves Debt
12 Community Energy Plan Non-Growth
PL0029 FACILITY ENERGY MEASURES 985.6 1,085.5 1,214.0 1,109.9 1,268.6 6,343.0 12,006.6 3,602.2 8,404.4 8,404.4
Total 12 Community Energy Plan Non-Growth 985.6 1,085.5 1,214.0 1,109.9 1,268.6 6,343.0 12,006.6 3,602.2 8,404.4 8,404.4
Total Community Energy Plan 985.6 1,085.5 1,214.0 1,109.9 1,268.6 6,343.0 12,006.6 3,602.2 8,404.4 8,404.4
Gross Project Cost ('000s) Sources of External Funding
3.39

City of Guelph
2019 to 2023 Tax Supported Capital Forecast
Community Energy Plan
Total
Project Cost Grants & Federal DC Net Cost Equipment City
Project Number & Description 2019 2020 2021 2022 2023 (2019-2023) Subsidies Gas Tax Other DC's Debt to City Replacement Reserves Debt
Community Energy Plan Non-Growth
PL0029 FACILITY ENERGY MEASURES 1,268.6 1,268.6 1,268.6 1,268.6 1,268.6 6,343.0 1,903.0 4,440.0 4,440.0
Total Community Energy Plan Non-Growth 1,268.6 1,268.6 1,268.6 1,268.6 1,268.6 6,343.0 1,903.0 4,440.0 4,440.0
Total Community Energy Plan 1,268.6 1,268.6 1,268.6 1,268.6 1,268.6 6,343.0 1,903.0 4,440.0 4,440.0
Gross Project Cost ('000s) Sources of External Funding
3.40

City of Guelph – Capital Investment Strategy: 2014–2023 proposed Capital Budget and Forecast
APPENDIX C: CAPITAL FUNDING SOURCES
During the process of developing the annual capital budget, much work is put into balancing the availability of funds from various sources. When discussing the City’s capital budget, people often ask why a given project was (or wasn’t) included.
A project may be included or excluded depending on its source(s) of funding and its availability in a given year. This appendix is designed to explain each potential funding source, and how they in� uence Guelph’s Financial Strategy.
Tax-supportedProjects supported can range from replacement and renewal activities to service expansion due to growth and even the introduction of new facilities or services.
In terms of replacement and renewal these funds are focused on replacement and major repair of equipment, facilities and infrastructure which the City already owns. These funds are needed on an annual basis to ensure that the City is able to deliver the services it is currently providing to taxpayers.
For service expansion projects due to growth the � rst source of funding is generally Development Charges (DC) (see below), however due to limitations in the provincial Development Charges Act (DC Act), certain portions of these projects may need to be funded from City revenues. Each project is evaluated on its eligibility for DC funding and the balance is generally funded from tax revenue.
When the City looks at introducing new facilities or services requiring capital assets or expanding activities not covered by the DC Act, the burden falls to current taxpayers through direct tax-supported capital contributions unless third party sources can be secured.
Although the City is free to use these funds as needed, there are guidelines and principles directing the allocation of these funds.
Own RevenueIn some situations speci� c assets or activities may generate their own sources of capital revenue, either through fees or donations/sponsorships. This applies to the Library Board and major recreation and cultural facilities such as the River Run Centre and Sleeman Centre. A portion of their fees or direct donations/sponsorships are contributed to reserve funds speci� cally earmarked to provide for capital renewal spending or future expansion activities.
>> Overview
City of Guelph – Capital Investment Strategy: 2014–2023 proposed Capital Budget and Forecast
APPENDIX C: CAPITAL FUNDING SOURCES
External PartnerAs we partner with a number of local agencies and other levels of government we manage capital projects which provide services to not only the citizens of Guelph but also a larger community outside of the City boundaries. In these cases the external partner will provide funding based on a formula designed to distribute the costs equitably amongst those that bene� t from it. Examples of this include Land Ambulance services and projects related to the Grand River Watershed.
We also from time to time partner with local developers to expand City infrastructure projects to incorporate their needs in order to save the City and the developer time and money. This includes projects where items such as additional turning lanes, sidewalks, sewer and water services are installed earlier then needed as part of a larger City project in order to avoid the inconvenience and added cost of doing the works in the near future. In these instances the developer contributes the amount equal to the work that would not normally be undertaken by the City.
Grant FundingThere are two main scenarios for grant funding; upfront funding with follow up reporting, or as completed reimbursement of expenses.
In the � rst instance an allotment is made by the granting body or an application is made for funds. The funds are received at scheduled times regardless of stage of the project. However, follow up reporting is required to ensure funds are not recalled or future eligibility for funds is not terminated. The Federal Gas Tax program and the Municipal Infrastructure Investment Initiative (MIII) are examples of this type of funding. The funds may be provided for a speci� c project or for certain types of capital activities.
The second type provides for funding based on a formula up to a maximum amount. In order to receive funding, eligible expenditures must have occurred and reimbursement is requested through the approving agency. The recent Infrastructure Stimulus Funding (ISF) program is an example of this. If the City does not spend the money on the approved project the funding is not provided.
Development ChargesDevelopment Charges (DCs) are a way for projects to be paid for by the growth that is requiring the expanded services. In order for a project to receive DC funding it must be included in a DC Background Study (currently underway for 2014), indicating the share of the project that will bene� t growth. In addition the Municipal DC Act stipulates other reductions based on various criteria. The result is that the majority of growth related projects receive less than 100% of their funding from growth and must rely on additional funding from tax supported sources in order to fund the balance. Each growth related project is unique in its ratio of DC funded to non-DC funded portion.

City of Guelph – Capital Investment Strategy: 2014–2023 proposed Capital Budget and Forecast
APPENDIX C: CAPITAL FUNDING SOURCES
DebtBorrowing to fund current capital projects allows for the distribution of the costs over a number of years and to future tax payers who may bene� t from the project. The additional cost of interest on these projects limits the ability of the City to spend on future capital projects and the long term nature of the repayment may reduce the City’s � exibility in future years. The City has a Debt Policy which sets out the guidelines on the types of projects that are eligible for debt funding, as well the Provincial Government sets out constraints regarding the amount of debt a municipality may take on.

Equipment Replacement Reserve Fund Continuity Summary
Fire Transit PoliceWaste
ManagementComputer
Play
Equipment
Operations
Fleet
Equipment
Total
Closing Balance December 31, 2013 26,020 10,699 6,757 54,234 49,249 13,667 (74,491) 86,135
2014
Transfers Out (825,700) (1,902,300) (1,516,900) (937,800) (997,500) (475,600) (1,612,600) (8,268,400)
Debt Charges - Principal
Debt Charges - Interest
Transfers In 805,700 1,902,300 1,516,900 887,800 952,500 465,600 3,359,500 9,890,300
Debt Issue
Interest Earned 303 202 128 553 506 164 15,116 16,973
Closing Balance December 31, 2014 6,323 10,901 6,885 4,787 4,755 3,831 1,687,526 1,725,008
2015
Transfers Out (584,180) (1,800,000) (1,196,100) (700,000) (1,345,700) (547,000) (2,301,500) (8,474,480)
Debt Charges - Principal
Debt Charges - Interest
Transfers In 584,180 1,800,000 1,196,100 700,000 1,345,700 547,000 3,638,000 9,810,980
Debt Issue
Interest Earned 120 206 130 91 90 72 44,571 45,280
Closing Balance December 31, 2015 6,442 11,108 7,015 4,878 4,845 3,904 3,068,597 3,106,788
2016
Transfers Out (2,012,200) (1,950,000) (2,536,800) (195,000) (1,495,400) (535,000) (4,874,100) (13,598,500)
Debt Charges - Principal
Debt Charges - Interest
Transfers In 2,012,200 1,950,000 2,536,800 195,000 1,495,400 535,000 3,925,000 12,649,400
Debt Issue
Interest Earned 122 210 133 92 92 74 49,079 49,802
Closing Balance December 31, 2016 6,564 11,318 7,148 4,970 4,937 3,978 2,168,576 2,207,490
2017
Transfers Out (367,440) (2,208,100) (1,206,900) (800,000) (1,459,600) (800,000) (3,208,500) (10,050,540)
Debt Charges - Principal
Debt Charges - Interest
Transfers In 367,440 2,208,100 1,206,900 800,000 1,459,600 800,000 4,497,000 11,339,040
Debt Issue
Interest Earned 124 214 135 94 93 75 53,219 53,955
Closing Balance December 31, 2017 6,688 11,532 7,283 5,064 5,030 4,053 3,510,295 3,549,945
2018
Transfers Out (2,320,900) (2,821,400) (1,360,500) (866,000) (939,500) (800,000) (3,280,300) (12,388,600)
Debt Charges - Principal
Debt Charges - Interest
Transfers In 2,320,900 2,821,400 1,360,500 866,000 939,500 800,000 4,535,000 13,643,300
Debt Issue
Interest Earned 127 218 138 96 95 77 78,284 79,034
Closing Balance December 31, 2018 6,815 11,750 7,421 5,160 5,125 4,130 4,843,279 4,883,680
2019
Transfers Out (389,440) (2,675,600) (1,641,700) (1,773,000) (1,795,900) (413,000) (4,894,200) (13,582,840)
Debt Charges - Principal
Debt Charges - Interest
Transfers In 389,440 2,675,600 1,641,700 1,773,000 1,795,900 413,000 4,510,000 13,198,640
Debt Issue
Interest Earned 129 222 140 98 97 78 88,000 88,765
Closing Balance December 31, 2019 6,944 11,972 7,561 5,257 5,222 4,208 4,547,080 4,588,244
2020
Transfers Out (1,843,600) (2,280,800) (1,308,900) (1,206,000) (1,533,500) (354,200) (3,237,000) (11,764,000)
Debt Charges - Principal
Debt Charges - Interest
Transfers In 1,843,600 2,280,800 1,308,900 1,206,000 1,533,500 354,200 4,585,000 13,112,000
Debt Issue
Interest Earned 131 227 143 99 99 80 98,783 99,562
Closing Balance December 31, 2020 7,075 12,199 7,704 5,357 5,321 4,287 5,993,862 6,035,806
2021
Transfers Out (524,000) (3,083,000) (1,595,900) (2,465,000) (1,906,500) (285,300) (3,428,000) (13,287,700)
Debt Charges - Principal
Debt Charges - Interest
Transfers In 524,000 3,083,000 1,595,900 2,465,000 1,906,500 285,300 4,713,000 14,572,700
Debt Issue
Interest Earned 134 231 146 101 101 81 125,560 126,354
Closing Balance December 31, 2021 7,209 12,430 7,850 5,458 5,422 4,369 7,404,422 7,447,160
2022
Transfers Out (953,040) (2,672,000) (1,281,500) (2,285,000) (1,229,700) (644,700) (4,253,500) (13,319,440)
Debt Charges - Principal
Debt Charges - Interest
Transfers In 953,040 2,672,000 1,281,500 2,285,000 1,229,700 644,700 4,331,000 13,396,940
Debt Issue
Interest Earned 136 235 149 103 103 83 140,825 141,633
Closing Balance December 31, 2022 7,346 12,665 7,998 5,562 5,524 4,451 7,622,747 7,666,293
2023
Transfers Out (1,111,400) (2,672,000) (1,740,700) (2,525,000) (1,652,800) (9,113,800) (18,815,700)
Debt Charges - Principal
Debt Charges - Interest
Transfers In 1,111,400 2,672,000 1,740,700 2,525,000 1,652,800 4,612,000 14,313,900
Debt Issue
Interest Earned 139 240 151 105 105 84 101,635 102,459
Closing Balance December 31, 2023 7,485 12,904 8,150 5,667 5,629 4,535 3,222,583 3,266,952
Appendix D: 2014-2023 Reserve Continuity Schedules
5.1

Departmental Capital Reserve Fund Continuity Summary
Parking Library Police Roads Stormwater Park PlanningPolicy
Planning
Economic
DevelopmentOperations Culture Transit Fire
Corporate
Property
Information
Services
Waste
Management
Departmental
Capital Total
Closing Balance December 31, 2013 225,973 742,642 482,493 (26,066) 93,709 9,797 6,111 22,301 37,982 104,475 46,655 50,721 25,853 136 50,247 1,873,030
2014
Transfers Out (650,000) (225,000) (64,000) (180,000) (150,000) (296,500) (250,120) (777,480) (20,000) (254,000) (269,680) (3,136,780)
Debt Charges - Principal
Debt Charges - Interest
Transfers In 425,000 225,000 64,000 180,000 60,000 296,500 250,120 777,480 (18,000) 214,000 269,680 2,743,780
Debt Issue
Interest Earned 2,213 14,482 9,409 (508) 950 191 119 435 741 1,667 520 989 504 3 980 32,692
Closing Balance December 31, 2014 3,185 757,124 491,901 (26,574) 4,659 9,988 6,230 22,736 38,723 68,141 7,175 51,710 26,358 139 51,227 1,512,723
2015
Transfers Out (1,050,000) (140,000) (16,800) (750,000) (570,000) (764,000) (186,375) (1,348,100) (370,000) (560,850) (889,160) (6,645,285)
Debt Charges - Principal
Debt Charges - Interest
Transfers In 1,050,000 140,000 16,800 750,000 570,000 764,000 186,375 1,348,100 370,000 560,850 889,160 6,645,285
Debt Issue
Interest Earned 62 14,764 9,592 (518) 91 195 121 443 755 1,329 140 1,008 514 3 999 29,498
Closing Balance December 31, 2015 3,248 771,888 501,493 (27,092) 4,750 10,183 6,351 23,180 39,478 69,470 7,315 52,719 26,872 142 52,226 1,542,221
2016
Transfers Out (740,000) (275,000) (79,100) (1,615,000) (190,000) (410,000) (292,135) (991,670) (105,000) (123,930) (312,360) (150,000) (5,284,195)
Debt Charges - Principal
Debt Charges - Interest
Transfers In 740,000 275,000 79,100 1,615,000 190,000 410,000 292,135 991,670 105,000 123,930 312,360 150,000 5,284,195
Debt Issue
Interest Earned 63 15,052 9,779 (528) 93 199 124 452 770 1,355 143 1,028 524 3 1,018 30,073
Closing Balance December 31, 2016 3,311 786,939 511,272 (27,621) 4,842 10,382 6,475 23,632 40,248 70,825 7,457 53,747 27,396 144 53,245 1,572,294
2017
Transfers Out (1,485,000) (160,000) (17,600) (600,000) (348,000) (942,500) (214,390) (1,922,020) (375,000) (702,380) (6,000) (377,860) (1,205,000) (8,355,750)
Debt Charges - Principal
Debt Charges - Interest
Transfers In 1,485,000 160,000 17,600 600,000 348,000 942,500 214,390 1,922,020 375,000 702,380 6,000 377,860 1,205,000 8,355,750
Debt Issue
Interest Earned 65 15,345 9,970 (539) 94 202 126 461 785 1,381 145 1,048 534 3 1,038 30,660
Closing Balance December 31, 2017 3,375 802,285 521,242 (28,159) 4,937 10,584 6,601 24,093 41,033 72,206 7,603 54,795 27,930 147 54,283 1,602,954
2018
Transfers Out (245,000) (185,000) (81,200) (2,310,000) (300,000) (2,634,500) (271,375) (1,043,980) (325,000) (274,260) (7,670,315)
Debt Charges - Principal
Debt Charges - Interest
Transfers In 245,000 185,000 81,200 2,310,000 300,000 2,634,500 271,375 1,043,980 325,000 274,260 7,670,315
Debt Issue
Interest Earned 66 15,645 10,164 (549) 96 206 129 470 800 1,408 148 1,069 545 3 1,059 31,258
Closing Balance December 31, 2018 3,441 817,929 531,406 (28,708) 5,033 10,791 6,730 24,562 41,833 73,614 7,751 55,863 28,474 150 55,341 1,634,211
2019
Transfers Out (950,000) (18,400) (2,610,000) (1,850,000) (2,366,500) (207,825) (1,958,750) (549,000) (174,340) (6,000) (2,400,000) (13,090,815)
Debt Charges - Principal
Debt Charges - Interest
Transfers In 950,000 18,400 2,610,000 1,850,000 2,366,500 207,825 1,958,750 549,000 174,340 6,000 2,400,000 13,090,815
Debt Issue
Interest Earned 67 15,950 10,362 (560) 98 210 131 479 816 1,435 151 1,089 555 3 1,079 31,867
Closing Balance December 31, 2019 3,508 833,879 541,769 (29,268) 5,131 11,001 6,861 25,041 42,649 75,049 7,902 56,953 29,030 153 56,420 1,666,079
2020
Transfers Out (760,000) (235,000) (83,300) (1,430,000) (1,250,000) (2,889,000) (179,775) (2,298,650) (570,000) (228,515) (6,000) (80,000) (65,500) (3,575,000) (13,650,740)
Debt Charges - Principal
Debt Charges - Interest
Transfers In 760,000 235,000 83,300 1,430,000 1,250,000 2,889,000 179,775 2,298,650 570,000 228,515 6,000 80,000 65,500 3,575,000 13,650,740
Debt Issue
Interest Earned 68 16,261 10,564 (571) 100 215 134 488 832 1,463 154 1,111 566 3 1,100 32,489
Closing Balance December 31, 2020 3,577 850,139 552,333 (29,839) 5,231 11,216 6,995 25,530 43,480 76,513 8,056 58,063 29,596 156 57,521 1,698,567
2021
Transfers Out (1,135,000) (310,000) (19,200) (3,410,000) (1,100,000) (1,791,000) (149,495) (3,045,260) (591,000) (667,920) (6,000) (2,500,000) (14,724,875)
Debt Charges - Principal
Debt Charges - Interest
Transfers In 1,135,000 310,000 19,200 3,410,000 1,100,000 1,791,000 149,495 3,045,260 591,000 667,920 6,000 2,500,000 14,724,875
Debt Issue
Interest Earned 70 16,578 10,771 (582) 102 219 136 498 848 1,492 157 1,132 577 3 1,122 33,122
Closing Balance December 31, 2021 3,647 866,717 563,104 (30,421) 5,333 11,434 7,132 26,027 44,328 78,005 8,213 59,195 30,173 159 58,642 1,731,689
2022
Transfers Out (800,000) (90,000) (85,100) (5,360,000) (3,475,000) (1,090,000) (261,000) (3,192,900) (380,000) (141,880) (6,000) (75,000) (14,956,880)
Debt Charges - Principal
Debt Charges - Interest
Transfers In 800,000 90,000 85,100 5,360,000 3,475,000 1,090,000 261,000 3,192,900 380,000 141,880 6,000 75,000 14,956,880
Debt Issue
Interest Earned 71 16,901 10,981 (593) 104 223 139 508 864 1,521 160 1,154 588 3 1,144 33,768
Closing Balance December 31, 2022 3,718 883,618 574,084 (31,014) 5,437 11,657 7,271 26,535 45,193 79,526 8,374 60,350 30,761 162 59,786 1,765,457
2023
Transfers Out (200,000) (539,100) (5,960,000) (1,500,000) (162,000) (2,136,800) (345,000) (145,825) (1,225,000) (12,213,725)
Debt Charges - Principal
Debt Charges - Interest
Transfers In 200,000 539,100 5,960,000 1,500,000 162,000 2,136,800 345,000 145,825 1,225,000 12,213,725
Debt Issue
Interest Earned 17,231 11,195 (605) 106 227 142 881 1,551 163 600 3 1,166 32,660
Closing Balance December 31, 2023 3,718 900,849 585,279 (31,619) 5,543 11,885 7,412 26,535 46,074 81,077 8,537 60,350 31,361 165 60,952 1,798,117
5.2

Miscellaneous Discretionary Reserve Fund Continuity Summary
Museum
Development
McCrae
House
Development
Moon-
MacKiegan
Artefacts
Library
Bequests
Landfill
Compensation
Public Transit
Improvement
Sleeman
Centre
Naming
Rights and
Sponsorship
Capital
Tree
Donation
Program
Sleeman
Centre
Investing in
Ontario
Road
Widening
Industrial
Land
River Run
Centre
Capital
Locomotive
6167
Transportation
Demand
Management
Greenhouse
GasGreening Public Art
Brownfield
Capital
(IMICO)
Miscellaneous
Discretionary
Total
Closing Balance December 31, 2013 251,527 148,784 15,776 238,691 68,949 12,875 1,360 143 26,964 158,091 991,478 1,476,475 112,831 570 21,685 786,685 33,203 8,488 20,912 4,375,488
2014
Transfers Out (30,000) (91,415) (30,000) (75,000) (150,000) (25,000) (401,415)
Debt Charges - Principal
Debt Charges - Interest
Transfers In 90,000 9,000 4,006,648 75,000 280,000 4,460,648
Debt Issue
Interest Earned 4,905 2,609 308 4,654 1,345 251 13 3 321 3,083 19,334 67,856 2,200 11 423 16,608 404 166 408 124,900
Closing Balance December 31, 2014 256,432 121,393 16,084 243,346 70,294 13,126 (42) 146 6,285 161,173 1,010,812 5,550,980 115,031 582 22,108 933,293 8,606 8,653 21,320 8,559,620
2015
Transfers Out (82,265) (7,300,000) (165,000) (450,000) (7,997,265)
Debt Charges - Principal
Debt Charges - Interest
Transfers In 90,000 4,826,737 75,000 245,000 5,236,737
Debt Issue
Interest Earned 5,000 2,367 314 4,745 1,371 256 75 3 123 3,143 19,711 84,130 1,366 11 431 16,200 168 169 416 139,997
Closing Balance December 31, 2015 261,432 123,760 16,397 248,091 71,664 13,382 7,767 149 6,407 164,316 1,030,522 3,161,846 26,397 593 22,539 744,493 8,774 8,822 21,736 5,939,090
2016
Transfers Out (82,264) (4,722,036) (105,000) (100,000) (50,000) (5,059,300)
Debt Charges - Principal
Debt Charges - Interest
Transfers In 90,000 4,006,648 75,000 210,000 50,000 4,431,648
Debt Issue
Interest Earned 5,098 2,413 320 4,838 1,397 261 227 3 125 3,204 20,095 54,681 222 12 440 15,590 171 172 424 109,693
Closing Balance December 31, 2016 266,530 126,174 16,717 252,929 73,062 13,643 15,730 152 6,532 167,520 1,050,618 2,501,139 (3,381) 604 22,979 870,083 8,945 8,994 22,160 5,421,130
2017
Transfers Out (93,156) (5,000,000) (25,000) (30,000) (75,000) (5,223,156)
Debt Charges - Principal
Debt Charges - Interest
Transfers In 90,000 4,006,648 75,000 30,000 75,000 4,276,648
Debt Issue
Interest Earned 5,197 2,460 326 4,932 1,425 266 276 3 127 3,267 20,487 39,087 422 12 448 16,967 174 175 432 96,484
Closing Balance December 31, 2017 271,727 128,634 17,043 257,861 74,487 13,909 12,850 155 6,659 170,787 1,071,105 1,546,874 47,041 616 23,427 887,050 9,120 9,170 22,592 4,571,106
2018
Transfers Out (93,155) (2,513,806) (30,000) (75,000) (2,711,961)
Debt Charges - Principal
Debt Charges - Interest
Transfers In 90,000 4,006,648 75,000 30,000 75,000 4,276,648
Debt Issue
Interest Earned 5,299 2,508 332 5,028 1,452 271 220 3 130 3,330 20,887 44,719 1,649 12 457 17,297 178 179 441 104,392
Closing Balance December 31, 2018 277,026 131,142 17,375 262,889 75,939 14,181 9,914 158 6,789 174,117 1,091,991 3,084,436 123,689 628 23,884 904,348 9,298 9,348 23,032 6,240,185
2019
Transfers Out (94,092) (9,328,076) (30,000) (100,000) (9,552,168)
Debt Charges - Principal
Debt Charges - Interest
Transfers In 90,000 13,330,642 75,000 30,000 100,000 13,625,642
Debt Issue
Interest Earned 5,402 2,557 339 5,126 1,481 277 153 3 132 3,395 21,294 99,172 3,143 12 466 17,635 181 182 449 161,400
Closing Balance December 31, 2019 282,428 133,700 17,714 268,015 77,420 14,457 5,975 161 6,922 177,513 1,113,285 7,186,173 201,832 641 24,349 921,982 9,479 9,531 23,481 10,475,058
2020
Transfers Out (34,091) (6,611,941) (75,000) (30,000) (100,000) (6,851,032)
Debt Charges - Principal
Debt Charges - Interest
Transfers In 90,000 11,816,976 75,000 30,000 100,000 12,111,976
Debt Issue
Interest Earned 5,507 2,607 345 5,226 1,510 282 662 3 135 3,462 21,709 190,879 3,936 12 475 17,979 185 186 458 255,558
Closing Balance December 31, 2020 287,935 136,307 18,060 273,242 78,930 14,739 62,546 164 7,057 180,974 1,134,994 12,582,088 205,768 653 24,824 939,961 9,664 9,716 23,939 15,991,560
2021
Transfers Out (34,090) (35,000) (100,000) (169,090)
Debt Charges - Principal
Debt Charges - Interest
Transfers In 90,000 75,000 30,000 100,000 295,000
Debt Issue
Interest Earned 5,615 2,658 352 5,328 1,539 287 1,765 3 138 3,529 22,132 245,351 4,744 13 484 18,329 140 189 467 313,063
Closing Balance December 31, 2021 293,550 138,965 18,412 278,570 80,469 15,026 120,220 167 7,194 184,503 1,157,126 12,827,438 285,512 666 25,308 958,290 4,804 9,906 24,406 16,430,533
2022
Transfers Out (34,090) (40,000) (200,000) (274,090)
Debt Charges - Principal
Debt Charges - Interest
Transfers In 90,000 75,000 30,000 200,000 395,000
Debt Issue
Interest Earned 5,724 2,710 359 5,432 1,569 2,889 3 140 3,598 22,564 250,135 6,299 13 494 18,687 (4) 193 476 321,281
Closing Balance December 31, 2022 299,274 141,675 18,771 284,002 82,038 15,026 179,019 170 7,335 188,101 1,179,690 13,077,573 366,810 679 25,802 976,977 (5,200) 10,099 24,882 16,872,724
2023
Transfers Out (34,090) (34,090)
Debt Charges - Principal
Debt Charges - Interest
Transfers In 90,000 90,000
Debt Issue
Interest Earned 5,836 2,763 366 5,538 1,600 4,036 3 143 3,668 255,013 19,051 298,016
Closing Balance December 31, 2023 305,110 144,437 19,137 289,540 83,638 15,026 238,965 174 7,478 191,769 1,179,690 13,332,586 366,810 679 25,802 996,028 (5,200) 10,099 24,882 17,226,650
5.3

City Strategies Reserve Fund Continuity Summary
Capital
Taxation
Strategic
Capital
Priorities
DC
Exemptions
Accessibility
Capital
Road
Infrastructure
Building Life
Cycle
Asset
Renewal
(Hydro Note)
Strategy Total
Closing Balance December 31, 2013 1,174,192 15,437 772,818 162,810 781,791 72,039 12,748,456 15,727,544
2014
Transfers Out (200,000) (3,170,000) (2,574,000) (689,900) (6,633,900)
Debt Charges - Principal
Debt Charges - Interest
Transfers In 2,604,900 850,000 40,000 2,385,000 2,506,000 95,000 8,480,900
Debt Issue
Interest Earned 48,295 301 23,357 1,615 7,591 742 242,795 324,695
Closing Balance December 31, 2014 3,827,387 15,738 1,646,176 4,425 4,382 4,781 12,396,351 17,899,240
2015
Transfers Out (100,000) (3,490,000) (2,627,500) (1,709,800) (7,927,300)
Debt Charges - Principal
Debt Charges - Interest
Transfers In 1,250,000 1,500,000 100,000 3,490,000 2,627,500 95,000 9,062,500
Debt Issue
Interest Earned 86,822 307 46,725 86 85 93 225,985 360,103
Closing Balance December 31, 2015 5,164,208 16,045 3,192,901 4,511 4,467 4,874 11,007,536 19,394,543
2016
Transfers Out (200,000) (2,504,640) (1,226,500) (849,800) (4,780,940)
Debt Charges - Principal
Debt Charges - Interest
Transfers In 1,250,000 1,500,000 200,000 2,504,640 1,226,500 95,000 6,776,140
Debt Issue
Interest Earned 112,890 313 76,887 88 87 95 207,288 397,647
Closing Balance December 31, 2016 6,527,098 16,358 4,769,788 4,599 4,555 4,969 10,460,023 21,787,390
2017
Transfers Out (200,000) (2,267,700) (1,772,000) (776,900) (5,016,600)
Debt Charges - Principal
Debt Charges - Interest
Transfers In 1,250,000 1,500,000 200,000 2,267,700 1,772,000 95,000 7,084,700
Debt Issue
Interest Earned 139,466 319 107,636 90 89 97 197,322 445,018
Closing Balance December 31, 2017 7,916,564 16,677 6,377,423 4,689 4,643 5,066 9,975,445 24,300,508
2018
Transfers Out (14,000) (12,600) (200,000) (2,200,000) (3,035,500) (888,000) (6,350,100)
Debt Charges - Principal
Debt Charges - Interest
Transfers In 1,250,000 1,500,000 200,000 2,200,000 3,035,500 95,000 8,280,500
Debt Issue
Interest Earned 166,424 325 138,862 91 91 99 186,789 492,681
Closing Balance December 31, 2018 9,318,988 17,002 8,003,685 4,780 4,734 5,165 9,369,235 26,723,589
2019
Transfers Out (200,000) (2,940,700) (2,082,000) (888,000) (6,110,700)
Debt Charges - Principal
Debt Charges - Interest
Transfers In 1,250,000 1,500,000 200,000 2,940,700 2,082,000 95,000 8,067,700
Debt Issue
Interest Earned 193,908 332 170,697 93 92 101 174,968 540,191
Closing Balance December 31, 2019 10,762,896 17,334 9,674,382 4,874 4,826 5,266 8,751,203 29,220,780
2020
Transfers Out (250,000) (1,700,000) (3,161,000) (888,000) (5,999,000)
Debt Charges - Principal
Debt Charges - Interest
Transfers In 1,250,000 1,500,000 250,000 1,700,000 3,161,000 95,000 7,956,000
Debt Issue
Interest Earned 222,064 338 203,275 95 94 103 162,917 588,886
Closing Balance December 31, 2020 12,234,959 17,672 11,377,658 4,969 4,920 5,368 8,121,120 31,766,666
2021
Transfers Out (200,000) (2,268,200) (2,083,500) (888,000) (5,439,700)
Debt Charges - Principal
Debt Charges - Interest
Transfers In 1,250,000 1,500,000 200,000 2,268,200 2,083,500 95,000 7,396,700
Debt Issue
Interest Earned 250,769 345 236,489 97 96 105 150,630 638,531
Closing Balance December 31, 2021 13,735,729 18,016 13,114,147 5,066 5,016 5,473 7,478,750 34,362,197
2022
Transfers Out (200,000) (3,000,000) (2,501,000) (888,000) (6,589,000)
Debt Charges - Principal
Debt Charges - Interest
Transfers In 1,250,000 1,500,000 200,000 3,000,000 2,501,000 95,000 8,546,000
Debt Issue
Interest Earned 280,034 351 270,351 99 98 107 138,104 689,144
Closing Balance December 31, 2022 15,265,763 18,368 14,884,498 5,164 5,114 5,580 6,823,854 37,008,340
2023
Transfers Out (200,000) (3,000,000) (2,380,500) (888,000) (6,468,500)
Debt Charges - Principal
Debt Charges - Interest
Transfers In 1,250,000 1,500,000 200,000 3,000,000 2,380,500 95,000 8,425,500
Debt Issue
Interest Earned 309,870 304,873 101 100 109 125,333 740,385
Closing Balance December 31, 2023 16,825,633 18,368 16,689,371 5,265 5,214 5,689 6,156,187 39,705,726
5.4

Building
Services
Stabilization
Parkland
Dedication
Downtown
Parkland
Dedication
Dedicated
Provincial
Gas Tax
Federal Gas
Tax
Transit
Infrastructure
Miscellaneous
Obligatory
Total
Closing Balance Dec 31, 2013 1,386,416 921,223 433,210 326,472 3,386,453 2,023 6,455,796
2014
Transfers Out (7,400) (3,018,810) (6,910,000) (9,936,210)
Debt Charges - Principal
Debt Charges - Interest
Transfers In 75,900 429,027 2,829,161 7,051,293 10,385,382
Debt Issue
Interest Earned 26,963 18,704 12,631 4,517 67,413 39 130,267
Closing Balance Dec 31, 2014 1,405,979 1,015,827 874,868 141,340 3,595,160 2,062 7,035,235
2015
Transfers Out (24,400) (2,813,810) (6,490,000) (9,328,210)
Debt Charges - Principal
Debt Charges - Interest
Transfers In 75,900 429,027 2,829,161 7,051,293 10,385,382
Debt Issue
Interest Earned 27,179 20,549 21,243 2,906 75,578 40 147,495
Closing Balance Dec 31, 2015 1,408,758 1,112,275 1,325,138 159,596 4,232,032 2,102 8,239,901
2016
Transfers Out (8,600) (2,813,810) (8,100,000) (10,922,410)
Debt Charges - Principal
Debt Charges - Interest
Transfers In 75,900 429,027 2,829,161 7,051,293 10,385,382
Debt Issue
Interest Earned 27,387 22,429 30,023 3,262 72,300 41 155,442
Closing Balance Dec 31, 2016 1,427,545 1,210,605 1,784,189 178,209 3,255,625 2,143 7,858,315
2017
Transfers Out (8,600) (2,813,810) (7,980,000) (10,802,410)
Debt Charges - Principal
Debt Charges - Interest
Transfers In 75,900 429,027 2,829,161 7,051,293 10,385,382
Debt Issue
Interest Earned 27,753 24,347 38,975 3,625 54,430 42 149,171
Closing Balance Dec 31, 2017 1,446,698 1,310,851 2,252,191 197,185 2,381,348 2,185 7,590,458
2018
Transfers Out (2,813,810) (6,050,000) (8,863,810)
Debt Charges - Principal
Debt Charges - Interest
Transfers In 75,900 429,027 2,829,161 7,051,293 10,385,382
Debt Issue
Interest Earned 28,211 26,302 48,101 3,995 56,199 43 162,849
Closing Balance Dec 31, 2018 1,474,908 1,413,053 2,729,319 216,531 3,438,840 2,228 9,274,879
2019
Transfers Out (2,813,810) (7,350,300) (10,164,110)
Debt Charges - Principal
Debt Charges - Interest
Transfers In 75,900 429,027 2,829,161 7,051,293 10,385,382
Debt Issue
Interest Earned 28,761 28,295 57,405 4,372 64,142 43 183,018
Closing Balance Dec 31, 2019 1,503,669 1,517,248 3,215,751 236,254 3,203,976 2,271 9,679,168
2020
Transfers Out (2,813,810) (6,200,000) (9,013,810)
Debt Charges - Principal
Debt Charges - Interest
Transfers In 75,900 429,027 2,829,161 7,051,293 10,385,382
Debt Issue
Interest Earned 29,322 30,326 66,890 4,757 70,778 44 202,117
Closing Balance Dec 31, 2020 1,532,991 1,623,474 3,711,669 256,361 4,126,047 2,315 11,252,856
2021
Transfers Out (2,813,810) (6,472,800) (9,286,610)
Debt Charges - Principal
Debt Charges - Interest
Transfers In 75,900 429,027 2,829,161 7,051,293 10,385,382
Debt Issue
Interest Earned 29,893 32,398 76,561 5,149 86,098 45 230,144
Closing Balance Dec 31, 2021 1,562,884 1,731,772 4,217,256 276,861 4,790,638 2,360 12,581,772
2022
Transfers Out (14,678,034) (2,813,810) (9,300,000) (26,791,844)
Debt Charges - Principal
Debt Charges - Interest
Transfers In 75,900 750,520 2,829,161 7,051,293 10,706,875
Debt Issue 9,000,000 9,000,000
Interest Earned 30,476 34,510 34,193 5,548 71,493 46 176,266
Closing Balance Dec 31, 2022 1,593,360 1,842,181 (676,064) 297,761 2,613,424 2,406 5,673,069
2023
Transfers Out (9,300,000) (9,300,000)
Debt Charges - Principal (749,618) (749,618)
Debt Charges - Interest (360,000) (360,000)
Transfers In 1,096,979 7,051,293 8,148,272
Debt Issue
Interest Earned (13,306) 29,037 15,730
Closing Balance Dec 31, 2023 1,593,360 1,842,181 (702,009) 297,761 393,754 2,406 3,427,454
Miscellaneous Obligatory Reserve Fund Continuity Summary
(Projected Balances)
5.5

Appendix EUnfunded Development Charge Projects- Tax Supported
Project ID Area Project Description
Total Amount
(Indexed) 2014 2015 2016 2017 2018 2019 2020 2021 2022 2023
RD0170 HighwayRailway Crossing -Edinburgh Rd & adjacent 2,028 ‐ 504 506 508 510 ‐ ‐ ‐ ‐ ‐
RDXXX Highway Intersection-Victoria/Clair 152 ‐ ‐ ‐ 152 ‐ ‐ ‐ ‐ ‐ ‐ RDXXX Highway Development Design Standards 202 ‐ 101 101 ‐ ‐ ‐ ‐ ‐ ‐ ‐ RD0267 Highway Clair/Laird & Hanlon Interchage 4,273 2,119 2,154 ‐ ‐ ‐ ‐ ‐ ‐ ‐ ‐ PL0017 Planning Guelph Innovation Secondary Plan 113 113 ‐ ‐ ‐ ‐ ‐ ‐ ‐ ‐ ‐ TC0027 Transit Conventional Scheduling Software 163 163 ‐ ‐ ‐ ‐ ‐ ‐ ‐ ‐ ‐ TC0046 Transit Transit Facility Expansion 4,032 ‐ 4,032 ‐ ‐ ‐ ‐ ‐ ‐ ‐ ‐ TC0026 Transit CAD/AVL Upgrade 1,207 1,207 ‐ ‐ ‐ ‐ ‐ ‐ ‐ ‐ ‐ TM0001 Transit New Mobility Vans 245 ‐ ‐ ‐ 9 230 0 6 ‐ ‐ ‐ TM0003 Transit Mobility Scheduling Software 108 108 ‐ ‐ ‐ ‐ ‐ ‐ ‐ ‐ ‐ TR0026 Highway West End Rec Centre 151 ‐ 151 ‐ ‐ ‐ ‐ ‐ ‐ ‐ ‐ TR0031 Highway York Watson 305 ‐ ‐ ‐ 305 ‐ ‐ ‐ ‐ ‐ ‐ PG0047 Parking Parkade - Wilson (400 spaces) 15,839 ‐ ‐ ‐ ‐ ‐ ‐ ‐ ‐ 15,839 ‐ PG0033 Parking Parkade - Baker (500 spaces) 19,330 ‐ ‐ 19,330 ‐ ‐ ‐ ‐ ‐ ‐ ‐ PO0014 Parks Parks Equipment 545 271 125 21 69 63 22 126 88 9 250‐ PK0036 Parks Cityview Drive Park 838 ‐ ‐ ‐ ‐ ‐ 838 ‐ ‐ ‐ ‐ PK0037 Parks Kortright Sports Complex 3,099 ‐ ‐ ‐ ‐ ‐ ‐ 1,544 1,554 ‐ ‐ PK0038 Parks Grangehilld Phase 7 333 ‐ ‐ ‐ 333 ‐ ‐ ‐ ‐ ‐ ‐ PK0040 Parks Peter Misersky Phase 2 365 ‐ ‐ ‐ 365 ‐ ‐ ‐ ‐ ‐ ‐ PK0042 Parks York Open Space Development 1,225 ‐ ‐ ‐ ‐ ‐ ‐ ‐ 1,225 ‐ ‐ PK0043 Parks Eastview Open Space 777 ‐ ‐ ‐ ‐ ‐ ‐ ‐ 777 ‐ ‐ PK0045 Parks Valley Road Park 349 ‐ ‐ ‐ ‐ ‐ ‐ ‐ ‐ 349 ‐ PK0049 Parks 270 Grange Road - new parkette 286 ‐ ‐ ‐ ‐ ‐ 286 ‐ ‐ ‐ ‐ PK0050 Parks York District Community Park 825 ‐ ‐ ‐ ‐ ‐ ‐ ‐ 825 ‐ ‐ PK0051 Parks Victoria Rd N Community Park 1,988 ‐ ‐ ‐ ‐ ‐ 179 1,203 606 ‐ ‐ PK0057 Parks Orin Reid Park Phases 2-4 369 ‐ 30 183 155 ‐ ‐ ‐ ‐ ‐ ‐ PK0070 Parks Victoria Park West 440 ‐ ‐ ‐ ‐ 790 350‐ ‐ ‐ ‐ ‐ PK0074 Parks Watson Parkette 215 ‐ ‐ ‐ ‐ 510 295‐ ‐ ‐ ‐ ‐ PK0076 Parks Dallan Property 809 ‐ ‐ ‐ 809 ‐ ‐ ‐ ‐ ‐ ‐ PK0077 Parks West Hills 1,328 ‐ ‐ ‐ ‐ ‐ ‐ ‐ ‐ 1,328 ‐ PK0078 Parks 300-312 Grange Road Park 381 ‐ ‐ 381 ‐ ‐ ‐ ‐ ‐ ‐ ‐ PK0079 Parks Trailway Masterplan Update 91 ‐ 91 ‐ ‐ ‐ ‐ ‐ ‐ ‐ ‐
(in thousands)
1/2

Appendix EUnfunded Development Charge Projects- Tax Supported
Project ID Area Project Description
Total Amount
(Indexed) 2014 2015 2016 2017 2018 2019 2020 2021 2022 2023
(in thousands)
RP0290 Recreation South End Rec Centre 36,796 ‐ ‐ 36,796 ‐ ‐ ‐ ‐ ‐ ‐ ‐ AM0009 AmbulanceAmulance Training Facility 1,081 ‐ ‐ ‐ ‐ ‐ ‐ ‐ ‐ ‐ 1,081
AMXXX AdminAmbulance Study/Needs Assessment 131 131 ‐ ‐ ‐ ‐ ‐ ‐ ‐ ‐ ‐
FSXXX Admin Fire Master Plan 101 ‐ 101 ‐ ‐ ‐ ‐ ‐ ‐ ‐ ‐ AMXXX Admin Joint Planning Study 51 ‐ ‐ 51 ‐ ‐ ‐ ‐ ‐ ‐ ‐ PS0041 Police Joint Fire/Police Training Facility 1,081 ‐ ‐ ‐ ‐ ‐ ‐ ‐ ‐ ‐ 1,081 LB0028 Library Main Branch 47,708 ‐ ‐ 47,708 ‐ ‐ ‐ ‐ ‐ ‐ ‐
Total Unfunded (indexed) 149,360 4,112 7,289 105,077 2,705 2,104 680 2,880 5,075 17,525 1,913
Notes:
** Indexed using "Non-residential Building Construction Price Index", Second Quarter 2012-2013, .4%, Stats Canada, www.statcan.gc.ca
* Projects listed are currently identified in the 2014 DC Study but are not included or only partially included in the 2014 Capital Budget. However projects will be reviewed annually as part of the capital budget process and will be prioritized based on Council's discretion.
2/2