Guelph Watershed Research Group - MIRARCO Gharabag… · OCCAR Climate Change Adaptation Workshop....
38
OCCAR Climate Change Adaptation Workshop Hamilton, March 9, 2011 Guelph Watershed Research Group University of Guelph, Guelph, Ontario, Canada Paul Lehman and Sobhalatha Kunjikutty Mississippi Valley Conservation, Lanark, Ontario, Canada
Transcript of Guelph Watershed Research Group - MIRARCO Gharabag… · OCCAR Climate Change Adaptation Workshop....
OCCAR Climate Change Adaptation WorkshopHamilton, March 9, 2011
Guelph Watershed Research GroupUniversity of Guelph, Guelph, Ontario, Canada
Paul Lehman and Sobhalatha KunjikuttyMississippi Valley Conservation, Lanark, Ontario, Canada
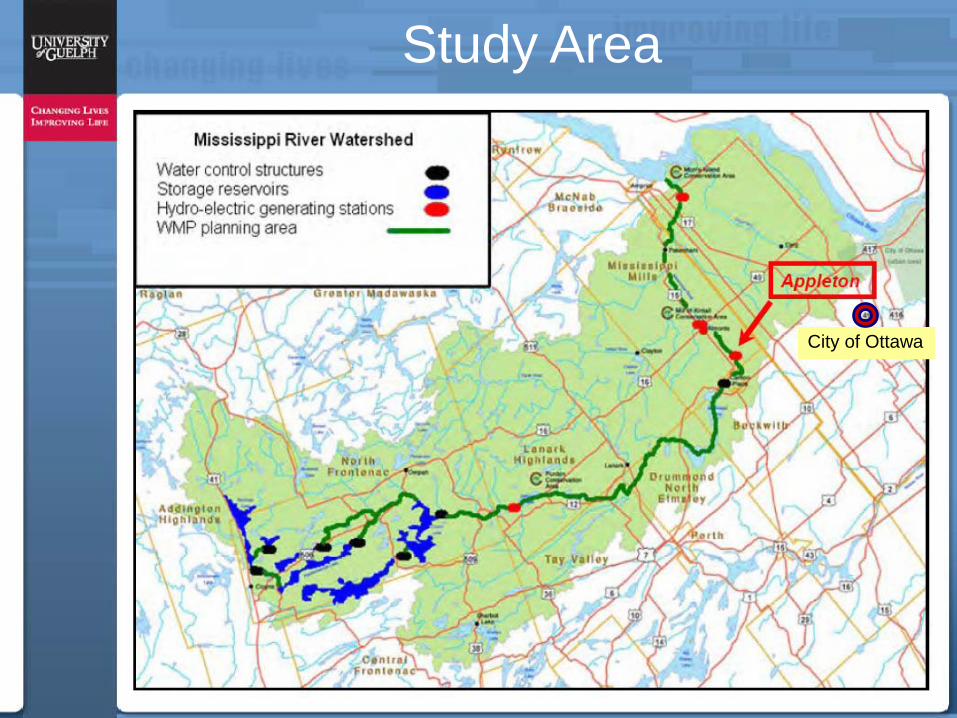
Study Area
City of Ottawa
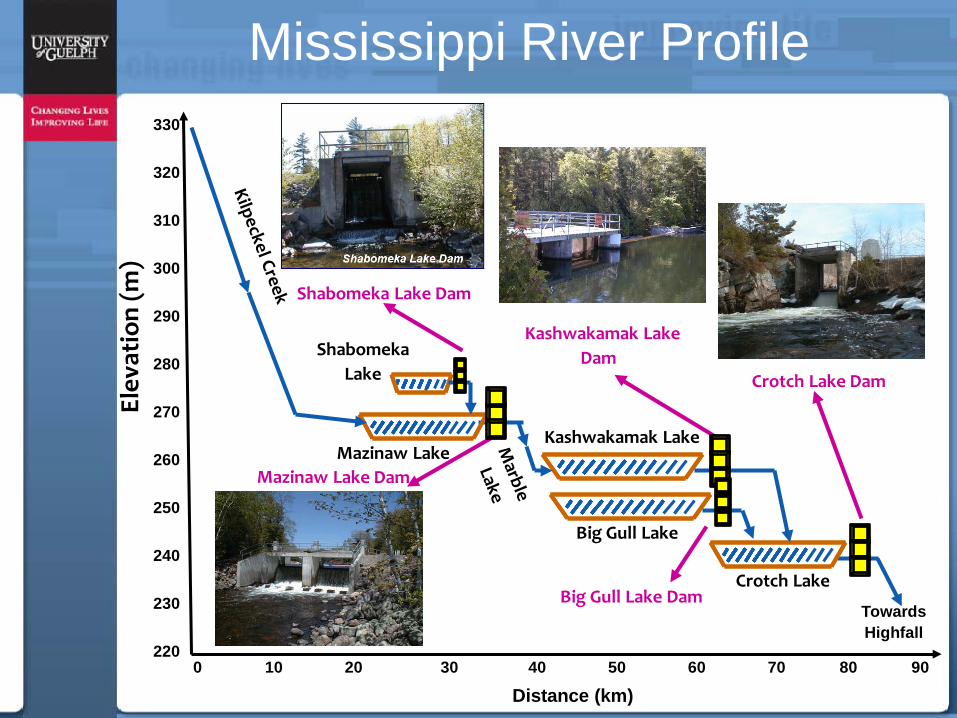
Crotch Lake
Shabomeka Lake
Mazinaw Lake
Big Gull Lake
Kashwakamak Lake
Towards Highfall
Kashwakamak Lake Dam
Big Gull Lake Dam
Shabomeka Lake Dam
Crotch Lake Dam
220
230
240
260
250
270
280
290
300
310
320
330
0 10 20 30 40 6050 70 9080
Distance (km)
Elev
atio
n (m
)
Mississippi River Profile
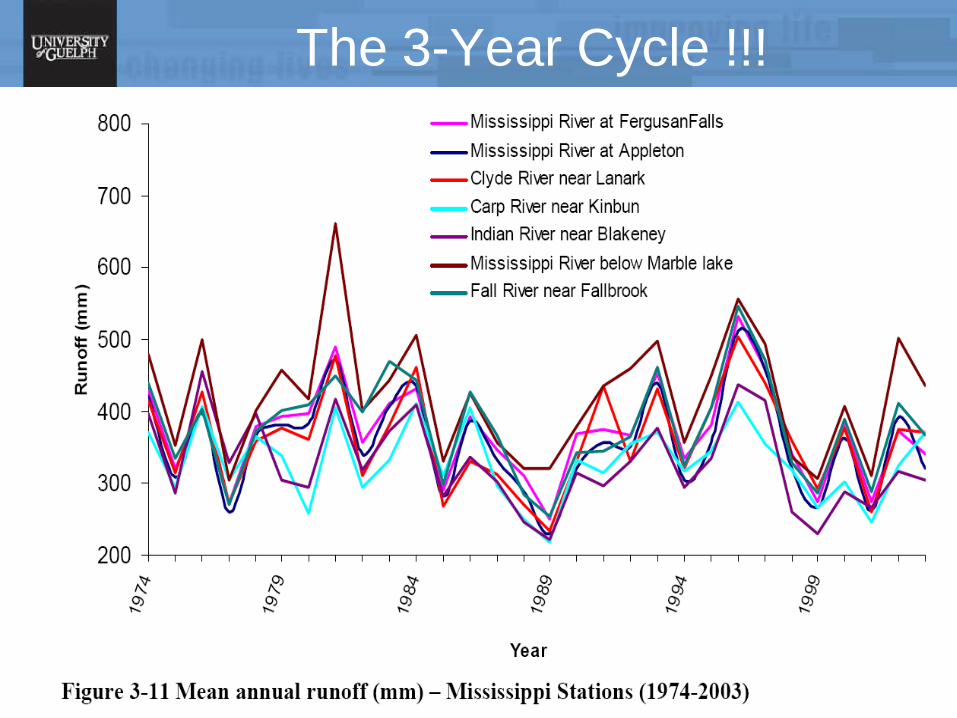
The 3-Year Cycle !!!
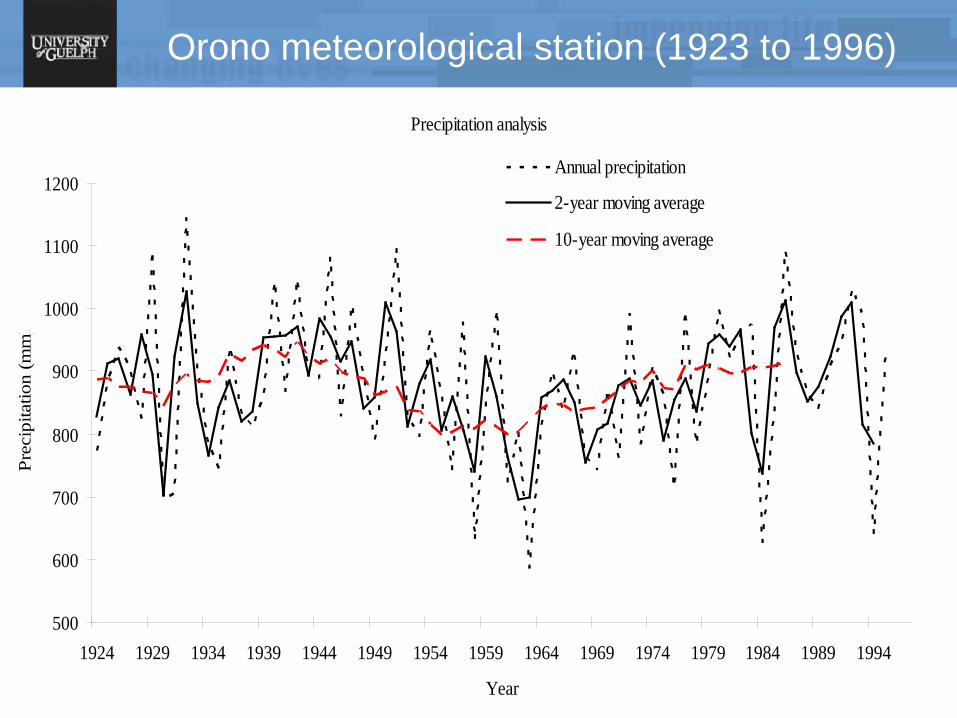
Orono meteorological station (1923 to 1996)
Precipitation analysis
500
600
700
800
900
1000
1100
1200
1924 1929 1934 1939 1944 1949 1954 1959 1964 1969 1974 1979 1984 1989 1994
Year
Prec
ipita
tion
(mm
)
Annual precipitation
2-year moving average
10-year moving average
6
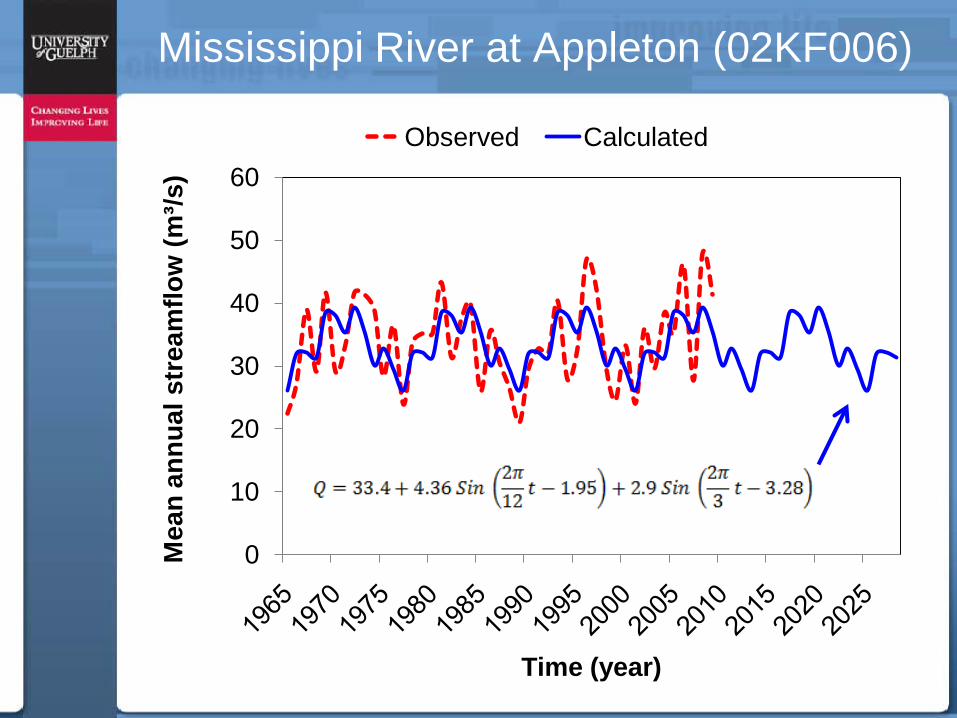
Mississippi River at Appleton (02KF006)
0
10
20
30
40
50
60M
ean
annu
al s
trea
mflo
w (m
³/s)
Time (year)
Observed Calculated
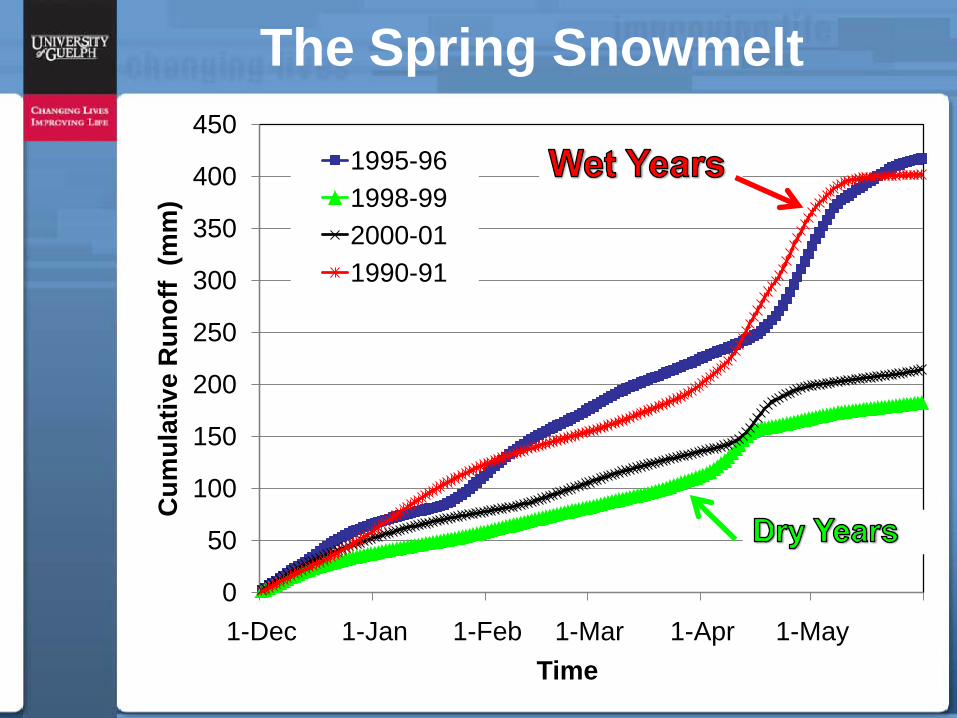
The Spring Snowmelt
0
50
100
150
200
250
300
350
400
450
1-Dec 1-Jan 1-Feb 1-Mar 1-Apr 1-May
Cum
ulat
ive
Run
off
(mm
)
Time
1995-961998-992000-011990-91
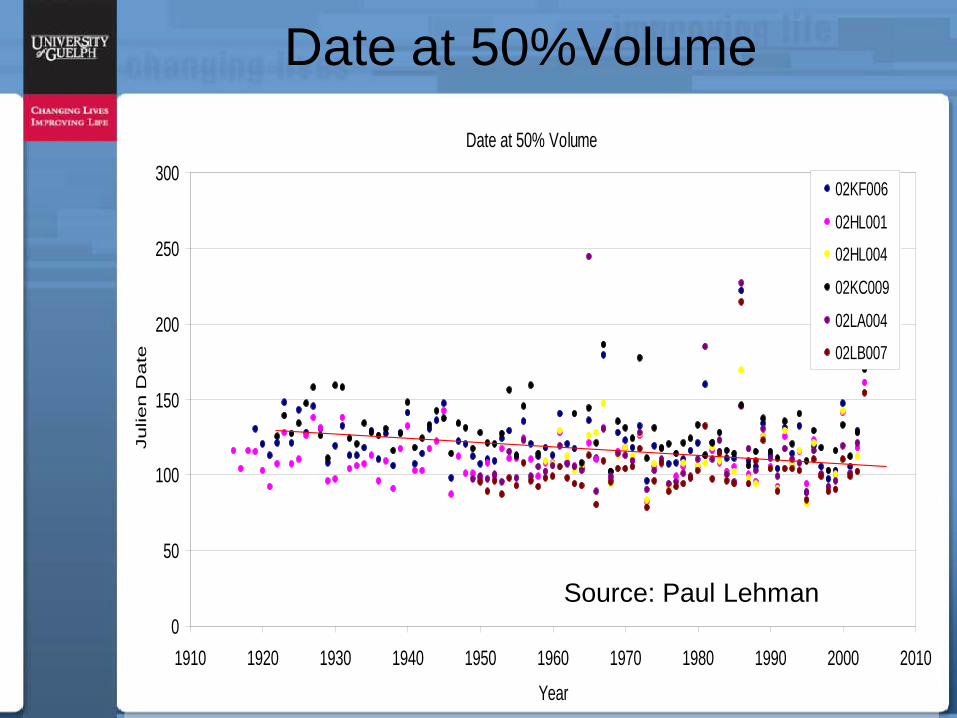
Date at 50% Volume
0
50
100
150
200
250
300
1910 1920 1930 1940 1950 1960 1970 1980 1990 2000 2010
Year
Julie
n D
ate
02KF006
02HL001
02HL004
02KC009
02LA004
02LB007
Date at 50%Volume
Source: Paul Lehman
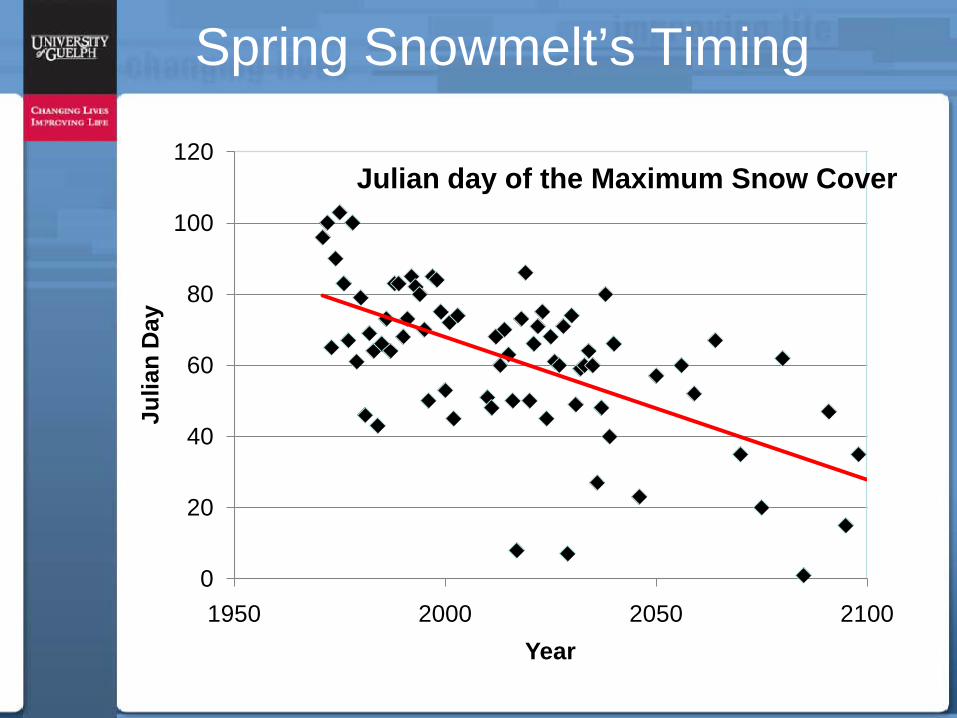
Spring Snowmelt’s Timing
0
20
40
60
80
100
120
1950 2000 2050 2100
Julia
n D
ay
Year
Julian day of the Maximum Snow Cover
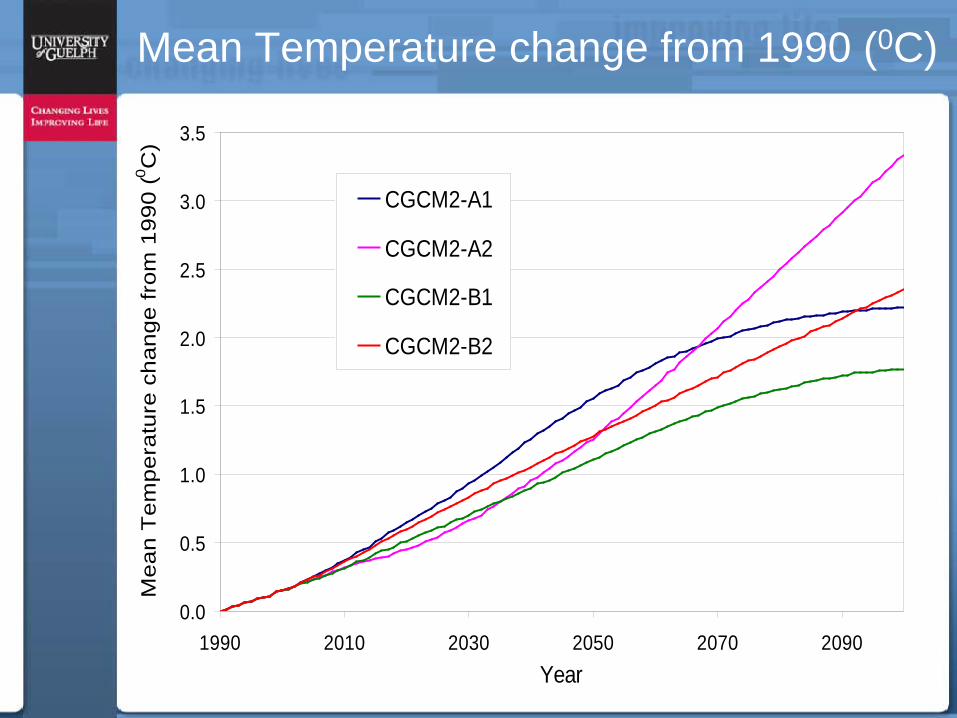
Mean Temperature change from 1990 (0C)
0.0
0.5
1.0
1.5
2.0
2.5
3.0
3.5
1990 2010 2030 2050 2070 2090Year
Mea
n T
empe
ratu
re c
hang
e fr
om 1
990
( 0 C)
CGCM2-A1
CGCM2-A2
CGCM2-B1
CGCM2-B2
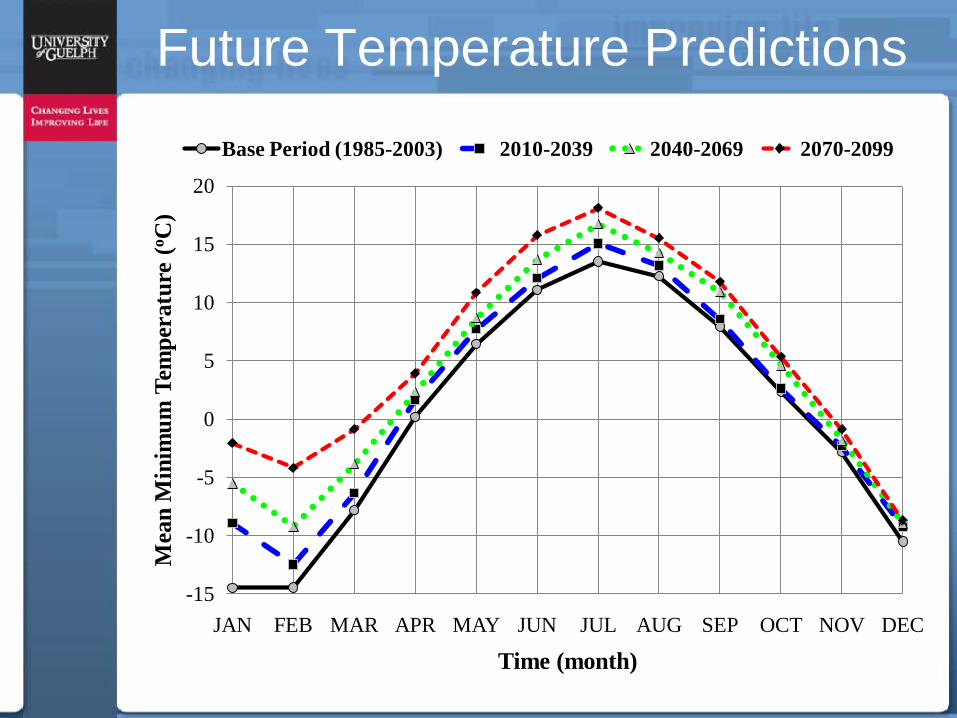
Future Temperature Predictions
-15
-10
-5
0
5
10
15
20
JAN FEB MAR APR MAY JUN JUL AUG SEP OCT NOV DEC
Mea
n M
inim
um T
empe
ratu
re (o C
)
Time (month)
Base Period (1985-2003) 2010-2039 2040-2069 2070-2099
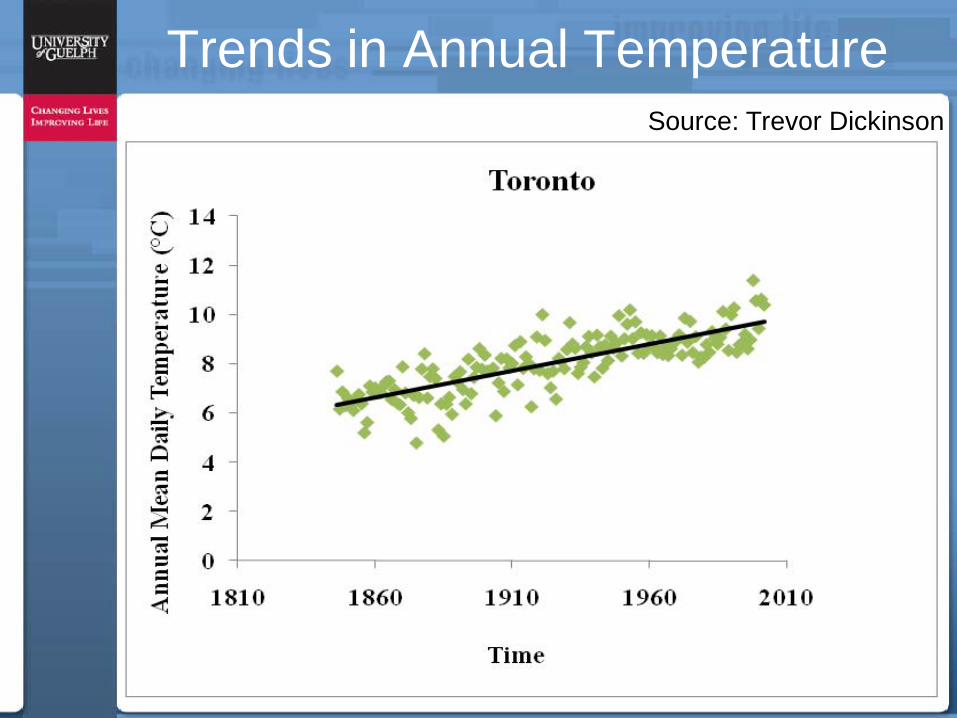
Trends in Annual TemperatureSource: Trevor Dickinson
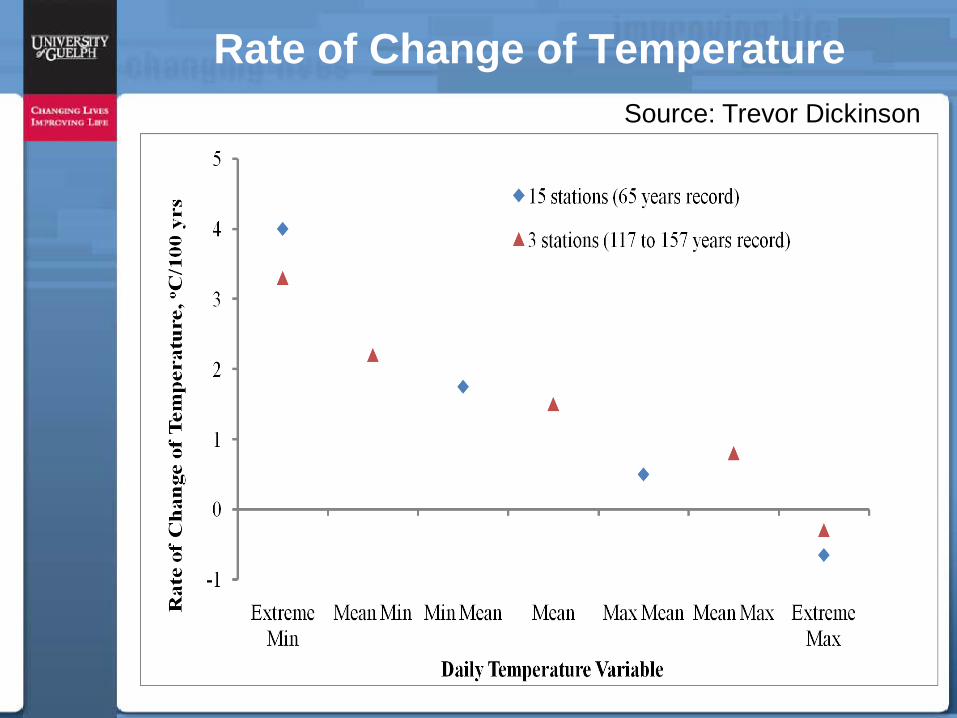
Rate of Change of TemperatureSource: Trevor Dickinson
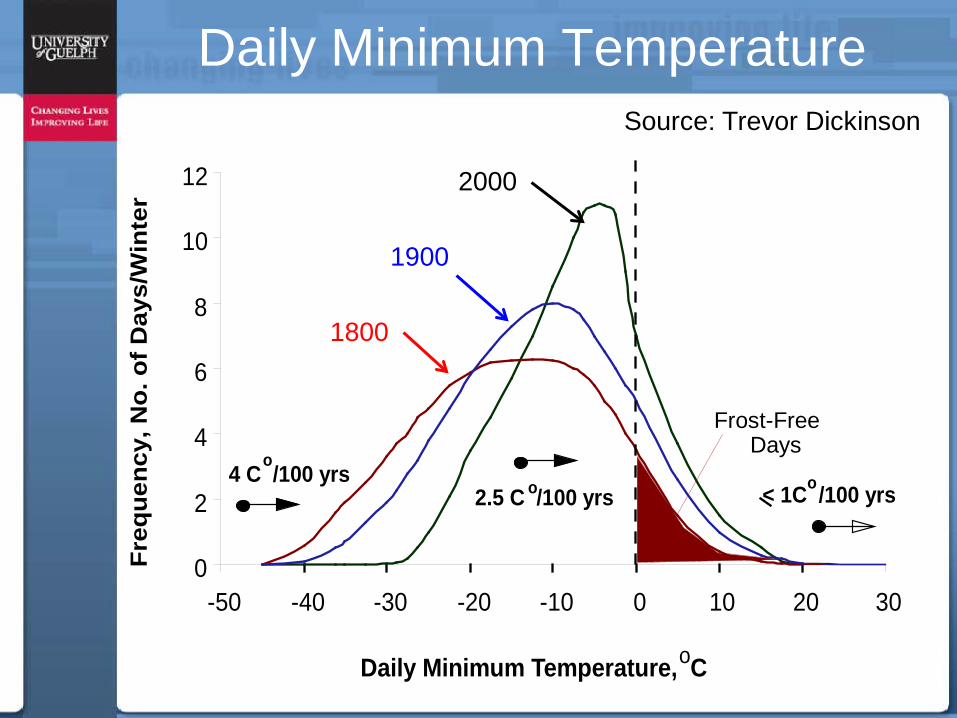
Daily Minimum Temperature
0
2
4
6
8
10
12
-50 -40 -30 -20 -10 0 10 20 30
Daily Minimum Temperature, C
Freq
uenc
y, N
o. o
f Day
s/W
inte
r
2.5 C /100 yrso < 1C /100 yrso4 C /100 yrso
o
1800
1900
2000
Frost-Free Days
Source: Trevor Dickinson
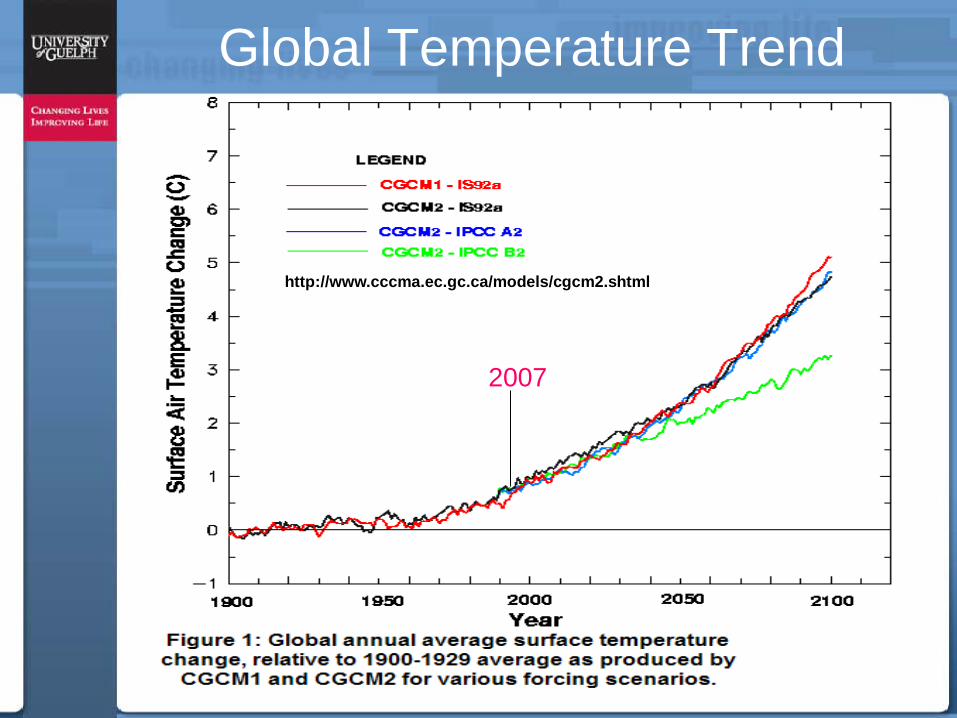
Global Temperature Trend
http://www.cccma.ec.gc.ca/models/cgcm2.shtml
2007
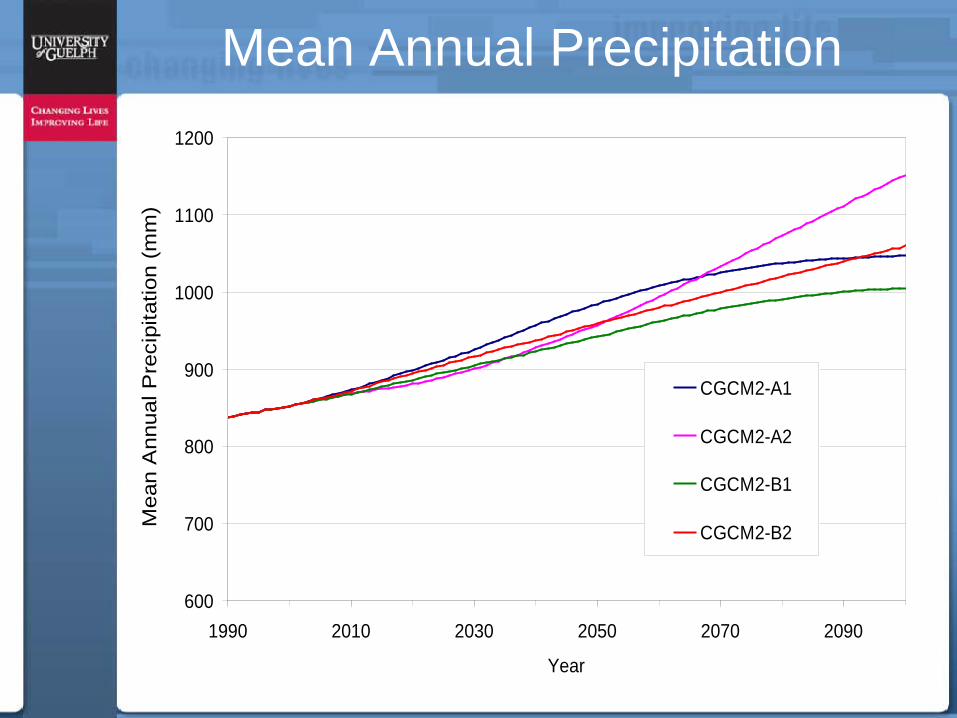
Mean Annual Precipitation
600
700
800
900
1000
1100
1200
1990 2010 2030 2050 2070 2090
Year
Mea
n A
nnua
l Pre
cipi
tatio
n (m
m)
CGCM2-A1
CGCM2-A2
CGCM2-B1
CGCM2-B2
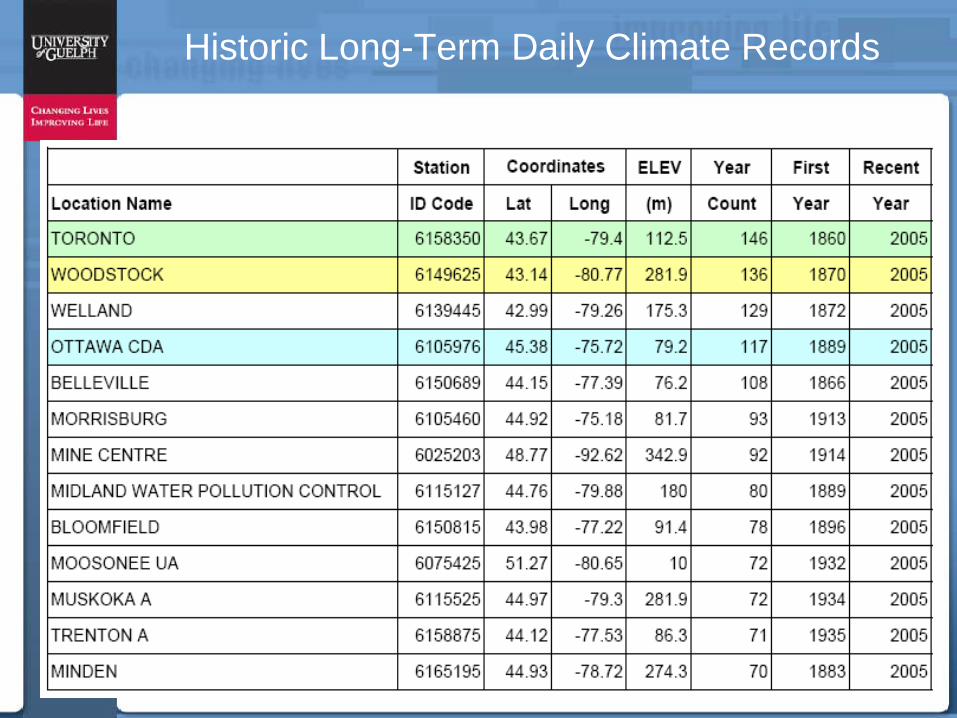
Historic Long-Term Daily Climate Records
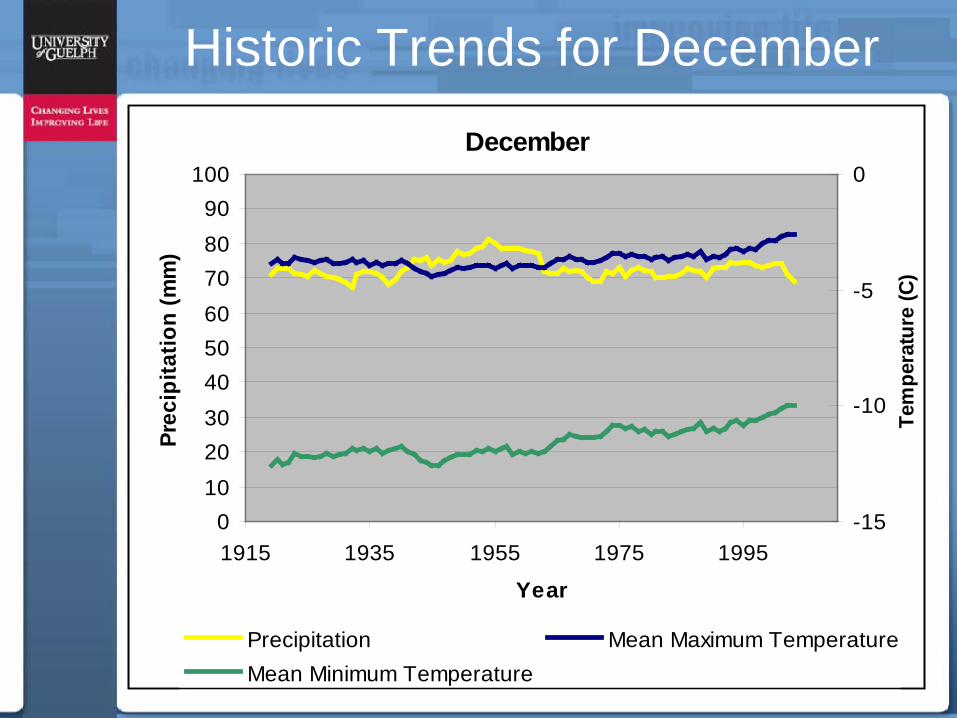
Historic Trends for DecemberDecember
0102030405060708090
100
1915 1935 1955 1975 1995
Year
Prec
ipita
tion
(mm
)
-15
-10
-5
0
Tem
pera
ture
(C)
Precipitation Mean Maximum TemperatureMean Minimum Temperature
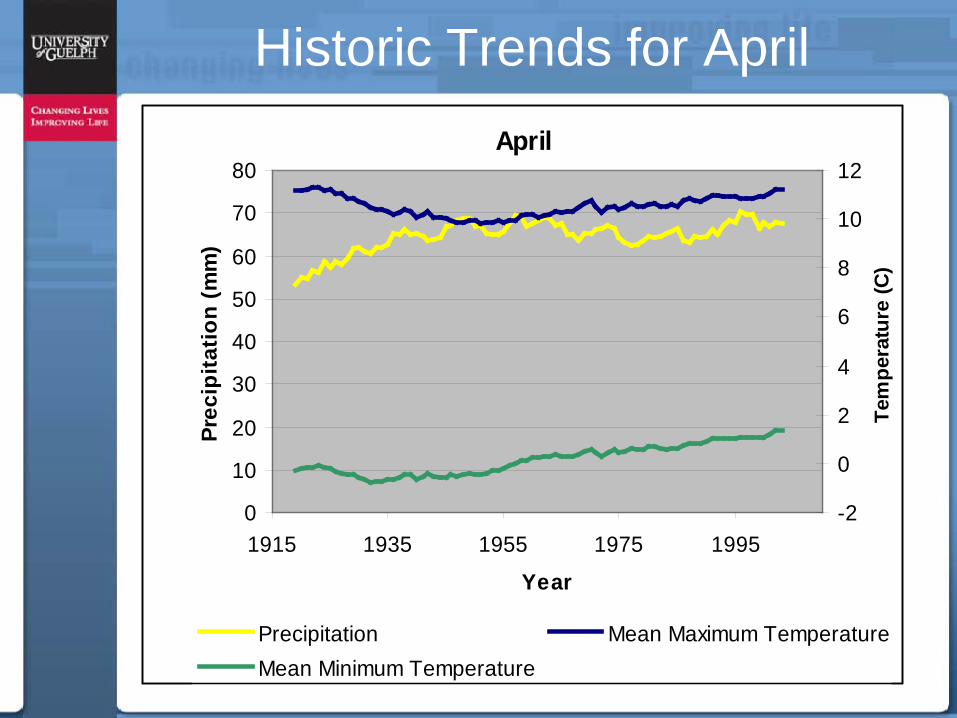
Historic Trends for AprilApril
0
10
20
30
40
50
60
70
80
1915 1935 1955 1975 1995
Year
Prec
ipita
tion
(mm
)
-2
0
2
4
6
8
10
12
Tem
pera
ture
(C)
Precipitation Mean Maximum TemperatureMean Minimum Temperature
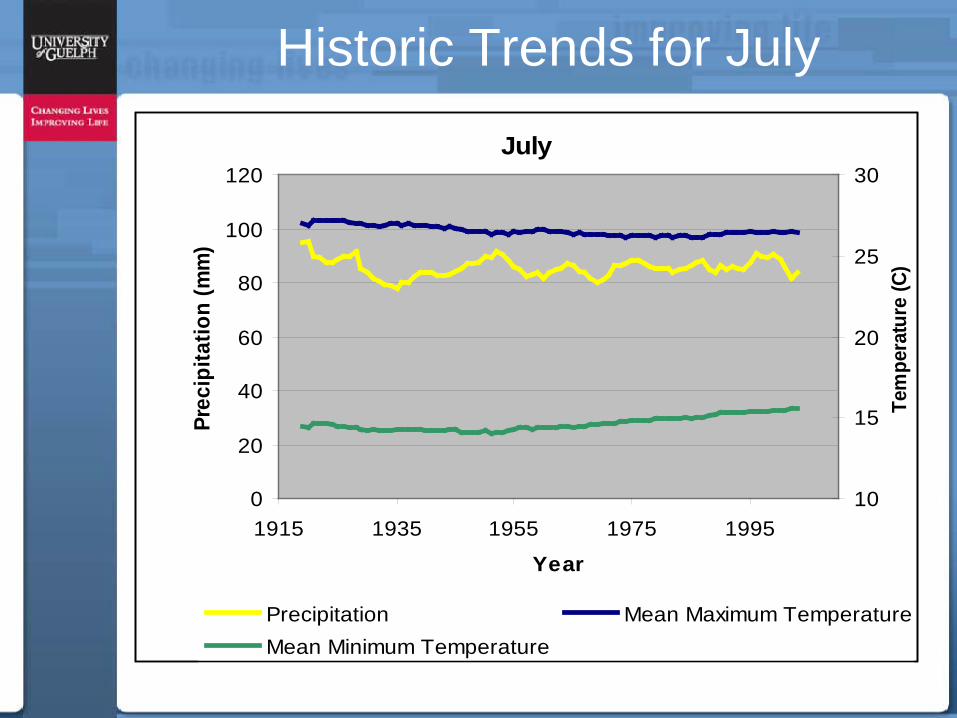
Historic Trends for JulyJuly
0
20
40
60
80
100
120
1915 1935 1955 1975 1995
Year
Prec
ipita
tion
(mm
)
10
15
20
25
30
Tem
pera
ture
(C)
Precipitation Mean Maximum TemperatureMean Minimum Temperature
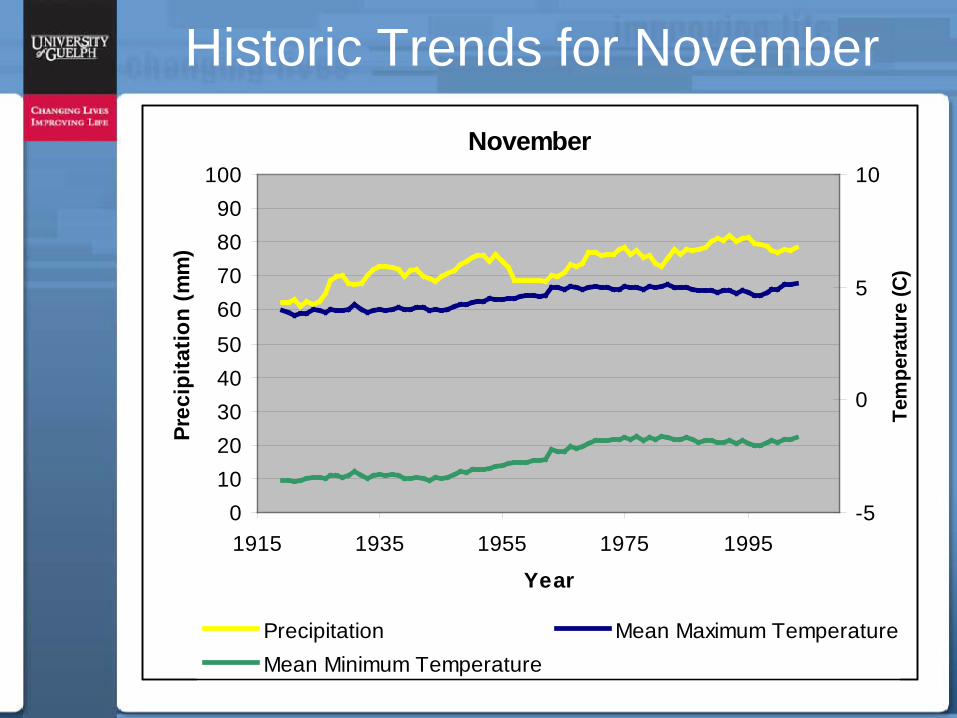
Historic Trends for NovemberNovember
0102030405060708090
100
1915 1935 1955 1975 1995
Year
Prec
ipita
tion
(mm
)
-5
0
5
10
Tem
pera
ture
(C)
Precipitation Mean Maximum TemperatureMean Minimum Temperature
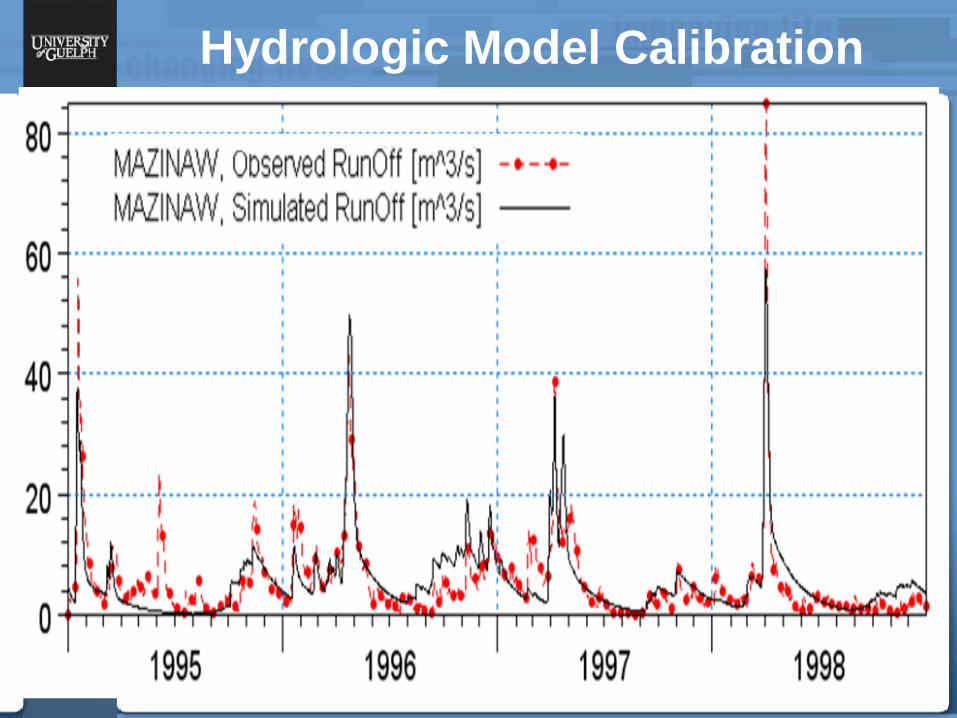
Hydrologic Model Calibration
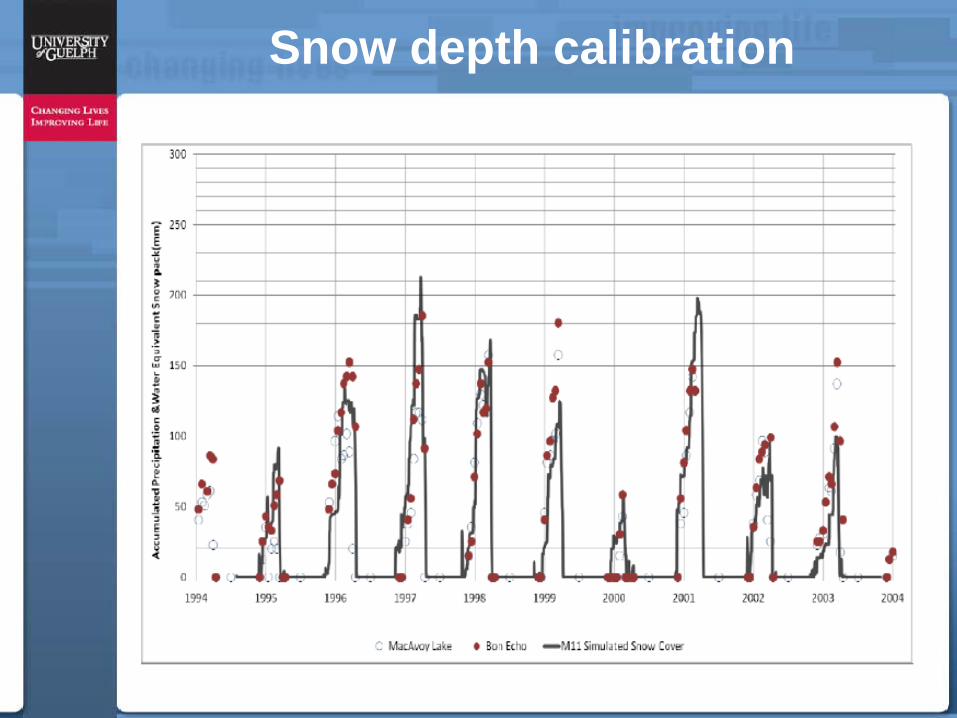
Snow depth calibration
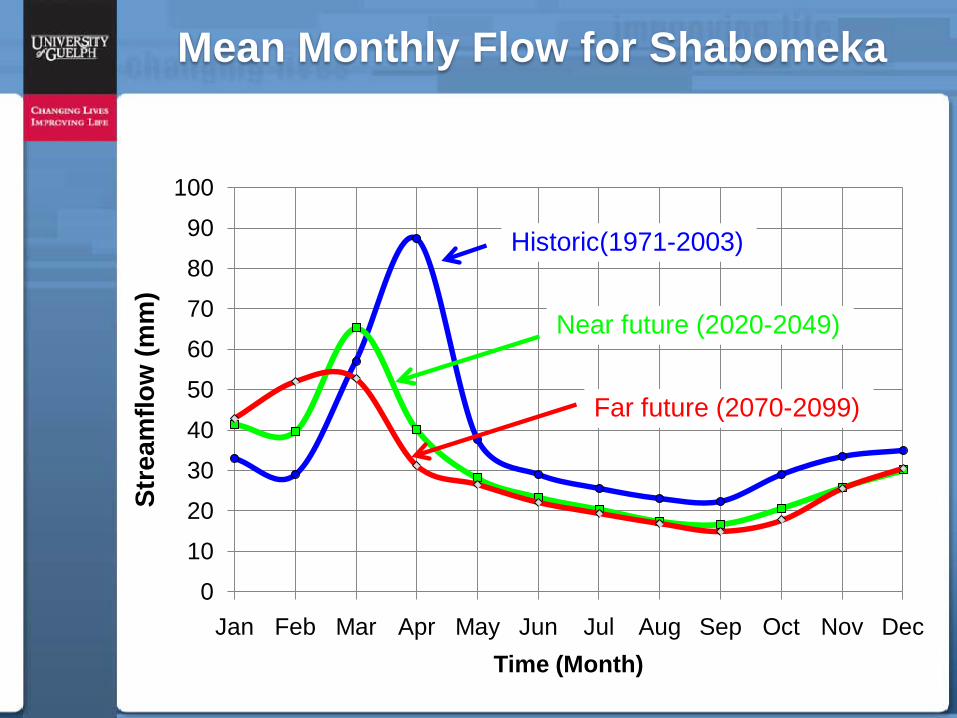
Mean Monthly Flow for Shabomeka
0
10
20
30
40
50
60
70
80
90
100
Jan Feb Mar Apr May Jun Jul Aug Sep Oct Nov Dec
Stre
amflo
w(m
m)
Time (Month)
Historic(1971-2003)
Near future (2020-2049)
Far future (2070-2099)
04/24/2007 26
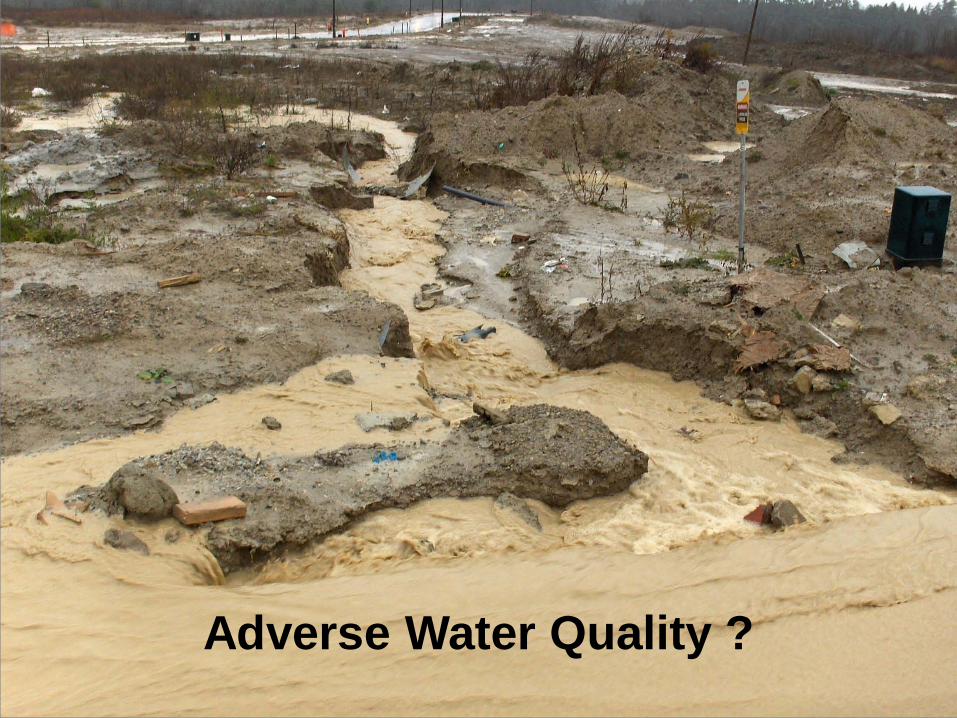
Problem Statement
Adverse Water Quality ?
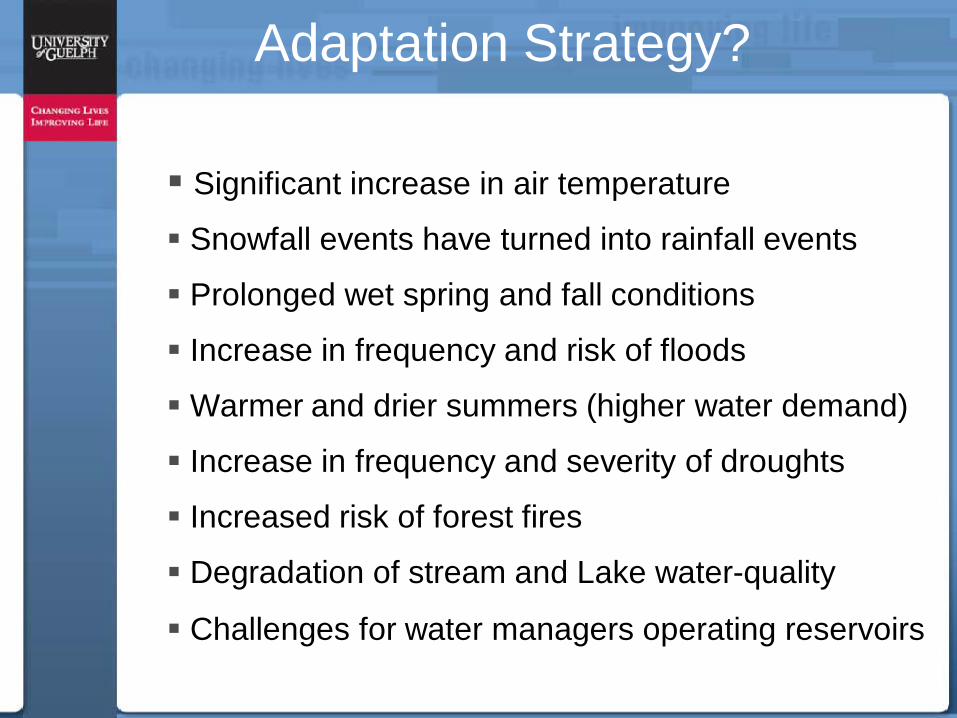
Adaptation Strategy?
Significant increase in air temperature
Snowfall events have turned into rainfall events
Prolonged wet spring and fall conditions
Increase in frequency and risk of floods
Warmer and drier summers (higher water demand)
Increase in frequency and severity of droughts
Increased risk of forest fires
Degradation of stream and Lake water-quality
Challenges for water managers operating reservoirs
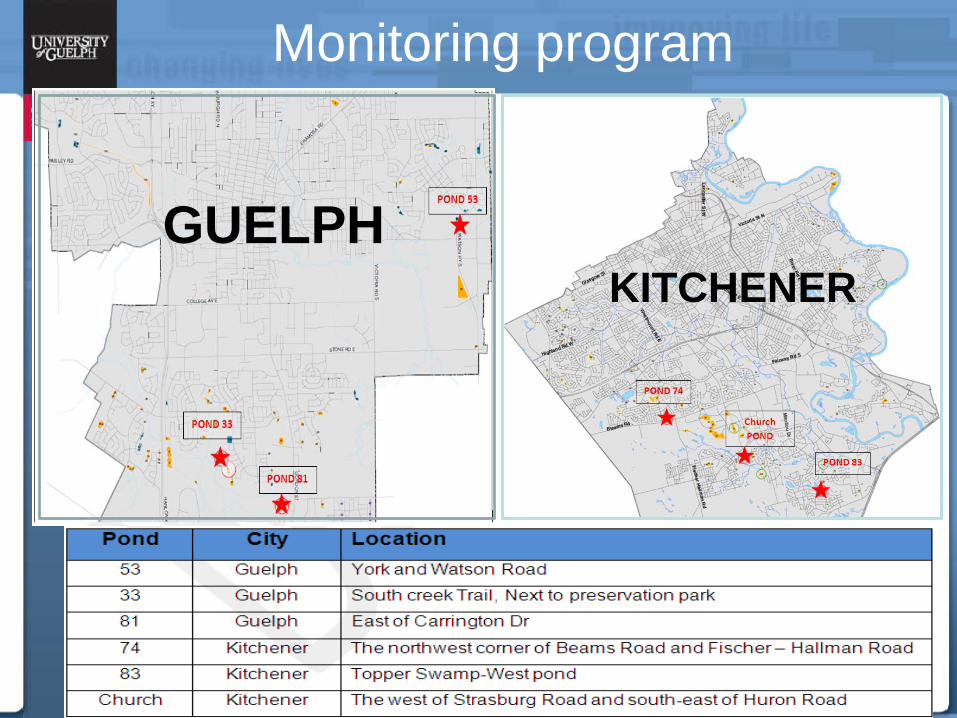
Monitoring program
GUELPHKITCHENER
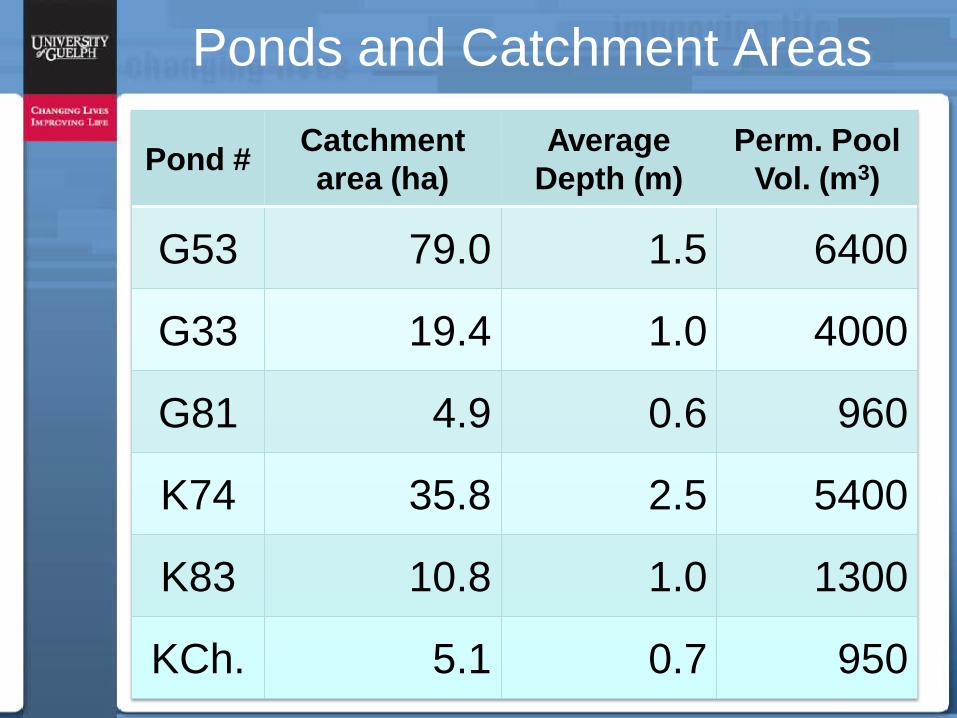
Ponds and Catchment Areas
Pond # Catchment area (ha)
AverageDepth (m)
Perm. Pool Vol. (m3)
G53 79.0 1.5 6400
G33 19.4 1.0 4000
G81 4.9 0.6 960
K74 35.8 2.5 5400
K83 10.8 1.0 1300
KCh. 5.1 0.7 950
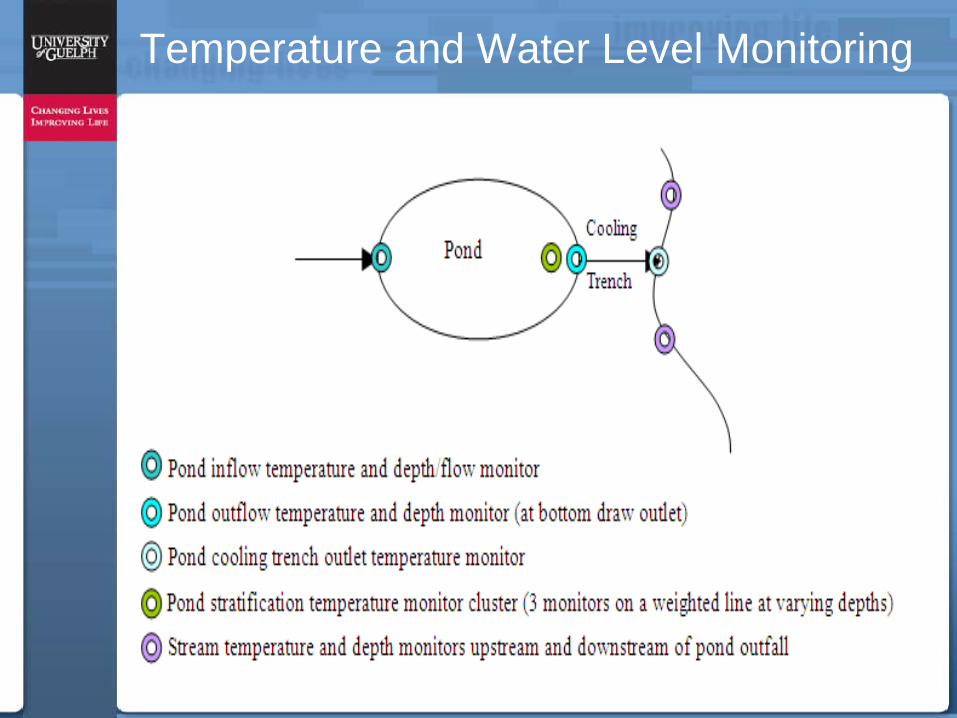
Temperature and Water Level Monitoring
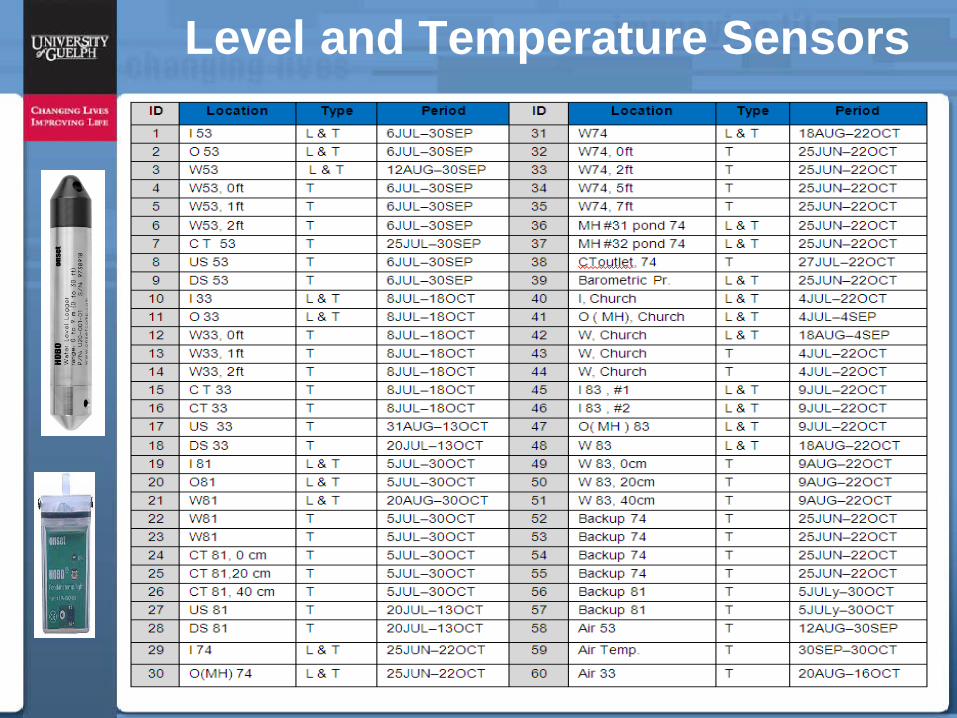
Level and Temperature Sensors
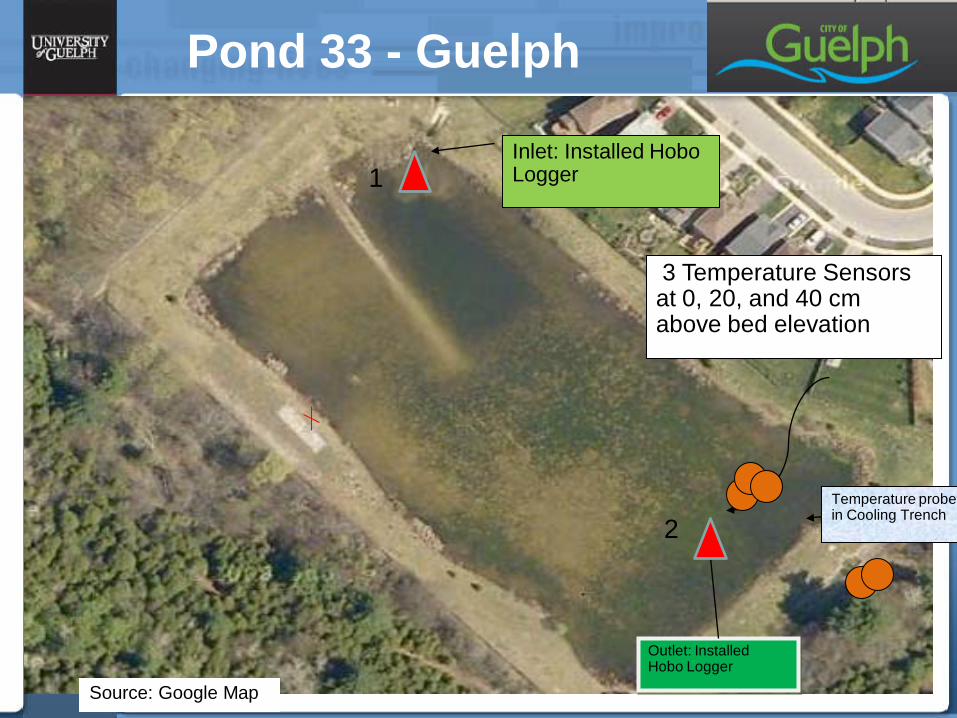
Pond 33 - Guelph
Inlet: Installed Hobo Logger
3 Temperature Sensors at 0, 20, and 40 cm above bed elevation
Outlet: Installed Hobo Logger
Temperature probe in Cooling Trench
Source: Google Map
1
2
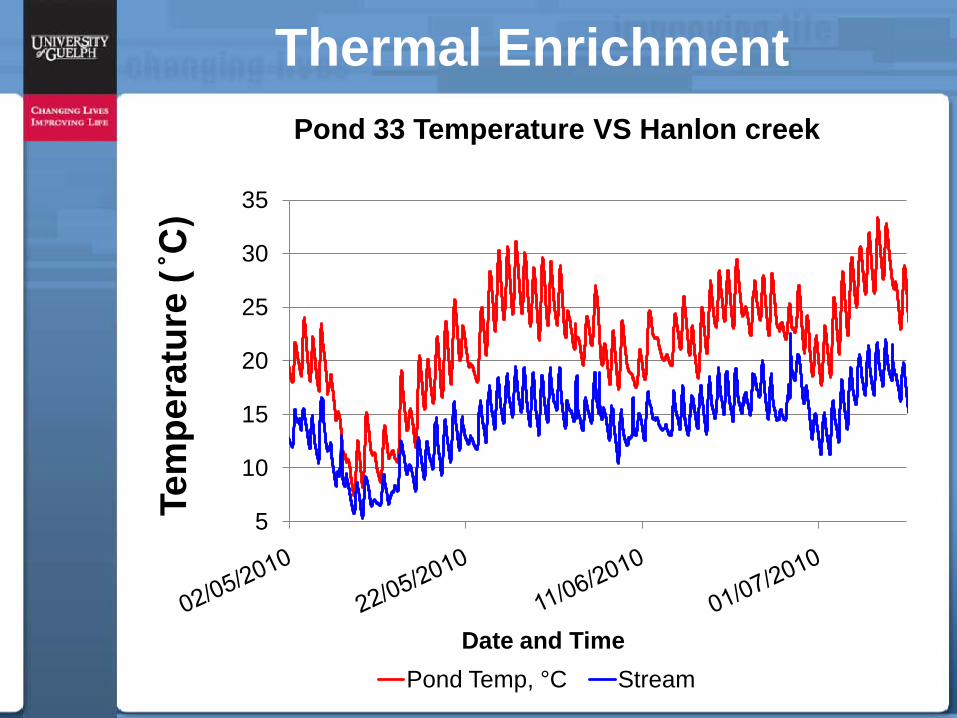
Thermal Enrichment
5
10
15
20
25
30
35Te
mpe
ratu
re (˚C)
Date and Time
Pond 33 Temperature VS Hanlon creek
Pond Temp, °C Stream
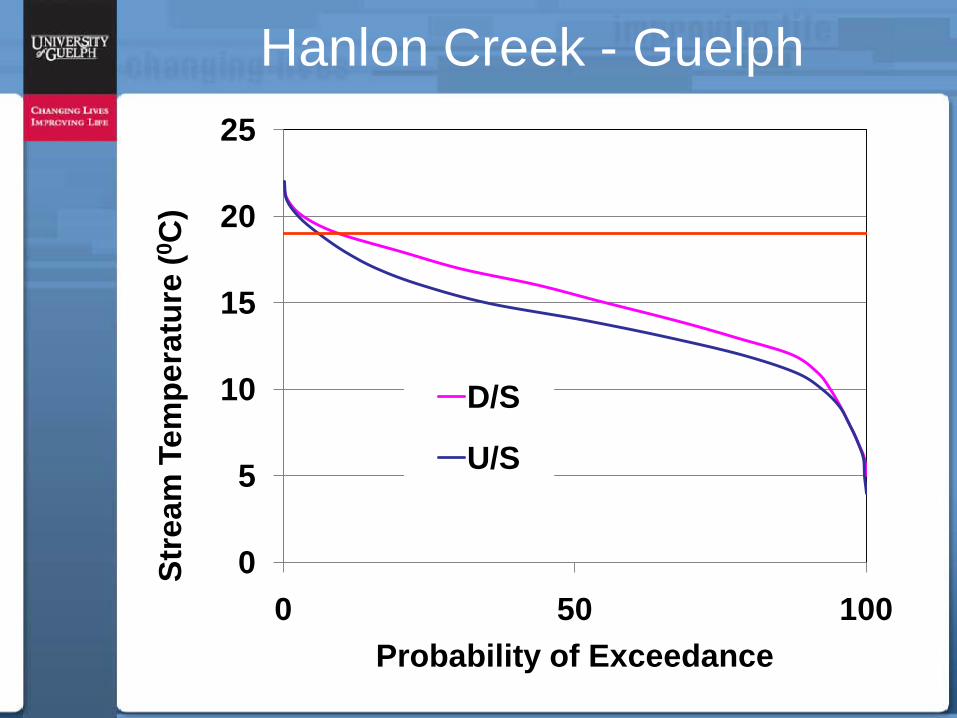
Hanlon Creek - Guelph
0
5
10
15
20
25
0 50 100
Stre
am T
empe
ratu
re (0
C)
Probability of Exceedance
D/S
U/S
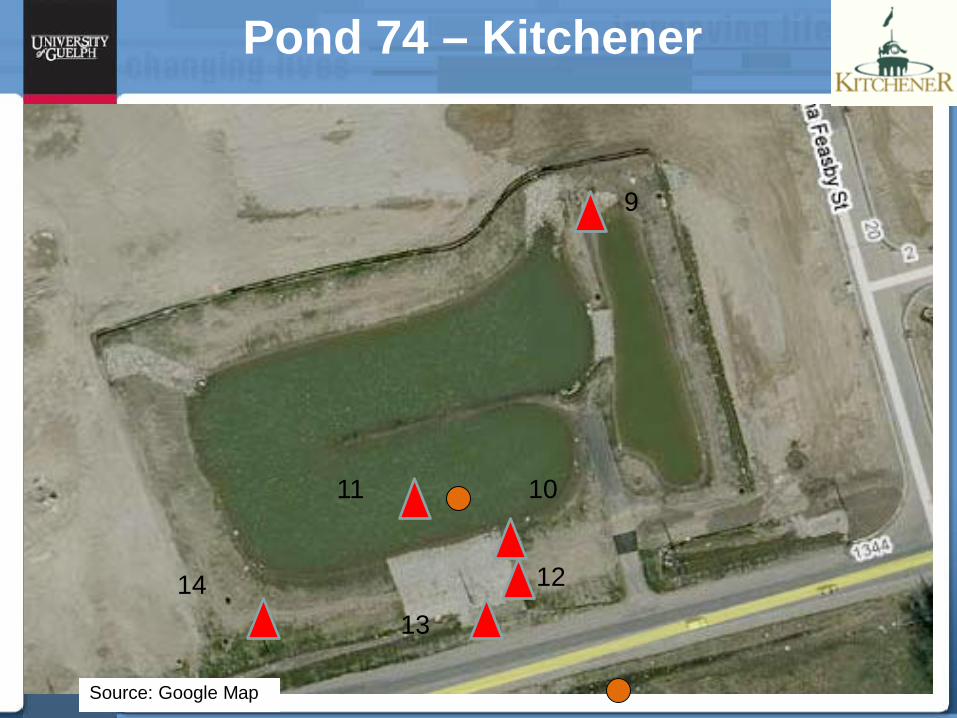
Pond 74 – Kitchener
Source: Google Map
14 12
11 10
9
13
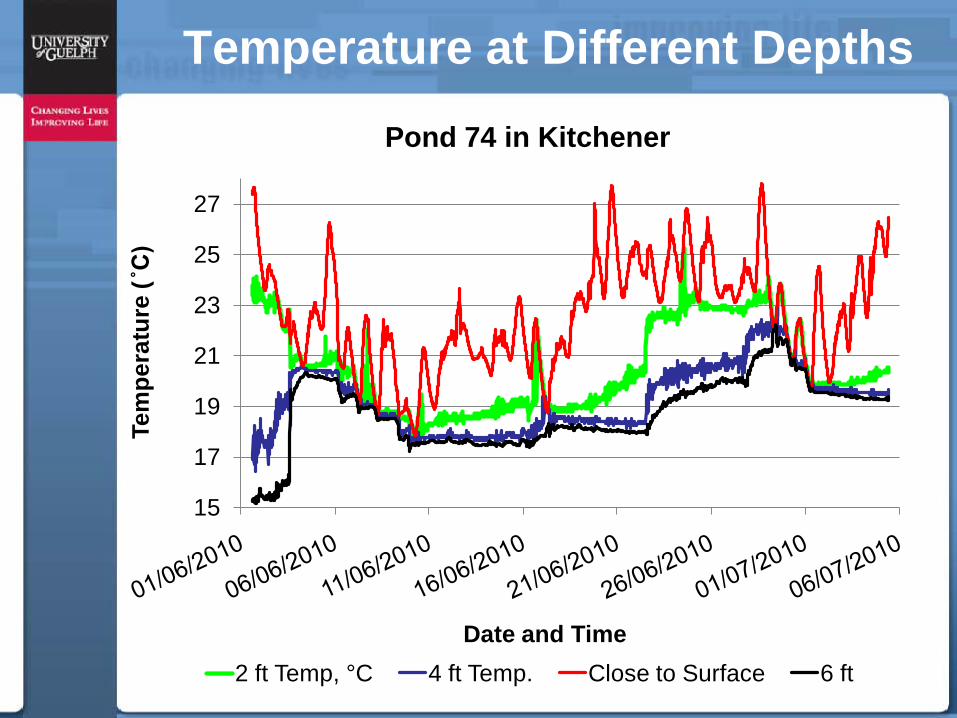
Temperature at Different Depths
15
17
19
21
23
25
27
Tem
pera
ture
(˚C)
Date and Time
Pond 74 in Kitchener
2 ft Temp, °C 4 ft Temp. Close to Surface 6 ft
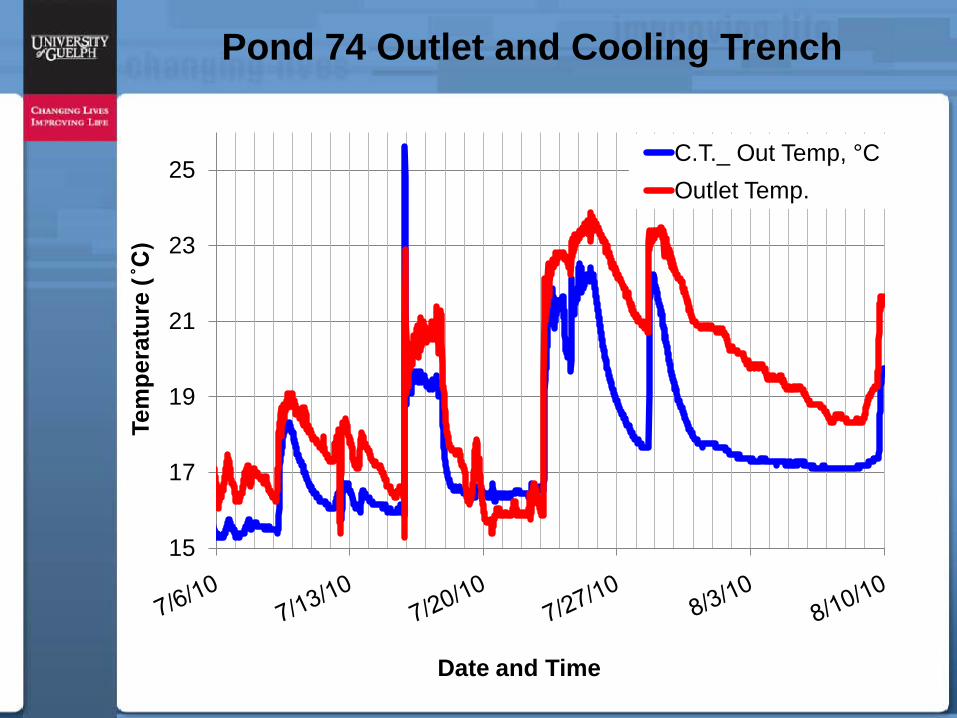
Pond 74 Outlet and Cooling Trench
15
17
19
21
23
25Te
mpe
ratu
re (˚C)
Date and Time
C.T._ Out Temp, °COutlet Temp.