GTC Congestion Management Process Technical Documentation · GTC Congestion Management Process...
66
GTC Congestion Management Process Technical Documentation GENESEE TRANSPORTATION COUNCIL REVISED DRAFT - April 2013
Transcript of GTC Congestion Management Process Technical Documentation · GTC Congestion Management Process...

GTC Congestion Management Process
Technical Documentation
GENESEE TRANSPORTATION COUNCIL
REVISED DRAFT - April 2013
Contact Information
Genesee Transportation Council:
The offices of GTC are located indowntown Rochester at:
50 West Main StreetSuite 8112Rochester, New York 14614
Phone: 585-232-6240Fax: 585-262-3106E-mail: [email protected]
Please visit our website for transportationresources:
www.gtcmpo.org
Financial assistance for the preparation of this report was provided by the Federal HighwayAdministration. The Genesee Transportation Council (GTC) is solely responsible for its content
and the views and opinions expressed herein do not necessarily reflect the official views orpolicy of the U.S. Department of Transportation.
GTC assures that no person shall, on the grounds of race, color, national origin, disability, age,gender, or income status, be excluded from participation in, be denied the benefits of, or be
otherwise subjected to discrimination under any program or activity. GTC further assures everyeffort will be made to ensure nondiscrimination in all of its programs activities, whether those
programs and activities are federally funded or not.
PHOTO CREDITS:
Photographs on pages 10, 14, 24, 34, 39 courtesy of Monroe County Department of Transportation.
Photograph on page 31 courtesy of Stratus Imaging.
All other photographs by GTC staff.

i
DRAFT GTC Congestion Management Process
Table of Contents
1. Introduction............................................................................................................... 1
2. Delay Typologies ........................................................................................................ 9
3. Performance Monitoring and Measurement................................................................... 15
4. Congested Locations................................................................................................... 21
5. LRTP Recommendations.............................................................................................. 29
6. Congestion Management Strategies Toolbox................................................................. 45
Maps
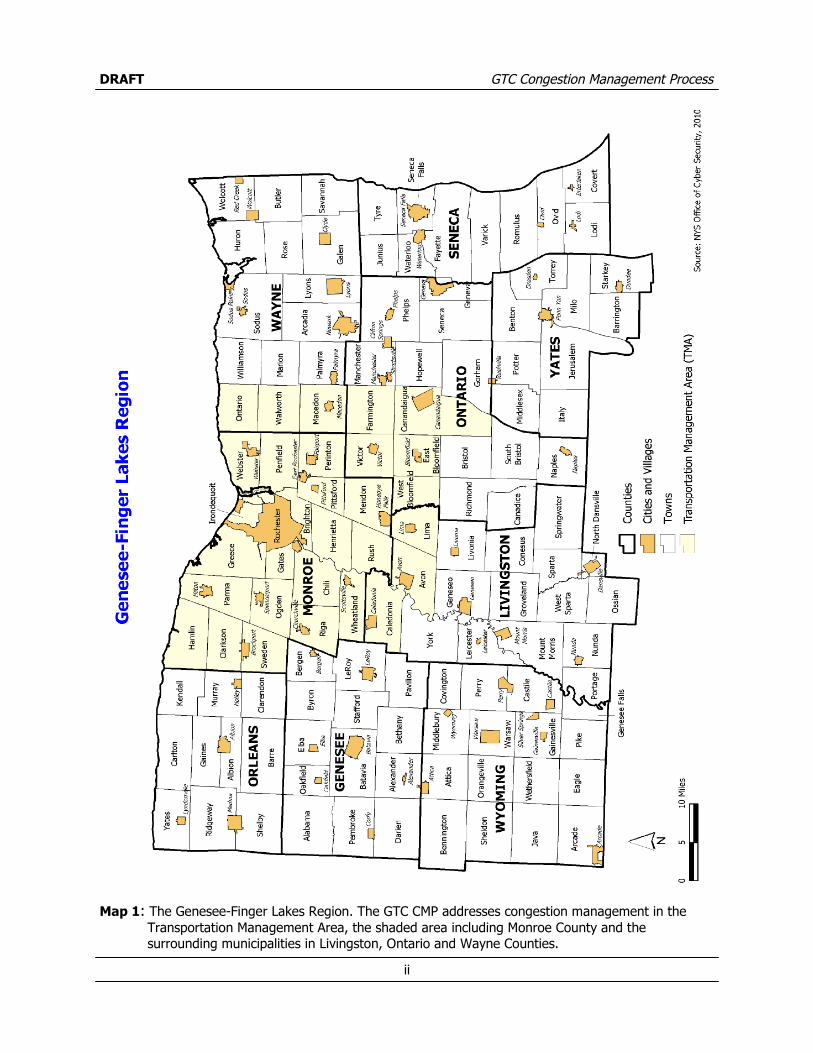
Map 1: The Genesee-Finger Lakes Region………………………………………………………………………..ii
Map 2: Congested Segments in the Morning Peak Period………………………………………………….22
Map 3: Congested Segments in the Evening Peak Period………………………………………………….25
Figures
Figure 1: Congestion Management Process Model…………………………………………………………… 4
Tables
Table 1: Morning Peak Period Congested Segments…………………………………………………………21
Table 2: Evening Peak Period Congested Segments…………………………………………………………23
Table 3: Special Event Venues……………………………………………………………………………………….26
ii
DRAFT GTC Congestion Management Process
Map 1: The Genesee-Finger Lakes Region. The GTC CMP addresses congestion management in theTransportation Management Area, the shaded area including Monroe County and thesurrounding municipalities in Livingston, Ontario and Wayne Counties.

DRAFT GTC Congestion Management Process
1
Section 1 - Introduction
1.1: Purpose of the Congestion Mitigation Process
The Congestion Mitigation Process (CMP) is a systematic approach to traffic congestion man-agement that provides accurate, up-to-date information on transportation system performanceregarding congestion and an assessment of strategies to address it. As defined by the UnitedStates Department of Transportation, congestion management is the application of strategiesto improve transportation system efficiency and reliability by reducing the adverse impacts ofcongestion on the movement of people and goods. Effective congestion management is impor-tant because excessive delay has deleterious impacts on communities, causing an increase intravel times, fuel consumption, vehicle emissions, and emergency response times, as well aslost productivity.
1.2: Basis in Federal Legislation
In 1991 Congress enacted the Intermodal Surface Transportation Efficiency Act (ISTEA), atransportation authorization bill that provided guidance and funding for national transportationinfrastructure investments. ISTEA designated urbanized areas with populations of 200,000people or more as Transportation Management Areas (TMA), and required Metropolitan Plan-ning Organizations (MPO) within each TMA to develop a Congestion Management System(CMS). The CMS was intended to support effective infrastructure investment decisions by iden-tifying the sources and locations of congestion and proposing potential solutions.
Subsequent transportation authorization acts, including the Transportation Equity Act for the21st Century (TEA-21), enacted in 1998; the Safe, Accountable, Flexible, Efficient Transporta-tion Equity Act: A Legacy for Users (SAFETEA-LU), enacted in 2005; and the current authoriza-tion, Moving Ahead for Progress in the 21st Century (MAP-21), enacted in 2012; carried for-ward this requirement. SAFETEA-LU changed the program designation from “Congestion Man-agement System” to “Congestion Management Process” to reflect the idea that managing con-gestion is an ongoing process that must be closely integrated into broader regional transporta-tion planning activities to achieve maximum effectiveness.
Federal legislation mandates that each CMP include the following six elements:
1. Methods to monitor and evaluate the performance of the multimodal transportation sys-tem, identify the causes of recurring and non-recurring congestion, identify and evaluatealternative strategies, provide information supporting the implementation of actions, andevaluate the efficiency and effectiveness of implemented actions;
2. Definition of congestion management objectives and appropriate performance measures toassess the extent of congestion and support the evaluation of the effectiveness of conges-tion reduction and mobility enhancement strategies for the movement of people andgoods. Since levels of acceptable system performance may vary among local communities,performance measures should be tailored to the specific needs of the area and establishedcooperatively by the State(s), affected MPO(s), and local officials in consultation with theoperators of major modes of transportation in the coverage area;

DRAFT GTC Congestion Management Process
2
3. Establishment of a coordinated program for data collection and system performance moni-toring to define the extent and duration of congestion, to contribute in determining thecauses of congestion, and evaluate the efficiency and effectiveness of implemented ac-tions. To the extent possible, this data collection program should be coordinated with exist-ing data sources (including archived operations/ITS data) and coordinated with operationsmanagers in the metropolitan area;
4. Identification and evaluation of the anticipated performance and expected benefits of ap-propriate congestion management strategies that will contribute to the more effective useand improved safety of existing and future transportation systems based on the estab-lished performance measures. The following categories of strategies, or combinations ofstrategies, are some examples of what should be appropriately considered for each area:Demand management measures, including growth management and congestion pricing;traffic operational improvements; public transportation improvements; ITS technologies;and, where necessary, additional system capacity;
5. Identification of an implementation schedule, implementation responsibilities, and possiblefunding sources for each strategy (or combination of strategies) proposed for implementa-tion; and
6. Implementation of a process for periodic assessment of the effectiveness of implementedstrategies, in terms of the area's established performance measures. The results of thisevaluation shall be provided to decision makers and the public to provide guidance on se-lection of effective strategies for future implementation.
GTC, as the designated MPO for the nine-county Genesee-Finger Lakes Region which includesthe Rochester TMA, is charged with the development and implementation of the GTC CMP.The Rochester TMA, which includes all of Monroe County plus the adjacent developed areas ofLivingston, Ontario, and Wayne counties, is the geographic area covered by the GTC CMP.
1.3: Basis in the Long Range Transportation Plan
The Long Range Transportation Plan (LRTP) for the Genesee-Finger Lakes Region 2035,adopted by the GTC board in June 2011, provides the strategic framework for transportationsystem policy, planning, and investment decisions in the region. The content of the LRTP isorganized around four “guiding principles,” which describe how transportation infrastructureand services link to the social and economic vitality of the region. Congestion management isan important element in each of these guiding principles:
1. Plan for People
Local officials and decision-makers often consider infrastructure and services the end re-sults of the transportation planning process. However, the LRTP focuses on the impacts onpeople that the plan will have. Congestion management is important to the community be-cause reducing delay and uncertainty increases the time that residents have for other ac-tivities, whether it be work, education, recreation, or simply more time with family andfriends.
2. Place Matters
Different places have different transportation needs. The need for congestion manage-

DRAFT GTC Congestion Management Process
3
ment, however, is a common theme of all areas. While not all roads and locations withinthe TMA are congested, it is worthwhile to factor in congestion management practices fortransportation projects in all locations to either address existing congestion or prevent fu-ture congestion growth. Congestion management strategies must be tailored to the needsof specific locations and, to be most effective, must consider all available modes of trans-portation as well as both supply- and demand-side approaches.
3. Maximize Existing Assets
Traditionally, transportation planners and engineers have used infrastructure expansionprojects as a solution to problems such as increasing traffic congestion and travel times.However, funds for such projects have become extremely limited and road expansion isgenerally no longer a viable alternative. More economical solutions are available that areoften equally, if not more, effective. Congestion reduction can be achieved through Intelli-gent Transportation Systems (ITS) deployments, including traffic signal timing coordinationand optimization, traffic cameras, and traveler information services. In addition, travel de-mand-related solutions such as alternate modes of transportation, transit-supportive devel-opment patterns, and alternate work hours/locations may also decrease congestion.
4. Accept Uncertainty
Given the anticipated funding limits on transportation infrastructure projects during thenext several years, the most effective way to address traffic congestion may be to inte-grate congestion mitigation into other projects. Stand-alone congestion reduction projectsmay not have enough benefits to be included in the Transportation Improvement Programor a member agency’s capital improvement plan. However, by developing a bridge or high-way rehabilitation project that can also reduce congestion through lane restriping, a mem-ber agency can accomplish an infrastructure preservation project as well as realize opera-tional improvements.
The LRTP identified 25 recommendations that address congestion management. Please referto Section 5, LRTP Recommendations, for a list of recommendations related to congestionmanagement as well as their associated representative projects and supporting activities. TheCMP expands on commentary and information presented in the LRTP by providing a morethorough assessment of current congestion trends in the region and identifies potential solu-tions.
1.4: CMP Elements
The Federal Highway Administration (FHWA) provides guidance on CMP development and im-plementation. FHWA created a “process model” that breaks down the CMP development proc-ess into eight elements. The process model is not intended to serve as a step-by-step guide tothat process, but rather is intended to convey the key actions needed to prepare an effectiveCMP. Some actions depicted in the model may be revised on an ongoing basis or periodicallyupdated as part of the LRTP development process, while other actions may be fixed for longperiods of time. All of the actions are linked together in a cyclical framework.
A brief discussion and assessment of each element, focused on its relevance for the GTC CMP,follows the process model graphic depicted on the following page.

DRAFT GTC Congestion Management Process
4
Figure 1: Congestion Management Process Model
Source: Congestion Management Process: A Guidebook. Page 9. FHWA, 2011.
1. Develop Regional Objectives for Congestion Management: Objectives define the CMP’s de-sired outcome and provide overall direction to its actions. The objective of the GTC CMP is:
To enhance the mobility of people and goods in the Genesee-Finger Lakes Region by ad-vancing coordinated multi-modal and corridor-level solutions that mitigate existing andavoid future excess delay through initiatives that yield improved regional transportationsystem performance now and in the future.
2. Define CMP Network: The CMP network includes both the geographical scope as well as thetransportation system elements analyzed by the CMP. The geographic scope of the GTCCMP is the Rochester TMA. The system elements include all Interstates, principal and mi-nor arterials, and major and minor collector roads in the TMA, as well as local roads in thevicinity of special event venues.

DRAFT GTC Congestion Management Process
5
3. Develop Multimodal Performance Measures: A CMP should identify how traffic congestion isdefined and measured. The GTC CMP identifies congested road segments with the TravelTime Index (TTI), a measurement of travel delay. The TTI is the ratio of travel time duringthe peak period to the time required to make the same trip at free-flow speeds. It is calcu-lated by dividing the peak period travel time by the free-flow travel time. A TTI value of1.3, for example, indicates that a 20-minute trip in free-flow conditions requires 26 min-utes during the peak period. The TTI ratio is a useful measurement because it provides aneasily calculated and readily understandable congestion measure.
As discussed in Section 3, Performance Monitoring and Measurement, congested links thatexperience Recurring Capacity Related Delay are those with a TTI of 1.25 or greater. TheTTI may also be used to identify potential locations of Non-Recurring Incident-Related De-lay. These are locations where a traffic incident occurring prior to or during the peak pe-riod has the potential to generate significant delay. While the TTI does not directly meas-ure non-recurring congestion, road segments with recurring delay will experience evengreater delays should non-recurring congestion occur there.
4. Collect Data/Monitor System Performance: The CMP should identify what data is needed foranalyzing traffic congestion and how it will be collected. Section 3 discusses the data col-lection process, including data needs, location and frequency of data collection, and howthe selected performance measures monitor congestion conditions.
5. Analyze Congestion Problems and Needs: A CMP should identify the locations and causes ofcongestion. Please see Section 2, Delay Typologies, for a description of the three types ofcongestion analyzed in this CMP and Section 4, Congested Locations, for a discussion ofthe location of congestion in the Rochester TMA.
6. Identify and Assess Strategies: The CMP should identify potential congestion managementstrategies and assess their practicality. There is a broad array of potential congestion re-duction strategies, but they are not always feasible or desirable. Section 5 discusses all thestrategies included in the LRTP 2035 that include a congestion management element. Sec-tion 6 lists all potential congestion management strategies that could be applied in theRochester TMA and briefly reviews their benefits, costs, and expected impacts.
7. Program and Implement strategies: The CMP should provide direction on which of the con-gestion management strategies will be enacted and how they will be managed. The GTCCMP actions, which are also recommendations in the LRTP, are folded into the LRTP imple-mentation schedule and are anticipated to follow that schedule.
8. Evaluate Strategy Effectiveness: The CMP should include a process to evaluate the effec-tiveness of congestion management actions and identify lessons gleaned from successfulcongestion management practices in the region. Section 3 of the GTC CMP includes com-mentary on how the CMP performance measures will be used to track the effectiveness ofcongestion management strategies.

DRAFT GTC Congestion Management Process
6
1.5: Congestion Trends
National
Traffic congestion is a growing nation-wide problem that is receiving increased attention fromboth the private and public sectors. A 2011 IBM Global Services report on transportation andeconomic development stated that traffic congestion “negatively impacts the quality of life bydecreasing personal and business productivity, lowering air quality, creating noise pollution,adversely impacting health, [and] lead[s] to the waste of nearly 1.9 billion gallons of fuel eachyear.”1 Many reports and studies published by the United States Department of Transportationidentify traffic congestion as a problem that burdens travelers and businesses with greatercosts due to increased travel times and reduced travel time reliability.
The Urban Mobility Reports published by the Texas Transportation Institute (TTI) provide themost accurate surveys of national congestion trends currently available. Published annuallysince 1982, the Urban Mobility Reports allow for analyses of nation-wide congestion trendsover the past 30 years.
The Urban Mobility Reports analyze travel times and congestion trends in the 101 largestAmerican metropolitan areas. The report organizes these areas into four categories: VeryLarge (over three million in population), Large (over one million and less than three million inpopulation), Medium (over 500,000 and less than one million in population), and Small (lessthan 500,000 in population). Rochester is classified as a Medium-sized metropolitan area.
The 2011 Urban Mobility Report observes that “congestion, by every measure, has increasedsubstantially” since the Urban Mobility Report was first published and clearly shows how trafficcongestion and the resultant delay is an increasing problem for the American economy. Thereport identifies the following key findings for 2010:
1.9 billion gallons of wasted fuel (fuel consumed as a result of traffic delays) 4.8 billion hours of extra time (time lost due to traffic delays) 101 billion of delay and fuel costs (costs associated with increased delivery times)
Congestion continues to impact travelers during peak periods. Peak period delay for the aver-age commuter grew from 14 hours in 1982 to 34 hours in 2010, an increase of 20 hours. In2010 commuters wasted 14 gallons of fuel (equivalent to a week’s of fuel for the averagedriver) in peak period delays, more than doubling the six gallons of fuel wasted in 1982. Thephrase “rush hour” no longer applies to most metropolitan areas because peak periods oftenlast far longer, rising to six hours for the largest metropolitan areas.
Furthermore, congestion is increasingly spreading into non-peak times as well. Approximately40 percent of total delay occurs outside peak periods, during the middle of the day and atnight, when travelers and shippers typically expect free-flow conditions. In addition to disrupt-ing personal travel, non-peak congestion may impact freight shipments, delaying deliveriesand costing shippers additional fuel, driver time, and vehicle wear and tear.
1 Mary Keeling and Gerard Mooney, Transportation and Economic Development: Why Smarter Transportis Good for Growth (IBM Global Services, Somers, N.Y., 2011), 3.

DRAFT GTC Congestion Management Process
7
Congestion is not limited to large cities, but is a concern for medium and small cities as well.Growing congestion in medium and small cities may make those places less attractive to busi-nesses looking to locate where they will not be impacted by travel delay, thus reducing a keycompetitive advantage of those places.
Regional
The Greater Rochester TMA does not experience the congestion-related delays that largermetropolitan areas regularly do. According to the Urban Mobility Report, travel times in Roch-ester rank favorably when compared to other metropolitan areas. Of the 101 urban areas ana-lyzed in the report, Rochester ranks 76 with approximately 6.4 million hours of delay per year,well below the average delay of about 9.5 million hours per year for medium-sized cities.Rochester area motorists consume an estimated 1.2 million gallons of excess fuel; also wellbelow the average of 2.2 million gallons of excess fuel consumed by medium-sized cities.
Travel times in the Rochester area look especially favorable when compared to travel times inthe Very Large metropolitan areas. These areas record an average of approximately 187.9 mil-lion hours of delay per year and about 90.7 million gallons of excess fuel, which masks tre-mendous disparities: the country’s most congested urban area, Los Angeles, accounts for amassive 521.4 million hours of delay and consumes an excess of 278.3 million gallons of fuelper year. However, direct comparisons between the Rochester area and regions like metropoli-tan Los Angeles are not especially useful for regional planning efforts given significant differ-ences in population size, geography, economy, development patterns, and transportationmodes.
In addition to the Urban Mobility Reports, other publications assign a favorable rank to theRochester area in terms of travel times. In March 2011 the financial services publication Kiplin-ger ranked Rochester as the best city in the United States for commuters. Kiplinger used fac-tors such as average commute mileage, average yearly delays per commuter, and averagegallons of wasted fuel to determine city rankings. Rochester, with yearly delays per commuterof 12 hours and yearly wasted fuel of 11 gallons, compared favorably to the national averageof 34 hours of delay and 28 gallons of wasted fuel.2 In April 2008 a Forbes article on commutetimes in American cities also assigned Rochester a favorable ranking and noted that it had thelowest annual delay of any of the 75 cities analyzed for the article.3
However, while the Rochester area performs well in national congestion rankings, there arestill delay issues that should be dealt with in order to address regional safety, efficiency, reli-ability, and air-quality concerns. In addition to recurring capacity-related delay, which occursas the result of demand outpacing the supply of road space during peak periods, plannedevent-related delay (delay caused by planned special events such as road construction andcommunity events) and non-recurring incident-related delay (delay caused by vehicle crashes)also impact travel in the region. Section 2 of the CMP discusses the three types of delay thatimpact this region in greater detail.
2 Susannah Snider, “10 Best Cities for Commuters,” Kiplinger, March 1, 2011.3 Matt Woolsey, “Best and Worst Cities for Commuters,” Forbes, April 25, 2008.
DRAFT GTC Congestion Management Process
8
Changes in the regional economy and development patterns during the second half of thetwentieth century contributed to the growth of traffic congestion. In the mid-twentieth cen-tury, when the regional expressway system was designed and built, the area’s main employ-ment centers included downtown Rochester and large industrial facilities on the City’s north-west side, such as Kodak Park and the General Motors plant. However, as the number of em-ployees at these centers decreased during the later decades of the twentieth century, conges-tion pressures on the roads around them also fell. Simultaneously, as employment grew in lo-cations such as the University of Rochester/Strong Memorial Hospital and in suburban service-oriented business parks along the I-490 corridor between Brighton and Victor, congestion onnearby roads increased. As a result, today some locations are over-served by the region’s roadnetwork while demand has outpaced the supply of road space in other locations.
Regional development patterns also play a crucial role in explaining the locations and causes oftraffic congestion. Post-World War II automobile-oriented suburban development typicallyforces travelers to use private cars for all trips, including short, local trips that in pre-warneighborhoods could be accomplished by walking or transit. This type of suburban develop-ment, coupled with the opening of the New York State Thruway in 1954 that reoriented long-term growth patterns in metropolitan Rochester towards the south-central towns of MonroeCounty, resulted in the growth of extensive suburban areas accessible primarily by car. In ad-dition, many urban neighborhoods were reconstructed to better accommodate automobiles bywidening streets, building urban expressways, and developing extensive parking infrastructure.
Congestion pressures on local roads rose because even with the construction of new roads andthe expansion of existing ones, demand for road space grew faster than the system’s ability toabsorb it. In the Greater Rochester area, as in metropolitan areas throughout the UnitedStates, expanding the supply of road space without an equal emphasis on managing demandfor that space contributed to congestion growth by encouraging increased automobile use.This trend was furthered by the promotion of land use and development policies that priori-tized automobiles over other modes of transportation. The GTC CMP seeks to manage conges-tion in the Rochester TMA by addressing the demand for road space as well as by increasingthe supply of it primarily through non-traditional operational improvements.
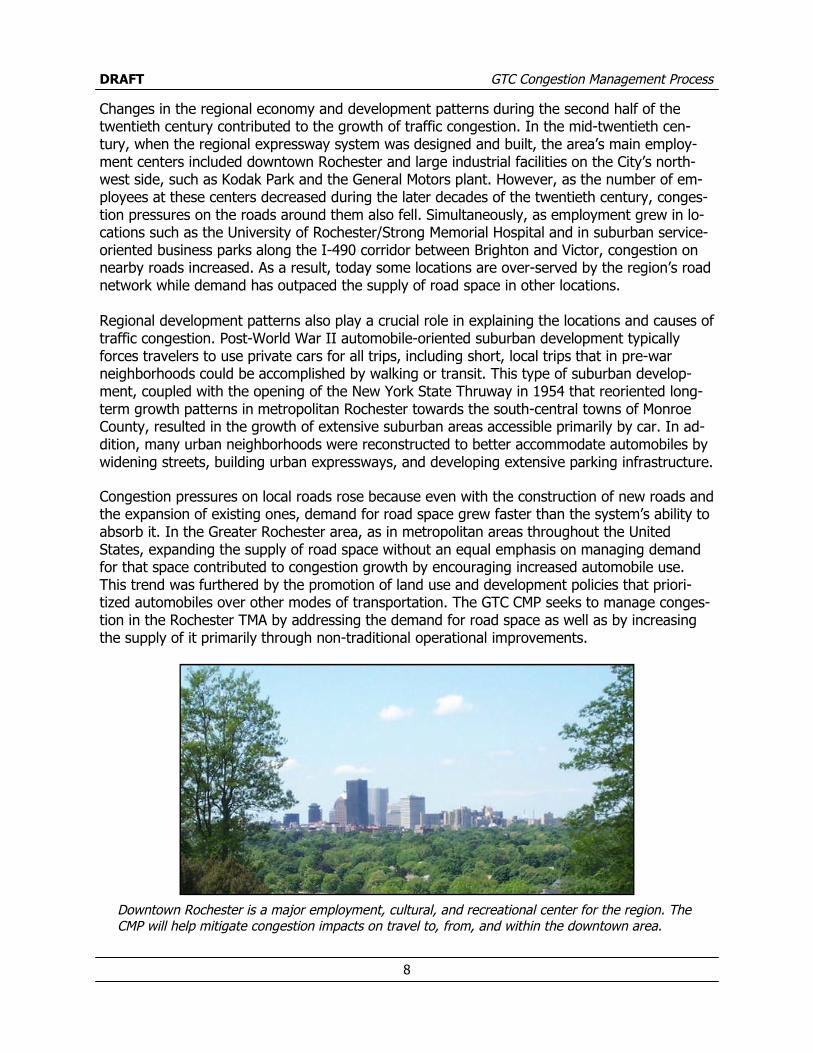
Downtown Rochester is a major employment, cultural, and recreational center for the region. TheCMP will help mitigate congestion impacts on travel to, from, and within the downtown area.

9
DRAFT GTC Congestion Management Process
Section 2: Delay Typologies
The GTC CMP classifies all types of travel delay into the following three categories:
1. Recurring Capacity-Related Delay2. Planned Event-Related Delay3. Non-Recurring Incident-Related Delay
The impacts of travel delay are often broadly similar regardless of category; however, each ofthe three delay typologies has different causes that influence applicable solutions. Initiativesaimed at reducing congestion caused by one type of delay may not be appropriate for manag-ing congestion caused by another type of delay. The congestion management recommenda-tions in Section 5 include solutions for all three types of delay.
The following sections define each type of delay, explain where in the region it occurs, de-scribe the general issues that each type of delay causes for transportation system users, andidentify potential solutions. For a complete list of available solutions, please refer to Section 6,Congestion Management Strategies Toolbox.
2.1: Recurring Capacity-Related Delay
Definition
Recurring Capacity-Related Delay is the predictable daily increase in demand for road spacethat exceeds available capacity. This type of delay is typically caused by commuters duringmorning and evening peak periods.
In addition, seasonal traffic patterns may contribute to recurring delay. Examples include de-mand for access to regional commercial centers during the holiday shopping season and in-creased traffic on and around university campuses when students arrive and depart at the be-ginning and end of the academic year.
Location
Recurring Capacity-Related Delay typically occurs at “bottlenecks” in the transportation sys-tem, such as expressway interchanges and arterial intersections where demand for road spaceis greater than the intersection’s capacity to handle that demand. A second source of this typeof delay is uncoordinated traffic signals, which may not be timed for maximum throughput,thus limited the number of vehicles served by an intersection.
Impacts
Typical impacts of Recurring Capacity-Related Delay include increased travel times, driver frus-tration, fuel consumption, vehicle emissions, and incident response times. These impacts col-lectively decrease the efficiency, reliability, and safety of the transportation system by impos-ing additional costs and uncertainties on system users.

10
DRAFT GTC Congestion Management Process
Solutions
Capacity Expansion – Traditionally, capacity expansion projects involved widening roads toadd travel lanes. However, these types of projects can be costly, disruptive, and have alengthy implementation timeframe; they also burden the community with additional long-term operations and maintenance costs. As a result, traditional capacity expansion projectsshould only be considered for unique and critical projects of regional significance. How-ever, capacity expansion can be accomplished in other ways, such as restriping a road toadd or reconfigure travel lanes or deploying Intelligent Transportation Systems (ITS)instrumentation to better manage existing lanes.
Traffic Signal Synchronization – Coordinating traffic signal timing plans at intersectionsalong heavily traveled corridors reduces congestion by increasing vehicle throughput andstreamlining traffic flows to and from side streets, access roads, and driveways.
Traveler Information Systems – Services such as 511NY and Highway Advisory Radio,along with ITS instruments such as Dynamic Message Boards (DMS), provide real-time in-formation to travelers that allow them to adjust their routes based on a range of factorssuch as incidents, roadwork, weather conditions, and congestion.
Mode Choice – A multi-modal transportation system offers travelers a choice of how toreach their destinations. Shifting modes from private automobiles to buses, bicycles, andwalking (for short trips within neighborhoods) reduces demand for road space.
Land Use and Development Patterns – Expansive, automobile-dependent suburban land-use and development patterns can be redeveloped over time to better support the in-creased use of alternate modes of transportation, including transit and bicycling, as well asimproved pedestrian connections between neighborhoods. As a result travelers can selectthe optimal mode for their trip rather than relying on their car at all times.
The Regional Traffic Operations Center (RTOC) serves as the hub of ITS operations in theRochester TMA. The region’s investments in ITS infrastructure, including traffic signal manage-ment, traffic cameras, dynamic message signs, and road weather information stations, are cru-cial underpinnings of ongoing congestion management activities.

11
DRAFT GTC Congestion Management Process
2.2: Planned Event-Related Delay
Definition
Planned events are scheduled activities that can cause delay on the region’s roadways. TheLong Range Transportation Plan (LRTP) 2035 identified two categories of Planned Event De-lay: 1.) Programmed construction work that reduces roadway capacity and 2.) Special eventssuch as concerts, festivals, and sports games that occur in regional venues and place a greaterthan normal demand on the road system around those venues.
Road construction generally causes delay by reducing the space available for vehicles to move,thus creating traffic bottlenecks. Construction activities may not increase the number of vehi-cles using a road, but they often it more difficult for the same number of vehicles to passthrough a specific location. In comparison, special events typically cause delay because theyattract a large number of vehicles to a specific site during a relatively narrow time frame.Available road space for vehicles to move through may remain the same, but the number ofvehicles attempting to pass through that space can dramatically increase. The result is thesame as a reduction of road space due to construction work – a traffic bottleneck.
An important congestion management consideration for planned events is that they may causedelay in locations far away from the event site. For example, the movement of large construc-tion vehicles and equipment to and from a work zone could impede traffic flow on roads milesaway from the work zone. Certain special events, such as a marathons, parades, or festivalsmay entail road and intersection closures, thereby reducing the availability of road space fortraffic. There are a broad range of options available to address these scenarios as discussedbelow.
Location
Planned Event-Related delays occur in the vicinity of the TMA’s special event venues, includingstadiums, theatres, and performing arts centers; parks and fairgrounds; and college cam-puses. In addition, planned events include scheduled road work in designated work zones.
Delays occurring as a result of planned work road may occur anywhere on the transportationsystem. Minimizing travel delay is one of the considerations factored into detour route andwork zone planning by regional transportation management agencies.
Impacts
Typical impacts of Planned Event-Related Delay include increased travel times, fuel consump-tion, vehicle emissions, and incident response times. In addition, this type of delay may restrictaccess to special event venues. Like Recurring Capacity-Related Delay, this type of delay de-creases the efficiency, reliability, and safety of the transportation system.
Solutions
Work Zone Management – Deploy ITS instrumentation, such as portable DMS, in the vicin-ity of work zones to provide real-time guidance to motorists. Modify traffic signal timing to

12
DRAFT GTC Congestion Management Process
better manage traffic flows that may change as the result of construction. Publicize infor-mation about the work zone (location, start/end times) through traveler information sys-tems.
Traveler Information Systems – Transportation management agencies can provide infor-mation about planned events to travelers via resources such as 511NY, as well as throughagency websites, press releases, and email and text message alerts. DMS may be used toguide traffic to/from an event.
Traffic Management Plan – In coordination with event organizers, transportation manage-ment and law enforcement agencies preparing for special events frequently plan for thefollowing considerations:
Site Access/Egress – Determine how attendees will access the venue of a special event,what modes of transportation the venue will support, how entry to and exit from thevenue will be managed.
Parking – Determine how event parking will be managed, how motorists will pay forparking, how motorists will be guided to/through parking areas.
Pedestrian Access – Identify how pedestrians will obtain access to the site, where pe-destrian crossings will be, ascertain whether or not crossing guards are needed to fa-cilitate pedestrian movements.
Traffic Flow – Determine how traffic flows on roads and through intersections will bemanaged, which (if any) intersections need to be closed off, whether or not reversetravel lanes will be instituted to increase road capacity to better handle traffic movingto/from the event.
Traffic Control – Determine what traffic signal timing/phasing modifications are neededto handle increased or re-routed traffic flows. Identify what temporary traffic controldevices (reflectors, barrels, portable DMS, etc.) will be deployed. Coordinate with lawenforcement to determine if officers will be deployed to manage intersections or kepton stand-by in the vicinity in case they are needed.
Traffic Monitoring – Determine the benefits of monitoring traffic conditions in real time.Identify what personnel/ITS deployments are needed to monitor traffic conditions.
Traffic Incident Management – Identify the lead incident command agency prior to theevent. Station resources needed to address potential traffic incidents in the vicinity ofthe event area/work zone to reduce response times. Identify access/egress points thatmay be closed off during the event and are either unavailable for use by emergencyservices or need to be reopened for them.
Effective work zone managementhelps mitigate the impacts ofcongestion resulting fromconstruction activities.

13
DRAFT GTC Congestion Management Process
2.3: Non-Recurring Incident-Related Delay
Definition
Non-Recurring Incident-Related Delay occurs as the result of traffic incidents that block travellanes or, in extreme cases, cause road closures. Incident-related delay may range from a fewminutes for a minor vehicle crash to a long-term road or bridge closure resulting from a majorcommercial vehicle crash, such as a hazardous materials spill.
Due to its unpredictable nature, this type of delay is frequently the most disruptive and frus-trating for travelers. Recurring congestion can be factored into trip planning, but there is noway to anticipate the location or duration of incident-related delay. This is especially true forincidents that occur during peak periods on roads that already experience Recurring Capacity-Related Delay. The combination of these two delay types may have serious deleterious im-pacts on travel times, causing significant disruptions.
Location
Non-Recurring Incident-Related Delay may occur at any location in the transportation system.Depending on the severity of the incident, impacts may be felt many miles away from the loca-tion of the incident.
Impacts
Like the other types of delay, typical impacts of Non-Recurring Incident-Related Delay includeincreased travel times and fuel consumption, as well as uncertainty about when travelers andfreight will arrive at their destinations. This type of delay increases the risk of secondary inci-dents, which are incidents that occur as a direct result of the disruptions caused by a primaryincident. Secondary incidents are often more severe than the original incident because theytend to occur in congested traffic with highly variable speeds and sudden stops. In addition tocrashes, secondary incidents include engine stalls and overheating, and vehicles running out offuel. These impacts collectively decrease the efficiency, reliability, and safety of the transporta-tion system by imposing additional costs and uncertainties on system users.
Solutions
Traffic Signal Timing Adjustments – Traffic signals can be manually retimed to minimizeincident-related delay. For example, if an incident on an expressway causes traffic to divertonto a parallel arterial road, traffic signals along that arterial can be reprogrammed to fa-cilitate through traffic in order to better handle the increased volume.
Traveler Information Systems – Transportation management agencies provide informationabout incidents to travelers via resources such as 511NY, as well as through agency web-sites, press releases, and email and text message alerts. DMS are used to alert motorists ofincidents and guide traffic to alternate routes. These measures reduce public exposure topotential hazards, such as a hazardous materials spill, and limit congestion in the vicinity ofincident scenes.

14
DRAFT GTC Congestion Management Process
Reduce incident detection, verification, and notification times – ITS elements such as CCTVtraffic cameras can be deployed at strategic locations on the transportation network to pro-vide traffic operations center personnel with real-time images of road conditions. Theseimages allow operations center personnel to detect and verify incidents and notify law en-forcement and fire and rescue services.
Reduce incident clearance times – Law enforcement and fire and rescue agencies can use“Quick Clearance” techniques to speed up incident scene clearance, thus minimizing dis-ruption to traveler and freight movements. Reducing incident clearance times also reducesthe likelihood of secondary incidents.
Reduce incident occurrences – Past safety efforts have focused on protecting travelers inthe event of an incident, but in the future the emphasis will be on preventing incidentsfrom occurring. The application of Connected Vehicle (CV) technologies is expected to re-duce incident occurrences by providing new safety features and automated collision-avoidance systems.
Effective incident scene management clears wrecks and restores normal traffic flow withminimal disruption to travelers. Quick Clearance practices also reduce the risk of secondaryincidents, further improving both traveler safety and limiting the exposure of first respondersto traffic hazards.
DRAFT GTC Congestion Management Process
15
Section 3: Performance Monitoring and Measurement
The GTC CMP uses performance measures to monitor delay and associated changes over time.This section of the CMP discusses the overall benefits of using performance measures to moni-tor congestion and track the impacts of mitigation activities, the specific measures selected toidentify and monitor congested locations in the Rochester TMA, and the data required to as-sess congestion trends and the impacts of congestion management strategies.
The Federal Highway Administration CMP Guidebook identifies four major dimensions of con-gestion, including:
1. Intensity – The relative severity of congestion that impacts travel.
2. Duration – The amount of time the congested conditions persist before returning to an un-congested state.
3. Extent – The number of system users or components affected by congestion.
4. Variability – The changes in congestion that occur on different days or at different times ofday.
The performance measures selected for the GTC CMP address all these dimensions. Perform-ance measurement data provides a complete overview and allow for a thorough assessment ofcongested conditions within the Rochester TMA.
3.1: Performance Measures Overview
Performance measures allow organizations to quantitatively track and manage progress to-wards achieving goals set out in a plan, such as the LRTP 2035. Performance measurement isthe process by which organizations assess the progress made towards achieving their goals.The basic purpose of using performance measures in a CMP is to monitor a region’s progresstowards managing congestion.
Transportation agencies have moved towards the increased use of performance measures forthree main reasons. First, there is a greater demand for accountability and improved transpor-tation system performance from the general public, elected officials, and decision-makers. Sec-ondly, agencies continually search for new and better management techniques to ensure thatlimited public resources are prudently invested for maximum effect. Lastly, there is widespreadrecognition that broad changes in the environment in which transportation agencies functionrequires effective strategic planning to satisfy diverse community needs and measure successin meeting them.
As discussed in the CMP Guidebook, performance measures serve multiple purposes, including:
1. Tracking progress towards meeting regional objectives;
2. Identifying specific congested locations to address;
3. Assessing congestion mitigation strategies, programs, and projects; and
4. Communicating system performance to the public, elected officials, and decision-makers.

DRAFT GTC Congestion Management Process
16
The performance measures used by the CMP can be applied at two levels:
1. Regional Level – To measure the performance of the regional transportation system.
2. Local (Corridor, Segment, Intersection) Level – To identify congested locations and measurethe performance of individual road segments or system elements.
Differentiating between these two levels is important because regional trends may mask localcongestion problems. For example, the travel time along a major corridor may be well belowcongested levels. However, one segment of the corridor may suffer from severe congestion. Ifthe congestion on that segment is not addressed, it could eventually impact traffic on othersegments and increase delay along the entire corridor.
3.2: GTC Congestion Scale
As discussed in Section 1, a road segment with a TTI of 1.25 or greater is considered con-gested. However, there are varying degrees of congestion, ranging from congestion thatcauses barely noticeable delay to severe congestion that significantly increases delay and itsassociated costs. The following “Congestion Scale” was developed for the GTC CMP to helpvisualize the severity of recurring capacity delay.
The Congestion Scale classifies congested road segments into two main categories: Delay andExcess Delay. It further breaks down the two main categories into five sub-categories, whichprovide an additional level of detail for analysis and a fine-grained understanding of congestedlocations. Road segments experiencing Delay include those segments with minimal, minor, andmoderate congestion. Road segments experiencing Excess Delay include those segments withcongested or severely congested conditions. The meanings of each sub-category are describedbelow.
The first sub-category in the Congestion Scale, Minimal Congestion, includes road segmentswhere vehicles move steadily and safely at posted speeds without jostling for space on theroad regardless of time of day. Traffic moving under Minimal Congestion conditions is typicallyconsidered the ideal state for all road segments at all times, but is usually not realistic to ex-pect outside of off-peak hours due to demand for space on the road during peak periods. Ac-cording to the Travel Time Data Collection Program, even during peak periods there are roadsegments that experience a TTI less than 1.00.
Congestion Scale for Recurring Capacity Related Delay
Categories: Delay Excess Delay
Sub-Categories:
MinimalCongestion
MinorCongestion
ModerateCongestion
CongestionSevere
Congestion
Color Code:
Travel TimeIndex (TTI):
<1.00 1.01-1.14 1.15-1.24 1.25-1.99 2.00>

DRAFT GTC Congestion Management Process
17
Traffic with a TTI below 1.00 may be categorized as “Free-Flow” on expressways. On signal-ized arterials traffic does not always move in free-flow conditions due to delay caused by stop-pages for signal lights, pedestrian crossings, or any other event that occurs as part of normaltraffic movements.
The second sub-category, Minor Congestion, includes segments where traffic volume has risenabove Minimal Delay conditions and is just beginning to cause slight delays in travel time buthas not yet reached meaningful, or even noticeable, levels of delay. For example, on a seg-ment with a TTI of 1.05 a 20 minute trip would only take 21 minutes.
The third sub-category, Moderate Congestion, includes segments where traffic volume hasrisen above a TTI of 1.15. This will result in delay that may be noticeable but not meaningful.For example, a road segment with a TTI of 1.20 indicates that a trip taking 20 minutes underMinimal Delay conditions will take 24 minutes under Moderate Delay conditions. The primaryimportance of the Moderate Delay category is that it indicates where congestion could developif a non-recurring event like a car crash happens there. The disruption to traffic flow caused byan incident could push the TTI up above 1.25, thus creating a congested segment. While thistype of congestion is not technically recurring congestion, it does constitute the interface be-tween recurring and non-recurring congestion types.
The fourth sub-category, Congestion, includes segments where travel times have risen abovea TTI of 1.25. At this point, a trip will take about one-third longer than it would take underfree-flow conditions; a trip that normally takes 20 minutes will take 25 minutes. A commonlyconsidered national benchmark for congested road segments is a TTI of 1.30. The GTC CMPclassifies congested segments as those with a TTI of 1.25 to 1.99, which captures segmentsapproaching a TTI of 1.30. Delay on these segments is noticeable and trip times may be con-sidered inconvenient, taking time away from more productive or enjoyable activities.
The fifth sub-category, Severe Congestion, includes segments with a TTI above 2.00, where atrip takes twice as long, or more, as it does under free-flow conditions. This means that a 20minute trip will take at least 40 minutes. While there is no national standard that defines“severe congestion,” a review of FHWA guidance on congestion mitigation indicates that se-vere congestion typically occurs as the result of a confluence of two or more events, such as asevere weather event that occurs during the evening commute period. Delay is noticeable andis more than inconvenient, consuming significant extra time and fuel.
The TTI records the extent oftravel delay. Traffic moving underfree-flow conditions on express-ways is the ideal state, but istypically not realistic to expectduring periods of peak demandfor road space. In addition, anincident that occurs during free-flow conditions can cause therapid build-up of traffic queues,thus increasing delay in non-peakperiods.

DRAFT GTC Congestion Management Process
18
3.3: GTC CMP Performance Measures
As discussed above, the performance measures used by the GTC CMP to track congestion inthe Rochester TMA are derived from the LRTP 2035. The four CMP performance measures are:
1. Travel Time Index on Major Roadways
2. Transit On-Time Performance
3. Median Incident Clearance Time
4. Median Transit Load Factor
Data Sets and Sources for each Performance Measure
1. Travel Time Index - Travel Time Data Collection Program; Real Time Travel Data
As discussed previously, the Travel Time Index is the ratio of travel time during the peakperiod to the time required to make the same trip at free-flow speeds. It is calculated bydividing the peak period travel time by the free-flow travel time. A TTI value of 1.3, forexample, indicates that a 20-minute free-flow trip requires 26 minutes during the peak pe-riod.
Prior to 2008, GTC relied on data generated by its travel demand model to identify con-gested road segments. However, this program did not provide the specificity needed toidentify the extent and location of delay. As a result, in 2008 GTC implemented a traveltime data collection program that produced reports on actual travel times for principal arte-rials, select minor arterials, and collectors. The floating car method used drivers designatedby the transportation agency this program generated data sets that were used to identifycongested road segments for the CMP.
Vehicle probe data is an improved means of monitoring traffic flow due to the greatly ex-panded number of data points generated. It delivers both speed and travel-time informa-tion for advanced traffic management systems and advanced traveler information servicesapplications, as well as for supporting a myriad of other transportation management prac-tices, including monitoring the impacts of construction activities, special events, and sea-sonal changes in traffic patterns.
One of the major benefits of using vehicle probe data to is that it allows for analysis of allthree congestion typologies. In addition to identifying traffic patterns generated by routinerecurring congestion, this data allows analysts to observe the impacts of planned specialevents and incidents on traffic movements.
Vehicle probe data is generated by two primary methods: GPS data obtained from on-board GPS devices and cellular phone signals obtained from mobile devices. The steadyexpansion of GPS and mobile data services during the previous five to six years has gener-ated a vast data trove that transportation agencies, university research centers, and pri-vate data providers are continually mining and investigating for new uses and lessons.

DRAFT GTC Congestion Management Process
19
The increasing availability of probe-based data has strengthened traveler demand for accu-rate real-time traffic information, which helps them better plan and manage trips. A furtherbenefit of vehicle probe data is that it can be used to corroborate traffic data collected bysystem sensors.
In recognition of the increased availability and decreased costs of vehicle probe data, andinterested in accessing the expanded analytical capabilities offered by this data, GTC imple-mented a new travel time data collection program in 2012 to obtain vehicle probe data.This data covers all four congestion elements (Intensity, Duration, Extent, and Variability)identified in the FHWA CMP Guidebook. It is expected to provide GTC and member agen-cies with an unprecedented overview of the spatial and temporal aspects of travel delayand will be crucial for informing ongoing efforts to understand, analyze, and manage trafficcongestion in the Genesee-Finger Lakes Region.
2. Transit On-Time Performance – RTS on-time performance data
Transit On-Time performance documents the rate that buses stay on time to pick-up anddrop-off customers. While there are many factors that can contribute to delay on a busroute, recurring delays on the same route at the same time each weekday may signify traf-fic congestion that keeps buses from adhering to schedule.
On-time performance data is supplied by RGRTA for buses operating on RTS routes. Anon-time bus is defined as one that arrives at its stops no more than three minutes beforethe scheduled time and no more than six minutes afterwards. Early and late arrivals areproblematic because customers who are planning to meet a bus at a specific time are de-pendent on that bus adhering to schedule; if the bus arrives too early or late then the cus-tomer may miss the connection. In addition to congestion, other issues that impact on-time transit performance include inclement weather, a greater than anticipated number ofriders, and riders with special accessibility needs. These factors need to be considerationwhen analyzing transit on-time performance data.
All transit services in the Rochester area are provided by buses. As a result, many conges-tion management practices aimed towards improving vehicle circulation, such as traffic sig-nal coordination and intersection/interchange reconfiguration, generally benefit bus opera-tions. Still, buses have unique operational considerations that are often best met by tran-sit-specific strategies, such Computer Aided Dispatch (CAD), electronic fare collection sys-tems, and Transit Signal Priority (TSP), all of which may help reduce congestion.
3. Median Incident Clearance Time – NYSDOT and NYSTA TransAlert Notifications; NYSTAComputer Aided Dispatch (CAD) System; NYSDOT Highway Emergency Local Patrol (HELP)program; Probe-based Real-Time Traffic Data.
There are several potential sources of incident clearance times for roadways in the region.The NYS Thruway Authority collects incident clearance times through its Computer-AidedDispatch (CAD) system, which records emergency services dispatching activities. For theNYS Thruway, this system provides the most accurate incident clearance data available.
NYSDOT does not have a comparable tracking system. However, incident clearance times
DRAFT GTC Congestion Management Process
20
are available for roads served by the Highway Emergency Local Patrol (HELP) program,which records the duration of the incidents that HELP trucks respond to.
Additional sources of traffic incident information are the TransAlert notifications providedby NYSDOT and the NYS Thruway Authority. These notifications are sent out for major in-cidents on interstates, parkways, other major state highways, and the Thruway. TheTransAlert notifications are short e-mail messages distributed via the New York StateEmergency Management Office's NY-ALERT system. Recipients receive provide real-timeinformation about significant traffic incidents, including start and end times, the nature ofthe incident, its location, and additional data when available.
Clearance times cannot be calculated for all reported incidents because start and end timesare not always reported. For instance, in 2011 the NYSDOT TransAlert system identified336 major incidents in the Genesee-Finger Lakes region, but clearance times could be de-termined for only 265 of them (78.9 percent). The Thruway Authority TransAlert systemidentified 116 incidents during 2011, but clearance times could be determined for only 71of them (61.2 percent). An additional concern with TransAlert notifications is that they arelimited to major incidents and do not include minor incidents that could impact traffic.
Looking ahead, another source for traffic incident duration will be real-time travel data.While this data does not specifically measure incident clearance times, it will reveal the im-pacts of incidents on traffic movements and provide an accurate view of how incident-related congestion affects the TMA. Generated from vehicle probes and available for 24hours-per-day, 365 days-per-year, timeframes, this type of data will provide a more thor-ough understanding of traffic patterns and movements throughout the TMA.
4. Median Transit Load Factor - RTS Routes/passenger counts
The Median Transit Load Factor is the ratio of the number of passengers to the number ofseats on a bus. A ratio of 1.0 indicates that all of the seats on a bus are occupied. A ratiogreater than 1.0 indicates that there are standing passengers who cannot find seats. Theindustry standard for determining crowding on a bus using the transit load factor is 1.25 orgreater, which indicates that all the seats are full and an additional 25 percent of the pas-sengers are standing. However, in situations where many passengers make short trips,such as along a corridor with closely-spaced bus stops, a transit load factor that risesabove 1.25 does not necessarily indicate that the bus is overcrowded.
The median transit load factor is a measure of accessibility. A bus that is overcrowdedwhen it reaches a stop cannot take on additional passengers, so riders at that stop findthat they cannot access the transportation system. The median transit load factor is a use-ful measure for transit managers to use when considering adding capacity, such as an ar-ticulated bus or additional buses, to a high-demand route.
The ability of the median transit load factor to track demand for service on bus routesmakes it a viable CMP performance measure because it shows where the greatest demandfor transit services are. Expanding capacity on routes with a median transit load factor con-sistently above 1.25 may encourage additional bus ridership, increasing use of an alterna-tive mode to single-occupancy vehicles and thereby reducing congestion pressures.

21
DRAFT GTC Congestion Management Process
Section 4 - Congested Locations
This section of the CMP identifies specific locations in the Rochester TMA that experience ex-cess delay due to one or more of the three delay types discussed in Section 2. Multiple sourcesof information were used to identify congested locations. Road segments with Recurring Ca-pacity-Related Delay were identified by the Travel Time Data Collection Program (TTDCP).Planned Event-Related Delay occurs on the infrastructure elements providing access to specialevent sites and venues. Lastly, Non-Recurring Incident-Related Delay could occur anywhere onthe transportation system, but is most disruptive when it occurs on a road segment that is al-ready experiencing congestion due to recurring delay.
4.1: Recurring Capacity-Related Delay
The following tables and associated maps identify road segments that experience excess delaydue to recurring congestion. Recurring congestion occurs during the morning and eveningpeak periods and reflects routine daily fluctuations in regional travel patterns. As discussedpreviously, this program used the floating-car method to identify congested segments, but inthe future it will use real-time travel data to obtain more thorough and detailed results that willfacilitate analysis of regular seasonal changes in traffic flow in addition to routine daily fluctua-tions. Only one segment in the TMA ranked as “Severely Congested.” All other segments areclassified as “Congested” according to the CMP Congestion Scale.
Table 1: Morning Peak Period Congested Segments
Principal Arterials
Road: Direction: Segment: TTI:
I-390 SouthboundLexington Avenue (Exit 22) toScottsville Road (Exit 17)
1.33
I-490 EastboundBuffalo Road (Exit 7) to Mount ReadBoulevard (Exit 10)
1.92
I-490 WestboundI-590 split to South Goodman Street(Exit 17)
1.29
I-590 SouthboundEast Ridge Road (Exit 11) to BlossomRoad (Exit 6)
1.67
Lake Avenue SouthboundWest Ridge Road (NYS Route 104) toLyell Avenue
1.45
West Ridge Road(NYS Route 104)
Eastbound I-390 to Lake Avenue 1.33
NYS Route 204/ChiliAvenue/Brooks Avenue
Eastbound I-490 to I-390 1.37
NYS Route 204/ChiliAvenue/Brooks Avenue
Westbound I-390 to I-490 1.41
Penfield Road(NYS Route 441)
WestboundFairport Nine Mile Point Road(NYS Route 250) to I-490
1.32
Minor Arterials and Collectors
Elmwood Avenue WestboundClinton Avenue to Scottsville Road(NYS Route 383)
1.25
Monroe Avenue (NYSRoute 31)
Westbound I-490 (Exit 26) to French Road 1.28

22
DRAFT GTC Congestion Management Process
Map 2: Travel Time Index data shows the location of congested road segments in the morning peakperiod.

23
DRAFT GTC Congestion Management Process
Table 2: Evening Peak Period Congested Segments
Principal Arterials
Road Direction Segment TTI
I-390 NorthboundNYS Route 15A (Exit 14) toScottsville Road (Exit 17)
1.52
I-390 NorthboundScottsville Road (Exit 17) toLexington Avenue (Exit 22)
1.50
I-490/I-590 WestboundWest Commercial Street (Exit 24) toBlossom Road (Exit 6)
3.48*
I-590 Northbound I-390 Split to Blossom Road (Exit 6) 1.33
Lake Avenue NorthboundLyell Avenue to West Ridge Road(NYS Route 104)
1.64
West Ridge Road(NYS Route 104)
Westbound Lake Avenue to I-390 1.52
Mt. Hope Avenue(NYS Route 15)
Southbound Ford Street to Westfall Road 1.25
West Henrietta Road(NYS Route 15)
SouthboundWestfall Road to Jefferson Road(NYS Route 252)
1.28
NYS Route 204/ChiliAvenue/Brooks Avenue
Westbound I-390 to I-490 1.35
Jefferson Road(NYS Route 252)
Westbound Hylan Drive to Scottsville Road 1.25
Jefferson Road(NYS Route 252)
Westbound Winton Road to Hylan Drive 1.37
South Winton Road NorthboundJefferson Road (NYS Route 252) toI-590
1.35
South Winton Road SouthboundI-590 to Jefferson Road(NYS Route 252)
1.30
Minor Arterials and Collectors
Culver Road/Waring Road Northbound Monroe Avenue to Norton Street 1.32
Elmwood Avenue WestboundClinton Avenue to Scottsville Road(NYS Route 383)
1.33
Joseph Avenue/ SenecaAvenue
Northbound Clinton Avenue to East Ridge Road1.25
Monroe Avenue(NYS Route 31)
Westbound Elmwood Avenue to Inner Loop1.35
Monroe Avenue(NYS Route 31)
Eastbound Elmwood Avenue to French Road1.62
Monroe Avenue(NYS Route 31)
Westbound French Road to Elmwood Avenue1.25
Monroe Avenue(NYS Route 31)
Eastbound French Road to I-490 (Exit 26)1.34
Monroe Avenue(NYS Route 31)
Westbound I-490 (Exit 26) to French Road1.29
North Clinton Avenue Northbound Inner Loop to East Ridge Road 1.48
East Henrietta Road (NYSRoute 15A)
SouthboundMt. Hope Avenue to Lehigh StationRoad (NYS Route 253)
1.29

24
DRAFT GTC Congestion Management Process
Beaver Road/Ballantyne Road(NYS Route 252)
WestboundScottsville Road (NYS Route 383) toChili Avenue
1.31
Pittsford Victor Road(NYS Route 96)
EastboundI-490 (Bushnells Basin) to I-490(Victor)
1.27
Pittsford Victor Road(NYS Route 96)
WestboundI-490 (Victor) to I-490(Bushnells Basin)
1.36
Pittsford Victor Road(NYS Route 96)
EastboundI-490 (Victor) to Rochester Road(NYS Route 332)
1.29
Ridgeway Avenue EastboundLatona Road to West Ridge Road(NYS Route 104)
1.25
Winton Road Northbound I-590 to East Avenue 1.30
Winton Road SouthboundEmpire Boulevard (NYS Route 404)to East Avenue
1.28
*Currently, this segment shows the only instance of Severe Congestion as defined by the GTCCongestion Scale (see Section 3) recorded in the Rochester TMA. However, future assessmentsmay identify additional locations of recurring Severe Congestion due to anticipated improvementsin data completeness.
Table 2 Continued
RTOC personnel monitor road conditions in real-time. ITS field equipment allows them toidentify traffic back-ups and adjust traffic signal timing patterns to clear vehicle queues andreduce delay. They can also quickly detect and verify incidents, thus improving emergencyresponse and reducing incident-related delay.

25
DRAFT GTC Congestion Management Process
Map 3: Travel Time Index data shows the location of congested road segments in the evening peakperiod.

26
DRAFT GTC Congestion Management Process
4.2: Planned Event-Related Delay
Areas where planned-event delays occur include thoroughfares in the vicinity of the region’sspecial event venues. The following table identifies the key special event venues located in theGenesee-Finger Lakes Region. This table includes all venues that can accommodate more than5,000 people and/or are located in/near downtown Rochester, where the region’s greatestconcentration of venue facilities is located.
This list should not be interpreted as an exhaustive catalog of all potential locations in the TMAwhere large-scale planned events take place. For example, several regional parks host commu-nity events such as the annual Lilac Festival at Highland Park and concerts at Ontario BeachPark, which attract many attendees. Places like the Corn Hill and Park Avenue neighborhoodsin the City of Rochester and many of Monroe County’s suburban village centers host popularfestivals that draw large crowds. In addition, road races such as the Rochester Marathon andthe JP Morgan Chase Corporate Challenge may cause planned-event related delay due to roadclosures.
Delays caused by planned work road may occur anywhere on the transportation system. Oneof the primary considerations that transportation management agencies use when establishingdetour routes and setting up work zones is the minimization of travel delay.
Venue: Capacity:
Darien Lakes Performing Arts Center* 21,600
CMAC Performing Arts Center* 14,928
Frontier Field 14,500
Rochester War Memorial/Blue Cross Arena 14,000
Sahlen’s Stadium (formerly Marina Auto Stadium/PAETEC Park) 13,768
Eunice Kennedy Shriver Stadium (SUNY Brockport) 10,000
Monroe County Fair and Exposition Center (Dome Arena) 8,600
Gordon Field House (Rochester Institute of Technology) 7,000
Edwin Fauver Stadium (University of Rochester) 5,000
Growney Stadium (St. John Fisher College) 5,000
Main Street Armory 5,000
Rochester Riverside Convention Center 5,000
Eastman Theatre 3,549
Auditorium Theatre 2,464
Geva Theatre 732
*These facilities are located outside of the TMA. However, given their regional significance as en-tertainment destinations, congestion management practices implemented for venues within theTMA are also recommended for use at these facilities.
Table 3: Special Event Venues

27
DRAFT GTC Congestion Management Process
4.3: Non-Recurring Incident-Related Delay
Non-Recurring Incident-Related Delay can occur at any location on the regional transportationnetwork. Major weather events such as blizzards and ice storms may have region-wide impli-cations for travelers, while more localized events such as flooding can still disrupt travel if keyinfrastructure nodes are impacted.
Incident location and timing plays a key role in congestion. Incidents that occur late at nighton major arterials may have a negligible impact on traffic as long as they are cleared beforethe start of the morning peak period. Conversely, a major incident that occurs during the eve-ning peak period on a minor arterial in the vicinity of an expressway interchange could causetraffic to back-up onto the expressway mainline, thus increasing the risk of secondary inci-dents.
Incident-related delay may be especially problematic when it occurs in locations and at timesalready impacted by recurring delay. The combination of routine peak-period congestion andcongestion caused by an incident can generate significant travel delays. An analysis of crashlocation data obtained from New York State’s Accident Location Information System (ALIS) didnot reveal any meaningful correlation between crash locations and road segments with recur-ring congestion. However, rapid response to and quick clearance of incidents on road seg-ments with recurring congestion will help minimize disruption caused by the convergence ofrecurring capacity-related and non-recurring incident-related delay.
One benefit of reducing traffic congestion is that first responder vehicles can access andclear incident scenes faster, thus mitigating the impacts of incidents on routine trafficmovements.

28
DRAFT GTC Congestion Management Process
(This page intentionally left blank.)

DRAFT GTC Congestion Management Process
29
Section 5 - Congestion Management Recommendations
The Long Range Transportation Plan (LRTP) 2035 identified 53 recommendations that bestaddress the region’s transportation needs. These recommendations are organized into threesections: Preservation and Maintenance, System Management and Operations, and Expansion.Each recommendation is accompanied by supporting commentary that discusses its contribu-tion to the ongoing improvement of the transportation system.
The importance of congestion management is a common theme that runs throughout theLRTP 2035. While no plan recommendations are dedicated specifically to it, 25 of the recom-mendations include an element that address it. This reflects the decision to integrate conges-tion management practices into routine transportation planning, management, and operationactivities.
This section of the CMP presents recommendations excerpted from Chapter VI of the LRTP2035 that are intended to advance congestion management in the Rochester TMA. The“Supportive Actions” and “Representative Projects/Ongoing Activities” are excerpted from theRecommendation Advancement Plans (RAPs) developed to provide guidance on the implemen-tation of LRTP recommendations.
The LRTP recommendations were prioritized based on need and funding availability. Theywere then assigned one of the following implementation timeframes:
Immediate: Federal Fiscal Years (FFYs) 2011-2014 (aligns with the current TIP) Near-Term: FFYs 2015-2019 (October 1, 2014 through September 30, 2019) Medium-Term: FFYs 2020-2025 (October 1, 2019 through September 30, 2025) Long-Term: FFYs 2026-2035 (October 1, 2025 through September 30, 2034) Ongoing: FFYs 2015-2035 (all FFYs of the LRTP 2035)
This section of the CMP will be revised following the completion of future LRTP updates. Newrecommendations addressing congestion management activities that are added to the LRTPwill be included, while outdated or completed recommendations will be revised or removed.This revision process will keep the LRTP and CMP recommendations synchronized to ensurethat there is a uniform approach at both the policy and project levels to congestion manage-ment activities in the Rochester TMA.
Effective congestion managementstrategies treat the transportationsystem as an integrated whole byaddressing multiple modes, includingpassenger cars, buses, pedestriansand bicycles, and the linkagesbetween and among those modes.

DRAFT GTC Congestion Management Process
30
5.1: Preservation and Maintenance
1. Improve the function of interchanges on major roadways (i.e., Interstates and otherPrincipal Arterials) through improved design that reduces delay and improves mobility –Immediate/Near-Term
Supportive Actions: Action 1: Reconfigure major interchanges and intersections that have safety, mobility, or access
issues. Reconfiguration, which will entail the reconstruction of the interchange or intersection,could be either a stand-along project or part of a larger corridor reconstruction effort.
Action 2: Promote alternative interchange/intersection design options in member agency infra-structure projects.
Action 3: Deploy ITS elements as part of the reconstruction of interchanges and intersections.
Representative Projects/Ongoing Activities: The I-490/I-390/NYS Route 390 reconstruction project: This complex interchange on Roches-
ter’s west side will be reconfigured to improve access, safety, and mobility on NYS Route 390.This project will include adding new lanes to reduce or eliminate weaving, realigning thenorthbound NYS Route 390 off-ramp to Lyell Avenue to Lee Road, reconfiguring curves, length-ening several on- and off-ramps, and enhancing the separation of adjacent on- and off-ramps toimprove safety. This project is intended to accomplish a range of goals, including improvingsafety, operations, and infrastructure conditions; enhancing the road’s appearance; reducingenvironmental impacts; and promoting economic development opportunities in the area.
The I-390/Kendrick Road interchange project: Currently, there is no direct access to KendrickRoad to or from I-390. In the future, as the University of Rochester campus expands south-wards from the River Campus along the Kendrick Road corridor towards I-390, there will be agreater need for multi-modal access to the sites flanking Kendrick Road. As a result, NYSDOT isplanning to construct a new interchange that will link the I-390 expressway directly to KendrickRoad without requiring traffic to exit the expressway and use local streets to reach the campus.This interchange will divert some of the traffic that uses Mt. Hope Avenue, Elmwood Avenue,and Crittenden Boulevard to access the campus, thereby reducing congestion and delay onstreets around the campus and better using available lane space on the I-390 expressway.
The I-590/Winton Road interchange project: A “Diverging Diamond Interchange” (DDI) openedin October 2012 at this interchange. This design eliminates left turns from Winton Roadnorthbound onto the I-590 westbound entrance ramps, thus improving safety by removing thepossibility of crashes occurring due to vehicle conflicts at this turn. In addition, the interchangeis designed to make traffic move more smoothly through the interchange, thus reducing delay.
An aerial view of theDiverging DiamondInterchange at thejunction of I-590 andWinton Road in the Townof Brighton. Opened inOctober 2012, this is thefirst Diverging DiamondInterchange in New YorkState.

DRAFT GTC Congestion Management Process
31
2. Improve the function of intersections through improved design that increases safety,reduces delay, and improves mobility – Ongoing
Supportive Actions: Action 1: Reconfigure major interchanges and intersections that have safety, mobility, or access
issues. Reconfiguration, which will entail the reconstruction of the interchange or intersection,could be either a stand-along project or part of a larger corridor reconstruction effort.
Action 2: Promote alternative interchange/intersection design options in member agency infra-structure projects.
Action 3: Deploy ITS elements as part of the reconstruction of interchanges and intersections.
Representative Projects/Ongoing Activities: Mt. Hope Avenue/Crittenden Boulevard/East Henrietta Road Intersection: This intersection has
been improved by two projects. In 2011, under the East Henrietta Road project, the fifth leg(Fort Hill Terrace) was removed. In 2012, under the Mount Hope Avenue project, CrittendenBoulevard was shifted toward the south to align it more opposite East Henrietta Road, whichalso reduced the size of the intersection. A raised median was added on Mount Hope Avenue tocontrol access near the intersection. A gas station on the northwest corner, which had manysafety problems at its driveways, was also eliminated by the project. Southbound left turns werechanged to protected only and the east/west movements are planned to be changed from splitphased to concurrent.
Roundabouts: During the past decade, roundabouts have emerged as a popular alternative fortraditional intersection design. Roundabouts are designed to keep traffic slowly but continuouslymoving through an intersection, thus reducing traffic queuing, vehicle emissions, and vehiclespeeds. This leads to decreased travel times, improved air quality, and greater public safety.Roundabouts are readily adaptable to many different places (urban, suburban, and rural), butthey are not appropriate for all intersections.
The first roundabout on public roads in Monroe County was opened in 2005 at the intersectionof Plymouth Avenue, Ford Street, and Exchange Street in the City of Rochester. In 2006, aroundabout was constructed at the intersection of NYS Route 251 (Rush Mendon Road) andNYS Route 65 (Clover Street) in Mendon. In 2011, a roundabout at the intersection of NYSRoute 19 (North Main Street), East Avenue, and West Avenue at the northern edge of the Vil-lage of Brockport was opened. However, the most extensive use of roundabouts in the region atthis time is on NYS Route 590 in the Town of Irondequoit, where four intersections were recon-figured with roundabouts as part of a larger road reconstruction project that transformed a de-crepit expressway into an attractive boulevard leading drivers to the lake. A roundabout at thecomplex five-way intersection of Broad Street, Court Street, and Broadway in the City of Roch-ester opened in August 2012.
3. Advance Access Management recommendations contained in completed UPWP-fundedstudies as part of rehabilitation and reconstruction highway projects – Near-Term/Medium-Term
Supportive Actions: Action 1: Local governments will integrate Access Management techniques into local planning
and zoning polices and regulations. Action 2: Develop arterial corridor studies where access management solutions would reduce
recurring congestion. Potential examples include NYS Route 252 (Jefferson Road), NYS Route404 (Ridge Road), and NYS Route 31 (Monroe Avenue).

DRAFT GTC Congestion Management Process
32
Representative Projects/Ongoing Activities: Clinton Avenue and St. Paul Street Two-Way Conversion Study: The City of Rochester is cur-
rently overseeing a study that determines the feasibility of converting Clinton Avenue (currentlyone-way northbound) and St. Paul Street (currently one-way southbound) into two-way streets.Two-way traffic patterns are seen as a way to improve customer and employee access to busi-nesses as well as freight pick-up and delivery. In addition, two-way traffic is expected to beslower, which will encourage bicycle and pedestrian movements along these corridors and allowfor greater street-life.
Routes 5 & 20 and State Route 364 Multi-Modal Safety and Access Improvement Study: OntarioCounty is interested in improving the safety and accessibility of sites such as the ConstellationBrands/Marvin Sands Performing Arts Center (CMAC) and the Finger Lakes Community College(FLCC) campus and linking these facilities to area retail and residential developments. This pro-ject will involve consideration of access management techniques as a means of improving ac-cess and circulation in this area.
Circulation, Parking and Accessibility (CAP) Studies: The purpose of CAP studies is to identifypotential improvements to traffic circulation, parking, and accessibility in villages, hamlets, andcity neighborhoods. To date, GTC has completed six CAP studies for the communities of Perry(2008), Macedon (2008), Hilton (2008), Geneseo (2009), Fairport (2010), and the Brown’sSquare neighborhood in the City of Rochester (2010). CAP studies for the Villages of Websterand Scottsville were started in 2012. CAP studies are not limited to access management recom-mendations, but identified improvements to circulation, parking, safety and aesthetics typicallyinclude common access management techniques.
4. Support development that more fully considers and integrates transportation needs (e.g.,transit-supportive, cluster, etc.) by creating and providing associated information materialsfor local planning and zoning boards – Immediate/Near-Term
Supportive Actions: Action 1: Brown Bag Lunch Series. Facilitate a brown bag lunch series for local planners, De-
partment of Public Works (DPW) officials, and elected officials (hosted by local planning/DPWdepartments) to discuss not only specific issues related to transportation-land use but also vari-ous decision making options, such as how to get the most from subdivision/site plan review;how best to prepare for Planning Board meetings; what can be accomplished with SEQR; modelcodes and review processes. Canvass municipal and county planners for exact topics of discus-sion. Produce slide presentations, handouts, and meeting materials, as necessary.
Representative Project/Ongoing Activities: College Town on Mt. Hope: The University of Rochester is spearheading the redevelopment of a
14-acre site bounded by Mt. Hope Avenue on the east, Elmwood Avenue on the north, Critten-den Boulevard on the south, and the Strong Hospital complex on the west. Redevelopment willinclude the demolition of all existing structures on the site and the construction of a new, mixeduse development with retail, office, residential and hotel space in five new multi-story struc-tures. Redevelopment also includes a new 1,525 space parking structure, 464 surface parkingspaces, 149 underground parking spaces, and construction of a new east-west street connect-ing East Drive and Mount Hope Avenue. The City of Rochester is supporting the project by re-building the section of Mt. Hope Avenue by the project into a pedestrian and transit-supportiveboulevard.

DRAFT GTC Congestion Management Process
33
5.2: System Management and Operations
5. Upgrade regional communications infrastructure for greater integration of transportationagency operations – Ongoing
Supportive Actions: Action 1: Identify locations where upgrades of existing communications infrastructure are
needed. In jointly managed corridors, member agencies will collaborate to generate the mostReturn-on-Investment (ROI) on infrastructure projects.
Action 2: Identify new communications capabilities that operators are interested in developing.
Representative Project/Ongoing Activities: ITS Phase III CCTV Deployment Project: This project will focus on expanding the conduit sys-
tem and upgrading coaxial cable to fiber optics, as well as the addition of new CCTV camerasthat were previously identified but not installed as part of the Phase I and II projects.
Communications Conduit Replacement Phase III Project: Phases I, II, and III of the Communi-cations Conduit for Monroe County Facilities project resulted in the installation of new county-owned conduit in locations where the county’s conduit lease agreements with RG&E expired.The conduit network used by MCDOT includes conduit owned by the State, County, City, andRG&E. However, given increases in RG&E lease rates, it became more cost-effective for thecounty to install its own conduit for its fiber optic lines rather than continuing to lease conduitspace from RG&E. The new conduit maintains the integrity of the regional communications sys-tem and provide greater control and flexibility to transportation system operators.
System Fiber Conversion Project: MCDOT is replacing coaxial cable with fiber optic lines. Fiberoptics lines are an improvement over coaxial cable because they can transmit greater quantitiesof data. As of January 2013, 82% (346 of 423) of signaled intersections have been convertedfrom coaxial cable to fiber optic lines. This conversion is planned to be completed by 2015.
6. Deploy ITS instrumentation along and in First Priority Critical Operations Corridors andAreas as identified in the ITS Strategic Plan for Greater Rochester – Near-Term/Medium-Term
Supportive Actions: Action 1: Transportation management agencies will use the ITS Strategic Plan as a guide to the
deployment of ITS instrumentation in the region. Member agencies will hold an annual discus-sion (potentially as part of the regular TMC meeting schedule) to review implementation pro-gress and the ITS Strategic Plan.
Representative Projects/Ongoing Activities: NYS Route 390 ITS Deployment: NYSDOT is currently installing ITS elements, including traffic
cameras and DMS, along NYS Route 390 between NYS Route 104 and the Lake Ontario StateParkway. This deployment project will “fill in” the gap along this section of the region’s express-way network. NYS Route 390 is located in a First Priority Critical Operations Corridor as definedin the ITS Strategic Plan.
NYS Route 104/NYS Route 590 Deployment: NYSDOT is currently designing the ITS instrumen-tation that will be deployed along NYS Routes 104 and 590. These elements will help fill in thegaps in ITS coverage on expressways on the City’s north and east sides. These routes are in-cluded in the First Priority Critical Operations Corridor as defined in the ITS Strategic Plan.

DRAFT GTC Congestion Management Process
34
7. Deploy ITS instrumentation along and in Second Priority Corridors and Areas of RegionalOperations Significance as identified in the ITS Strategic Plan for Greater Rochester – Me-dium-Term/Long-Term
Supportive Actions/Ongoing Activities: Action 1: Transportation management agencies will use the ITS Strategic Plan as a guide to the
deployment of ITS instrumentation in the region. Member agencies will hold an annual discus-sion (potentially as part of the regular TMC meeting schedule) to review implementation pro-gress and the ITS Strategic Plan.
Representative Project/Ongoing Activities: The Diversion Route Planning Initiative: This project will identify the most suitable diversion
routes for Principal Arterials in the Genesee-Finger Lakes Region in order to minimize disrup-tions to and improve safety for the traveling public when isolated events result in temporaryroad or bridge closures. Based on the results of this study, recommendations on the deploymentof ITS instruments along designated diversion routes may be made.
8. Replace ITS instrumentation when necessary with next generation technologies along andin Critical Operations Corridors and Areas and Corridors and Areas of Regional OperationsSignificance as identified in the ITS Strategic Plan for Greater Rochester – Long-Term
Supportive Actions: Action 1: Identify next generation ITS technologies for deployment in the region. Examples of
next generation ITS technologies include the increasing use of cloud computing in ITS and vehi-cle operations, ongoing migration to mobile, user-based data and information systems, tailoredto the unique requirements of each individual user, and connected vehicle (CV) technology.
Action 2: Transportation management agencies will deploy next generation ITS technologieswhen replacing damaged and worn-out ITS instruments. This is considered a long-term action;however, member agencies should remain up-to-date on next generation ITS advances and de-velopments so that they can address next generation deployments as opportunities arise.
ITS instrumentation such as this overhead Dynamic Message Sign provides real-time trafficalerts to motorists, helping them make informed travel decisions. Information broadcast on DMScan direct motorists away from congested locations, thus reducing the build-up of traffic queuesand the likelihood of secondary incidents.
DRAFT GTC Congestion Management Process
35
Representative Projects/Ongoing Activities: Current ITS deployment projects in the Greater Rochester area are aimed at filling in the gaps
where no ITS instruments are located. Traffic Signal System expansion, CCCTV cameras, Dy-namic Message Signs, Road Weather Information System stations, and other elements will beadded to the regional transportation network over the next several years. However, these ele-ments are largely enhanced versions of the first ITS elements deployed in the region and arenot a fundamental departure in terms of capabilities from those initial ITS deployments. Lookingahead, as more advanced capabilities become available, NYSDOT and MCDOT will consider de-ploying these technologies on the regional road network. The single most important improve-ment expected over the next several years is the increasing linkage between the sources ofdata; i.e. traffic signals and their associated detection systems, traffic cameras and RWIS sta-tions, and the consumers of data, i.e. transportation system users who can access the data inreal time.
9. Develop integrated/coordinated interchange and arterial signal timing systems and plans –Ongoing
Supportive Actions: Action 1: Periodically update existing traffic signal timing plans to reflect changes in the trans-
portation system. Changes that would warrant signal timing plan updates include new develop-ments that increase/decrease/change traffic flow, reconfigured interchanges/intersections,large-scale access management projects that change traffic patterns, and new traffic signals.New signals may necessitate implementing timing plan updates for nearby signals because thenew signals could cause significant timing changes at existing ones.
Action 2: Identify corridors, interchanges, and intersections where signal timing plans areneeded to improve safety and efficiency. Expand the use of actuated signals and/or increase theuse of signal coordination where appropriate.
Action 3: Utilize the GTC Travel Demand Model to help forecast future signal retiming needs. Action 4: NYSDOT and MCDOT will develop emergency signal timing plans for critical inter-
changes and corridors that can be implemented in the event of a major incident. These planscould be incorporated into emergency response drills.
Representative Projects/Ongoing Activities: Traffic Signal Retiming: NYSDOT and MCDOT operate the majority of traffic signals in the Roch-
ester TMA. These two agencies are continually monitoring and adjusting signal timing based onobserved real-time conditions as well as planned events.
10. Monitor advances in and, as appropriate, implement IntelliDriveSM to provide networkedwireless communications between vehicles, infrastructure, and personal communicationsdevices – Medium-Term/Long-Term
Supportive Actions: Action 1: Identify potential Connected Vehicle (CV)/IntelliDriveSM deployments for the region
and program into policy, planning, and funding documents where appropriate. Action 2: In conjunction with the ITS Strategic Plan recommendations, deploy CV-supportive
ITS elements in the region.
Representative Project/Ongoing Activities: There are no current or planned IntelliDriveSM/Connected Vehicle (CV) deployments in the Roch-
ester TMA. However, GTC continuously monitors new advancements in this field to identify po-tential applications of these technologies in the area and to ensure that regional ITS operationshas the ability to support future CV operations.
DRAFT GTC Congestion Management Process
36
11. Install AVL and weather information instrumentation on public fleets to maximize vehiclerouting and serve as floating, real-time data sensors – Immediate/Near-Term
Supportive Actions: Action 1: Deploy AVL technology on City of Rochester fleet vehicles, beginning with snow and
ice control and waste management vehicles. Action 2: Develop AVL deployment studies for municipal fleets. These studies would describe
the reasons why fleet managers are interested in AVL, the intended uses of data generated byAVL and the parameters of AVL deployment. These considerations may vary from one fleet tothe next. The studies should highlight ways in which AVL can address a broad range of munici-pal fleet management concerns.
Action 3: Develop a real-time information portal* to allow the public to access City of Rochesterfleet vehicle data; later expand region-wide to include NYSDOT, NYSTA, and County fleet vehi-cles. *This portal can be modeled on modeled on the City of Ann Arbor’s online snowplow AVLtracking system.
Action 4: Continue the integration of regional travel information with the 511NY website by link-ing the fleet vehicle data available in the web-portal developed in Action Item #3 to 511NY.
Representative Project/Ongoing Activities: DES AVL/Weather Sensor ITS Project: In 2011 the City of Rochester implemented a project to
improve the efficiency of its DES fleet dispatching process. DES fleet vehicles, including snowplows and dump trucks, will be equipped with automatic vehicle locator (AVL) sensors that willenable more efficient dispatching services, thus reducing fleet VMT and fuel consumption.
AVL enables better management of public works vehicles, optimized routing, and improved salt-ing and snow plowing of streets, which facilitates improved traffic flow during winter conditions.It improves safety and security for vehicle operators and generates real-time travel informationfor the general public. Awareness of these conditions may encourage drivers to use alternateroutes, thus reducing delay and crashes and associated traffic congestion. Currently, NYSDOTuses AVL on traffic signal maintenance vehicles, but has not equipped other vehicles with thistechnology. NYSTA-Buffalo Division does not use AVL on its maintenance vehicles, but its Au-thorized Towing Garages have trucks equipped with it.
12. Install relevant pedestrian ITS instrumentation at identified intersections and crossings toreduce vehicle/pedestrian crashes – Ongoing
Supportive Actions: Action 1: Implement Safe Routes to School Programs. Action 2: Implement the Monroe County Audible/Tactile Pedestrian Signal Device Study. Action 3: Implement the Countdown Pedestrian Program.
Representative Projects/Ongoing Activities: Safe Routes To School (SRTS) Programs: SRTS programs promote deliberate efforts to increase
and encourage children to walk and bicycle to school by improving safety to and from schools. The Monroe County Audible/Tactile Pedestrian Signal Device Study: This study sets out a proc-
ess to prioritize the installation of accessible pedestrian signal devices at county-managed inter-sections. This study developed the methodology now used by Monroe County to prioritize theinstallation of accessible pedestrian signals.
The Countdown Pedestrian Program: Monroe County and NYSDOT will be upgrading pedestriansignal indications to the countdown type over the next several years. This is anticipated to im-prove pedestrian safety.

DRAFT GTC Congestion Management Process
37
13. Continue the implementation of and expand Technology Initiatives Driving Excellence(TIDE) for RTS – Ongoing
Supportive Actions: Action 1: RGRTA will continue deploy Advanced Public Transit System (APTS) elements via the
TIDE program in order to improve the efficiency and safety of transit operations. Action 2: Expand the accessibility of transit information by developing new information sources,
such as expanding the information available on 511NY and through mobile apps. Action 3: Complete the deployment of APTS elements on the Livingston Area Transportation
Service (LATS) and use the experiences of this service as a guide to future APTS deployments inrural transit service areas.
Representative Projects/Ongoing Activities: TIDE Program: In 2007 RGRTA began implementing the TIDE program. TIDE is intended to im-
prove the management and operation of the RTS fleet through a broad range of technical appli-cations. Applications include improved vehicle maintenance via a sensor system that detectspotential mechanical problems and alerts operators before a problem occurs; Automatic VehicleLocation (AVL), which allows dispatchers to track vehicles as they move through their routes;automatic stop announcements, which provide a verbal notification to riders when a busreaches a stop; electronic fare collection, which speeds the collection process and more effi-ciently collects/records payments; and improved traveler information, which includes the de-ployment of electronic signs at key bus stops that provide real-time information on when thenext bus will arrive, and e-mail and text-message service alerts.
LATS APTS Project: The LATS Advanced Traveler Information System (ATIS) went live on Au-gust 16, 2012. This system includes five ATIS signs displaying real-time updates on bus arrivals;four signs are on the SUNY Geneseo campus and one sign is located at the Geneseo Wegmans.The system includes text message capabilities for customers. In addition to the signs, all LATSvehicles will be equipped with automatic vehicle location (AVL) technology. The LATS ATIS sys-tem is fully monitored from the RGRTA main campus, which will mean better efficiency in op-erations mainly during off hours. LATS is RGRTA’s second largest subsidiary when measured by
ridership.
The TIDE program aims toimprove customer servicethrough more efficientmaintenance and operation ofthe RTS bus fleet. Improvingtransit services attractsdiscretionary riders, thusreducing the number ofvehicles on the road and, inturn, reducing congestion.

DRAFT GTC Congestion Management Process
38
14. Develop Integrated Corridor Management (ICM)-based Regional Concepts of Transporta-tion Operations (RCTOs) to improve interagency collaboration and coordination – Immediate/Near-Term
Supportive Actions: Action 1: Develop a Greater Rochester Regional Concept of Transportation Operations (RCTO).
The RCTO will consist of a high-level “umbrella” Memorandum-of-Understanding (MOU) signedby participating agencies along with supporting technical memoranda.
Action 2: Develop targeted RCTO Modules. Each module will address a specific topic of concernidentified during the RCTO development phases, such as after-hours staffing of the RTOC orroad construction updates provided to RTS.
Action 3: Member agencies will continue to hold regular bi-monthly TMC Meetings. Using theresults of the 2011 TMC Assessment Survey as a starting-point, periodically reassess the TMC toidentify potential operational improvements.
Representative Projects/Ongoing Activities: Greater Rochester RCTO: The RCTO will include several elements, including an inventory of cur-
rent conditions, identification and discussion of the operations areas, identification of communi-cations gaps, and an action plan for implementing the RCTO. Most importantly, the RCTO willresult in a mutually-agreed upon memorandum-of-understanding (MOU) that will provide guid-ance to agencies seeking to implement program-specific interagency agreements.
15. Execute the interagency agreements necessary to implement protocols contained in theICM-based RCTOs – Near-Term/Medium Term
Supportive Actions: Action 1: Develop a Greater Rochester Regional Concept of Transportation Operations (RCTO).
The RCTO will consist of a high-level “umbrella” Memorandum-of-Understanding (MOU) signedby participating agencies along with supporting technical memoranda.
Action 2: Develop targeted RCTO Modules. Each module will address a specific topic of concernidentified during the RCTO development phases, such as after-hours staffing of the RTOC orroad construction updates provided to RTS.
Action 3: Member agencies will continue to hold regular bi-monthly TMC Meetings. Using theresults of the 2011 TMC Assessment Survey as a starting-point, periodically reassess the TMC toidentify potential operational improvements.
Representative Projects/Ongoing Activities: As part of the RCTO development process, a series of interagency agreements were identified
for participating agencies to implement. These agreements are expected to improve the qualityof interagency coordination and communications. They will address topics such as joint commu-nications infrastructure management; CCTV traffic camera feed management, road closure noti-fications, and joint operations at the Regional Traffic Operations Center.
16. Continue federal funding for Regional Traffic Operations Center (RTOC) staffing, includingcontinued 24-hour operations and cross-training of NYSDOT and Monroe County staff –Ongoing (Near-Term for cross-training)
Supportive Actions: Action 1: Formally created a set-aside of federal funding for Regional Traffic Operations Center
(RTOC) staffing, including continued 24-hour operations and cross-training of NYSDOT andMonroe County staff.

DRAFT GTC Congestion Management Process
39
Representative Projects/Ongoing Activities: The Transportation Improvement Program includes annual funding that supports the NYSDOT
RTOC staff and operations, Monroe County RTOC staff and operations, and NYSDOT contractsfor supplemental staffing to support overnight RTOC operations.
17. Continue federal funding for the NYSDOT Highway Emergency Local Patrol (HELP)Program to decrease delay and increase safety on major highways by providingemergency roadside service to disabled vehicles – Ongoing
Supportive Actions: Action 1: Continue federal funding for the Highway Emergency Local Patrol (HELP) Program.
Representative Projects/Ongoing Activities: Currently, NYSDOT’s HELP trucks patrol three sections, or “beats,” along the TMA expressway
network. These trucks provide basic assistance to disabled vehicles, addressing congestion byfacilitating quick clearance and reducing the likelihood of secondary incidents. The Transporta-tion Improvement Program includes annual funding that supports this program.
18. Continuously identify ways to increase and improve real-time travel information – Ongoing
Supportive Actions: Action 1: NYSDOT will display travel times on ground-mounted Dynamic Message Signs (DMS). Action 2: Regional transportation management agencies will continue to expand the type and
quantity of traveler information available on the 511NY website, such as road conditions, traveltimes, traffic camera feeds, links to parking guidance systems, and other agency websites thatprovide information on topics such as weather conditions, public transit, tolls, and road clo-sures/incidents.
A NYSDOT HELP Truck on scene. HELP trucks provide a range of valuable services, whichmitigate congestion through rapid incident response and clearance.

DRAFT GTC Congestion Management Process
40
Action 3: Member agencies will identify potential smart-phone applications (apps) that can bedeveloped to provide increased traveler information to system users. Potential apps would infor-mation on traffic congestion and incidents, travel times, public transit, parking, tolls.
Representative Projects/Ongoing Activities: Post Real-time Travel Data on Agency Websites: Several regional agencies including MCDOT
and NYSTA provide real-time traveler information on their agency websites. Travel informationavailable on the NYSTA website includes traffic camera images, scheduled lane closure alerts,traffic incident email alerts, HAR broadcasts, and information on what motorists should do in theevent of an incident. An interactive mapping system allows travelers to obtain up-to-date travelinformation for the sections of the Thruway they will be driving on. MCDOT provides traffic cam-era images on its website, as well as an interactive map showing the location of reported trafficincidents. Travelers can access these websites before and during travel to plan a trip or modifya trip to better respond to current conditions.
Post Real-time Travel Data on third-party websites: NYSDOT and MCDOT provide traffic camerafeeds to TrafficLand, a company that aggregates and delivers live traffic video over the Internet(TrafficLand.com) and on TV. TrafficLand aggregates thousands of CCTV video feeds from mul-tiple DOT traffic camera networks. TrafficLand services currently include thousands of camerasfrom dozens of cities worldwide. Developed as a public-private partnership, TrafficLand workswith local, state and federal government agencies and commercial enterprises to leverage exist-ing video camera networks and repurpose these resources to maximize the benefits delivered topartner agencies and the traveling public.
Display Travel Times on DMS: NYSDOT is currently working on a pilot program to display real-time travel times on DMS across the region. This will update motorists on the expected amountof time it will take them to reach their destination. This service will assist motorists in determin-ing how long it will take them to complete a trip or with choosing an alternate route if theiroriginal route will take longer due to a work zone, incident scene, etc. Travel times for the pilotprogram will be calculated manually and will be displayed on a limited number of signs. Thesuccess of this pilot program will determine whether or not it is expanded into other corridors.
19. Initiate the Greater Rochester Regional Commuter Choice Program to consolidateinformation on and allow comparative assessment of transportation options – Immediate
Supportive Actions: Action 1: Implement the roceasyride.org website. Action 2: Grow the user base at roceasyride.org to improve its usefulness to participants. Action 3: Continually improve the site to maintain its long-term viability and relevance to the
community.
Representative Projects/Ongoing Activities: Roceasyride: The website http://www.roceasyride.org was officially launched at a press event
held on April 6, 2012. An Administrative Manual for Employers and Organizations that wish touse the site has been developed and distributed on request to interested parties. Promotionalmaterials have been developed and distributed to Monroe County, the City of Rochester, mem-bers of the Rochester Business Alliance, and others. Promotional materials and the Administra-tive Manual are available for download on the site, which also includes links to the online ver-sion of the 2009 Edition of the Greater Rochester Area Bicycling Map, current Google Trafficconditions for the Greater Rochester Area, the New York 511 Travel Planning site, and otherresources. As of May 4, 2012, the site has 132 registered users.

DRAFT GTC Congestion Management Process
41
20. Continuously upgrade the 511NY Program to expand information on statewide travelconditions and options – Ongoing
Supportive Actions: Action 1: Regional transportation management agencies will continue to expand the type and
quantity of travel information available on the 511NY website, such as travel times, traffic cam-era feeds, links to parking guidance systems, and other agency websites that provide informa-tion on topics such as weather conditions, public transit, tolls, and road closures/incidents.
Action 2: Member agencies will identify potential smart-phone applications (apps) that can bedeveloped to provide increased traveler information to system users. Potential apps would infor-mation on traffic congestion and incidents, travel times, public transit, parking, tolls.
Representative Projects/Ongoing Activities: Integrate Resources into 511NY: 511NY provides a central “clearinghouse” of information for
travelers in New York State. Travelers can access traffic cameras to check road conditions, plana trip using local transit services, arrange for carpools, and obtain specific information aboutvarious aspects of the state’s transportation system, such as what a bridge toll is or where abike path leads. Recently, feeds from MCDOT’s traffic cameras were linked to 511NY and cannow be seen on the 511NY website. This website is expected to offer greater resources to trav-elers in the future, especially with regards to planning multi-modal trips, as more agencies anddata sources are linked into it.
21. Integrate the Greater Rochester Regional Commuter Choice Program with the 511NYProgram – Near-Term/Medium-Term
Supportive Actions: Action 1: Work with 511NY site administrators to request relevant links be provided from that
site to the Commuter Choice site. Action 2: Monitor the links between www.roceasyride.org and the 511NY site for functionality
and opportunities for improvement.
Representative Projects/Ongoing Activities: Roceasyride: The Greater Rochester Commuter Choice Program website http://
www.roceasyride.org was launched on April 6, 2012. At this time, the Roceasyride website in-cludes limited integration with the 511NY Program; it is used to provide access to the TransitTrip Planning provided by the 511NY Program. Staff continues to monitor the 511NY systemwith respect to transit trip planning and the status of statewide ridesharing.
22. Improve or install (as appropriate) wayfinding signage in business, cultural, and otherunique districts as well as interregional travel facilities – Near-term/Mid-Term
Supportive Actions: Action 1: Convene a wayfinding summit/roundtable of economic development and tourism enti-
ties (GRVA, RBA, Finger Lakes region chambers of commerce, Finger Lakes Tourism Alliance,county transportation officials, etc.) to gauge need for regional wayfinding system or regionalcoordination of wayfinding.
Action 2: Inventory and assessment of existing signage. Action 3: Advocate for a New York State initiative similar to Pennsylvania’s Regional Wayfinding
Signing Program.

DRAFT GTC Congestion Management Process
42
Representative Projects/Ongoing Activities: Center City Pedestrian Circulation and Wayfinding Study: In 2012 the City of Rochester devel-
oped a wayfinding study to improve the visitor wayfinding experience within Rochester’s CenterCity. The plan identifies ways to enhance and connect existing pedestrian wayfinding devicesand systems. The plan recommendations will link various existing sign systems, build upon thenewly installed vehicular wayfinding system directing motorists to key destinations, and create aseamless and unified travel experience throughout downtown Rochester.
Clinton Avenue and St. Paul Street Two-Way Conversion Study: See Recommendation 3 onpage 32 for a full description of this project. One benefit of this study is expected to improvewayfinding in downtown Rochester, a key business and cultural district in the TMA.
Genesee Riverway Trail Wayfinding System: The Genesee Riverway Trail is an off-road trail forwalking, running and bicycling along the Genesee River. It extends from the Erie Canal norththrough downtown Rochester to Lake Ontario, linking scenic, historic, and cultural sites, andconnects to both the Erie Canal Heritage Trail and the Genesee Valley Greenway. The trail ismarked by a system of wayfinding and interpretive signs featuring a unique design that“brands” the trail and facilitates effective navigation.
Wayfinding signs, such as those along the Genesee Riverway Trail that runs through downtownRochester, help travelers navigate unfamiliar routes and locate destinations. Trails can be usedas commuter routes for alternate modes of transportation, such as pedestrians and bicyclists.

DRAFT GTC Congestion Management Process
43
5.3: Expansion
23. Design and implement a mobility management program that coordinates existing andfuture services of public, not-for-profit, and private transportation providers.
Supportive Actions: Action 1: Develop a Business Plan for a Regional Mobility Management Program (RMMP). Action 2: Implement the RMMP based on outcomes of Action #1.
Representative Projects/Ongoing Activities: Coordinated Public Transportation/Human Services Transportation Plan for the Genesee-Finger
Lakes Region Update (Coordinated Plan): This plan was approved by the GTC Board on June 16,2011, and includes the development of a mobility management program for the region as a keyrecommendation. Currently, several counties in the region offer limited mobility managementservices. These existing services, however, lack the resources needed to provide a coordinated,comprehensive family of transportation options spanning jurisdictional and organizationalboundaries. In addition to the Coordinated Plan, a number of strategic plans for public transpor-tation have been developed for the counties in the region as part of the UPWP. Many of theseplans include recommendations relevant to the coordination of public and human services trans-portation and cross-boundary issues.
24. Increase the frequency of fixed-route public transportation services in the Regional UrbanCore, Sub-Regional Urban Cores, Mature Suburbs, Employment Centers, Medical/Health,Higher Education, and Airport places – Near-Term/Medium-Term
Supportive Actions: Action 1: Develop a Feasibility Assessment and Implementation of Suburban and Neighborhood
Shuttles. Action 2: Develop a Feasibility Assessment and Implementation of College Circulators. Action 3: Continue to support improved coordination between land use and public
transportation.
Representative Projects/Ongoing Activities: RTS Bus Route Planning: RTS conducts ongoing assessments of its bus routes and schedules to
improve efficiency and provide the most cost-effective service by analyzing trip-level and stop-level ridership and fare data on fixed route services.
RGRTA studies: RGRTA has prepared Transit-Supportive Development Guidelines, a SuburbanTransit Station Study, and a Transit Signal Prioritization Study utilizing UPWP funds. All of thesestudies support this recommendation. Driving Forward, RGRTA Agenda 2012-2015, states thatone of the Authority’s three priority strategies going forward will include the assessment of thefeasibility of, and the implementation of, a college circulator and neighborhood shuttles.
Ontario County Area Transportation System (CATS) Fixed Route Evaluation (February 2010):This study includes findings and strategies in support of this recommendation.
25. Construct satellite transit stations in the City of Rochester and assess their feasibility inMature and Recent/Emerging Suburbs – Near-Term/Medium-Term
Supportive Actions: Action 1: Continue to Support Planning and Investment Decision Making that Encourages and
Advances Transit Supportive Development.

DRAFT GTC Congestion Management Process
44
Representative Projects/Ongoing Activities: The Suburban Transit Station Study: This study was prepared to assess the performance and
effectiveness of the current RTS park-and-ride route structure and further refine and define thesuburban transfer center concept. This study was completed through the market analysis ofpotential sites and determined that in the short term the development of Suburban Transit Sta-tions in the region is unlikely to be financially sustainable. As noted above, however, RGRTA isactively participating in the transit aspects of the College Town development. College Town isenvisioned as a community oriented, mixed-use development containing retail, residential, of-fice, and recreational uses with structured parking and a transit station to serve both the futurecustomers and residents of College Town and the thousands of people who now travel to thissecond most active destination of the RTS system for employment and health services on adaily basis.
CityGate: Located at Monroe County’s former Iola Campus, this development is envisioned as amajor activity center and trip generator with high-density urban characteristics, to define a pro-ject scope for the transit element of the project and identify a mechanism that will enable NewYork State grant funds to be invested in the project for the benefit of public transit.

DRAFT GTC Congestion Management Process
45
Section 6 — Congestion Management Strategies Toolbox
Earlier sections of the CMP identified the locations and causes of traffic congestion. Federalregulations require a CMP to consider congestion management strategies that manage de-mand, reduce single occupant vehicle travel, and improve transportation system managementand operations. These alternatives provide cost-effective strategies to traditional capacity ex-pansion projects, which may only be considered in conjunction with associated strategies tomanage future demand and improve operations.
The following list of congestion management strategies is a broad overview of all potentialcongestion management strategies that could be applied. However, not all strategies listedhere are recommended for use in the Rochester TMA. The effectiveness of congestion strate-gies depends on how well they are tailored to specific conditions and locations. The techniquesdiscussed below differ dramatically in scale, scope, and purpose; however, they can all beused to mitigate congestion. The strategies are categorized as either supply-driven or demand-driven; then further broken-down by facility type.
Congestion Management Strategies
Supply-Driven
1. Urban Freeways – Design1.A. Provide Additional Lanes without Widening Freeways1.B. Provide Additional Lanes by Widening Freeways1.C. Geometric Design Improvements (Freeways)1.D. Eliminate Bottlenecks1.E. Provide High Occupancy Vehicle (HOV) Lanes
2. Urban Freeways – Operations2.A. Incident Management2.B. Highway Information Systems2.C. Ramp Metering2.D. Highway Pricing Strategies2.E. Work Zone Management
3. Arterials and Local Streets – Design3.A. Intersection/Interchange Improvements3.B. Expand Arterial and Local Roads3.C. Geometric Design Improvements (Arterials and Local Roads)3.D. Arterial Access Management3.E. Reversible Traffic Lanes3.F. Traffic Calming and Street Space Management3.G. One-Way Conversion3.H. Two-Way Conversion3.I. Superstreet Arterials

DRAFT GTC Congestion Management Process
46
4. Arterials and Local Streets – Operations4.A. Traffic Signal Coordination4.B. Improved Traffic Control Devices4.C. Parking Supply Management4.D. Arterial Monitoring and Management4.E. Enforcement4.F. Turn Prohibitions4.G. Bicycle and Pedestrian Networks4.H. Freight Movement Management4.I. Truck Restrictions4.J. Construction Site Access
5. Public Transportation Services5.A. System/Service Operational Improvements – Fixed Route and Express Buses5.B. Fare Structures5.C. System/Service Expansion: Rail/Fixed Guideway Transit Facilities5.D. Joint Development5.E. System/Service Operational Improvements – Paratransit Services5.F. Transit-Oriented Development (TOD)5.G. Transit Signal Priority (TSP)5.H. Park and Ride Facilities
Demand-Driven – Transportation Demand Management (TDM)
6. Site-Specific and Area-Wide Strategies6.A. Alternative Modes of Transport6.B. Alternative Travel Hours6.C. Negotiated Demand Management Agreements6.D. Complementary TDM Support Measures6.E. Alternative Workplace Locations6.F. Traveler Information Systems6.G. Growth Management6.H. Transit Supportive Design Guidelines6.I. Parking Demand Management6.J. Trip Reduction Ordinances6.K Congestion Pricing6.L Auto-Restricted Zones

DRAFT GTC Congestion Management Process
47
Supply-Driven Strategies
1. Urban Freeways – Design
1.A. Provide Additional Lanes without Widening Freeways
Definition: Increase capacity on existing infrastructure by restriping, using shoulders dur-ing peak hours (left shoulder preferred), and reducing lane widths where possible.
Congestion Mitigation Impacts: Increased capacity; improved mobility.
1.B. Provide Additional Lanes by Widening Freeways
Definition: Increase freeway capacity by building new traffic lanes. New lanes may rangefrom minor additions, such as an auxiliary lane to better handle merging and divergingmovements, to large-scale construction that adds many miles of new travel lanes.
Congestion Mitigation Impacts: Increased capacity; long-term congestion anddemand increase.
1.C. Geometric Design Improvements (Freeways)
Definition: Adjustments to the number and arrangement of travel lanes at intersectionsor on limited segments of a roadway. Interchange improvements may include restriping,channelization, modifying intersection angles, and improving corner radii. Segment im-provement may include expressway auxiliary lanes, passing lanes, truck climbing lanes,widened shoulders, and reversible lanes.
Congestion Mitigation Impacts: Improved mobility; increased safety.
1.D. Eliminate Bottlenecks
Definition: Reconfigure bottleneck sites, such as intersections and interchanges with hightraffic volume, to improve traffic flow.
Congestion Mitigation Impacts: Improved mobility; increased safety; decreased emis-sions, potential creation of new bottlenecks at other sites.
1.E. Provide High-Occupancy Vehicle (HOV) Lanes
Definition: HOV lanes are exclusive lanes for high-occupancy vehicles (buses, vanpools,or carpools). HOV lanes increase average vehicle occupancy and person throughput whilereducing congestion and emissions. HOV lanes may be separate travel lanes with specialmarkings to designate their status or reversible lanes where traffic direction changes de-pending on conditions; i.e., traffic flows into a city during the morning peak period andaway from the city during the evening peak period.
Congestion Mitigation Impacts: Increased people-moving capacity on highways; de-creased emissions; decreased travel times; increased transit reliability.

DRAFT GTC Congestion Management Process
48
2. Urban Freeways – Operations
2.A. Incident Management
Definition: Incident management involves the coordination of three stages: detection/verification; response/clearance; recovery/information. The aim of incident managementshould be to quickly and efficiently clear incident scenes without endangering first re-sponders or the traveling public. This returns the roadway to normal operations soonerand reduces the likelihood of secondary incidents. Many incidents are vehicle disable-ments that can be quickly cleared.
Congestion Mitigation Impacts: Reduced incident-related delay; fewer secondary inci-dents.
2.B. Highway Information Systems
Definition: Communicate dynamic information regarding existing traffic conditions to trav-elers en-route on the transportation system. These capabilities include technologies suchas Dynamic/Variable Message Signs (DMS/VMS), Highway Advisory Radio (HAR), and in-vehicle/handheld systems such as Geographic Positioning Systems (GPS) and personaltravel assistants.
Congestion Mitigation Impacts: Reduced speeds of vehicles nearing queues (fewer secon-dary crashes); diversion to alternate routes/modes.
2.C. Ramp Metering
Definition: Ramp meters are modified traffic signals placed at the end of highway en-trance ramps. This controls the flow of vehicles onto highways by breaking up platoons ofvehicles attempting to enter the highway, thus streamlining the merge process. Delaysmay be incurred for ramp traffic, but mainline capacities are protected and overall opera-tional efficiency is improved.
Congestion Mitigation Impacts: Increased freeway capacity; reduced short freeway trips;increased volume/capacity ratio on highways; decreased crash rate.
2.D. Highway Pricing Strategies
Definition: Levy fees for driving during peak travel times or under congested conditions.Place a surcharge on parking in congested areas. Use electronic toll collection systems toease congestion at toll booths.
Congestion Mitigation Impacts: Diversion to alternate routes; mode switches; destinationchanges; increased trip chaining.

DRAFT GTC Congestion Management Process
49
2.E. Road Work Zone Management
Definition: Manage road work zones to mitigate their impact on traffic. Limit work activi-ties to off-peak travel hours; phase work activities on a daily, weekly, or seasonal basis tominimize traffic impacts; conduct a public awareness program in advance of road work;identify and promote alternate routes; promote ridesharing or transit use.
Congestion Mitigation Impacts: Improved throughput around road work zones; minimizedvehicle delays and speed reductions; reduced crash rate.
3. Arterials and Local Streets – Design
3.A. Intersection/Interchange Improvements
Definition: Improve intersection/interchange operations. Key design principles include:reduce the number of conflict points among vehicular movements; control relative speedof vehicles entering or leaving the intersection; coordinate the type of traffic control de-vices used with volume of traffic; select the proper intersection design to manage trafficvolume; high volumes may require separate turn lanes; avoid multiple and compoundmerging/diverging maneuvers; separate conflict points; favor heaviest and fastest flowsto minimize hazards and delay; reduce the area of conflict through channelization; segre-gate non-homogenous flows; and design for bicycle and pedestrian access. In select lo-cations consider non-traditional intersection/interchange designs, such as roundaboutsand diverging diamond interchanges, as a means of increasing traffic throughput, reduc-ing delay and emissions, and improving safety.
Congestion Mitigation Impacts: Reduced crash rates; increased intersection efficiencyand throughput; decreased emissions, reduced speeds at intersections.
3.B. Expand Arterial and Local Roads
Definition: Expand the capacity of existing arterials and local roads by adding travellanes. Expansion may include building new lanes alongside existing lanes, extendinglanes, or building new roads in select locations.
Congestion Mitigation Impacts: Increased traffic capacity; long-term congestion and de-mand increase; potential reduction of efficiency and increase in travel times.
3.C. Geometric Design Improvements (Arterials and Local Roads)
Definition: Adjustments to the number and arrangement of travel lanes at intersectionsor on limited segments of a roadway. Intersection improvements include restriping,channelization, adding turn lanes, installing traffic islands, modifying intersection angles,and improving corner radii. Segment improvement may include passing lanes, truckclimbing lanes, bus turnout lanes, widened shoulders, one-way couplets, and reversiblelanes.
Congestion Mitigation Impacts: Improved mobility; increased safety.

DRAFT GTC Congestion Management Process
50
3.D. Arterial Access Management
Definition: Control spacing, location, and design of driveways, medians/median openings,intersections, traffic signals, and freeway interchanges. Potential improvements include:physically restricting left turns; restricting curb cuts and direct access driveways; elimi-nating parking; locating intersections at no less than minimum intervals; constructingfrontage roads to collect and funnel local business traffic.
Congestion Mitigation Impacts: Reduced crash rate; improved throughput; fewer conflictpoints.
3.E. Reversible Traffic Lanes
Definition: One or more lanes designated for one direction for part of day and other di-rection for another part. They are meant to provide an extra lane(s) for use by dominantdirection of travel. They should be used if there is evidence of congestion, notably recur-ring congestion, as well as adequate capacity at access points, and are especially effec-tive on bridges and in tunnels.
Congestion Mitigation Impacts: Increased capacity at peak periods.
3.F. Traffic Calming and Street Space Management
Definition: According to the Institute of Transportation Engineers (ITE), traffic calming is“…the combination of mainly physical measures that reduce the negative effects of motorvehicle use, alter driver behavior, and improve conditions for non-motorized street us-ers.” Traffic calming is focused on lowering vehicle speeds and reducing traffic volumes,most often using physical/operational changes to streets themselves.
Congestion Mitigation Impacts: Increased transit use; increased bicycle and pedestriandecreased automobile and truck traffic, decreased bicycle/pedestrian conflicts; reducedcrash rate.
3.G. One-Way Conversion
Definition: One-way conversion is the process of converting two-way streets to a one-way traffic pattern. This reduces intersection delays caused by vehicle turning move-ments and pedestrian conflicts. It may provide space for lane-width adjustments that in-crease the capacity of existing lanes or provide additional lanes for bicycles and buses.Permit improvements in public transit operations such as routings without turnback loopsand permit turns from more than one lane at more intersections than possible with two-lane operation. However, one-way streets may have negative (real or perceived) impactson businesses by limiting access to them, and may complicate traffic movements andwayfinding initiatives by limiting route options.
Congestion Mitigation Impacts: Increased speeds and capacity; less congestion on adja-cent streets.

DRAFT GTC Congestion Management Process
51
3.H. Two-Way Conversion
Definition: Two-way conversion is the process of converting one-way streets into streetswith two-way traffic patterns. While one-way streets can be effective at moving heavytraffic through certain locations, two-way streets may be better options in other areasbecause they improve access to adjacent properties and distribute traffic over multiplethoroughfares. In addition, transforming one-way streets into two-way streets may re-duce vehicle speeds, thus improving pedestrian and bicyclist circulation, and benefit way-finding initiatives by providing travelers with more options to reach a destination.
Congestion Mitigation Impacts: Increased speeds and capacity; less congestion on adja-cent streets; increased accessibility.
3.I. Superstreet Arterials
Definition: Superstreets work by redirecting left turn and through movements from sidestreets and driveways. Instead of allowing those movements to be made through a stan-dard two-way median opening, a superstreet directs those movements to a one-way me-dian opening downstream of the intersection by a right turn. Drivers then make a U-turnaround the median and proceed straight along the road or make a right turn onto a sidestreet or driveway. This design reduces delay because drivers are not stuck waiting tomake left-hand turns or for traffic from cross-streets to clear the intersection. It improvessafety be eliminating the conflict points created by left-turning traffic. It can also increaseintersection capacity, and can often be developed within existing right-of-way.
Congestion Mitigation Impacts: Increased throughput at major intersections; reducedcrash rates.
4. Arterials and Local Streets – Operations
4.A. Traffic Signal Coordination
Definition: Coordinate traffic signals by updating signal equipment and making timingplan improvements. This technique includes computerized, interconnected, synchronized,and remotely-controlled signal systems, traffic signal removal/installation, and improvedsignal maintenance.
Congestion Mitigation Impacts: Increased intersection efficiency and throughput; re-duced delay and crash rates, more efficient use of existing road space.
4.B. Improved Traffic Control Devices
Definition: There are three classes of signs: regulatory, warning, and guide/informational. These signs are meant to reduce the level of driver uncertainty that canlead to congestion and crashes. Markings include lanes, symbols, words, object markers,and delineators.
Congestion Mitigation Impacts: Reduced crash rate; improved traffic flow; increased in-tersection efficiency and throughput.

DRAFT GTC Congestion Management Process
52
4.C. Parking Supply Management
Definition: Parking supply management techniques control the availability of, and de-mand for, parking in a region or sub-region. The various techniques are as follows: On-Street Parking: increase or decrease the supply; change mix of short/long-term
parking; institute parking restrictions (peak/off-peak, alternate, durations, prohibi-tions); permit programs; preference programs; loading zone regulations
Off-Street Parking: increase or decrease the supply (zoning regulations, slow growth,build new); change mix of short/long-term parking; restricted/preferential parking
Fringe and Corridor Parking: fringe/peripheral parking; park and rides; preferentialparking
Pricing: change rates (increase/decrease, free in CBD, differential); merchant shop-per discounts (stamps, tokens); employer subsidies
Enforcement and Adjudication: non-police enforcement personnel (ticketing, towing,booting); administrative; judicial
Marketing: advertising (brochures, maps, media); convenience programs Shared parking: two or more land uses can share same parking spaces thereby de-
voting less land area to parking; may cause parking shortage if land uses change Special Event Parking Management: develop and institute parking management plans
for special events such as concerts, professional sports games, or festivals
Congestion Mitigation Impacts: Decreased traffic demand; increased throughput; re-duced cruising for parking.
4.D. Arterial Monitoring and Management
Definition: Arterial monitoring and management involves incident detection, verification,and follow-up action (e.g., service patrols, roving tow vehicles, traveler information sys-tem, real-time transit information at stops or via email/text alerts); intersection monitor-ing (e.g., loop detectors, signal systems, CCTV monitoring); parking control/managementon arterials with more enforcement.
Congestion Mitigation Impacts: Reduced incident-related delay; improved traffic flow.
4.E. Enforcement
Definition: Enforcement includes education and outreach efforts needed to inform thepublic of changes to be made and their expected benefits. More enforcement officials areneeded in beginning to reinforce need for behavioral changes. Law enforcement agenciesshould be included in the planning process. Actions should be designed to provide forself-enforcement when possible; fines should be reasonable so as to not invoke a back-lash. There could be significant expenses involved in strict enforcement, however thebenefits may be substantial.
Congestion Mitigation Impacts: Enforcement supports implemented mitigation actions.

DRAFT GTC Congestion Management Process
53
4.F. Turn Prohibitions
Definition: Discourage/prohibit undesirable traffic turning movements while facilitatinghigh priority movements and desired traffic control schemes. Turn prohibitions can be ineffect all day long or during peak hours. Desirable vehicular paths should be clearly de-fined, safe speeds encouraged, and conflict points separated.
Congestion Mitigation Impacts: Reduced crash rate; increased intersection efficiency andthroughput; decreased delay.
4.G. Bicycle and Pedestrian Networks
Definition: Encourage non-motorized travel by providing continuous, connected sidewalksfor pedestrians and clear, visible lanes and trails for bicyclists. Facilitate movementthrough improved bicycle/pedestrian wayfinding systems. Origins and destinations shouldbe linked with both on-street and off-street routes.
Congestion Mitigation Impacts: Decreased emissions; increased non-SOV mode share;increased bicyclist and pedestrian safety.
4.H. Freight Movement Management
Definition: Changes in delivery schedules, terminal location, and delivery zones helpsminimize unnecessary congestion that occurs due to mixing of different vehicle types.These activities involve: traffic management; improvements at shipping/receiving points;reducing operational/physical constraints; changes in business operating practices orpublic policy; and investment in rail. Urban goods can be moved during off-peak hours.
Congestion Mitigation Impacts: Reduced overall congestion; improved goods movementthrough region.
4.I. Truck Restrictions
Definition: Separate trucks from passenger vehicles and pedestrians by prohibiting trucksto travel on certain roadways, instituting height and weight restrictions, and limiting trucktraffic to certain times of the day.
Congestion Mitigation Impacts: Increased capacity; decreased travel times; improvedsafety.
4.J. Construction Site Access
Definition: Coordinate the location of access points to construction sites, manage trafficflow around these points, and manage construction vehicle movements on and aroundthe site to minimize disruptions to travelers on surrounding streets.
Congestion Mitigation Impacts: Increased capacity and efficiency on arterials; decreasedshipping costs to construction sites; decreased incidents.
DRAFT GTC Congestion Management Process
54
5. Public Transportation Services
Improving transit services in conjunction with other strategies such as parking management,congestion pricing and development strategies can increase vehicle occupancy and decreasecongestion. There are three basic types of transit: rail/fixed guideway (including busways),bus, and paratransit.
5.A. System/Service Operational Improvements – Fixed Route and Express Buses
Definition: Operational improvements increase the productivity and cost-effectiveness oftransit lines and services. Fixed-route buses provide service on a regularly scheduled ba-sis along a specific route with buses picking up and discharging passengers at specifiedlocations. Express buses operate without stops or a limited number of stops and aregeared towards commuters in outlying suburbs.
There are a number of operational strategies and route planning devices to improve tran-sit service. For instance, flexibly-routed smaller buses servicing suburban commercial andoffice complexes can be implemented at the area or network level (e.g., route exten-sions, timed transfers, network realignment, feeders into line-haul services). This servicecan focus on route structure and reliability (e.g., point/route deviation, zonal service,route replacement/consolidation, changes in route departures, use of computer aideddispatch (CAD) and automatic vehicle locator (AVL) devices), or can provide improvedpassenger services (e.g., bus shelters, passenger information, trailblazing to stations,marketing, or consolidated fares/passes). Transit vehicles should be fitted with bicycleracks. Routine replacement of aging vehicles reduces maintenance expenses and offersriders up-to-date services. Off-peak ridership is more sensitive to changes in service.Ridership often responds more favorably to more frequent service than decreased traveltimes, and it is important to minimize the need for transfers.
Congestion Mitigation Impacts: Increased transit ridership; increased non-SOV modeshare; decreased emissions.
5.B. Fare Structures
Definition: Differentiation in fare structure can be used to enhance mobility options fortarget markets or to provide added incentive in specific geographic areas. Fare structurescan be differentiated by traveler or trip types.
Traveler types include: Demographic/socioeconomic aspects (e.g., age, income) Affiliation (e.g., employee, student) Mobility-impaired Frequency of use Payment method Time commitment of purchase (e.g., one-time, annual)
Trip types include: Specific origin/destination points
DRAFT GTC Congestion Management Process
55
Transit trip length or duration Quality of service (e.g., speed, crowding) by line or corridor Quality or price of competing service (e.g., congestion, tolls) Timing of trip Routing of trip Direction of trip Use of complementary modes Size of travel party
There are other reasons for differentiated fare structures, such as: Market building fare reductions Sales commissions for fare media distribution channels Joint promotion with other businesses or uses for payment media Two-part fare structures (e.g., time-based subscription with a use-based charge)
Fare elasticity is an important consideration. This is the ratio of percent change in transitridership over percent change in fare. For every 1% increase/decrease in fares, ridershipis expected to increase/decrease 0.2-0.4%. Although the transit industry is increasinglyembracing market-based pricing, there is concern about the equity implications of charg-ing one individual more than another for same trip.
Congestion Mitigation Impacts: Increased transit ridership; increased non-SOV modeshare; decreased emissions.
5.C. System/Service Expansion: Rail/Fixed Guideway Transit Facilities
Definition: This form of service expansion can move large numbers of persons quickly,efficiently and reliably. There are generally four different options for this strategy:
Automated Guideways/Peoplemovers: Circulation systems relying on automatedguideway technology to provide direct service to stations. Suited for use in high-density urban sites, often used as connections to high-capacity, high-speed services.
Light Rail: Medium capacity (<20,000 persons/hour) service operating on eithergrade-separated or reserved right-of-way, mixed traffic (streetcars), or a combina-tion. Passenger platforms can either be low or high-level. Operation is usually manualand can occur either individually or in trains and can couple/uncouple easily. Suitedfor service to non-residential concentrations of 35-50 million square feet and residen-tial areas with nine units per acre. Light rail is much less expensive than heavy raildue to its flexibility, but has less carrying capacity.
Commuter Rail: Operates between urban centers and suburbs, often using mainlineswith high-speed locomotives or self-propelled cars in trains. Best suited for service inareas with more than 100 million square feet of non-residential development. Cancome on-line easier and faster than other forms. It may be the cheapest rail serviceto build, but typically incurs heavy operating costs. Commuter rail conflicts withfreight rail and is not convenient for handling reverse commutes or mid-day/off-peakcommutes.

DRAFT GTC Congestion Management Process
56
Heavy Rail: High speed (~80 mph), high capacity (>20,000 persons/hour); exclusiveright-of-way with multiple car trains, sophisticated signaling, platform loading at sta-tions; third rail power supply and high degree of automation. Best suited for high-density areas (>12 units/acre) and high level of non-residential development (>50million square feet). This is the most expensive transit option.
Congestion Mitigation Impacts: Increased transit ridership; increased non-SOV modeshare; decreased emissions.
5.D. Joint Development
Definition: Joint development actions share the costs and/or revenue associated withtransit stops and stations. Such actions are typically taken in conjunction with a rail tran-sit station. Numerous options for joint development are available.
Revenue-sharing actions include: Leases: transit agency leases parcels, development rights, or unimproved space to
developers or commercial tenants Facility Connection Fees: fee to connect a project to a transit station Land Sales Benefit Assessment Districts: special districts around transit stations where landown-
ers pay on a pro-rated basis to help finance the public facility Tax Increment Financing (TIF): the property tax base in a special district is frozen
and all gains above that point are earmarked for financing a transit facility Transit Impact Fee: developers are required to make one-time contribution to ac-
count earmarked for funding transit facilities needed to accommodate growth Negotiated Payments: negotiate with landowners to pay for transit investment
Cost-sharing actions include: Voluntary Agreements: transit agencies and developers agree to reduce each others’
costs through coordination Incentive-Based Agreements: public authorities grant developers a bonus in ex-
change for partial or full-funding of on-site public infrastructure Mandatory Programs: developers are required to finance certain actions as a precon-
dition to receiving a building permit
Congestion Mitigation Impacts: Reduced number of vehicle trips.
5.E. System/Service Operational Improvements – Paratransit Services
Definition: Paratransit services include carpools, vanpools, subscription buses, shared-ride taxis, and route deviation services, which are transit services that deviate up to acertain distance from a route to pick-up passengers who cannot reach a regular stop.These services are best suited for highly dispersed travel patterns in low-density areas.Private/contracted delivery of non-traditional services is cheaper and generally morecost-effective than public delivery. The greatest barriers to successful paratransit serviceare restrictive regulations, subsidized bus fares, and the prevalence of free parking.

DRAFT GTC Congestion Management Process
57
Congestion Mitigation Impacts: Increased transit ridership.
5.F. Transit-Oriented Development (TOD)
Definition: TOD is typically characterized as dense, mixed-use development locatedwithin a five-to-ten minute walk of a transit stop. TOD requires local governments to es-tablish a land use planning policy that promotes transit use. It is imperative that easyand convenient access to transit facilities is provided as well as other services that aresupportive of transit. Increases transit use to employment centers; occurs in regions witha vision of a desired settlement pattern; occurs in regions where political culture supportstransit; requires high quality transit service; and requires stations with development po-tential.
Congestion Mitigation Impacts: Increased non-SOV trips; trip generation more evenlydistributed throughout day and week; decreased VMT.
5.G. Transit Signal Priority (TSP)
Definition: A TSP system equips buses with transponders that communicate with receiv-ers on traffic signals. The signals are programmed to activate or extend green-lightphases to better accommodate transit vehicles in through or turn lanes. TSP helps latebuses recover time, while making it easier for on-time buses to stay on schedule.
Congestion Mitigation Impacts: Increased transit system reliability and efficiency.
5.H. Park and Ride Facilities
Definition: Location for transfer from low-occupancy (e.g., automobile, bicycle) to high-occupancy (e.g., bus, rail) modes. There are three types of park and ride facilities: re-mote (suburban/satellite location with express service to destination); local (on local busroute, non-express); or peripheral (CBD edge to intercept cars before entering citystreets). Park and ride facilities must be convenient, safe, and easy-to-use; and can beeither exclusive or shared-use.
Congestion Mitigation Impacts: Travel time savings; reduced parking demand at destina-tions; increased non-SOV mode share; reduced vehicle emissions.

DRAFT GTC Congestion Management Process
58
Demand-Driven Strategies – Transportation Demand Management (TDM)
TDM is any action or set of actions aimed at influencing people’s travel behavior in such a waythat alternative mobility options are presented and/or congestion is reduced.
6. Site-Specific and Area-Wide Strategies
6.A. Alternative Modes of Transport
Definition: Encourage commuters to use modes of transportation other than the single-occupant vehicle. Ridesharing (i.e., carpool or vanpool) is one option. Ridesharing pro-grams can be either company-sponsored, third party, or owner-operated and can be pro-vided at four levels: regional, sub-regional by government, sub-regional by private em-ployers, or residential. Another option is non-motorized transportation (i.e., bicycling andwalking). It is important to provide an environment conducive to biking and walking. Bi-cycle lockers or racks should be found near destinations.
Congestion Mitigation Impacts: Decreased VMT, SOV trips, emissions, costs; reducedcongestion and parking demand.
6.B. Alternative Travel Hours
Definition: This strategy takes into consideration the times that the majority of commut-ers use roads to get to work. Changing those times can dramatically affect the numbersof drivers on the roads during traditional peak hours. One option is the staggered workhour concept where groups are assigned different times to begin work. This allows work-ers to travel at times when traffic moves more freely and transit is less crowded. A sec-ond option is flextime, which allows employees to choose their own schedules within em-ployer-set guidelines. A third option is the compressed workweek, which consists of afour-day workweek in ten-hour days. This has a double impact since there is one day ofcommuting eliminated and the early arrivals and late departures means that workers aretraveling during off-peak periods.
Congestion Mitigation Impacts: Reduced peak hour traffic, transit crowding, and parkingpressures; decreased VMT (compressed work week).
6.C. Negotiated Demand Management Agreements
Definition: Publically-mandated private sector involvement in traffic mitigation as a condi-tion of individual development approval. In this, a municipality would set a traffic reduc-tion goal (e.g., minimum level of ridesharing, specific number of auto trips) that can varyin degree of prescription concerning implementation. These are similar to trip reductionordinances except negotiated demand management agreements are focused on a par-ticular site and so do not provide area-wide consistency in trip reduction.
Congestion Mitigation Impacts: Increased ridesharing and transit trips; auto trip-makingshifts to non-peak hours.

DRAFT GTC Congestion Management Process
59
6.D. Complementary TDM Support Measures
Definition: The effectiveness of TDM programs is related to the extent which complemen-tary support measures encourage their use. These complementary support measurescould include financial incentives such as transportation allowances, bicycle/pedestriansubsidies, carpool/vanpool subsidies, and transit fare subsidies.
There are also assistance programs that can accomplish similar goals, such as: Commuter information centers/information booths/fairs New hire orientations Marketing Rideshare match Company-owned/leased vanpool Employer/landlord parking agreements Preferential or free parking for High Occupancy Vehicles (HOVs) Guaranteed/Emergency Ride Home programs
As mentioned previously, flexible work schedules (e.g., flextime, telecommuting, com-pressed workweek) will help further TDM as will rewards programs such as newsletterrecognition or prize drawings and other things such as childcare centers, auto service,and assorted on-site services.
Congestion Mitigation Impacts: No direct impacts.
6.E. Alternative Workplace Locations
Definition: Also known as telecommuting, alternative workplace locations replace the tra-ditional workplace with an alternative site. Telecommuting can occur either at home, atregional worksites, or at a neighborhood telecommuting center. Implementation of sucha program requires the support of upper management.
Congestion Mitigation Impacts: Decreased commuter trips, VMT, emissions, and coldstarts.
6.F. Traveler Information Systems
Definition: Traveler Information Systems provide multi-modal traveler information for allsystem services so that travelers can make informed decisions on mode and routechoice, or even whether the trip should be made. Information is available for both pre-trip and en-route elements of trip making. In the Rochester area, the 511NY system pro-vides traveler information including weather conditions, road work, and incident loca-tions, while the regional commuter choice program, Roceasyride, provides an online tripplanning tool that helps commuters identify alternate options (transit, carpool, bicycling)to single-occupancy vehicles.
Congestion Mitigation Impacts: Reduced travel times, increased network efficiencies; di-version to alternate routes/modes.

DRAFT GTC Congestion Management Process
60
6.G. Growth Management
Definition: Growth management is the use of public policy to regulate the location, geo-graphic pattern, density, quality, and rate of development. New development is linked tothe existing capacity of infrastructure and level of service desired; if new developmentexceeds the ability of existing infrastructure to provide service that infrastructure is up-graded. Promoting infill development helps maximize the use of existing public infrastruc-ture, including transportation facilities. TOD (see above, 5.F) is a form of growth man-agement.
Congestion Mitigation Impacts: Efficient transit service provision; reduced infrastructurecosts; reduced congestion; reduced demand.
6.H. Transit-Supportive Design Guidelines
Definition: Transit-Supportive Design Guidelines enhance mobility and access by promot-ing mixed-use, pedestrian and transit-oriented site planning. Similar to transit-orienteddevelopment (TOD), this type of development would have more transit trips and bicycle/pedestrian trips than typical auto-oriented development. Design standards would be es-tablished for: transit stops, street configuration (connectivity), pedestrian connections,commercial configuration (clustering), building entries, building setbacks, mixed housing,parks, parking configuration, and other pertinent elements.
Congestion Mitigation Impacts: Increased non-SOV trips; trip generation more evenlydistributed throughout day and week; decreased emissions; increased transit trips andnon-motorized mode trips.
6.I. Parking Demand Management
Definition: According to research by professor Donald Shoup at the University of Califor-nia, Los Angeles, 99 percent of all automobile trips receive free parking. Parking manage-ment programs must be implemented across a wide area to be effective. Parking man-agement techniques may be viewed from two sides: pricing management and supplymanagement.
Pricing management strategies include: Impose or increase fees or surcharges for single occupant vehicles or long-term par-
ing at public facilities Carpool/vanpool price preference Tax on parking providers Impose parking pricing mechanisms through regional regulations Tie investment in road improvements to implementation of advanced parking man-
agement strategies Remove or reduce employer-provided parking subsidies Reverse “early bird” incentives that encourage long-term commuter parking Provide preferential pricing to HOV users Develop parking regulations and pricing that reflect true parking costs

DRAFT GTC Congestion Management Process
61
Supply management strategies include: Off-street parking requirements in zoning regulations On-street parking regulations Publicly-funded/subsidized parking facilities
Congestion Mitigation Impacts: Reduced vehicle trips; increased use of non-SOV modes.
6.J. Trip Reduction Ordinances
Definition: Trip Reduction Ordinances use the community’s regulatory authority to limittrip generation from a development site. These ordinances can potentially achieve moresignificant trip reductions because they usually cover an entire local political subdivisionrather than just an individual project. These spread the burden more equitably betweenexisting and future development.
Congestion Mitigation Impacts: Increased ridesharing and transit trips; shift auto trip-making to non-peak hours.
6.K. Congestion Pricing
Definition: Congestion pricing programs charge motorists who wish to drive during peakperiods or on congested facilities using tolls, entrance fees, parking charges, etc. Driverscan react to congestion pricing by either: paying the charge, adopting another mode,using another route, including more passengers to share the cost, or foregoing the trip.Six types of congestion pricing exist around the world: parking surcharges in congestedareas; point pricing at a specific location; cordon pricing (vehicles are charged uponcrossing a boundary); zone pricing (vehicles in a particular zone are charged a fee); pric-ing based on distance traveled in congested areas; or pricing based on time spent oncongested facilities.
Congestion Mitigation Impacts: Increased mode shift; improved air quality; shift autotrip-making to non-peak hours.
6.L. Auto-Restricted Zones
Definition: Commonly referred to as pedestrian or transit malls, auto-restricted zones areany areas where vehicular travel is prohibited or restricted in some manner. This can beachieved through either physical barriers to auto access; parking controls; exclusive uselanes; or turn prohibitions. Three reasons to create an auto-restricted zone are: (1) topreserve and enhance the vitality of urban centers; (2) to improve the environmentalquality of urban centers; (3) to encourage the use of non-auto modes.
Congestion Mitigation Impacts: Reduced pedestrian delay and/or pedestrian congestion;increased transit usage.

DRAFT GTC Congestion Management Process
62
GENESEE TRANSPORTATION COUNCIL
50 West Main Street, Suite 8112Rochester, NY 14614
www.gtcmpo.org(585) 232-6240