GTAA Noise Management Benchmarking Study · GTAA Noise Management Benchmarking Study. ... Francisco...
118
Management and technology consultants Final report Annex C - Detailed summary of research Version 1.5 (FINAL), 24 th September 2017 GTAA Noise Management Benchmarking Study
Transcript of GTAA Noise Management Benchmarking Study · GTAA Noise Management Benchmarking Study. ... Francisco...

Management and technology consultants
Final report Annex C - Detailed summary of research
Version 1.5 (FINAL), 24th September 2017
GTAA Noise Management Benchmarking Study

w w w . a sk he l io s . c o m
Contents
Quieter fleet initiatives 2
Runway schemes 10
Night flight restrictions 22
Noise abatement procedures 33
Ground and gate operations 46
Land use planning 53
Noise complaints 65
Community outreach 82
Noise ombudsman 91
Fly Quiet programmes 96
Reporting of noise monitor data 106
1

Research summary
Quieter fleet initiatives

w w w . a sk he l io s . c o m
Introduction
Most airports have some form of measures to either limit
the use of the noisiest aircraft types or encourage the use
of quieter fleets. These measures can be in the form of
restrictions on certain types of aircraft (typically at night),
incentive schemes, voluntary arrangements and comparing
fleet mix between airlines.
Typical practices
Operating restrictions: These involve restricting the
operation of certain (older/noisier) aircraft types, typically at
night. These are usually based on the noise
certification/Chapter number of aircraft types according to
the International Civil Aviation Organisation (ICAO).
Noise based charging schemes: It is common in Europe
for airports to assign a noise element to the landing and/or
take-off charge. Lower noise charges are levied on ‘quieter’
aircraft to incentivise their use. Again, these charges are
usually related to the certified noise level of an individual
aircraft or its ICAO Chapter.
A320 modification programmes: A relatively new
initiative is addressing the ‘whine’ generated Airbus A320
family of aircraft on approach. The aircraft have small vents
on each wing designed to help equalise the fuel pressure in
the intra wing tanks. When air rushes past the vents it
creates a high pitched ‘whine’ which can cause up to 6dB
“extra” noise. There is a simple modification (vortex
generator) which can resolve the issue and some airports
have undertaken voluntary and financially incentivised
initiatives to encourage airlines to modify the aircraft.
Special and unique practices
Incentives to replace older aircraft: Zurich and
Amsterdam Schiphol were found to have offered financial
incentives to airlines to replace older noisier aircraft.
Fly Quiet programmes: A small number of airports have
Fly Quiet programmes which publicly compare airlines
across a variety of noise metrics. Two of these airports
(Heathrow and San Francisco) have fleet metrics as a
means to encourage airlines to operate the quietest fleet
possible for a given type of operation.
Regional trends
Operating restrictions are the only initiative commonly
applied by airports across the world. Financial
mechanisms, such as noise based charging and incentives
are primarily applied in Europe
Quieter fleet initiatives - Overview

w w w . a sk he l io s . c o m
Quieter fleet initiatives - Best practice from around the world
4
• Gatwick, Heathrow and Frankfurt incentivise
A320 retrofit through either voluntary
schemes or through additional charging.
• Noise based charging (or a noise factor in the
charge) is the norm for European airports – it
is either based on certified or measured
noise. There is a 10X difference at Heathrow
between loudest and quietest aircraft.
• Chapter 2 aircraft are banned at European
airports.
• Airports such as Charles de Gaulle and
Frankfurt limits the operation of marginally
compliant chapter 3 and Chapter 3 aircraft in
the overnight period.
• Heathrow has included aircraft chapter within
the Fly Quiet program.
• Incentive schemes for quieter aircraft have
been used at Zurich and Schiphol, rewards
are applied per arrival or departure if
marginally compliant chapter 3 aircraft are
replaced.
• Charges are mainly based
on weight.
• 40% discount is applied at
Changi to incentivise night
flights.
• Only Chapter 3 or better
aircraft are permitted.
• Charging is largely based on MTOW or PAX.
• Chapter 2 aircraft are largely banned. At
Montreal, Chapter 3 and 4 aircraft are
restricted during the night.
• Forums at Chicago O’Hare, LAX and San
Francisco jointly engaged with United Airlines
on the ‘whine’ generated by A320 aircraft.
• Softer schemes in operation, such as the MD-
80 phase out at O’Hare.
• Noise is not part of the charging scheme.
• Chapter 2 aircraft are banned at US airports.
• John-Wayne has restrictions based on the
actual noise output of aircraft on arrival and
departure.
• Only Chapter 3 or better
aircraft are permitted to
operate from Dubai.
• Charges are based on aircraft weight – Sydney
used to operate a night noise levy but this has
now ceased.
• Only Chapter 3 aircraft or better are allowed.

w w w . a sk he l io s . c o m
Overview of research
Operating restrictions limit the use of certain (older/noisier)
aircraft types, either throughout the day or at sensitive
times of day such as the night. The key findings from the
research were:
• Almost all airports researched specify that Chapter 2
aircraft (according to ICAO Annex 16) are banned from
operating.
• At Amsterdam Schiphol aircraft that are marginally
compliant with Chapter 3 standards by < 5 EPNdB are
subject to restrictions at night:
• Aircraft with engine bypass ratio > 3 (typically commercial aircraft)
are not allowed to operate between 2200-0600
• Aircraft with engine bypass ratio < 3 are not allowed to operate
between 1700-0700
• Paris Charles de Gaulle restricts aircraft that are
marginally compliant with Chapter 3 standards:
• Aircraft compliant by < 5 EPNdB are banned
• Aircraft compliant by < 10 EPNdB are not allowed to take off or
land between 2200-0600
• Frankfurt does not allow the operation of marginally
compliant Chapter 3 aircraft 1900-0700 on weekdays and
does not allow their operation at the weekend (between
1900 on Friday to 0700 on Mondays).
• Montreal does not allow Chapter 3 and 4 aircraft over 45
tonnes to land between 0100-0700 or take off between
0000-0700 .
• New York (JFK) and John Wayne airports are subject to
movement limits. JFK is limited to 81 movements per hour
between 0600-2259
• Brussels, Heathrow, Gatwick and Madrid apply night-
time quota schemes which restrict the operation and/or
scheduling of aircraft in the noisiest aircraft categories at
different times of the night (quota schemes are
explained the night flight restrictions section)
Quieter fleet initiatives – Operating restrictions
5
ICAO Annex 16, Volume I, Aircraft Noise, front cover
Source:
http://www.icao.int/secretariat/PostalHistory/annex_16_environmental_protec
tion.htm

w w w . a sk he l io s . c o m
Overview of research
Noise based charging schemes
It is common in Europe for airports to assign a noise
element to the landing and/or take-off charge. Lower noise
charges are levied on ‘quieter’ aircraft to incentivise their
use. Again, these charges are usually related to the
certified noise level of an individual aircraft/its ICAO
Chapter.
Charges are often also increased further at night as a
further incentive for airlines to operate quieter aircraft.
As summary of the findings in this areas are as follows:
• 8 of 26 airports in the study (all in Europe) employed
some form of noise based charge in their charging
schemes.
• Sydney airport did have a noise levy in place from 1996
but it was repealed in 2005.
• Hong Kong airport are investigating whether noise
based charging is appropriate for them.
• New York (JFK) have increased charges between 3pm
and 10pm for unscheduled/private aircraft.
• Although not an airport within the scope of the study,
Tokyo Narita airport has recently introduced a noise
based charge.
Case studies of noise-based charging schemes are given
in the following pages.
Financial incentives
Two examples were found of airports using financial
incentives to encourages airlines to replace older aircraft:
Zurich and Amsterdam Schiphol were found to have
provided direct financial incentives to airlines (or in the
case of Amsterdam cargo operators). Both schemes
focussed on incentives to replace ‘noisier’ aircraft with a
‘quieter’ one.
The Zurich scheme encouraged operators to put a quieter
aircraft (a minimum 5 dB reduction is required over the
previous aircraft type) on one of its existing routes through
reductions in landing charges for up to 3 years.
Amsterdam Schiphol operates a Cargo Sustainability
Incentive Programme to stimulate the use of quieter cargo
aircraft. Airlines are incentivised to replace their Marginally
Compliant Chapter 3 (MCC3) dedicated freighter flights
with quieter wide body dedicated freighter aircraft.
Qualifying airlines are eligible for a reward of € 400 per
departure during the first year of operation with the new
aircraft.
Quieter fleet initiatives – Financial mechanisms
6

w w w . a sk he l io s . c o m
Case study – Heathrow charging scheme
Heathrow has a noise element in its landing charges. For
aircraft over 16 metric tonnes there are 6 charging
categories based upon ICAO Chapter numbers (see the
top table to the right).
In addition, charges differ depending on whether an aircraft
lands during the day or at night. The top table to the right
shows that charges increase by a factor of almost 12 from
the quietest (Chapter 14 Low) aircraft, to the loudest
(Chapter 3).Charges are further increased by a factor of 2.5
for each category between 0100 and 0430.
The second table describes the qualification criteria for
categorising aircraft. The criteria are based on the
cumulative reduction in Effective Perceived Noise level
(EPNdB*) compared to the ICAO Chapter 3 standard. This
information must be provided to the airport in order to
calculate the appropriate charge.1
* The EPNdB metric represents the average sound level in
decibels over a 10 second period. A 10dB reduction is equivalent
to halving the sound level.
1. http://www.heathrow.com/file_source/Company/Static/PDF/P
artnersandsuppliers/Conditions-of-Use_2017.pdf
Quieter fleet initiatives - Noise based charging schemes
7
Heathrow conditions of use. Source:
http://www.heathrow.com/file_source/Company/Static/PDF/Partnersandsuppliers/Con
ditions-of-Use_2017.pdf

w w w . a sk he l io s . c o m
Case study – Schiphol charging scheme
Amsterdam Schiphol also used aircraft certified noise
levels to categorise them into different charging bands
(see top table to the right).
A noise factor of between +60% and -20% is applied to the
basic compensation/charge (a unit charge per 1,000kg –
see table below) depending on the aircrafts noise
classification. An additional charge is also levied during the
night period (2300-0600). For the noisiest aircraft types
(marginally compliant Chapter 3 (MCC3)), charges
approximately double during the night.
Schiphol airport also states that where aircraft do not
provide evidence of their noise certification, they will be
allocated into a category by the airport based on their type.
This approach is termed the “conservative classification of
noise categories” (see table) since the classification is
based on the most unfavourable configuration of a given
type.
Quieter fleet initiatives - Noise based charging schemes
8
Schiphol “Conservative classification of noise categories” 01/04/2016 (for those
aircraft which do not have noise certification available)
Source: https://www.schiphol.nl/en/route-development/page/ams-airport-
charges-levies-slots-and-conditions/
Noise
category
Cumulative reduction in
EPNdB
Description
MCC3 0 ≥ change in EPNdB ≥ -5 Marginally compliant chapter 3
A -5 ≥ change in EPNdB > -9 Relatively noisy aircraft
B -9 ≥ change in EPNdB > -18 Average noise producing aircraft
C -18 ≥ change in EPNdB Relatively low noise aircraft
Noise categories at Amsterdam Schiphol airport
Source: https://www.schiphol.nl/en/route-development/page/ams-airport-charges-levies-
slots-and-conditions/Noise categories at Amsterdam Schiphol airport
Source: Setting_Charges___Conditions_1_April_17_.pdf

w w w . a sk he l io s . c o m
Overview of research
6 of the 26 airports researched had undertaken some form
of initiative to encourage A320 operators to modify the
aircraft to alleviate the ‘whine’ generated when the aircraft
is on approach to land (see the introduction page to this
section for further information).
In May 2016, Los Angeles, San Francisco and Chicago
O’Hare airports submitted letters to United airlines via their
community round table groups. In December 2016, United
agreed to install vortex generators on its aircraft. 13 aircraft
were to be retrofit by early 2017 and subsequent aircraft at
a rate of 2 per month.
Heathrow airport publicly states that they encourage
airlines to retrofit their A320 fleets but no specifics were
identified.
Frankfurt and Gatwick modified the noise element of their
landing/take-off fees to encourage airlines to modify the
A320. For the noise element of its landing/take-off charges,
Frankfurt categorises aircraft into one of 15 charging bands
based upon certified noise levels. An A320 that has been
modified to remove the ‘whine’ falls into a different (less
expensive) band than its unmodified counterpart.
Gatwick created a separate charging category for
unmodified A320 family aircraft (see case study opposite).
Case study – Gatwick modified charging scheme
As part of an independent review of arrivals in 2016, it was
recommended that the airport introduce an A320
modification incentive scheme. Following a period of
consultation with airlines, it was decided that a higher noise
charge would be introduced for unmodified aircraft from 1st
January 2018 to give operators a chance to modify their
fleets. The table below shows that unmodified A320s will
be subject to the highest noise charges during both the day
and night.
The airport informed airlines of these changes and
continues to liaise them through requests of quarterly
updates of their A320 modification programmes.
Quieter fleet initiatives - The A320 modification program
9
Season Charge category Charging unit Day Night
Summer
(1 April - 31
October)
Unmodified A320 family per movement £784.40 £988.02
Chapter 3 & below per movement £78.44 £988.02
Chapter 4 per movement £39.22 £494.01
Chapter 14 High per movement £23.53 £296.41
Chapter 14 Base per movement £19.61 £247.00
Chapter 14 Minus per movement £15.69 £197.60
Winter
(1 November - 31
March)
Unmodified A320 family per movement £784.40 £988.02
Chapter 3 & below per movement £0.00 £988.02
Chapter 4 per movement £0.00 £494.01
Chapter 14 High per movement £0.00 £296.41
Chapter 14 Base per movement £0.00 £247.00
Chapter 14 Minus per movement £0.00 £197.60
Gatwick Unmodified A320 family noise charge – effective 1st January 2018, Source:
https://www.gatwickairport.com/globalassets/publicationfiles/business_and_community/all_
public_publications/2017/2017-18-conditions-of-use---final---sent-30jan17.pdf

Research summary
Runway schemes

w w w . a sk he l io s . c o m
Introduction
In order to ensure safe take-off and landing, aircraft normally
land and take-off into the wind and air traffic control will
select the runway direction based upon current and forecast
weather conditions to facilitate this.
Runway schemes
At airports with multiple runways, preferred runway
directions for take-off and landing are often nominated for
noise abatement purposes, the objective being to utilize
whenever possible those runways that permit aircraft to
avoid noise-sensitive areas during the initial departure and
final approach phases of flight1.
Use of runway schemes
Of the 26 airports researched, most operate some form of
runway scheme for noise management purposes. The
exceptions were in the Middle East.
Day-time and night-time runway schemes
Both day and night-time runway schemes are common.
Night-time schemes are more widely used as this is both a
more noise sensitive period of the day, and airports are able
to operate their runways with increased flexibility at night
when traffic levels are lower.
Types of runway schemes
The type of schemes operated varied considerably,
reflecting the influence of several local factors –
geographical location, location relative to populations and
the number/orientation of runways. Each broadly aimed to
either provide some form of predictability of flight path use,
focussing overflight over sparsely populated/unpopulated
areas and/or sharing noise. For the reasons stated earlier,
schemes operated at night tended to apply more ingenious
solutions.
Conformance with runway schemes
Factors such as weather, traffic demand, safety, pilot
preferences and runway maintenance make it very difficult
to provide 100 percent conformance with any runway
scheme. For this reason a number of airports state that they
will apply their runway schemes voluntarily or ‘where
possible’.
Reporting on runway schemes
The majority of airports do not report on the level of
compliance with their runway schemes.
Runway schemes – Overview
11
1 ICAO PANS-OPS Volume 1 - Section 2.1 Noise Preferential Runways

w w w . a sk he l io s . c o m
Runway schemes - Best practice from around the world
12
• Almost all airports make use of runway schemes to
provide respite. However in some areas it’s used to
deliver capacity benefits (Frankfurt and Charles de
Gaulle).
• Schemes are either based upon fixed time (daily or
weekly) rotations (Brussels, Zurich and Heathrow)
or use a number of factors. Amsterdam uses
software to share noise by assessing the potential
noise impacts, traffic mix and metrological
conditions.
• Schemes are typically the same during the night
although some airports do not allow use of certain
runways during the night (Amsterdam, Madrid).
• Runway usage is reported by Heathrow, Gatwick
and Charles de Gaulle. However, Heathrow is the
only airport that reports departure runway
adherence.
• Changi and Hong Kong
attempt to push departures
away from residential areas by
using the runway closest to the
water for departures, with
arrivals on the closest runway.
• In Changi this only applies in
the early morning.
• Runways schemes used to divert traffic over low population
areas.
• Night time runway schemes typically operate between 2300 and
0600. Usually based on preferred operational direction
(Vancouver) or set list of runways (Calgary, Montreal, Toronto).
• Only Vancouver and Montreal report on runway usage in annual
or directors reports.
• Runways schemes are not typically used
during the day. Only Hartsfield Jackson
(Atlanta) states that the 4 northern runways
should be used between 0700 and 2200.
• O’Hare recently undertook a night-time
runway use rotation trial to vary runway use
on a 12 week rotation.
• Tendency to make use of ‘inner’ runways
during the night period.
• Voluntary night time runway schemes are
used between 2200 and 0700. The protocol
is designed to direct aircraft over water (Los
Angeles, San Francisco).
• Where runway schemes are used, runway
usage is reported in figures and maps in the
applicable time period.
• No information available
on runway schemes.
• Sydney has an aspirational Long Term Operational Plan
(LTOP) which aims to share traffic and drive traffic over
water where possible.
• In Auckland, opposite runway directions (landing and
take-offs nose to nose) are used to drive traffic over
water during the night.
• Sydney reports on runway usage through an online
community tool which is required to report performance
against the LTOP.

w w w . a sk he l io s . c o m
Overview of research
Of the 26 airports researched, most operate some form of
runway scheme for noise management purposes.
Day and night-time runway schemes
As shown in the chart above, night-time runway schemes
were more common than their day-time counterparts. This
reflected both the night-time being a more noise sensitive
period of the day, and airports being able to be more
flexible with the operation of their runways at night when
traffic levels are much lower. Two airports, Paris Charles
de Gaulle and Frankfurt, had protocols but these are not
specifically used for noise management.
Night-time runway schemes typically start around 2300 and
end around 0600 (see chart on page 16).
Types of runway schemes
The type of schemes operated varied considerably
reflecting the influence of several local factors and
examples are given below, these are supported by case
studies in the following pages. In many cases combinations
of the examples below were used at a given airport:
• Prioritised list of preferential runways: Many airports,
publish an order of priority for runway use. If conditions
such as weather are satisfied, the first preference runway
combination is used. If conditions are not satisfied, the
second preference is used and so on (see Amsterdam
Schiphol case study).
• Fixed timetable for runway usage: In this example,
airports had a timetable stating the preferred runways to be
used at certain hours of the day. These aimed at providing
those under the flights paths with a degree of predictability
of when they would be overflown (see Zurich case study).
(Continued on the next page)
Runway schemes – Overview & types of runway schemes
13
0
2
4
6
8
10
12
14
16
18
20
Day protocol Night protocol Publicly reported onprotocol
Num
be
r o
f a
irp
ort
s a
pp
lyin
g
the
pro
toco
l

w w w . a sk he l io s . c o m
• Directing traffic over the least populated areas: These
examples aimed at focussing the use of runways for arriving
and departing aircraft on the least populated areas. In
particular, airports with a coastal location try to fly as many
aircraft as possible of the sea (see Sydney Case study). At
night, when traffic levels were lower, a number of this airports
aimed to have both arriving and departing aircraft operating
over the sea i.e. landing and departing in opposite directions.
(see Auckland and Vancouver case studies).
• Rotating timetable for runway usage: Similar to the
example above, but with a timetable that rotated, typically on
a weekly basis. As well as providing those under the flights
paths with a degree of predictability of when they would be
overflown, it also aimed to ensure that overflight did not occur
at the same time every day (see Chicago O’Hare and
Heathrow case studies).
• Use of runways furthest from populated areas: During the
day-time, Los Angeles, with its four parallel runways, where
practicable, aims to operate arriving aircraft on the outer
runways (closest to populations) and departure operations,
which are noisier than arrivals, on the inner runways (furthest
from populations). At night, the aim is to maximise the use of
the inner runways for both arriving and departing aircraft.
Similarly, other airports focus night-time operations on the
runway furthest from populations (see Vancouver case study).
• Long-term noise sharing: This approach aims to achieve
some form of equitable sharing of noise over an extended
period of time – for example the amount of overflight certain
areas will receive over a given period of time. The main
example of this is Sydney airport which sets targets for the
proportion of aircraft arriving/departing from/to the north, east,
south and west of the airport (see Sydney case study).
Runway schemes – types and limitations
14

w w w . a sk he l io s . c o m
Conformance with runway schemes
Research identified that it is very difficult to provide 100
percent conformance with any runway scheme. The level of
conformance can vary quite considerably depending on the
scheme – for example 90 - 95% at Heathrow and 67% at
Chicago O’Hare. There are several factors for this, not all
of which are under the control of the airport. For this reason
a number of airports state that they will apply their runway
schemes voluntarily or ‘where possible’:
• Weather: This includes wind direction/speed and nearby
storms which preclude the use of a preferred runway.
• Traffic demand: Some preferred runway directions can
only be operated during low traffic demand.
• Pilot preferences: Pilots will sometimes request a certain
runway on safety grounds, for example the longest runway
at the airport.
• Emergencies: Use of a ‘non-preferred’ runway in the case
of emergencies.
• Runway inspections & maintenance: Use of another
runway while the preferred runway is being maintained or
inspected.
Reporting on runway operations
Of the 26 airports researched, 8 provided public reports on
usage of runways.
The method and frequency of reporting varied from
monthly, quarterly and annually written reports to daily
online reports as provided by Heathrow.
No clear trends were spotted in the frequency of reporting
periods, however all of the reports provided graphics
showing the percentage use of one particular runway
direction over the reporting period.
Runway schemes – Conformance and Reporting
15

w w w . a sk he l io s . c o m
Runway schemes – Night time protocol benchmarking
16

w w w . a sk he l io s . c o m
Runway schemes – Case studies
17
Case Study - between 2300 and 0600, when weather conditions
permit, Vancouver airport makes use of runways which direct both
arriving and departing aircraft over the Strait of Georgia. In addition,
the northern runway (08L/26R) is closed between 2200 and 0700
except in the event of an emergency or maintenance. During the day,
where weather conditions permit, departures are directed towards
the water.
The airport has published a short paper explaining how the protocol
works, the times at which it isn’t possible to use it, and notes the
specific operations which may not follow the protocol such as air
ambulances or police flights.
Reporting on compliance is made within the airport’s annual noise
report and covers 24 hour runway utilisation which is then subdivided
up into operations over the Strait of Georgia. In 2015 the airport
conducted 54% of take-offs over this body of water. There is no
separate reporting of night-time runway operations.
Case Study - Heathrow airport uses a day-time runway alternation
scheme between 0600 and the last departure of the day when
aircraft land from the east/depart to the west (for historical reasons,
the scheme does not apply when aircraft land from the west/depart
to the east). The scheme runs over a two week rotating cycle
throughout the year and aims to provide residents under the flight
paths with a predictable break from noise. During week 1, the
northern runway is used for arriving aircraft until 1500, the southern
runway is then used for arrivals until the end of the day. On week 2,
the pattern is changed, with the southern runway being used for
arriving aircraft until 1500. During 0600-0700 arrivals can use both
runways, and alternation can be broken for safety and emergency
reasons. The airport publishes a yearly schedule outlining the
preferred operational direction and publicly reports daily on the use
of the preferred runway.
The runway in use is also rotated at night on a weekly basis.
Heathrow’s runway
alternation program,
source -
http://www.heathrow.c
om/noise/heathrow-
operations/runway-
alternationDepartures overwater
Arrivals overwater
Vancouver runway operations 2200 to 0700
Closure of Northern runway

w w w . a sk he l io s . c o m
Runway schemes – Case studies
18
Case Study - Amsterdam Schiphol operates both a day-time and
night-time preferential runway scheme. The schemes are based
upon a prioritised list of runway combinations, with the chosen
combination being based upon weather conditions. The daytime
preferences operate from 0600-2230, and the night-time preferences
from 2230-0600. The aim of the scheme is to focus aircraft noise into
least densely populated areas.
The airport makes use of an Environment-Aware Runway Allocation
Advice System developed by NLR, the Dutch National Aerospace
Laboratory. The system is connected to a metrological system and
therefore has up to information on current wind and visibility
conditions. Using a known database of preferential runway
directions, noise management procedures and situational inputs
such as runway availability and the status of navigational aids such
as the ILS, the system can provide recommendations on which
runway to use. The system can also provide forecasts, or what-if
analysis to inform future runway selections.
The system is connected to a wider environmental management
system which allows Schiphol to update the preferential runway
listing in response to runway utilisation. This process allows the
preferential runways to be re-prioritised to meet environmental
targets. The system records data on runway utilisation and this is
provided to communities to ensure transparency.
Runway preferences at Amsterdam Schiphol, Source:
https://www.lvnl.nl/en/environment/route-and-runway-use/runway-
preferences.html
A: Valid 0600 to 2300 hours local
Pref.Runway combinations
ARR 1 ARR 2 DEP 1 DEP2
Required
visibility - and
daylight
conditions
Good visibility
within UDP
1 06 36R 36L 36C
2 18R 18C 24 18L
3 06 36R 09 36L
4 27 18R 24 18L
Good visibility5a 36R 36C 36L 36C
5b 18R 18C 18L 18C
Marginal visibility6a 36R 36C 36L 09
6b 18R 18C 18L 24
B: Valid 2300 to 0600 hours local
Pref.Runway combinations
ARR 1 ARR 2 DEP 1 DEP2
Required
visibility - and
daylight
conditions
Good or marginal
visibility
1 06 - 36L -
2 18R - 24 -
3 36C - 36L -
4 18R - 18C -

w w w . a sk he l io s . c o m
Runway schemes – Case studies
19
Case Study - To investigate the potential benefits from a night
time runway rotation, Chicago O’Hare airport undertook a 25
week operational trial in 2016. The trial rotated the runways in
use at night on a weekly basis. The aim was to reduce noise
impacts at night and provide some predictability to this through a
25-week schedule published at the start of the trial (see extract
below). Each night the trial commenced at either 2200, or a
period thereafter when operations could be supported using a
single runway for arrivals, and a separate single runway for
departures. The trial ended at either 0700 or earlier when traffic
demand dictated.
Throughout the trial the airport tracked runway utilisation, noise
events and feedback using a survey. A public report was
generated at the end of the trial and showed 67% compliance
with the planned schedule. Reasons for non-compliance included
traffic demand at the start end of the night, runway inspections,
weather and pilot requests for specific runways. The airport has
since extend the trial into a second period.Case Study - Zurich airport has adopted a runway scheme
similar to Brussels which shifts traffic based upon time periods,
weekends and holidays as follows:
Case Study - between 2300 and 0600 and in low traffic periods,
Auckland airport makes use of a single opposing runway for
arrivals and departures to limit all noise exposure over water.
This effectively means that arrivals and departures face each
other on the same runway. As the procedure is only enacted in
very low traffic scenarios, such as late night/early morning both
arrivals and departures are never in conflict.
Runway Weekdays Weekends and German holidays
34 0500 to 0600 0500 to 0800
14 and 16 0600 to 20000800 to 1900 (Arrivals not allowed on
German Holidays)
28 2000 to 0500 1900 to 0500 An extract from the Chicago O’Hare runway rotation test schedule, source -
http://www.airportprojects.net/flyquiettest/wp-content/uploads/sites/2/2016/10/25-
Week-Schedule-1-page.pdfZurich airport runway scheme, source - SkyGuide Zurich AIP
Departures overwater
Arrivals overwater
Auckland runway operations 2300 to 0600

w w w . a sk he l io s . c o m
Runway schemes – Case studies
20
Case Study - Sydney airport’s Long Term Operating Plan (LTOP) was
introduced in response to community pressure to share noise around
the airport. The plan aims to share traffic around the airport according
to the following targets:
• 17% of movements to the North of the Airport
• 13% of movements to the East of the Airport
• 15% of movements to the West of the Airport
• 55% of movements to the South of the Airport
The LTOP defines ten different ways, or modes, of using the airports
three runways. The principal of LTOP is that when making selections of
the runway each day the Australian air traffic control body, Airservices
Australia, must ensure that, subject to safety and weather conditions:
• as many flights as practical come and go using flight paths over water or
non-residential areas where aircraft noise has the least impact on
people
• the rest of the air traffic is spread or shared over surrounding
communities as fairly as possible
• runway modes change throughout the day so individual areas have
some break (or respite) from aircraft noise on most days.
Some of the modes of operation are referred to a ‘noise sharing modes’
(mode 5, 7 and 14a). These procedures should be used whenever
possible on weekdays between 6am to 7am, 11am to 3pm and 8pm to
curfew.
Longer noise sharing hours apply at weekends. Long Term Operating Plan (LTOP) modes of operation-
http://sacf.infrastructure.gov.au/LTOP/files/LTOP_general
_information_fact_sheet_2015.pdf

w w w . a sk he l io s . c o m
Runway schemes – Case studies
21
Case Study (con’t) - Sydney airport, via Air Services Australia, reports
on runway usage against the LTOP targets on its public engagement
website. This information includes an interactive map which shows
runway utilisation including the number of arrivals, departures and
hours when the runway was not used and can be broken down by
aircraft type. On a separate tab, the runway utilisation figures are
reported against the LTOP targets.
The website is easy to navigate and provides a good level of
information for most readers however if more detailed information is
required, the website provides links to detailed monthly reports. The
reports, which are also produced by Air Services Australia, include a
breakdown of runway operations per runway and per day on an hourly
basis, the LTOP runway modes in use and the level of respite provided
over the corresponding flight paths.
(Above) online runway
utilisation, (right) extract from
detailed monthly LTOP report
showing respite provided,
source -
http://aircraftnoiseinfo.bksv.com
/sydney/
Monthly runway utilisation reported against LTOP targets for 2016 for movements to (i) the
north of the airport (left) and (ii) south of the airport (right), source -
http://aircraftnoiseinfo.bksv.com/sydney/

Research summary
Night flight restrictions

w w w . a sk he l io s . c o m
Introduction
Many airports define a night period where a different and
more stringent set of operating rules are applied compared
to the day-time. Examples of night time practices include
operating restrictions, night quotas, noise surcharges and
rules for managing airline operations in the night period,
including penalties if operations are off schedule.
Duration of the night period
Thirteen airports had defined night period of 6-9 hours in
duration, typically starting at 2200 or 2300 and ending at
0600 or 0700. Some airports applied the same restrictions
throughout the night, while others applied different levels of
stringency – typically at the start/end of the night period or
during the hours before/after the night period. These were
often less stringent than those applied during the night
period.
Typical practices
Operating restrictions: Restrictions applied include
movement limits, curfews/night-flight bans, restrictions on
the operation of certain (noisier) aircraft and runway used.
Night quotas: A small number of airports operate night
quotas. These schemes aim to manage the overall amount
of noise generated at night by having an overall noise
‘quota limit’ as well as a movement limit.
Each aircraft is allocated a number of points depending on
the amount of noise they produce (the louder the aircraft,
the more points allocated). The airport must operate within
a defined limit of night quota points as well as movement
limits.
Night noise surcharge: Airports that included a noise
element in their landing/take-off charges had a separate
day and night-time charge. This is typically a percentage
increase on top of the day-time charge.
Management of late running aircraft: Some airports have
rules applied to manage late running aircraft or have
protocols in place to allow dispensations for aircraft not
scheduled to operate in the night period that are running
late. In the case of the latter these often refer to exceptional
circumstances and require authority, or delegated authority,
from a government department. Some airports also have a
contingency set aside for off-schedule activity.
Penalties applied for non-conformance: Some airports
applied fines for non-conformance with night flight
restrictions.
Regional trends
More than half of the airports researched had defined a
night period although it was more common in Europe.
Airports without a defined night period were primarily those
in the Middle East and United States.
Night flight restrictions – Overview
23

w w w . a sk he l io s . c o m
Night flight restrictions - Best practice from around the world
• Night period starts at 2200 or 2300 and ends between 0400
and 0700. Some airports define night shoulder periods (Zurich)
or night quota periods (Heathrow, Gatwick, Brussels, Madrid).
• Night restrictions have noise at their core and are based on a
number of criteria: noise certification (MCC3 banned at
Amsterdam), quota system (Brussels, Gatwick, Heathrow,
Madrid), night curfew (Zurich), movement limits (Amsterdam,
Gatwick, Heathrow).
• Restrictions on scheduling and the operation of noisier aircraft
during the night period, or periods before or after the night
period (shoulder periods).
• Amsterdam, Charles de Gaulle, Madrid, Heathrow and Gatwick
either apply higher charges in the night period or make use of a
night noise surcharge.
• Changi restricts operations
on one runway between
0000 and 0600.
• Has a scheme to shift
noise away from residents.
• Night time restrictions vary across Canadian airports
starting between 2200 and 0001 and ending between 0600
and 0814. Variations in type of aircraft restricted.
• Pearson is the only airport with a night flight budget
(approximately 15,000 aircraft allowed per year). Number
of night flights allowed to grow with traffic.
• Montreal prohibits aircraft over 45 tons at night.
• Violations of night restrictions incurs fines of up to
CAD5000 for individuals and CAD25000 for corporations.
• Only John-Wayne has a night period. It
applies a night curfew from 2200 to 0700 on
weekdays and 2200 to 0800.
• John-Wayne has a sliding scale for
violations of the night time restrictions
($2,500 to $10,000).
• Other airports do not have penalties as no
night restrictions are in place. Penalties are
applied for violations with NAPs.
• No information on
night restrictions.
24
• Sydney has a night curfew which restricts operations
between 2300 and 0600. Auckland will soon introduce a
similar scheme as part of its 2nd runway. The curfew
times are adjusted at weekends.
• Curfew applies to aircraft based on several criteria
including weight, type, dispensations, missed
approaches.
• Sydney curfew is under Australian law and violations
incur a fine of up to AUD 650,000.

w w w . a sk he l io s . c o m
Duration of the night period
Of the 26 airports investigated, 13 had a defined night
period where a different and more stringent set of operating
rules where applied compared to the day-time. Night
periods were 6-9 hours in duration, typically starting at
2200 or 2300 and ending at 0600 or 0700.
Airports without a defined night period were primarily those
in the Middle East and United States.
Restrictions in the hours adjacent to the night period
Four airports also applied additional restrictions in the 1-2
hours adjacent to the night period. Often the
rules/restrictions applied in these hours were less stringent than those applied during the night period, but more
stringent than those in the day. Examples in these hours
included – gradual increasing of night-time charges and
restrictions on the noisiest aircraft types. Some airports
take a similar approach, but at the start/end of the night
period (see below).
Variation in rules/restrictions during the night-period
While many airports apply the same rules/ restrictions
throughout the night period, others apply different levels of
stringency throughout the night. Examples include having
less stringent restrictions at the start/end of the night
period, allowing a small number of aircraft per night to be
scheduled/operated at certain times and having periods
where no aircraft may operate.
Night flight restrictions – Duration of the night period
25

w w w . a sk he l io s . c o m
Introduction
Examples of the types of night-time operating restrictions
identified by the research are summarised below.
Movement limits
Four of the airports researched applied night-time
movement limits. These limits are either applied annually or
based upon scheduling seasons. Examples of movement
limits compared to Toronto are shown in the figure below.
Movement limits are set by legislation. For example,
Gatwick and Heathrow apply movement limits as part of
their quota count systems which are set by the Department
for Transport.
Amsterdam Schiphol airport is currently limited to 34,620
movements per year but this could be reduced this year to
32,000 due to delayed implementation of continuous
descent approach (CDA) operations.
Curfews/night flight bans
Frankfurt, John Wayne, Sydney and Zurich, airports have
bans/curfews on night flights.
• At Sydney there are restrictions on the number and type of
movements that can take place during the curfew (see
case study on page 33)
• At Frankfurt, the curfew runs from 2300-0500, with a limit
of 133 movements each night from 2100 to 2259.
• At Zurich a night-time curfew is in place between 2330-
0600, with the time between 2300-2330 used to reduce the
backlog of delayed flights. Landings/take-offs between
2330-0600 are only allowed in exceptional circumstance
and incur high charges (see Zurich case study later in this
document).
Night flight restrictions – Operating restrictions
26Figure: Movement limits during the night period
Source: Government legislation

w w w . a sk he l io s . c o m
Night-time restrictions on certain aircraft types
Airports apply restrictions on certain aircraft types, typically
based upon their Chapter number of certified noise levels.
• Chapter 2 bans: 18 of the 26 airports researched
implemented a total ban on ICAO Chapter 2 aircraft during
the night. Note that today, a limited number of those
aircraft are in use.
For aircraft quieter than Chapter 2, a range of different
approaches are used:
• Marginally compliant chapter 3 bans: Amsterdam
Schiphol, Brussels and Paris Charles de Gaulle airports
implemented a ban on aircraft whose Effective Perceived
Noise Level (EPNdB) was close to the limit of Chapter 3
standards.
• Shoulder hour restrictions: Frankfurt airport ban airlines
from scheduling marginally compliant Chapter 3 aircraft
between 1900-0700 (night period is 2300-0500). Only
Chapter 4 aircraft (which are quieter) are allowed to take
off between 2100-2200.
• Other examples: Airports with night quota systems (see
later pages in this section), restrict the
scheduling/operation of the noisiest aircraft types at night.
Several airports define criteria to restrict certain operations
at night. Montreal airport bans Chapter 3 aircraft that are
over 45 tonnes. Calgary airport is one example of an
airport that restricts Chapter 3 aircraft to certain runways at
night.
Runway restrictions
Some airports also place restrictions on which runways can
be used at night – see the ‘runway schemes’ section in this
document.
Night flight restrictions – Operating restrictions
27

w w w . a sk he l io s . c o m
Night flight restrictions – Night curfew case study (Sydney)
28
Runways
There are also restrictions on the runways that can be used:
• 2300-0600: Only runway 34L is allowed to be used for
landings during the daily and additional weekend hours
(unless assigned an alternative by ATC).
• 2245-2300: Only 16L or 16R can be used for take off.
• 0600-0700 and 2200-2245 (weekends only): Only 16L or
16R can be used.
Exemptions
Exemptions are granted in exceptional circumstances such as
emergencies or search and rescue operations
Penalties
If the curfew is breached, offenders can face criminal
prosecution and fines of up to AUD$550,000.
Other
There are also restrictions and conditions on the use of reverse
thrust and missed approaches.
Case study – Sydney airport night curfew
The Australian Government enacted the “Sydney Curfew Act
of 1995” to restrict aircraft movements during the night.
Specifically, the curfew includes the following:
Time
Movements are restricted daily between 2300-0600. There
are also additional restrictions daily during the shoulder
period between 2245-2300 and on weekends between 0600-
0700 and 2200-2300 on the runways that can be used.
Aircraft movements
During the curfew period take-offs and landings at the Airport
are restricted to specific types of aircraft and operations:
• Small (less than 34,000kg) noise certificated propeller
driven aircraft and ‘low noise’ jets (mostly business and
‘small’ freight jets—these are specified on a list which has
been Gazetted by the Minister) are allowed to operate
without a quota on the number of their movements
• 74 small freight (BAe146 size) aircraft are allowed to
operate per week.
• Between 0500 and 0600, 24 intercontinental arrival flights
are allowed to operate per week.
During the curfew aircraft must operate over Botany Bay, that
is take-offs to the south and landings to the north.

w w w . a sk he l io s . c o m
Night quotas
Brussels, Heathrow, Gatwick and Madrid all operate night
quota schemes. These schemes aim to manage the overall
amount of noise generated at night by having a noise
‘quota limit’.
Typically a number of quota points will be assigned to each
aircraft depending on the amount of noise they produce. In
the examples identified, this uses the certified noise levels
of an individual aircraft. The louder the aircraft, the more
points allocated (see example for Madrid below). For a
given duration of time (year or scheduling season) the
airport must operate within a defined number of night quota
points. Typically the night-quota period will also have a
movement limit.
Both the Belgium and UK quota systems also limit the
scheduling/operation of the noisiest aircraft types at certain
times of the night quota period (see example for Heathrow
opposite). For example, at Brussels take-off or landing of
aircraft with QC>12 is forbidden 0500-0559.
A case study of the UK night quota system is presented on
the next page.
Night flight restrictions – Night quotas
29
Night-time restrictions at Heathrow (source: Heathrow night flights fact sheet)
Madrid airport quota points allocation
Source: http://www.enaire.es/csee/Satellite/navegacion-
aerea/en/Page/1078418725163/?other=1083158950596&other2=1083857758835

w w w . a sk he l io s . c o m
Case study – UK night quota system
Heathrow, Gatwick and Stansted airports use a quota system
during the night quota period (2330 - 0600). This was first
established by the Department for Transport in 1993. The system
is based upon aircraft movements and noise (note that a
movement is defined as either a single departure or a single
arrival). Each aircraft is placed in a Quota Count (QC) band
according to their certified noise output. The band can be different
for a given aircraft, depending on whether it is departing or
arriving.
Each band is associated to a fixed number of Quota Count points.
The quietest band has 0 points and the loudest has 16 points
(note that aircraft with Quota Count 8 or 16 are banned from
operating in the night). In effect, the quieter the aircraft
movement, the lower the number of points awarded.
Each airport is granted a total quota limit for each season
which is applied in conjunction with a limit on movements.
This is shown in the table below.
Airports Coordination Limited (ACL) is the independent
organisation that allocates quota to airlines who wish to
operate in the night quota period. Some quota count is
retained by the airports as a contingency, for example in the
case of aircraft were scheduled to operate outside of the night
quota period, but for various reasons (e.g. mechanical failure,
weather, ATC delay) operate inside it.
In exceptional circumstance (e.g. prolonged disruption)
aircraft are granted dispensations to operate in the night
quota period with oversight provided by the Department for
Transport (i.e. their operation does not count against the
quota). The quota system is reviewed and consulted upon
every few years.
Night flight restrictions – Quota system
30
Quota count points per noise classification. Source:
https://www.gov.uk/government/uploads/system/uploads/attachm
ent_data/file/582863/night-flight-restrictions-at-heathrow-gatwick-
and-stansted.pdf
Quota count and movement limits for London airports. Source:
https://www.gov.uk/government/uploads/system/uploads/attachment_d
ata/file/582863/night-flight-restrictions-at-heathrow-gatwick-and-
stansted.pdf

w w w . a sk he l io s . c o m
Night-time noise charges
All 8 European airports that included a noise element in
their landing/take-off charges (see the quieter fleet section
for further information) had a separate day and night-time
charge.
The night-time charge is typically percentage on top of the
day-time charge. In the case of Amsterdam Schiphol and
Heathrow, charges are increased by a factor of 2-2.5 at
night. But in some cases the night-time charge can be 10
times higher.
Zurich airport applies a different approach – see case study
below.
Case study – night-time charges at Zurich airport
Zurich airport have a ban/curfew on flights between 2330-
0600 although in exceptional circumstances some flights are
allowed.
A noise surcharge is levied between 2100 and 0700 local to
cover both the night hours and shoulder periods. Charges
increase from 2100 until 0600 and then reduce for operations
between 0600-0700. After 0700 the night noise surcharge no
longer applies.
Charges also increase if the aircraft is in a higher noise class.
The discrepancy between the charge applied to aircraft is
significant. For example, an aircraft operating at 0030 in the
noisiest class (class 1) will be charged CHF18,000 whereas
an aircraft operating at 2130 in the quietest class (class 5) will
be charged CHF40. The charges (in CHF) are as follows):
Night flight restrictions – Night-time noise charges
31
Charg
es i
ncre
ase f
rom
2100 u
ntil
0600
Charges increase if
the aircraft is noisier
Night noise surcharges at Zurich airport
Source: https://www.zurich-airport.com/business-and-partners/flight-
operations/charges

w w w . a sk he l io s . c o m
Management of aircraft running late or arriving early in
the night period
Some airports have protocols in place to allow
dispensations for aircraft not scheduled to operate in the
night period that are running late or early. These often refer
to exceptional circumstances and require authority, or
delegated authority, from a government department.
Examples include:
• The Transport Minister is able to given dispensations
(permission) to aircraft operating late or early into Sydney
airport’s curfew period
• At Brussels airport, aircraft operating late or early into the
night period must be given an exemption by the national
CAA.
• Heathrow and Gatwick airport can given dispensations to
aircraft running late/early. This power is delegated to them
by the Department for Transport. In addition, the quota
schemes has a ‘pool’ set aside for off-schedule activity.
Additionally, airports also apply some latitude for late
running aircraft. Taking Frankfurt as an example:
• Chapter 3 aircraft (which are banned between 1900-0700)
are allowed to operate until 2100 or from 0500 if they are
running late or early as long as the delay was not foreseen.
• Chapter 4 aircraft scheduled to land between 2100-2200
are permitted to land until 2300.
Penalties for non-conformance/late running –
Overview of research
A number of airports were also found to apply penalties for
non-conformance with night time restrictions. Examples
identified were:
• At Toronto Pearson the penalty for non-conformance with
restrictions is 16 times landing fee. Further enforcement
action may be taken by Transport Canada.
• Across the rest of Canada, fines are applied by Transport
Canada for violations. This is up to CAD$5,000 for
individuals and CAD$25,000 for corporations.
• John Wayne Airport applies fines on a sliding scale. For
the first 5 violations with night time restrictions the penalty
is $2,500 per issue (i.e. if two rules were broken then the
aircraft operator would be fined $5,000). The next 5
violations attract fines of $3,500-$5,000 per issue. For the
next 10 it is $5,000-$10,000 per issue.
• Violations of the curfew at Sydney airport can incur fines of
up to AUS$850,000. This is administered by the
Department for Infrastructure and Transport.
Night flight restrictions – Other practices
32

Research summary
Noise abatement procedures

w w w . a sk he l io s . c o m
Introduction
The noise generated by aircraft arriving and departing an
airport can be influenced by the procedures used by the
flight crew and air traffic control. A range practices and
operational procedures can be employed to manage the
noise generated by aircraft in these phases of flight.
Common practices
Many of the arrival and departure practices and operational
procedures are in common use at the airports researched.
These includes:
Arriving aircraft:
• Continuous Descent Approaches (CDA), where the aircraft
approaches the runway using a ‘consistent’ descent angle.
• Altitude restrictions during the approach to an airport;
• Advisory restrictions on the use of reverse thrust in night
and off peak periods.
Departing aircraft:
• Noise Abatement Departure Procedures (NADP) 1 and 2.
These are internationally recognised procedures intended
to provide noise reduction to those areas close to the
airport (NADP1) or to those areas further away (NADP2)
• Altitude restrictions limiting early turns;
• The application of noise limits for departures.
Special and unique practices
In addition to the common practices, a number of initiatives
have been developed to either solve a local issue or as a
creative and innovative solution to noise management. The
initiatives in this area include
Arriving aircraft:
• The combination of CDA and Low Power Low Drag (LPLD)
operations;
• The joint development and introduction of an arrivals code
of practice by airports, airlines and air traffic control;
• Swing-over arrivals when the aircraft approaches a pair of
parallel runways. The approach is made to one runway
with a visual manoeuver to land on the neighbouring
runway.
• Steeper approaches such as a 3.2 degree glideslope.
Departing aircraft:
• The joint development and introduction of a departures
code of practice.
• Continuous Climb Operations (CCO).
Trials
In addition this section has also researched practices in the
management and communication of trials.
Noise abatement procedures - Overview
34
1a continuous descent may not necessarily involve a continuous descent, level segments are permitted within the researched definitions. Level segments are often used to aid aircraft to slow
down at the start of the descent without the use of the flaps / speed brake.

w w w . a sk he l io s . c o m
Noise abatement procedures - Best practice from around the world
35
• UK airports arrivals and departures code’s of practice.
• CDAs are commonly used at all airports, however
definition varies along with the applicable time periods.
• LPLD used at both London, Madrid and Zurich airports.
• NADP 1 or 2 used at almost all airports.
• P-RNAV and PBN used at the majority of airports
however this is mostly a straight replacement for the
legacy SID.
• Early turns are not typically used, however ‘noise
preferential routes’ are applied.
• Airports used mini-websites to report on trials activities,
which provide updates on progress along with trial
reports.
• Steeper approaches (3.2⁰) have been trialed at Heathrow
and Frankfurt with limited improvements in noise seen.
• Frankfurt uses ‘swing over’ visual approaches to shift to
a parallel runway up to 4 NM from touchdown to avoid
directly overflying specific areas.
• CDA used based upon
vectored approach/RNAV
implementation.
• NADP 1 or 2 used on
departure at Hong Kong.
• Early turns are not used to
maintain straight out
departure over the water
at Hong Kong.
• CDAs used by NAV CANADA where possible, although its more commonly used on RNAV STARs.
• Vancouver request pilots to use LPLD approaches.
• NADP 1 or 2 used and altitude restrictions in place to limit turns post departure, applied in some
areas to limit noise impact / maintain operations over industrial areas.
• Websites used to communicate information on trials such as P-RNAV/PBN implementation.
• Early turns are used to allow prop aircraft to exit the departure flow.
• CDA not commonly used however are
seen as a future step as part of NextGen
and have been trialled at San Francisco.
• Implementation of departure procedures
linked to P-RNAV implementation including
FAA AC 91-53A NADP procedure.
• Some early turns used at San Francisco
and Chicago O’Hare to keep noise over
industrial areas.
• Airports operate trials websites (NextGen
program) which include detailed
information, consultation, environmental
reviews and workshop materials.
• NADP 1 or 2 used at
Istanbul Ataturk.
• CDA implemented using P-RNAV STARs.
• ILS joining point at 14nm and 4,000ft to keep
aircraft higher on approach.
• ICAO NADP 1 or 2 used on departures.
• Early turns are not allowed and 3,000ft limit
applied before turns can be commenced.
• Websites used for trials covering PBN
implementation, includes status updates,
consultations and output documents.

w w w . a sk he l io s . c o m
Arrivals procedures - overview
Twenty-two of the 26 airports researched prescribed at
least one procedure or practice to manage noise from
arriving aircraft. Often more than one initiative was used
with the most common being the use of Continuous
Descent Approaches (CDA) and the application of altitude
limitations during the approach phase of flight.
Continuous Descent Approaches
Conventional approaches to an airport involve phases of
level flight, as shown in the diagram on the upper right. A
Continuous Descent Approach (CDA) aims to reduce the
amount of time an aircraft remains in level flight during the
approach phase. Doing so offers the opportunity to reduce
noise, emissions and fuel burn along the approach path
(see case study for Amsterdam on following sides).
Work by the UK CAA shows CDAs to provide noise
reductions of up to 2.5 to 5 dB, varying over distances from
touchdown of 10 to 25nm1. The noise reduction is achieved
by keeping the aircraft higher for longer and allowing the
aircraft to maintain a managed gliding approach using low
to idle thrust setting.
Although sounding simple in theory, in practice it is difficult
to currently enable CDAs to be flown without any level flight
in the busy traffic environment experienced at international
airports. For this reason airports tend to either operate less
stringent definitions of CDAs which allow some periods of
level flight (UK case study on the next page), thereby
achieving some of the noise benefits of CDA throughout
the day. At other airports, CDAs are only used at night or
other periods of low traffic density.
Noise abatement procedures - Arrivals
36
0
2
4
6
8
10
12
14
CDA CDA/LPLD Reverse thrust Altitude limits
Num
be
r o
f a
irp
ort
s
ap
ply
ing
pra
ctice
s
The procedures which airports apply to manage arrival noise
Typical stepped approach
vs a typical CDA
1 CAA Paper 1165, Managing Aviation Noise, UK Civil Aviation Authority, 2014.

w w w . a sk he l io s . c o m
Nine of the airports researched made reference to CDA
procedures, although only 4 actively used CDA at all
operational times. The remaining airports had implemented
CDA as part of an RNAV or PBN arrival routing which was
not in use at all times.
Although the majority of airports make use of new
navigational technology, it is possible to undertake a CDA
using radar vectoring (the provision of direction, speed and
altitude commands by air traffic control to pilots).
Continuous Descent Approaches and Low Power Low
Drag
When an aircraft extends its flaps and undercarriage on
approach this disturbs the airflow around the aircraft and
creates noise.
Low Power Low Drag procedures are intended to safely
delay the extension of flaps and undercarriage. In the
United Kingdom LPLD is defined as “a noise abatement
technique for arriving aircraft in which the pilot delays the
extension of wing flaps and undercarriage until the final
stages of the approach, subject to compliance with ATC
speed control requirements and the safe operation of the
aircraft.”
Noise abatement procedures - Arrivals
37
Case Study - CDA definitions vary around the world as follows:
EUROCONTROL define CDA as follows: ‘Continuous Descent
Approach is an aircraft operating technique in which an arriving
aircraft descends from an optimal position with minimum thrust and
avoids level flight to the extent permitted by the safe operation of
the aircraft and compliance with published procedures and ATC
instructions’.
The UK use the following wording in the AIP: ‘A descent will be
deemed to have been continuous provided that no segment of
level flight longer than 2.5 nautical miles (nm) occurs below 60001
ft QNH (FL070) and ‘level flight’ is interpreted as any segment of
flight having a height change of not more than 50 ft over a track
distance of 2 nm or more, as recorded in the airport noise and
track-keeping system.
1 Not all airports in the UK start CDA at this altitude as it can vary due to airspace, for example Gatwick commences CDA at 7,000ft and Luton from 5,000ft.
Frankfurt use the following wording in the AIP: ‘pilots should expect
a clearance to descend below FL 70 only 6 NM prior to reaching
the above-mentioned points. Pilots should adjust their speed
accordingly (approx. 200 – 220 kt when leaving FL 70) and are
urgently requested to perform their descent from FL 70 as a
continuous descent whenever possible’.
Schiphol use the following wording in the AIP: ‘Executing a CDA
implies that after NIRSI, NARIX or SOKSI a continuously
descending flight path without level segments is to be flown in a
low power and low drag configuration. A flight path is considered
continuously descending when there is no level segment. A
segment is considered level if the altitude loss is less than 50 ft
over a distance of 2.5 NM’.

w w w . a sk he l io s . c o m
Work by the UK CAA shows LPLD can deliver reduction of
between 3 to 5dB1.
Low Power Low Drag (LPLD) can be combined with a CDA
to ensure the aircraft maintains a low noise configuration,
with a reduced flap setting and the delayed deployment of
the landing gear for as long as possible. 8 airports, mainly
in Europe, prescribe the use of LPLD procedures in the AIP
alongside CDA. Although the exact wording used is
typically non-descript.
Noise abatement procedures - Arrivals
38
1 CAA Paper 1165, Managing Aviation Noise, UK Civil Aviation Authority, 2014.
Case Study - LPLD definitions vary around the world as
follows:
Heathrow and Gatwick use the following LPLD wording in the
AIP: ‘Where the aircraft is approaching the aerodrome to land it
shall, commensurate with its ATC clearance, minimise noise
disturbance by the use of continuous descent and low power,
low drag operating procedures’.
Schiphol use the following LPLD wording in the AIP: ‘Executing
a CDA implies that after NIRSI, NARIX or SOKSI a
continuously descending flight path without level segments is
to be flown in a low power and low drag configuration’.
Vancouver use the following LPLD wording in the AIP: ‘Use low
power/drag profiles consistent with safe operating procedures,
conforming to published visual approaches and as directed by
ATC’.
Hong Kong use the following LPLD wording in the AIP: ‘During
a CDA pilots should maintain a low thrust setting and should
not have recourse to level flight.’
Case Study - Amsterdam Schiphol uses P-RNAV routing to
accurately direct aircraft on approach to the ILS in the night
period between 2300 to 0600 making use of both CDA and
LPLD.
The procedure has been specifically designed for night time
operations and commences around 30 nautical miles from the
airport. Aircraft are directed onto the P-RNAV routing, which
has been carefully designed to maintain a vertical path direct to
the ILS. An LPLD configuration with minimal thrust setting is
maintained throughout, providing an optimum low noise
approach. Whilst the lateral path was designed to minimise
overflight of noise sensitive areas.
The introduction of the procedure has reduced the ‘noise
footprint’ of a Boeing 747-400 aircraft by 20km as shown in the
figure on the next page. (Continued)

w w w . a sk he l io s . c o m
Altitude Limits
Thirteen airports applied specific altitude limits within their
noise abatement procedures, these restrictions focus on:
• Restricting the altitude at which aircraft can join the
glideslope/Instrument Landing System (ILS);
• Specifying altitude limits over noise sensitive areas such
as urbanised areas.
In all situations, the restrictions aimed to increase the
altitude of aircraft and keep them higher for longer thus
reducing the impact of noise.
Noise abatement procedures - Arrivals
39
According to the Netherlands slot coordinator (SACN), the
implementation of CDAs is delayed and Amsterdam Airport
Schiphol is facing temporary environmental restrictions in order to
compensate this. Due to these temporary restrictions, a further
reduction of night movements to 29,000 per year (from 34,620) is
expected within a maximum of three years’ time.
Reports via the Environmental Council Schiphol note that the
difficulty in implementing CDA is due to the nature of the RNAV
CDA arrival routing, limiting capacity to a level where it is not
sustainable given the current airport and network traffic levels.
Source: NLR Research Paper,
environmental benefits of CDA at
Schiphol Airport NLR-TP-2000-275
Noise footprint comparison between
CDA and typical approach for a B744
Distance from airport (km)
Altitude
Case Study - Auckland airport applies altitude restrictions in its
AIP. The entry notes that ‘Except when operating in accordance
with an instrument approach procedure… aircraft must not be
flown over the high density population areas of greater Auckland
city at an altitude of less than 5000 ft. The boundaries of these
high density population areas are defined in the Auckland Noise
Abatement Chart’. The Auckland noise abatement chart provides
a map of the area around the airport and clearly marks areas of
high population density for which this restriction applies.
Case Study - Los Angeles airport applies restrictions on
helicopter flights over the city requiring operators to avoid flying
below 2,000ft during the day and not flying over the city between
2200 and 0700 local.
Case Study - Heathrow airport applies restrictions on the ILS
joining point and does not permit aircraft to join the ILS below
2500ft in the day (0600 to 2330 local) and 3000ft or 10nm in the
night.

w w w . a sk he l io s . c o m
Reverse thrust
Nine of the airports researched have voluntary restrictions
on use of reverse thrust on landing where pilots were
asked to minimise the use of reverse thrust unless it was
required to maintain safety. The majority of airports applied
these restrictions in the overnight period only.
Additional noise based restrictions
The research also highlighted a number of specific
practices applied at individual airports. These included:
• Voluntary industry code of practice: In the UK, the
Department for Transport, Civil Aviation Authority, airports,
airlines, the air navigation service provider developed an
industry code of practice for noise from arriving aircraft.
The document defines options to reduce approach noise
including the implementation of CDA and LPLD procedures
and provides guidance to air traffic control, flight crews and
airports on how to deliver improvements.
The document also reports on improvements made since
the work commenced including the benefits made to air
traffic controller training and the improvements seen in
CDA compliance. The document was widely circulated
within the industry and is publicly available on the
Sustainable Aviation website1.
• Swing over arrivals: This is a visual procedure
implemented at Frankfurt airport to reduce the impact of
noise on populations living under the approach path to one
of the airports runways (runway 25C). The procedure is
outlined in the figure below. It requires the crew to initially
fly an approach to runway 25C using the approach path for
runway 25L. At any point on the approach, but not less
than 1,000ft AGL (above ground level) and 4 nautical miles
from touchdown, the pilot will visually manoeuver the
aircraft onto the approach path for runway 25C.
Noise abatement procedures - Arrivals
40
Case Study - Madrid Barajas restricts the use of reverse thrust
in the night period with the following wording contained within its
AIP, The use of reverse thrust above from idle regime is
prohibited at night time (2300-0700 LT) except if necessary for
safety reasons, in this case, it must be notified to TWR and the
Departamento de Medio Ambiente of the airport.
25 L
25 C
Approach path if continued
Town under approach path
Swing-over procedure
Typical approach path
The swing-over approach procedure in use at Frankfurt
1 http://www.sustainableaviation.co.uk/wp-content/uploads/2015/09/Noise-from-Arriving-Aircraft-%E2%80%93-An-Industry-Code-of-Practice1.pdf

w w w . a sk he l io s . c o m
Steeper Approaches
Steeper approaches have recently been trialled at both
Frankfurt and Heathrow. A steeper approaches involves
flying along the instrument landing system at a slightly
steeper angle, of 3.2 degrees in comparison to the typical 3
degrees. The increase in approach angle increases the
height of arriving aircraft and therefore reduces the noise
for aircraft closest to the airport.
Departure procedures - overview
Twenty three of the 26 airports researched applied
procedures to manage the noise from departing aircraft.
Often more than one initiative was used with the most
common being the use of Noise Abatement Departure
Procedures (NADP), or the use of a similar procedure.
Noise Abatement Departure Procedures, or similar
Noise Abatement Departure Procedures (NADP) involve
operating an aircraft in a way as to reduce noise close to
the airport or at a distance away and focus on the point at
which engine thrust is reduced on departure (see diagram
on next page).
NADP is an ICAO defined procedure and are listed within
an appendix to Chapter 3, departure procedures, of ICAO
Doc 8168 PANS-OPS Part 1. (continued)
Case Study - Heathrow airport conducted a trial on a slightly
steeper approach angle of 3.2 degrees. To maintain normal
operations when the steeper approach was not in use, the 3.2
degree glide path was implemented with RNAV. The trial ran for 6
months and no adverse impacts identified in terms of go-arounds
and complaints. The trial did identify a small improvement in noise,
however this was small with an average reduction of 0.5dBA and a
maximum reduction of 1.4dBA SEL. The A380 was the only
aircraft to achieve the full 3.2 degree slope and thus provided the
greatest noise reduction.
Noise abatement procedures - Arrivals and Departures
41
0
5
10
15
NADP or similar Turn restrictions Altitude limits
Num
be
r o
f a
irp
ort
s
ap
ply
ing
pra
ctice
s
The procedures which airports apply to manage departure noise
Heathrow airport
steeper approach
angles
Source -
http://www.heathro
w.com/noise/latest
-news/steeper-
approach-trial-
report/

w w w . a sk he l io s . c o m
Fourteen of the researched airports either prescribed the
use of Noise Abatement Departure Procedures 1 and 2
(NADP1/NADP2) or made use of an equivalent procedures
which was either described or referenced to another
document such as the FAA Advisor Circular AC91-53A.
The procedures reduce departure noise by either:
• NADP1: Reducing noise impact close to the airport by
requiring aircraft to climb quickly by using; or
• NADP2: Reduce the noise impact at an increased distance
from the airport when the airport climbs quickly initially
before transitioning into a low drag configuration with a
reduced power setting.
Of the airports which prescribed NADP, only Amsterdam
Schiphol recommended the use of a single procedure (NADP
2) but permitted the use of NADP 1 if it was not possible to
comply with NADP 2. All other airports were non-prescriptive
and simply required the use of NADP 1 or 2.
Departure routes – altitude restrictions
A total of 7 airports applied altitude restrictions on the
minimum altitude before air traffic control were allowed to
vector aircraft off the departure route. The minimum altitude
varied between airports but typically remained between
2,000 and 6,500ft. This aimed to limit the noise exposure of
departing aircraft to a specific area.
Noise abatement procedures - Departures
42
Case Study - A study carried out by NLR, the Dutch Aeronautical
Research Institute, at Schiphol investigated the implementation of
NADP 2 in comparison to NADP 1. The study conducted a robust
test using a scientific sampling group to determine the fuel saving,
noise exposure and community annoyance levels following the
implementation of NADP 2. Testing took place using Boeing 737-
800 and 767-300 and showed a:
• reduction in fuel burn of between 20 to 60kg,
• a reduction in SEL dB(A) if up to 2.2dB.
The study noted that this could provide “a reduction in the number
of highly annoyed or sleep deprived people in the vicinity of
Schiphol”.
Distance from airport
Altitude
Take-off Thrust V2 + 10 to 20 kts
Climb thrust +
10 to 20 ktsClimb thrust Accelerate to flaps
up speed and retract flaps
Climb thrust Accelerate to flaps
up speed and retract flaps
Normal climb speed and thrust
800ft AGL
3,000ft AGL
Comparison between NADP 1 and NADP 2 procedures
NADP 1
NADP 2
Case Study - Vancouver airport applies SID departure
restrictions within the Canada Air Pilot. The restrictions require
the use of NADP 1 or 2, and pilots to follow the SID to 3,000ft or
2,000ft on runway 08R before proceeding on course.

w w w . a sk he l io s . c o m
Continuous climb operations
Continuous Climb Operations (CCO) are an aircraft
operating technique facilitated by airspace and procedure
design to execute an optimised departure profile. It
commences at lift off and continues to cruise level with no
level segments providing a reduction fuel burn and
emissions. The Sustainable Aviation Departures code of
practice notes the main benefit is in terms of fuel and
emissions with reductions of 50kg on an A320 to 475kg on
a B747 with a continuous climb to 6,000ft. The overall noise
benefit is neutral.
As CCO focuses on the climb from lift off to cruise level it is
often a concern of the Air Navigation Service Provider
(ANSP) rather than the airport. Our research has shown
that the ANSPs in the UK and Denmark facilitate CCO.
Whilst SESAR trials have been undertaken at Paris Charles
de Gaulle and Frankfurt are currently developing CCO
procedures with DFS, the German ANSP.
Departure routes - early turns
Early turns are typically used to allow slower aircraft such
as propeller driven aircraft to exit the main departure flow
(e.g. to maintain safe separation between faster jet powered
aircraft that can catch-up with the slower propeller powered
aircraft).
They can also be used to manage departure noise (e.g. by
turning aircraft off the extended centreline before the aircraft
reaches and overfly residential areas).
Of the 26 airports researched, 8 had procedures covering
early turns, this included:
• 5 which restricted early turns and required aircraft to either
maintain the centreline or SID routing, usually though the
application of altitude restrictions.
• 3 which allowed early turns, this typically was only allowed
on certain aircraft types (e.g. propeller) by reducing the
altitude restrictions applied.
Of the 3 airports which allowed early turns, these could be
started shortly after take-off and 2 of the 3 airports used
early turns to allow aircraft to take-off and turn before
reaching noise sensitive areas.
Noise abatement procedures - Departures
43
Case Study - As part of its Fly Quiet program, San Francisco airport
uses early turns to minimise noise disturbance over residential
areas, early turns are used keep noise over mainly industrial areas
and business parks. As part of its fly quiet program, the airport tracks
airline performance on this turn by measuring the distance from the
turn to a local highway, beyond which, the residential area exists.
The airport publicly reports this compliance figure.
Case Study - In the UK, CCO procedures have been promoted since
2006 when 55% of departures operated CCO to 10,000ft, that figure
has since risen to 67% in 2014.
Due to airspace constraints, wherever possible CCO is facilitated to
the cruise level and NATS, the UK ANSP, reached an agreement
with DSNA, the French ANSP, to coordinate with the Paris and Brest
Area Control Centres to allow CCO to FL290 with 260 aircraft per
day using this new profile in 2015. Further improvements in CCO are
planned as part of the future airspace strategy as part of the
restructuring of UK airspace.

w w w . a sk he l io s . c o m
Departure noise restrictions
Four of the airports researched measured the noise
generated by departing aircraft. Noise limits were set with
financial penalties applied if the limits were breached.
The noise restrictions were as follows:
• New York JFK: limit set at 112.9 PNdB as measured using
noise monitors at the end of the runway.
• Heathrow and Gatwick: Limits set according to time
period as follows, using noise monitors under the
departure routes:
• Day, 0700 to 2300 94 dBA Lmax,
• ‘Shoulder’, 2300 to 2330 and 0600 to 0700 89 dBA
Lmax,
• Night, 2330 to 0600 87 dBA Lmax.
Both Heathrow and Gatwick apply fines for aircraft which
breach these noise limits. Fines range between £500 and
£1000 and are paid into the airport community fund.
• John Wayne: limits noise on both arrival and departure.
Limits are based upon aircraft category with noise levels
set at each noise monitor. These level range between the
following limits:
• Class A, 102.5 dB to 93.7 dB SENEL,
• Class E, 94.1 dB to 86.6 dB SENEL.
If an aircraft breaches the noise limits, the airport can
either apply a fine of up to $500,000 USD and it may also
ban the operator from operating for up to half a year.
Noise abatement procedures - Departures
44
Case Study - John-Wayne airport is surrounded by noise sensitive
areas which a particular concentration to the south of the airport
under the main departure path.
Previously the departure routings were based upon older ground
based navigational aids which led to dispersion over the noise
sensitive area and due to the extensive noise abatement
techniques employed by the airport, the issue was not a major
annoyance to the community. The recent move to satellite based
navigation systems such as PBN and RNAV has improved
navigational accuracy but at the same time this has resulted in a
concentration of departing aircraft.
Attempts by the FAA to
improve the situation have
not delivered an improvement
in dispersal. In 2013, the City
of Newport Beach contracted
GE Aviation to undertake a
study to investigate the
feasibility of a curved PBN
departure routing to mainly
overfly the river/bay and
non-noise sensitive areas.
The study concluded that
although the problem is
complex, the curved
departure routing is possible
and the city should engage
with the FAA to develop this
solution further.
Typical
flight
path
Example
future
PBN SID
John Wayne Airport Departure Feasibility
Study, Source -
http://www.newportbeachca.gov/home/showd
ocument?id=15548

w w w . a sk he l io s . c o m
Voluntary industry code of practice
Similar to the arrivals code of practice, in the UK industry
partners have developed a code of practice for departing
aircraft to align and improve operations.
The document defines options to reduce departure noise
through the implementation of systems to reduce APU
usage, implement reduced engine taxi, introduce Airport
Collaborative Decision Making systems and Continuous
Climb Operations. In particular it investigates the feasibility
of CCO, its impacts, and measurement techniques.
The document provides guidance to air traffic control, flight
crews and airports on how to deliver improvements. It was
widely circulated within the industry and is publicly
available on the Sustainable Aviation website1.
Trials
The airports researched did not list their processes or
procedures for trials. Of the airports researched, Sydney,
Auckland and the US airports (as part of the FAA NextGen
program) had information available. This information
typically took the form of a dedicated website and if a trial
was currently ongoing, the websites included information
on:
• Trial routes,
• Reasons for testing and selection of routes,
• Consultations and outcomes,
• Ways to provide feedback.
If no trials were ongoing, summary information was
provided on the most recently completed trial along with
links to the trial completion reports which provided
additional information.
Noise abatement procedures - Departures and Airspace Trials
45
Case Study - In addition to the airspace trial website, Sydney
airport undertakes a dedicated and proactive process to engage
with the public as part of infrastructure and airspace changes. The
most recent engagement was undertaken as part of a runway
upgrade and involved the following actions:
• Setup and management of phone lines for comments.
• Directed emails providing information and updates.
• Adverts in the local media.
• Production and distribution of information brochures to over 100,000
residences.
• The organisation of community and stakeholder consultation
meetings.
• The organisation of community question and answer sessions.
• Door to door visits.
Air Services Australia,
Sydney airport,
investigations and
consultations page
Source -
http://aircraftnoiseinfo.bks
v.com/sydney/noise-
improvements-
community-consultation/
1 http://www.sustainableaviation.co.uk/wp-content/uploads/2015/09/Departures-Code-of-Practice-June-2012.pdf

Research summary
Ground and gate operations

w w w . a sk he l io s . c o m
Introduction
Restrictions are often applied to activities on the airport
surface (taxiways/aircraft parking positions etc.) to reduce
the impact of ground noise on the local area.
The restrictions focus on two areas:
• Restricting engine testing which can be required following
routine and specific engineering works on the aircraft.
• Restriction the use of the Auxiliary Power Unit (APU), a
small jet engine usually located in the tail of the aircraft. It
is used to provide electrical power and air conditioning
when the main engines are off. It also provides power to
start the start the main engines.
Typical practices
Engine testing restrictions typically take the form of
limiting the times at which ground runs can take place (i.e.
not during the night), as well as associated limits on the
duration and engine power settings.
Engine testing restrictions can also specify the locations
where testing can take place, such as a remote location or
within a ground run pen.
A small number of airports have introduced monitoring
systems to check compliance with any restrictions. For
example, Los Angeles (LAX) have made this monitoring
system publicly available.
Auxiliary Power Unit (APU) restrictions limit the time
period they can be used when the aircraft is on the ground
and/or parked on the stand – for example limits on the
amount of time an APU can be used (i) after arriving on
stand and (ii) before the scheduled time of departure.
The restrictions require the aircraft to make use of the fixed
ground power units rather than the APU.
Some airports also undertake monitoring to track
compliance.
Regional trends
Almost all airports surveyed, with the exception of airports
located in the Middle-East, were found to apply some form
of restriction, or practice to reduce the impact of ground
noise from aircraft. However, both the stringency of
restrictions and time period for which they were active
varied. Due to the close proximity of airports to residential
areas, rules for ground runs and APU usage tended to be
more restrictive in Europe.
Special and unique practices
Landscaping can be used to limit the propagation of
sound emanating form the airport. A large scale system in
Schiphol has reduced ground noise by 2-3dB and took two
years to construct.
Reduced engine taxi or electric tugs can be used to
reduce engine usage on the ground either by operating on
a single engine or by using a system to manoeuvre the
aircraft without the use of its engines.
Ground and gate operations - Overview
47

w w w . a sk he l io s . c o m
Ground and gate operations - Best practice from around the world
48
• Almost all airports limit engine testing in the
overnight period.
• Like the US some airports, Frankfurt monitors
ground running with a 57dbA limit in the day
and 50dBA at night.
• Prescriptive limits are applied for APU usage
on stands this includes time limits.
• Limits on reverse thrust on landing including a
ban (unless safety requires) in the overnight
period.
• Pilots are requested to use ‘minimal thrust’
when manoeuvring.
• Landscaping used for ‘sound barriers’.
• Limited restrictions on engine
ground running locations and
test durations.
• No APU restrictions could be
found.
• Engine run ups at high RPMs or ‘noisy’ aircraft are
restricted in the overnight period.
• Vancouver has built a ground run up pen which reduced
ground noise by 50% (15dB).
• Airports tend to have ground power units and
preconditioned air-conditioning units installed at the gate,
but requirements to make use of these systems are not
applied.
• Montreal and Air Transat are trialling a ‘wheel tug’ system.
• Engine ground runs are restricted in the
overnight period.
• San Francisco and Los Angeles and have
ground running monitoring systems. The system
at LA is publicly available.
• APU usage is limited on stands at noise
sensitive airports such as Los Angeles, San
Francisco and John-Wayne. But restrictions are
not typically applied at the other airports.
• Los Angeles and Chicago O’Hare have
constructed ‘sound barriers’ around the airport
perimeter to reduce the noise impact.
• Istanbul Ataturk has prescriptive APU
operating limits and restricts engine
ground running in the night period.
• Limitations on engine testing, Auckland track noise
using a 7 day rolling average of 55 dBA LDN with
a 75dBA Lmax limit in the overnight period.
• Sydney supports the use of single engine taxi and
reduced APU usage on stand.

w w w . a sk he l io s . c o m
Overview of research
The research highlighted that the majority of airports apply
a limitation on engine run ups, with a sub-set applying
additional restrictions.
Although the specific nature of these limitations varied they
generally limited the number of ground runs, duration and
power settings during the night. The night-time period was
defined anywhere between 2100 and 0700, with the most
common definition being between 2300 and 0700. In this
period 11 restricted ground testing by applying power,
location, time limits or an outright ban on testing. A chart on
the next page provides an overview of this practice.
The six airports which applied additional initiatives to
manage the noise generated by ground runs included (also
see separate case studies):
• Purpose built ground run-up pens
• Monitoring systems to manage, approve or decline engine
testing requests.
• Reporting on the number of engine run ups that took place
in either the last month, quarter or year.
Case Study - Both Vancouver
and Chicago O’Hare have installed
a ground run up pen. The pens
work by either diverting or
absorbing sound and reduce
ground noise from engine running
by up to 50% or between 10 to
15 dB. Although the pen reduces
the sound, the same engine testing
restrictions apply as if it was taking
place outside the pen.
Case Study - Both Los Angeles
And San Francisco have engine
testing monitoring systems
consisting of cameras and sound
monitors. The system is used to
track compliance with the
restrictions and the approved
testing request. The system at
Los Angeles is publicly available
through a website address as
shown across.
Ground and gate operations - Engine run ups
The ground run-up enclosure at
Vancouver airport Source:
http://www.yvr.ca/en/about-yvr/noise-
management/ground-run-up-enclosure
The publicly available ground running
monitoring system at Los Angeles
Airport Source:
http://wama.airportnetwork.com/
Airports applying engine run up restrictions
6 Airports applying a
limitation on engine
run ups
15
5
Additional noise
management initiatives
No publicly available
information
Case Study - In Auckland, engine ground testing is monitored
using a maximum noise value of 55dBA Ldn with an Lmax of
75dBA over a 7 day period. Effectively moderating the noise
output from engine testing over a weekly period.
49

w w w . a sk he l io s . c o m
Ground and gate operations - Engine run up benchmarking
50

w w w . a sk he l io s . c o m
Overview of research
Just over 50% airport researched with information available
applied some form of restriction on the use of APU.
The restrictions varied in terms of stringency, but all
intended minimise use of the APU when the aircraft is on
the stand with the restrictions using the following wording
‘the APU should be shutdown as soon as practical
following parking on the stand’. Often these restrictions
also stated how long after (i) arriving on stand the APU
should be shut down and (ii) how many minutes before
departure it should be switched on.
All European airports, along with Istanbul Ataturk, applied
these APU restrictions at all times of the day. LA, John-
Wayne and San Francisco applied limited restrictions
based upon stand location and time periods. For example,
San Francisco only applies limitations at the domestic
terminal between 2200 and 0600.
Heathrow and Gatwick were the only airports to undertake
audits and on the spot checks. These audits are publicly
available in the flight performance reports.
Monitoring, reporting and enforcement - APU operating restrictions
51
Airports applying APU operating restrictions
4
No publicly available
information
10 Applied no APU restrictions
12 Airports applied APU
operational restrictions
Case Study - Both Heathrow and Gatwick apply the same
restrictions on APU usage, this is included within the airports
aeronautical information publication within a section controlled by
the Department for Transport. The restrictions are shown below:
Extensions to these times are allowed in specific conditions such
as when the aircraft is under tow or if the temperatures reach
high or low extremes to manage passenger comfort.
The airport operational teams at both airports conduct audits on
compliance. The results
of the audits are publicly
reported in yearly reports.
Aircraft type Before scheduled departure After arrival
on stand
Narrow Body aircraft No more than 15 minutes 10 minutes
Wide body aircraft,
A300, A310, A330,
A340, B747, B777,
B787 etc.
No more than 50 minutes
Or not more than 90 mins prior to
departure when the FEGP has not
been upgraded to provide enough
power to support the FMS.
10 minutes
APU operational limits as per the AIP, Source EGKK
AIP:http://www.ead.eurocontrol.int/eadbasic/pamslight-
703A80648F8F74C6A637AC48FC23D00B/7FE5QZZF3FXUS/EN/AIP/AD/EG_AD_2
_EGKK_en_2017-02-02.pdf
Reported APU compliance
Source Gatwick Flight Performance Team
Annual Report, source:
http://www.gatwickairport.com/business-
community/aircraft-noise-airspace/noise-
reports/fpt-reports-publications/

w w w . a sk he l io s . c o m
Monitoring, reporting and enforcement - Special and unique practices
52
Case Study - following the opening of the 5th runway at Schiphol
airport residents in the area were subjected to an increase in low
frequency noise from take-offs. Due to the low-lying and flat
terrain surrounding Schiphol, this noise could be heard up to 18
miles away.
To mitigate the impact of noise, the airport undertook a study
which reported that there was a reduction in noise following the
end of the harvest and the ploughing of the fields as the furrows
both deflected and absorbed the sound. To build upon this finding
the airport undertook a large scale landscaping project was
commenced to create parks made up of numerous ridges to both
absorb and deflect the noise.
In total 150 perfectly straight and symmetrical six foot (1.82
metre) ridges were created over an area of 80 acres (0.36 km
squared). When complete the park reduced the noise by 5.5dB at
a cost of 3million euros.
Other airports including Gatwick and Los Angeles have made use
of similar civil engineering projects to reduce the impact of noise
around the airport.
Aerial photo of the
Schiphol Buitenschot Land
Art Park, source:
http://www.hnsland.nl/en/p
rojects/land-art-park-
buitenschot
Case Study - There are options available to reduce emissions on
the airport surface, this focusses on a reduction in engine use.
The procedures in this area varied and can often be airline
specific rather than airport specific but our research has
highlighted the following practises/technologies:
• Frankfurt applies restrictions on engine use so that any
manoeuvre that doesn’t lead to take-off must be done with a tug.
• Airlines are adopting reduced engine operations (e.g. single
engine taxi on a twin engine aircraft). These procedures tend to be
within the airline specific Standard Operating Procedures to
reduce fuel burn rather than being specific to a particular airport
• Airlines and system manufacturers are developing electric
systems to allow aircraft to taxi with no engine power. This
includes the:
• WheelTug system is currently under FAA certification on
the Boeing 737NG. This system has been trialled at
Montreal in association with Air Transat.
• A Honeywell and Safran joint venture which has
developed a system which will enter service in late
2016/early 2017 as a retrofit for A320 family and Boeing
737 jets.
A WheelTug system installed on an
Air Transat Boeing 737, Source
http://www.airtrafficmanagement.ne
t/2017/01/air-transat-to-test-
fuelsaving-taxiing-system/

Research summary
Land use planning

w w w . a sk he l io s . c o m
Introduction
This area of research investigated how aviation noise
influenced land use in the vicinity of an airport.
Typical practices
In relation to land-use and airport/aircraft noise, the
research has focussed on two main areas – land use
planning and noise mitigation schemes.
Land use planning: 20 of the 26 airports researched
published, or provided access to City, State or Federal
websites covering rules on land use around their airport.
In the majority of cases rules will be set regarding land use
around airports. Typically these rules that will state, within
a given noise contour, either to restrict development
altogether, restrict development of certain land uses or
allow the development subject to certain conditions (e.g.
requirements for noise insulation).
Rather than having a single set of rules, a number of
airports have a tiered approach to land use around an
airport. 3 or 4 zones are be defined, with each zone having
more stringent land use restrictions the closer it is to the
airport.
Policy on land use around an airport is typically provided by
the Federal Government for the entire country. These rules
are then often augmented by local authorities.
Noise insulation schemes: Land use zones around an
airport can also specify the need for sound insulation to be
provided for dwellings and public buildings such as
schools. Just over half of the airports researched currently
have, or have operated a noise insulation scheme.
Almost all airports made use of noise contours, along with
other criteria, to determine which properties were eligible
for sound insulation. Some airports had different insulation
zones (i.e. higher levels of insulation were provided the
closer the zone to the airport) or provided daytime and
night-time insulation schemes.
The type of insulation provided varied from
ventilation/double glazing in bedrooms only to insulation of
roofs, doors and all windows. Whether this was full or partly
funded again varied by airport, distance from the airport
and type of scheme (e.g. daytime/night time).
The impetus for schemes included those being voluntarily
set up by airports, the availability of government grants or
as part of expansion plans. Schemes were found to be
administered by a mixture of local authorities, airports and
government departments. Typically funding comes from the
government (sometimes via aviation taxes) or the airport
(via noise charges levied on airlines – see quieter fleet
section).
Land use planning - Overview
54

w w w . a sk he l io s . c o m
Land use planning - Best practice from around the world
55
• AOA not formally defined but noise contours
available.
• Land use policy varies between countries but is
typically based upon zones based on noise
contours. Both Amsterdam and Copenhagen have
clear policy based upon contours and zones as
defined below:
• Copenhagen note that no-one should be
exposed to sound levels above 55 dB Lden at
airports and 45dB Lden at airfields.
• Amsterdam use 4 zones, zone 1 (safety) and
zone 2 (noise) involve purchase and
demolish. Zone 3 involves no new building.
Zone 4 is restricted building.
• Almost all airports have a noise insulation scheme,
based upon 60/65 dBA noise contours adapted for
local or geographic boundaries. The scope and
level of insulation varies depending on the contour
and some airports apply different day/night
contours to determine the scope of the noise
insulation program.
• Funding is often provided by the airport, but the
State provides funding in Amsterdam, Brussels
and Copenhagen.
• Limited information could be
found, only 1 airport defined the
AOA as the NEF 25 contour.
• Zoning laws based upon the NEF
25 and 30 contours depending
on country.
• AOA defined using NEF contours between 25 and 30.
• Transport Canada guidelines apply to:
• Discourage development above NEF 30
• Insulate between NEF 25 and 30
• Municipal/provincial guidelines can overrule Federal guidance. Ottawa notes that weather insulation mitigates
sound and Montreal applying the following restrictions:
• Discourage development above NEF 35
• Insulate between NEF 30 and 35
• Typically construction allowed inside NEF25/30 contour if building is sufficiently insulated.
• Limited information could be found on specific local noise insulation program.
• Vancouver requests realtors to inform buyers of noise impacts.
• AOA not formally defined but a similar metric is
the noise contour typically based upon the 65
DNL metric.
• FAA Part 150 study required to develop current
and future noise impacts to align local land
policy.
• Land policy rules are typically as follows:
• No build above 70 LDN with compulsory
purchase of extant properties in some
areas
• Insulation between 65 and 70LDN and
realtors will need to inform buyers of noise
impacts
• No build of noise sensitive buildings within
65 LDN contour
• Local rules can overule FAA guidance, JFK
airport notes that if local noise is higher than
aviation, construction can go ahead regardless
of contour.
• Noise insulation schemes are used. These are
majority funded by the FAA with input from
Airport and aim to cut interior noise by at least
5dB.
• There are limits on noise insulation applicability
dependant on housing age.
• No information on land use
planning could be found.
• Sydney AOA is defined as the airport perimeter, whilst it is based upon the
55dB contour in Auckland.
• Cities have guidelines on the type of construction allowed in specific areas
based upon noise contours.
• Houses affected by noise have a note listed on their land registry record.
• Noise insulation schemes in operation and funded by the airport, this is based
upon the contour in which you reside. ANEI 25 in Australia and 60dBA contour
for airborne and 57dBA for ground noise in Auckland.
• Auckland must make a noise insulation offer every year and tracks progress.

w w w . a sk he l io s . c o m
Land use restrictions
Policy on land use around an airport was typically provided
by the Federal Government for the entire country. These
were typically in the form of restrictions based upon noise
contours which either:
• Restrict development all together: Sometimes including
mandatory purchase of buildings already inside the
contour.
• Restrict development of certain land uses: Such as
residential developments or public buildings.
• Allow the development subject to certain conditions:
For example, the use of noise insulation programmes or
identification in the land registry that a residential building
is subject to aircraft noise.
Although guidance was provided by the Federal
Government, in some areas this could be augmented by
local planning laws. In some cases this has led to a
variation in planning rules between different
neighbourhoods that are close to an airport but fall under
the jurisdiction of different local authorities. In the United
States a Part 150 study seeks to review and align policy
with the future development of the airport. This process is
covered in a case study on the next page.
Despite being a national/local government responsibility,
20 of the 26 airports researched either directly provided
information of land use rules around their airport or
provided information on how to access this information.
Land use zones and noise contours
A number of airports have a tiered approach to land use
around an airport. 3 or 4 zones are be defined, with each
zone having more stringent land use restrictions the closer
it is to the airport. Examples are shown in the case study
below, and on the following page.
Land use planning - Land use restrictions
56
Case Study - In Auckland land use planning is based upon
noise contours as follows:
• High Aircraft Noise Area (HANA) above 65 dBA Ldn,
• Moderate Aircraft Noise Area (MANA) 60-65 dBA Ldn,
• Aircraft Noise Notification Area (ANNA) 55-60 dBA Ldn.
These areas are used to apply certain planning restrictions on
new buildings and make use of mitigation strategies for those
already affected. For new educational buildings, this includes
an assessment of the current noise environment to determine
the required noise insulation, of which 50% of the costs will be
paid for by the developer with the remainder provided by the
airport authority.
A land use memoranda is added to the land registry if a
property is within these zones to note that it is currently
subject to, or may be subject to, aviation noise in the future.
Case Study - Transport Canada provide guidelines on land
use within certain areas. Development within the NEF 30
contour is discouraged and insulation is recommend within the
NEF 25 contour. However in Montréal, city guidance prohibits
residential development within the NEF 35 contour and
requires soundproofing within the NEF 30 contour.

w w w . a sk he l io s . c o m
The following airports either publicly state their land use zoning guidelines, or have links to the relevant local, state or
federal guidance:
Land use planning - Land use zone and noise contours
57
Airport Zone 1 Zone 2 Zone 3 Notes
United States
airports
• 70 dB DNL, no new build,
potential for compulsory
purchase
• 65 to 70 dB DNL, noise
insulation area
• 65 dB DNL, no new build of noise
sensitive buildings
Canada /
Toronto
• NEF 30 and above, no
new residential
development
Australia
• Above ANEI 40, (70dB
Ldn) mandatory purchase
and conversion to parks
• ANEI 30 to 40, residential
sound insulation
• ANEI 25 to 40, public building
sound insulation
Public building is
defined as a school,
church, hospital, day
care centres etc.)
New Zealand
• Above 65dB, 100%
funding for noise
insulation programs
• Above 60dB, 75% funding
for noise insulation
programs
• Above 57dB, (ground noise) noise
insulation program
No percentage co-
funding is reported
for the 57dB ground
noise contour
Amsterdam
• Demolition for safety or
high noise levels typically
located around runway
ends
• No new build of housing or
businesses. Areas for noise
insulation
• Previously restricted new housing
development but now permits
development in urban areas only
Zones based upon
the national spatial
study

w w w . a sk he l io s . c o m
Land use planning - Land use zoning case studies
58
Case Study - In the US, Code of Federal Regulations Part 150
Airport Noise Compatibility Planning outlines a methodology for
the production of:
• Noise exposure maps.
• Development of land use compatibility programs.
This includes the development of noise abatement procedures.
Although the study is voluntary, the results are the primary
vehicle for the application of federal grants for noise abatement
projects, in particular noise insulation.
The study involves the production of noise contours for the
current and future (5 year) fleet mix. This is used to review the
current and future land use plans and noise abatement
procedures. Although looking at current and future land use
and development, it is not an update to the airports master
plan.
Local citizens, public agencies and airport users were
encouraged to engage in the study through public workshops
and hearings. The final report along with the noise maps are
publicly available.
San Francisco airport is currently updating its part 150 study to
ensure the continuation of funding for its noise mitigation
programs including the sound insulation program. The study
involved two public workshops and information sharing. The
study has developed noise contours to align current and future
land use planning based upon:
• 70 dB CNEL no new build, potential for compulsory purchase,
• 65 to 70 dB CNEL, noise insulation area,
• 65 dB CNEL no new build of noise sensitive buildings.
Case Study - Following the Independent Arrivals Review at
Gatwick Airport, it was identified that a joint review of land use
policy was required. The airport has engaged with local
planning authorities to share best practice and align working
relationships using a land use workshop. Ongoing works have
been identified to create an airport owned planning portal to
provide information on noise contours, aircraft tracks and other
relevant aviation information for planning purposes.
Case Study - Within its 2033 master plan, Sydney airport
provided a summary of the land use surrounding the airport.
This included specific areas allocated by the City of Botany
Bay to the airport and infrastructure works to support ongoing
development, along with the management of the areas
surrounding the airport. The area dedicated to the airport is
shown in yellow, with zoning around the runway ends in
industry allocated in purple and low density residential shown
in red.
Sydney 2033 Master
plan Figure 11.2,
existing land use around
Sydney Airport, Source:
https://www.sydneyairp
ort.com.au/corporate/~/
media/files/corporate/en
vironment%20plan/mast
er%20plan/2033/chapte
r%2011_land%20use%
20plan.pdf?force=1

w w w . a sk he l io s . c o m
Land use planning - Land use zoning case studies
59
Case Study - Following a National Spatial Study looking at
current and future land use, the zones around Amsterdam
Schiphol airport were updated and expanded. The zones which
are outlined in the figure opposite and includes zones for
airport development and corresponding areas for building
demolition on both safety and noise grounds along with zoning
covering limited and restrictive development.
A recent review of airport usage and housing requirements has
since led to the adaptation of the previous rules as highlighted
in figure opposite. As it is now forecast that an extra 300,000
homes will be required in the Greater Amsterdam Metro area
by 2040, the following restrictions have changed/been updated
in the short term:
• The area allocated to the airport, in the centre of the coloured
zones has been updated to take account of future development
and traffic levels.
• Accordingly the areas marked in red, orange and green have
also been updated but this has not increased their overall size.
• National planning restrictions in the purple zone have been
relaxed in urban areas, it has been agreed that municipalities
will enforce planning policy. This relaxation is focused on urban
areas only and continues to restrict development outside these
areas to allow aviation to develop.
In the medium to long term, the Schiphol Airport Environment
Council has been tasked to develop a framework to support
and balance the future development of the airport, airspace
and construction of housing and businesses in the surrounding
areas.
The Amsterdam
Schiphol land
use zoning.
Source:
http://www.bezo
ekbas.nl/#
Demolition zones (safety).
Demolition Zones (noise).
No new build of offices,
business and homes, and
insulation zone.
No new build of housing or
redevelopment allowed

w w w . a sk he l io s . c o m
Existence of noise insulation schemes
Of the airports researched, just over half currently have, or
have operated a noise insulation scheme. Most put the
emphasis on residents to make applications. However, 6
airports operated proactive schemes which directly engaged
with local communities (see Auckland case study).
Insulation provided
The type insulation provided varies greatly from the
installation of double glazing and ventilation through to
complete sound insulation schemes. For the airports which
published information, the following works were included:
• 7 airports offered ‘complete’ home sound insulation
programs, which included aspects such as double glazing,
loft/wall insulation and ventilation systems. The majority of
these airports were in the US.
• 6 airports offered double glazing or ventilation systems.
Heathrow, Paris Charles de Gaulle and Zurich provide more
than one insulation scheme. For example, Heathrow has
day-time, night-time and quieter homes schemes, each of
which provides different levels of sound insulation (see page
67). In addition, some airports offer to purchase housing
which was affected by the worst noise levels.
Eligibility for sound insulation
Almost all airports made use of noise contours to determine
which properties were eligible for sound insulation. Examples
of eligibility criteria as a follows (further information can be
found in the case studies):
• The 6 US airports used the 65dB CNEL contour;
• Copenhagen used the 65dB Lden contour;
• Sydney airport used the ANEI 25 contour; and
• Auckland airport used the 60dBA contour.
As mentioned above, airports such as Heathrow apply more
than one scheme, with each scheme have a different
eligibility criteria. Heathrow and Gatwick have also taken
pragmatic steps to adapt their contours to ensure, for
example, that the scheme doesn’t stop half way along a
street.
In addition to the noise contours, eligibility criteria often
apply. This includes:
• Properties must be built before a certain year (in the US this
is set as 1998 and is based upon Federal Legislation), but
varies depending on when the scheme was established;
• Claims can’t be made for previous insulation works;
• In the US, interior noise within an eligible property must be
above 45dB DNL.
Land use planning - Noise insulation schemes
60
Airports with a noise insulation scheme
6 Proactive insulation
schemes
10 Has a noise
insulation scheme10 No information
available or no scheme

w w w . a sk he l io s . c o m
Impetus for noise insulation schemes
The reasons for starting a noise insulation scheme varies,
but in most cases it is part of a plan for airport development,
government initiatives or a voluntary plan. Our research has
shown that:
• Legislation, voluntary schemes & development: Both
Heathrow and Gatwick undertake insulation programmes
voluntarily under Section 79 of the UK Civil Aviation Act of
1982, but both airports have recently expanded the offering
as part of expansion plans.
• Airport development: Copenhagen, Sydney and Frankfurt
all undertook noise insulation schemes in response to
expansion plans such as new runways. However, for
Frankfurt this was through a voluntary scheme not enforced
by Government.
• Availability of Government funding: In the US, under a
Part 150 airport noise compatibility study, noise insulation
programmes were identified as a potential mitigation method
eligible for federal funding. Due to the availability of funding
and community concerns, noise insulation schemes were
started.
Source of funding for noise insulation schemes
Funding was linked to the reasons for the program and the
country in which the airport was located. For the airports that
provided information, the following funding was used:
• Federal Grants: In the US, 6 airports used a Part 150 airport
noise compatibility study as a means to implement a noise
insulation program. This was supported through Federal
Grants which can provide between 75% to 90% of the total
cost. Funding comes from the taxation of airspace users.
• Noise charges: Four airports made use of noise charges
levied on airlines and/or passengers to fund noise insulation
schemes
• Government funds: Two airports made use of Government
funds for which the exact source could not be identified.
Provision of insulation to recipients
All of the insulation programmes researched used an
external contractor to assess, process and install noise
insulation at the recipients property. Although all
programmes made use of the same process, the funding
provided to cover the work varies, for the airports which
provided information this ranged between the following
values:
• The provision of a fixed amount: Two airports, Gatwick
and Paris Charles de Gaulle provides a fixed amount
towards total cost determined by the airports contractor.
• Part funding: Three airports provided funding toward the
total cost of the insulation, this ranged between 50 and 75%
with the total cost determined by the airports contractor.
• Complete funding: Seven airports, of which five were in the
US, provided complete funding towards the cost of the noise
insulation provided under the program.
Auckland was the only airport which funded 75% of the cost of
noise insulation at newly constructed schools in the insulation
area.
Land use planning - Noise insulation schemes
61

w w w . a sk he l io s . c o m
Scheme management
The insulation schemes are either managed by the airport
directly, or more commonly by a public body such as the
local City or central Government. Of the airports
researched that published information, the following bodies
were responsible for the management of the program:
• Local authority: The six US airports assign the
management of the scheme to the relevant local City,
which can often involve more than one City per airport;
• Airport: Four airports manage the programme internally;
• Government department: Three airports had schemes
managed directly by Government departments such as
Infrastructure or Environment.
Scale of airport noise insulation programmes
The scale of the noise insulation programmes varies
significantly. By comparing the total funding available and
the number of properties insulated the various noise
insulation programmes can be compared as shown in the
figure below.
The following noise insulation schemes are closed (figures in
brackets denote the year of closure - John Wayne (2009), Sydney
(2000), Brussels (2004) and Copenhagen (2016)). For these
schemes the spend per building at the time of closure has been
recalculated to 2017 values.
Land use planning - Noise insulation schemes
62
Case Study - Heathrow airport has three noise insulation schemes
which are based upon noise contours and time of day:
• Day noise scheme which based upon the 69dB Leq 18h contour. It
includes 8,500 houses that are affected by noise after 0600 and during
the day. It covers free loft insulation and ventilation and 50% of the
cost of double glazing.
• Night noise scheme which is based upon the 90dB SEL noise footprint
of the noisiest aircraft. It includes 41,000 houses that are affected by
noise between 2330 and 0600. It covers free loft insulation and
ventilation and 50% of the cost of double glazing in the bedroom.
• The quieter homes initiative includes the 1,200 homes closest to the
airport and includes custom made noise solutions. This is undertaken
at no cost to the resident.
The airport manages the programme internally and makes use of a single
contractor to undertake the works.

w w w . a sk he l io s . c o m
Land use planning - Noise insulation schemes and case studies
63
Case Study - The residential noise insulation Program at Chicago
O’Hare is one of the largest schemes in the United States and to date
the program has insulated 10,900 homes. The program has reached a
total expenditure of $200 million (US dollars) which is made up of a
mixture of FAA grants and airport funds. In 2005 the FAA determined
the noise insulation programme to be the best mitigation as part of
expansion at Chicago O’Hare and therefore allowed for the use of
Federal Grants. Prior to this date the airport had funded the programme
itself. The decision made the by FAA required all properties within the
65dB DNL noise contour and built before 2005 to be insulated.
The programme is overseen by the Chicago O’Hare Noise
Compatibility Commission (ONCC) with the assistance from external
building contractors who are certified to undertake works and carry
specific airport supplied ID badges. The contractors will conduct an
initial survey and will offer options to insulate the property. The option
offered are based upon the interior noise level and will include works
such as window modifications, improvements to main and storm doors
along with the installation or upgrade of air conditioning systems.
In any case, the home owner is responsible for choosing the insulation
option that meets there needs. ONCC contractors conduct a post
installation survey to confirm that the insulation has reduced interior
noise by at least 5dB in accordance with FAA guidance.
The noise insulation programs are managed by six local jurisdictions,
or cities, who use a variety of methods to select properties including:
• first come first served,
• lottery and
• noisiest first.
These jurisdictions have the authority to choose which buildings they
are interested in insulating, this includes public buildings, mutli-family
residences and/or rental properties in addition to housing.
Chicago O’Hare online GIS
tool for sound proofing
assessment and awareness
Source:
https://gisapps.cityofchicago
.org/AviationPropertyLocator
Web/
Eligible properties are identified on a yearly basis and the city will write a
letter to the properties which have been selected in each phase. The
letter asks the owner if they would like to participate in the programme,
and outlines the process involved. The letter is supported by a handbook
which provides an overview of how noise propagates in properties and
the works which can be undertaken to limit the impact of noise. This
handbook is also given to residents who are not in the insulation program
for information. In addition to the letter, the airport conducts informative
briefings on the programme and maintains a showroom of the available
insulation treatments.
Progress is tracked and reported publicly to the ONCC and in addition an
online mapping tool is publicly available from the City of Chicago, as
shown below. This tool shows the homes insulated to date along with the
locations of the homes which are planned for insulation in future phases
of work.
The ONCC has previously conducted surveys on residents who had
participated in the scheme. The survey reported that 94% of residents
had an improved or greatly improved quality of living, with 98% saying
that they would recommend the scheme to their neighbours.

w w w . a sk he l io s . c o m
Land use planning - Noise insulation schemes and case studies
64
Case Study - Auckland airport has a noise insulation scheme
which is funded by the airport. The scheme is based upon noise
contours which denote the funding level available:
• Within the 65dBA Ldn contour the airport must provide 100% of the
costs of insulation
• Within the 60dBA Ldn contour the airport must provide 75% of the
costs of insulation, however a 25% top-up is available from the
community fund to assist lower income residences.
• Residences within the 57dBA ground noise contour are eligible
The insulation package includes the installation of heating and
ventilation systems to maintain a healthy home with the windows
closed. Only housing built before 2001 is eligible for the scheme,
however the airport is required to fund noise insulation schemes at
new schools built within the contour, to a total value of 75% of the
works. The airport produces several documents to introduce the
noise insulation program, the potential works on offer and the
process for consultation and installation. In addition the airport is
required to actively engage with residents and will make an offer
every 12 months to affected properties, even if that property has
previously declined the offer.
Case Study - Sydney airport had a noise insulation scheme which
was managed by the Department of Infrastructure. It was introduced
following an increase in noise complaints after the opening of a new
runway. The programme was funded by a noise levy on airlines and
sought to insulate properties based upon the:
• ANEI 30 contour for residential properties,
• ANEI 25 for public buildings.
The program included insulation, double glazing and air conditioning
works and insulated a total of 4,083 houses and 99 public buildings.
In addition, 147 properties were brought, demolished and turned into
parkland.
The scheme had a maximum cap of 60,000 Australian dollars per
property, but at the end of the project, an average of 81,000 dollars
was spent due to the number of noise sensitive public buildings and
lightweight housing.
The program has since been subjected to a detailed independent
review on its effectiveness, conducted by the University of New South
Wales, with the results publicly available. The report noted that the
overall improvement delivered by the program had been good. A
suitable reduction in sound level had been achieved for brick based
structures, however lightweight structures required more extensive
work to take account of the additional sound insulation required in the
walls.
The report noted that there was a reliance on the installation
contractor to identify and install suitable insulation systems. A lack of
detail on the correct installation of items such as door and window
seals, along with limited post installation survey was the main reason
for a low reduction in interior noise following the works. A post
installation review of any sound insulation works was recommended.
Auckland airport noise insulation information brochure and background information
Source: https://corporate.aucklandairport.co.nz/corporate-responsibility/managing-aircraft-
noise/being-a-good-neighbour/noise-mitigation-packages

Research summary
Noise complaints

w w w . a sk he l io s . c o m
Introduction
Airports receive complaints about aircraft noise from local
communities. Complaints have been researched three
areas:
• Complaints process – how complaints are made.
• Complaints policy – how the complaints are handled.
• Complaints reporting - how complaints are reported
upon and analysed.
Typical practices
Complaints process – how complaints are submitted:
Airports typically provide a number of different options for
communities to submit complaints. This is to account for
the different demographics that can be affected by aircraft
noise. Online forms, dedicated online tools and phone lines
were the most prevalent methods available. Dedicated
online tools, such as the WebTrak system used at Toronto
Pearson can link the complaint to an individual aircraft. The
majority of airports accepted complaints about specific
aircraft and/or general complaints.
Complaints policy – how complaints are handled: Half
of the airports researched provided some information on
how complaints were handled. Some of these detailed the
conditions under which they would provide responses, their
target response time and specific policies on
communication with high frequency complainants.
Complaints reporting: Several airports reported on the
number of complaints received each month, quarter or
year. The methods of reporting and level of additional detail
provided varied significantly. It was most common for
airports to provide complaints data in traditional “print
friendly” report which included data on the number of
complaints and location of complainants. However, other
information, such as the number of complainants and
reason for the complaint was provided less often.
Special and unique practices
Responding to complaints: In addition to responding to
complaints in writing/by phone, San Francisco airport
provides responses to complaints via Community Round
Table events. These events are a useful forum for
acknowledging and addressing complaints and can also
help improve the airport’s understanding of noise concerns.
Use of online tools: Gatwick airport provides an
interactive platform for viewing complaints data as part of
its Casper system. It is a useful method of providing
relevant, detailed and up to date complaints data.
Regional trends
Whether or not an airport chose to accept complaints and
provide any additional related information is not dependent
on the region. It appears to be up to the airport’s discretion
although proximity to local communities is a key factor.
Noise complaints - Overview
66

w w w . a sk he l io s . c o m
Noise complaints - Best practice from around the world
67
• Complaints can be made via phone, email, online form or Webtrak (where applicable).
Schiphol require you to create an account and fill in a detailed questionnaire to register a
complaint.
• Complaints policy is not readily available but where it is, they will be typically responded to
within 3-10 days. Responses provide as much information as possible.
• The reporting of complaints is carried out at some airports including Amsterdam, Gatwick and
Heathrow, where provided they typically include the total number of complaints and
complainants. Gatwick reports on the geographical spread of complainants, this information
is also available online via their Casper flight tracking tool.
• For regular complainers, if no new information is available, complainers will be notified of the
airport’s intention to register but not respond to complaint (Heathrow, Gatwick).
• Brussels has an independent noise complaints body and Amsterdam has a joint airport/ANSP
complaints handling team.
• Complaints and complaint policy is reviewed by the NATMAG group at Gatwick, a joint
industry and community working group.
• Complaints in Hong Kong
can be made to CAD via
24hr hotline, fax, email or
in writing. Complaints are
investigated and a
response provided.
• HK report complaints in
the airport sustainability
performance indicators as
per 1 million passengers.
• Online complaint forms are widely used. Hotlines are also available (24/7 at YVR and Calgary).
Montreal and YVR also accept email complaints. Toronto and Vancouver accept Webtrak complaints.
• Complaints are logged and investigated. GTAA responds on request whereas Vancouver, Calgary,
Ottawa respond if appropriate. Calgary provide a response time of 3 days.
• Complaints reporting varies per airport but includes total complaints broken down into reasons and
geographical locations including numbers of complainants. Vancouver separates top 5 chronic
complainers from graphs and charts to avoid skew.
• Complaints are reported to the Montreal Community consultative committee.
• Complaints are accepted through the
normal means. O’Hare are considering
introducing a web chat to accept
complaints.
• Complaints policy is only available for San
Francisco and Los Angeles. San
Francisco investigates to see if NAP has
been broken. Response are provided in
writing, phone or at community round
table. At Los Angeles, staff investigate up
to 5 complaints a month per complainant.
Responses provided by letter if requested.
• Monthly reports describe number of
complaints and complainers in a table and
on a map, and per aircraft type.
• Los Angeles provide a record of all noise
complaints and responses online -
provides a transparent record.
• No information available
on complaints.
• All complaints are handled by AirServices rather than the airport.
• Complaints can be made via phone, CASPER/Webtrak, online, mail. In Sydney an
interpreter is also available 24/7 in 18 languages.
• Airports investigate and respond to complaints. Sydney caveat by saying they will respond
within 21 days if complaint is relevant and not abusive.
• Sydney produces quarterly reports which covers complainants only.
• In Auckland a written responses are provided to all complaints.
• Auckland reviews complaints in community consultation group.

w w w . a sk he l io s . c o m
Submission of complaints
Complaints were accepted via the following methods.
Of the 16 airports accepting complaints by phone, 5
specified that their phone lines are open 24 hours a day, 7
days a week. Examples of airports using newer
approaches were also found. Chicago O’Hare is
investigating introducing a live web chat function to accept
complaints. Los Angeles airport has introduced a mobile
application that can accept complaints
Information requested
Thirteen airports enabled complaints to be made against a
specific aircraft, typically via online flight tracking tools such
as WebTrak and Casper. This enables the investigation
process to be more targeted and efficient. Two airports
were found to only accept complaints about a specific
aircraft type via their online systems.
For the seven airports accepting general complaints only,
complainants were given a general comment box to
comment but no specific aircraft information was requested
by the airport.
Noise complaints – Complaints process
68
Complaint method Number of airports
Online form 17
Online tools (e.g WebTrak, Casper) 10
Phone 16
Email 6
Letter 6
Other 3
Case study – 24/7 interpreters. The complaints process at Sydney
airport is similar to other airports in that it accepts complaints via an
online form, WebTrak, mail or telephone. To accommodate all those
potentially affected by aircraft noise a telephone interpreter service is
available in 18 different languages. The service is available at all hours
and is free to use. It is noted that complaints for Sydney and other
airports in Australia are managed by the air navigation service
provider, Airservices Australia, which may provide some economies of
scale to provide a translator service.

w w w . a sk he l io s . c o m
Availability of policy
Thirteen of the 26 airports researched made some aspect
of complaints policy available to the public. Some
complaints policies detailed the conditions under which
responses will be provided to complainants. This includes:
• When responses will be provided.
• How long complainants can expect to wait for a response.
• Limits on the number of complaints that can be handled for
each complainant.
Response to complaints
Policies on responses to complaints can be grouped as
follows:
• Response always provided: Five airports indicated that
they always provide responses to complaints. This is
typically a written response. Amsterdam Schiphol note that
although they will always provide a response, only causes
of noise can be investigated.
• Response provided on request: Five airports provide
responses to complaints on request. Some airports such
as San Francisco allow complainants to specify whether
they would like a call back or an email response. Heathrow
airport will invite high frequency complainants to visit the
airport at their discretion. Los Angeles airport state that
their reply will look at noise trends and comment on issues
in the area.
• Response provided if appropriate - 3 airports.
• Complaints against specific aircraft must be made
within 10 days of the event: Amsterdam Schiphol airport
state that noise complaints can only be accepted for
aircraft that have operated within the past 10 days.
Response time
Only 6 airports specified a response time to complaints.
Noise complaints – Complaints policy
69
Airport Response time
San Francisco 1 day (for call backs)
Calgary, Frankfurt 3 days
Heathrow 5 days
Amsterdam 7 days *
Sydney 21 days
* Amsterdam Schiphol
state that complainants
will be notified if
responses are not
possible within 7 days

w w w . a sk he l io s . c o m
High frequency complainants
A number of airports receive a high proportion of their
complaints from a small number of complainants (see
graph on the next page). Many of these airports have
defined policies for high frequency complainants:
• Los Angeles airport state that their staff will investigate up
to 5 noise complaints per person per month.
• Sydney airport states that if they have been contacted
previously and a response has been provided, they may
not respond if no further information can be provided.
Additionally Sydney only reports on number of
complainants.
• Heathrow and Gatwick airports have a policy on regular
complainants (see case study below).
Responsibility for complaints handling
Most complaints are handled by the airport. However, it is
not unusual for complaints to be handled by other bodies
and organisations.
Noise complaints – Complaints policy
70
Case study – Handling regular complainants. Gatwick airport
receive approximately 15,000 complaints per year. To ensure that they
are able to give due consideration to all of those affected by the
airport’s activities, they have adopted a clear policy on handling regular
complainants. It is expressed as follows:
“where we have repeatedly explained the policies and noise
measures which affect a complainant’s postcode area and
previously supplied sufficient information to the extent that we are
unable to further enhance understanding, we will notify the
complainant of our intention only to register – rather than respond
to – all future complaints”
Gatwick airport’s noise complaints policy. Source
http://www.gatwickairport.com/globalassets/business--community/b_7_aircraft-
noise/yla-complaints-handling-policy-2016.pdf
Responsible party Number of airports concerned
Airport 16
Local Government 2 (Chicago O’Hare, New York JFK)
Air Navigation Service Provider 1 (Sydney)
Airport Committee 1 (Amsterdam Schiphol)
Civil Aviation Authority 1 (Hong Kong)
Independent body 1 (Brussels)
Unknown (or no complaint
information available)
5

w w w . a sk he l io s . c o m
Heathrow
Heathrow has a short description of what happens to
complaints on its website with a link to a more detailed
policy1.
Noise complaints – example complaint
policies published by airports
71
1 www.heathrow.com/noise/what-you-can-do/make-a-complaint-about-noise/what-happens-with-complaints, and www.heathrow.com/file_source/HeathrowNoise/Static/noise_complaints_policy.pdf.
What happens with complaints
Receiving complaints: We will respond to all complaints within five
working days (as long as we have all the contact details we need). If we
need to do more investigation, we will let you know within the five days
and tell you when you will get a complete answer.
Providing information: We aim to provide a full and comprehensive
information service but we do have to consider the resources we have
available, to ensure all complainants are treated equitably.
Type of information provided: We supply information which explains
the relevant procedures and includes maps for a complainant’s postcode
area. We will also do our best to provide details of particular flights.
Use of complaint data: We only use your personal details for registering
complaint details. We do not make them public or use them for any other
purpose.
All complaints are reported daily on our Heathrow Operational Data
website, in the airport’s quarterly Flight Performance Reports and to the
Heathrow Airport Consultative Committee (HACC).
We monitor complaints for trends to inform our noise management
priorities but flight paths are not changed purely on the basis of the
number of complaints received from a particular area.
For more information read our complaints policy.
Text taken sourced from: www.heathrow.com/noise/what-you-can-
do/make-a-complaint-about-noise/what-happens-with-complaints

w w w . a sk he l io s . c o m
72
w w w . a sk he l io s . c o m
Gatwick
Source:
http://www.gatwickairport.com/globalassets/business--
community/b_7_aircraft-noise/yla-complaints-handling-
policy-2016.pdf
Noise complaints – example complaint
policies published by airports
73

w w w . a sk he l io s . c o m
74

w w w . a sk he l io s . c o m
San Francisco
Source: www.flysfo.com/community/noise-
abatement/file-a-complaint
Noise complaints – example complaint policies published by airports
75
Reports to Airport Community Roundtable
Call tallies along with trends and recent events are reported on a bi-
monthly basis to the Airport Community Roundtable during its public
meetings.
Response to Citizens
When making a complaint, if you request a call back or more information,
you will receive a response from a noise abatement specialist. In general,
first time complaints receive a written response. In some cases, especially
at Community Roundtable meetings, responses are made personally. If
you wish to be contacted by telephone, two attempts will be made to
reach you and at least one message is left, if possible. During normal
business hours (Monday–Friday 8:00 am to 5:00 pm) a member of the
Noise Abatement staff is available at 650.821.5100, the main office
number.
How do I File a Noise Report?
Noise Complaint Hotline: 650.821.4736
Toll Free Noise Complaint Hotline: 877.206.8290
Noise Complaint Email: [email protected]
Mailing Address:
Aircraft Noise Abatement
San Francisco International Airport
P.O. Box 8097
San Francisco, CA 94128
All information submitted is secure and not shared with other
agencies.
Members of the community can view flight tracks of aircraft operations at
SFO either in real-time with a 10 minute delay or playback the desired
time period. Click here to view flight tracks. When viewing a playback of
flight tracks, double-clicking on the flight track gives detailed information
for the flight.
Investigating Noise Events
The SFO Noise Monitoring System uses a combination of microphones
and radar data to record and track aircraft events throughout the Bay
area. Flight track information gathered includes single event and
cumulative (over time) noise levels, time of day, aircraft type, altitude and
airline. Using this data, staff can determine whether the event in question
violated any noise regulations or established noise abatement
procedures.

w w w . a sk he l io s . c o m
Sydney
Source: www.airservicesaustralia.com/wp-
content/uploads/11-
147FAC_Complaints_management_WEB.pdf
Note: Complaints made against Sydney Airport are
managed by the Australian Air Traffic Control provider,
Airservices.
Noise complaints – example complaint
policies published by airports
76

w w w . a sk he l io s . c o m
77
w w w . a sk he l io s . c o m
Vancouver
Source: www.yvr.ca/en/about-yvr/noise-
management/noise-faqs
.
Noise complaints – example complaint
policies published by airports
78

w w w . a sk he l io s . c o m
• Some airports (e.g. San Francisco) reported on the number of complainants each month (cannot be annualised).
• Chicago and San Francisco receive a high proportion of their complaints from a small number of complainants (e.g. in June 2016, San Francisco received 79,307 complaints from 437 residents).
• Sydney reports on complainants only.
• Amsterdam Schiphol received 120,000 complaints from 35 complainants in 2015.
Noise complaints – Statistics on the number of complaints and complainants
Figure: Number of complaints and complainants per year. Note that data comes from either 2015 or 2016 (whichever had complete annual data). Source: Airport
noise reports
0 10000 20000 30000 40000 50000 60000
Vancouver
Toronto
Calgary
Montreal
Los Angeles
San Francisco
Chicago O'Hare
John Wayne (SNA)
Sydney
Amsterdam
Heathrow
Gatwick
Number of complaints/complainants
Air
po
rts
(th
at r
epo
rt o
n c
om
pla
ints
)
Number of complaints and complainants at different airports in the study
complainants (where data is available) complaints
3,542,781
167,890
4,058,1611
108,255

w w w . a sk he l io s . c o m
Reporting of complaints
The majority of airports researched report on complaints.
These were grouped as follows:
• Traditional noise reports: The majority of airports
produced ready to print reports on their website. These are
produced monthly, quarterly or annually. Such reports vary
greatly in terms of level of detail – some (e.g. Montreal)
report monthly on the total number of complaints and
reasons why, while others (e.g. Chicago O’Hare) provide
additional information including the geographic distribution
of complaints/complainants and times of day.
• Web-based reports: Four airports reported complaints
data via their website. Heathrow’s website provides
statistics on the number of complaints received each day.
Amsterdam Schiphol reports on complaints on a website
as well as in traditional reports. A table is available on their
website separating the number of high frequency
complainants from others.
• Online platforms: Gatwick reports complaints using an
online platform. Gatwick’s Casper platform is interactive
allowing users to obtain more specific information related
to their postcode or time frame of interest. (see case study
on next page).
Analysis of complaints
In addition to reporting on number of complaints, some
airports further segment complaints or allow members of
the public to do so. Some examples are summarised below
and expanded upon in cases studies on the following
pages.
• Vancouver provides data on complaints, complainants,
type of operation and geographical location.
• Sydney segments complaints into reasons such as aircraft
height, runway choice etc. It also provides a quarterly
commentary of changes in complainants, the main issues
raised and associated explanations.
• For a given post (zip) code Gatwick allows users to
segment complaints by number of complainants, aircraft
type/number of engines, hour and reason for the
complaint.
Noise complaints – Reporting and analysis of noise complaints
80
11
121
11
noise reports (ready for print)
dedicated online platform
website & reports
website only
none

w w w . a sk he l io s . c o m
Case study – use of online tools. Gatwick provides an
interactive platform for complaints reporting via its Casper
noise lab. The platform has been in use since 30th September
2016 and provides live updates of not only complaints data
but also noise monitor data and flight tracking.
Complaints are presented on a map of the airport locale with
each postcode (ZIP code) coloured according to the number
of complaints received. The date range for viewing complaints
can also be altered if the user wishes to understand the
number and location of complaints during specific periods.
Further detail is presented to the user if a specific postcode is
selected. Charts are presented showing:
• Number of complainants and type of complaints – this
chart describes the number of individuals complaining and
whether they submitted a generic complaint or complained
about a specific aircraft.
• Complaints per aircraft type – the top 3 most complained
about aircraft types are presented in this chart.
• Complaints by hour – this chart describes the number of
complaints received each hour within the desired time
period.
• Complaints by number of engines – this chart describes
whether the complaint related to 2 or 4 engine jet aircraft or
otherwise.
• Complaints by issue/statement – this chart provides an
overview of the key points made in complaints (e.g. aircraft
should fly higher, flight paths should be dispersed over a
wide area).
Noise complaints – Case study
81
Gatwick
noise lab
complaints
reporting.
Source:
http://noisela
b.casper.aer
o/lgw/#page
=complaints

w w w . a sk he l io s . c o m
.
Noise complaints – Case study
82
Case study – Online reporting on the number of complainants
only. Sydney airport reports on the number of complainants only.
This is to help enable Airservices Australia to focus on analysis of
noise issues and causal factors. Data is reported on an online
platform in a clear and understandable manner. This includes a
series of charts showing:
• Main issues of concern.
• Complainant location.
• Data explaining possible reasons for a spike in complainants.
When Airservices Australia made the change from reporting on
complaints to complainants only, the total number of complaints
decreased by 70%. It is important to note that Sydney airport is the
only airport in the study that reports on complainants only.
Noise concerns for the 869 complainants registered in 2016.
Source: http://aircraftnoiseinfo.bksv.com/sydney/complaints/
Case study – Separating complaints complainants. Vancouver
airport reports on complaints within its annual noise reports. To
avoid skewing the data and to enhance the airport’s understanding
of local noise concerns, the data is split between complaints and
complainants. The reports contain simple maps and charts showing:
• Numbers and locations of complaints and complainants – For
example, in 2015, the airport received 1,667 complaints from 298
individuals. This was a 5% decrease in complaints and a 7%
decrease in individuals compared to the previous year.
• Types of operation – For example, in 2015, 25% of noise
complaints were due to jet departures, 25% were due to jet arrivals
and 2% were due to helicopters
Frequency and Geo-
distribution of Noise
Concerns. Source:
http://www.yvr.ca/en/about-
yvr/noise-
management/publications
Complaints and complainants per year
(2015 Annual Noise Report). Source:
http://www.yvr.ca/en/about-yvr/noise-
management/publications

Research summary
Community outreach

w w w . a sk he l io s . c o m
Introduction
Airports undertake various activities to engage with local
communities on aircraft noise. The purpose of engagement
with local communities typically includes sharing
information, gaining feedback and addressing specific
topics.
Research in this area primarily focuses on community
forums similar to the CENAC group at Toronto.
Typical practices
Community forums: Are used to bring together the
stakeholders who have a direct impact on, or are directly
impacted by, aviation noise. This includes both industry
and local stakeholders (i.e. elected officials and/or
community representatives).
Information sharing: Almost all airports will share
information with communities. For example, online
publications explaining the operation of the airport,
activities to reduce the impacts of aircraft noise and
reporting on noise metrics (e.g. complaints, noise monitor
information etc.).
Regional trends
With the exception of airports in the Middle East and Asia,
almost all airports researched undertaken some form of
engagement with the local community. This varies from
basic information sharing using websites or reports through
to collaboration using community engagement forums.
Some airports undertake additional activities such as noise
labs to further engage communities and provide an
opportunity to share information.
Special and unique practices
Noise exhibits: Madrid-Barajas airport has an
‘expoambiente’ area which is used to raise awareness of
noise, highlight the airports work to improve the noise
environment and provide an area for debate and
presentation of environmental topics.
Community engagement vehicles: Chicago O’Hare
airport, has a community engagement vehicle which attend
local events to share information on airport operations and
provide an opportunity for the local community to ask
questions.
Community outreach - Overview
84

w w w . a sk he l io s . c o m
Community outreach - Best practice from around the world
85
• 50% of European airports have a community committee. Others have
community engagement spaces or “noise labs”.
• Where committees exist they include airport, airline, community and
Government representatives. They are usually chaired independently.
• Groups meet approx. 4 times a year. Aims are to discuss issues at the airport
through engagement with community, develop workable solutions to problems.
• Some airports have additional groups that focus on specific tasks such as
Gatwick’s Noise and Track Keeping Group.
• Gatwick have recently undertaken an Independent Arrivals Review which has
developed a number of recommendations to improve noise and created a Noise
Management Board to oversee progress and the development of new actions.
• No formal committees
exist. Community outreach
at Changi is charitable. At
Hong Kong the Civil
Aviation Department visited
some councils to explain
aviation noise.
• Community forums are common throughout Canadian airports. Consultative and
have no express authority.
• Generally, committees are chaired by the airport and attended by NAVCANADA,
airline representatives, airport, Transport Canada, councillors and residents.
• Vancouver also invites tribal group representatives, industry groups and
Department of Health.
• Only Vancouver and Toronto publish ToR: Relate to noise mitigation, adherence
to targets and NAPs, land use etc.
• Meeting minutes highlight group have positive impact on NAP development and
reporting (Calgary).
• Vancouver undertakes annual noise survey.
• Other than Hartsfield-Jackson, all other US airports have
airport committees.
• Committees usually do not have direct engagement with
communities as elected representatives are involved
instead.
• There is a drive towards community roundtable events
involving airport, city officials, FAA, airlines and community
representatives (public allowed to watch and engage at
certain times).
• Committees are usually chaired by somebody other than
airport (Los Angeles use independent consultant).
• Groups usually meet every 2-3 months. Large groups
(O’Hare) meet more often.
• Groups often have sub-committees to focus on technical
or other matters which are then brought to the main group.
• Community groups have improved NAPs: at Los Angeles
this includes satellite departures, minimum overflight
altitudes. At San Francisco and O'Hare, the groups
introduced the FQ program.
• FAA has setup a national website which acts as a
repository of knowledge to aid noise enquiries. Airport
have own fact sheets as well as news feeds, twitter
(although usage varies).
• O’Hare has a community engagement vehicle.
• No information
available on
community groups.
• Independently chaired community groups composed government officials, airline representatives, elected
MPs, community representatives. Public forums also exist at Auckland airport.
• Responsible for identifying community noise concerns, identifying mitigations to reduce impact and
meeting minutes are published online.
• Sydney airport has a sub-group which monitors operations and noise.
• Both Sydney and Auckland engage with the community using either online information (videos) and an
experience centre to explain how the airport operates and how it might impact residents.
• Sydney makes an concerted effort to engage: websites, phone lines, email, adverts, and direct postal to
100,000 addresses, forums and FAQ sessions and door to door visits.

w w w . a sk he l io s . c o m
Which airports have a dedicated forum
Of the 27 airports investigated, 13 airports have a dedicated
community engagement forum. Of the remaining 13 airports,
4 airports have undertaken ad-hoc community engagement
activities such as consultations, studies and the provision of
information.
Membership of the community forum
All of the forums included the following organisations:
• The airport,
• The Air Traffic Control Provider (ANSP),
• The safety regulator (and/or the relevant government
department),
• A pilot or airline representative,
• Community members.
Community members were drawn from one or both of the
following:
• Elected officials i.e. councillors / members of parliament,
• (Non-elected) community representatives.
If the community representatives were involved they were
required to represent a local area. No clear trend was seen in
the inclusion of either community groups or elected officials.
Some airports involved local noise lobby groups to provide
this representation.
If community representatives did not sit on the forum,
common practice was to include a public session as part of
the forum. This could take the form of a Q&A session or a full
public meeting. The structure of the Q&A sessions varied,
from requesting questions in advance to a holding drop-in
sessions.
Typically all organisations represented on community forums
were allowed to nominate a primary and reserve
representative. 5 airports prescribed terms of between 2 to 4
years before these representatives require re-election.
No airports applied restrictions on the seniority of forum
representatives. However, representatives were generally
required to be is competent in their position and able to make
decisions on behalf of that organisation. Typically,
community forums were found to involve leaders of lobby
groups, mayors or members of parliament, senior managers
and company directors.
Community outreach – Membership of community forums
86
Airport community engagement programs
13
4
9
Community
committee
No engagement
Ad-hoc engagement
Case Study - To determine which community groups sat on the
newly created Gatwick Noise Management Board, Gatwick
asked the 14 local noise action groups to nominate candidates to
share 4 positions on the NMB. 8 groups were nominated and a
consensus was developed amongst all 14 groups to determine
the pairings to allow these 8 candidates to share the 4 positions.

w w w . a sk he l io s . c o m
Authority and Chairmanship
All groups researched held an advisory status (i.e. they
could make recommendations but not mandate
enforcement or apply penalties).
All groups had a Chairman with some groups also using a
Vice Chairman. More than 50% of the committees were not
Chaired by the local airport. Instead the Chair and Vice
Chair was typically another member on the forum who was
elected by the committee, or a Chair selected for their
independence.
In some cases, it is understood that the election of a Chair
was difficult and instead a mayor, member of parliament or
an independent consultant was used.
Structure
The community forums researched typically involved up to
20 members, with the majority operating as a single group.
However in some cases where the membership of these
groups was larger, working groups or sub-committees are
used to manage specific tasks.
The Frankfurt Airport and Regional Forum, which has 60
members, provides a good example of committee structure
involving a main committee and sub-groups. A case study
is shown opposite.
Although only five of the community forums researched use
sub-groups, almost all forums held the mandate within their
Terms of Reference to create subgroups, with the sub-
group chair nominated by the chair, on an ad-hoc basis, to
tackle specific issues.
.
Community outreach – Governance of community forums
87
Case Study - The Frankfurt airport and regional forum includes
60 representatives from the airport, airlines, pilots, research
institutes, government and trade unions. The group is
structured as follows:
• A 3 person board of directors (one from the airport operator,
one community representative and a neutral (currently the head
of the European Space Agency) representative).
• Steering committee – decides the work of the forum.
• Expert group on active noise abatement – researches and
examines different options for active noise abatement.
• Airport and Region group – undertake constructive dialogue on
the airport and its effect on communities through discussion of
environmental issues and supports the Steering committee.
• Environment and Communication centre – inform communities
of the forum’s activities.
Board of Directors
Steering committee
Expert group on Active Noise Abatement
Airport and Region group
Environment and Communication
centre
Structure of Frankfurt Airport and Region Forum, Source
http://www.forum-flughafen-region.de/en/about-us/arf/overview/

w w w . a sk he l io s . c o m
Sub-groups and workplans
The committees followed two clear trends with the majority
operating with a dedicated workplan, or undertaking works
to actively identify options for improvement. The remaining
airports focused on reviewing the works undertaken by the
airport.
If a workplan was in place, it had been developed by the
committee before being recommended to the airport or
ANSP. These workplans typically covered similar topics
including:
• Noise and tack monitoring.
• Monitoring and reducing the impact of departures.
• Monitoring and reducing the impact of arrivals.
• Providing input into consultations, policy and legislation.
The workplan would be regularly reviewed with progress
reports made by the airport or ANSP to the committee.
These reports would be made publicly available to ensure
transparency.
Community outreach – Community forum workplans
88
The workplan of community engagement committees
8 Workplan and active
engagement with
airport 6
Passive role mainly
reviewing airport
works and reports
Case Study - The Los Angeles community roundtable has
developed an extensive work program to “identify noise
impacts in the surrounding communities and to recommend
courses of action to reduce noise without shifting noise
between communities”.
The workplan was developed and agreed by the entire
roundtable. It is reviewed on an annual basis and was updated
in January 2017, it currently covers the following topics:
• Provide input to, and review the FAA airspace redesign project;
• Monitor departures, go-arounds, arrivals, engine run-ups and
the noise insulation scheme;
• Engage airlines on the A320 family ‘whine’;
• Review noise metrics to update processes including the metrics
used within the noise insulation programme;
• Establish relationships with other roundtables to increase
influence;
• Engage with technical, legislative and regulatory updates.
Each topic on the workplan is assigned a priority and workload
from airport personnel to manage key topics with the available
resources. Progress updates on each topic on the workplan
are provided at the roundtable meetings. The minutes from
these meetings are made publicly available on the airports
website.
The group has recently engaged with Untied Airlines who have
committed to undertake the modification to their A320 family
fleets to fit the vortex generators to reduce the impact of the
‘A320 whine’. This initiative was part of a joint action with San
Francisco and Chicago O’Hare community committees.

w w w . a sk he l io s . c o m
,
Community outreach - Additional case studies
89
Case Study - In the US is it is becoming more common for
airports to host community roundtables. The San Francisco
Community roundtable is a good example.
The group meets every 2 to 3 months and is chaired by a
member of the roundtable. The chair is elected by the other
members with the position held for 12 months.
Membership consists of elected officials who volunteer to
represent their community and may take part in one of 5
standing sub committees which include the:
• Work programs subcommittee,
• Operations and efficiency subcommittee,
• Legislative subcommittee,
• Departures technical working group,
• Arrivals technical working group.
Members of public can raise issues through their roundtable
representative although time is provided for public comments.
The forum has a dedicated website explaining their work and
many resources available to help public understand noise
issues.
Evidence of the roundtable’s activities/successes is publicly
available as the round table:
• Publishes their annual work program online,
• Updates the public on the progress of its projects online and via
social media.
The round table’s most significant success is the introduction of
the airport’s Fly Quiet program.
Case Study - The Gatwick Noise Management Board (NMB)
was formed as a result of an independent review of aircraft
arrivals.
The group is made up of representatives from the airport, tower
and approach ANSP, the safety regulator, government
transport department, local, parish and county councillors and
community noise lobby groups.
The group is chaired by an independent consultant and meets
every 3 months with a public forum held once a year.
The NMB is currently tasked with providing oversight on the
implementation of the remaining 22 recommendations of the
independent arrivals review to reduce the impact of arrivals
noise. In just less than a year the board has supervised the
implementation of the following changes:
• The introduction of a revised charging regime to promote the
FOPP modification of the Airbus A320;
• Reviewed land use planning rules around the airport and
shared best practice between planning authorities;
• Reviewed procedures to improve Continuous Descent Arrivals
and have identified follow-on initiatives;
• Changed the minimum ILS joining point to reduce the
concentration of approaching aircraft;
• Undertaken a review on the implementation of new technology
including Time Base Separation along with AMAN and DMAN
integration.
To ensure transparency, the group publishes its meeting
agendas, minutes and presentations online on a dedicated
page on the airports website.

w w w . a sk he l io s . c o m
Community outreach - Additional community engagement initiatives
90
Case Study - Chicago O’Hare airport is publicly owned and its
engagement forum, the O’Hare Noise Compatibility
Commission (ONCC) is made up of elected and city officials. In
total 58 members are represented with a full time executive
director and administrative assistant which manages three
standing committees covering technical matters, the residential
and schools noise insulation schemes.
Ad-hoc standing committees are used to manage the fly quiet
program, budgeting and governance. Across all of the standing
and ad-hoc committees, the ONCC held 39 meetings in 2016,
of which more than 20 were open for public attendance and the
raising of comments.
In addition, to the regular community engagement meetings,
the ONCC has a mobile community engagement vehicle which
travels to community events, festivals, schools, and libraries
through out the year. The vehicle has video presentations and
computer demonstrations that explain, among other things, the
O'Hare Airport Noise Management System and noise profiles
of different types of aircraft.
Case Study - Sydney airport has a dedicated community
engagement forum which is Independently chaired. Its
membership includes Government officials, airline
representatives, community representatives and Members of
Parliament. It meets quarterly and allows 30 minutes for pre-
arranged questions from the public.
In addition to the community forum, the airport undertakes a
dedicated and proactive process to engage with the public as
part of infrastructure and airspace changes. The most recent
engagement was undertaken as part of a runway upgrade and
involved the following actions:
• Setup and management of a dedicated consultation
website.
• Setup and management of phone lines for comments.
• Directed emails providing information and updates.
• Adverts in the local media.
• Production and distribution of information brochures to over
100,000 residences.
• The organisation of community and stakeholder consultation
meetings.
• The organisation of community question and answer
sessions.
• Door to door visits.
The Chicago Department of
Aviation community engagement
vehicle attending an event,
Source
http://www.oharenoise.org/resour
ces/publications/303-oncc-trifold-
04-15-final-web/file

Research summary
Noise ombudsman

w w w . a sk he l io s . c o m
Overview
A noise ombudsman is an independent body or person
responsible for oversight and intervention in noise
activities. Their typical responsibilities include:
• Complaints: Handling of complaints or oversight of the
complaints process;
• Community: Review consultation processes and
community concerns related to aircraft noise; and,
• Reviews: Reviews of specific aspects of noise
management.
More recently, proposals for ombudsman in the United
Kingdom and United States have moved the emphasis of
the role towards involvement in the airspace change
process, in particular community engagement during this
process.
Existing ombudsman
Currently, only Australia, the United States and Belgium
have noise ombudsman:
• In Australia, a noise ombudsman has existed since 2010.
The role of the ombudsman is to review complaints
handling, monitor community consultation processes,
monitor the presentation of noise data to the public and
undertake targeted reviews of specific aspects of noise
management. The ANO can make recommendations but
these are non-binding.
• In the United States, the noise ombudsman is part of the
FAA. The role is being revised through the FAA
Community Accountability act, which is currently with the
Senate. This act will put more emphasis on the
ombudsman liaising with communities, including the
appointment ‘community ombudsman’ in each FAA region.
• In Belgium, the Airport Mediation Service acts as a
complaints management service rather than a review and
action body.
• In the UK, an Independent Commission on Civil Aviation
Noise (ICCAN) has been proposed following the Airports
Commission review into future aviation capacity. Although
the role of ICCAN is still to be finalised, it is proposed to be
focussed on airspace change and assisting communities.
Case studies for each of the above are provided in the
following pages.
Noise ombudsman - Overview
92

w w w . a sk he l io s . c o m
Noise ombudsman - Best practice from around the world
93
• Brussels has the Airport
Mediation Office which acts as
an independent flight
performance team for the
airport, by collecting
information, complaints and
providing support to forums.
• Noise ombudsman
recommended in the UK as
part of the Airports
Commission work onto future
airport capacity. Ombudsman
is currently under consultation.
• No noise ombudsman
exists in the Far East,
however in Hong Kong the
Civil Aviation Department
is responsible for noise
management.
• No noise ombudsman,
Transport Canada has ultimate
responsibility.
• Noise ombudsman is part of
the FAA.
• It acts as "serve as a
liaison with the public on
issues regarding aircraft
noise" and "be consulted
when the Administrator
proposes changes in
aircraft routes so as to
minimize any increases in
aircraft noise over
populated areas.
• No reports of
implementation or progress
to meet the targets. It also
has no jurisdiction over
military matters.
• No noise ombudsman
exists in the Middle East.
• Noise ombudsman in existence in Australia .
• Time limits apply for historic complaints.
• Noise ombudsman is a single person.
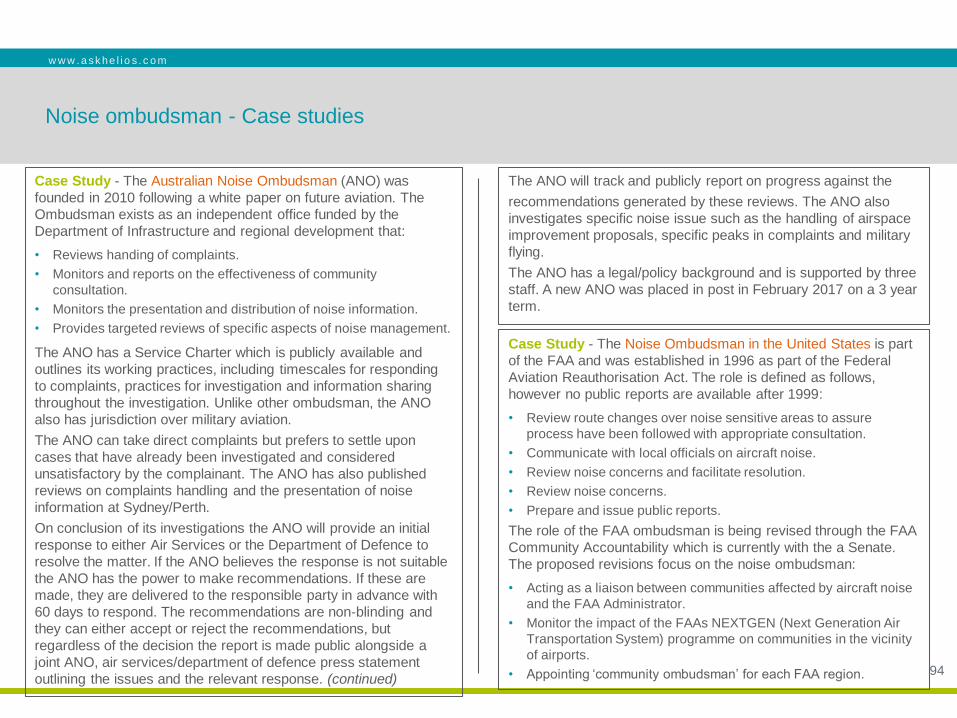
w w w . a sk he l io s . c o m
Noise ombudsman - Case studies
94
Case Study - The Noise Ombudsman in the United States is part
of the FAA and was established in 1996 as part of the Federal
Aviation Reauthorisation Act. The role is defined as follows,
however no public reports are available after 1999:
• Review route changes over noise sensitive areas to assure
process have been followed with appropriate consultation.
• Communicate with local officials on aircraft noise.
• Review noise concerns and facilitate resolution.
• Review noise concerns.
• Prepare and issue public reports.
The role of the FAA ombudsman is being revised through the FAA
Community Accountability which is currently with the a Senate.
The proposed revisions focus on the noise ombudsman:
• Acting as a liaison between communities affected by aircraft noise
and the FAA Administrator.
• Monitor the impact of the FAAs NEXTGEN (Next Generation Air
Transportation System) programme on communities in the vicinity
of airports.
• Appointing ‘community ombudsman’ for each FAA region.
Case Study - The Australian Noise Ombudsman (ANO) was
founded in 2010 following a white paper on future aviation. The
Ombudsman exists as an independent office funded by the
Department of Infrastructure and regional development that:
• Reviews handing of complaints.
• Monitors and reports on the effectiveness of community
consultation.
• Monitors the presentation and distribution of noise information.
• Provides targeted reviews of specific aspects of noise management.
The ANO has a Service Charter which is publicly available and
outlines its working practices, including timescales for responding
to complaints, practices for investigation and information sharing
throughout the investigation. Unlike other ombudsman, the ANO
also has jurisdiction over military aviation.
The ANO can take direct complaints but prefers to settle upon
cases that have already been investigated and considered
unsatisfactory by the complainant. The ANO has also published
reviews on complaints handling and the presentation of noise
information at Sydney/Perth.
On conclusion of its investigations the ANO will provide an initial
response to either Air Services or the Department of Defence to
resolve the matter. If the ANO believes the response is not suitable
the ANO has the power to make recommendations. If these are
made, they are delivered to the responsible party in advance with
60 days to respond. The recommendations are non-blinding and
they can either accept or reject the recommendations, but
regardless of the decision the report is made public alongside a
joint ANO, air services/department of defence press statement
outlining the issues and the relevant response. (continued)
The ANO will track and publicly report on progress against the
recommendations generated by these reviews. The ANO also
investigates specific noise issue such as the handling of airspace
improvement proposals, specific peaks in complaints and military
flying.
The ANO has a legal/policy background and is supported by three
staff. A new ANO was placed in post in February 2017 on a 3 year
term.

w w w . a sk he l io s . c o m
Noise ombudsman - Case studies
95
Case Study - Following the Airports Commissions study into
new airport capacity in the South East of the UK, a
recommendation was made to establish a UK Independent
Commission on Civil Aviation Noise (ICCAN).
The exact roles and responsibilities of this body are currently
under consultation by the Department for Transport as part of a
wider public consultation on airspace policy, but could include:
• Involvement in any CAA Tier 1 or 2 airspace change
processes*.
• Work with both large and small aerodromes.
• Review plans and make recommendations on behalf of
communities on airspace/noise changes.
• Assisting communities to understand proposed changes.
• Review engagement plans to ensure accessibility and
awareness of proposed changes.
Although the role of ICCAN is still to be finalised, it is proposed
to be more focussed on airspace change and assisting
communities. In addition, ICCAN:
• Could have the power to publish data to improve noise
management, which could include airline statistics and the use
of league tables, and
• Produce best practice guidelines for noise management and
community engagement.
* CAA Tier 1 or 2 airspace change includes
permanent/temporary changes, trials or procedural changes
resulting in the redistribution of air traffic.
Case Study - The Belgium Airport Mediation Service was
established in 2001 Royal decree to develop an independent
mechanism for residents, municipal administrations and
airlines to:
• Collect and handle complaints and suggestions from residents
on the use of the Brussels-National airport.
• Collect and disseminate information on the trajectories followed
and the nuisance caused by aircraft using the Brussels-National
airport according to the complaints received.
• Collect, record and analyse all relevant information to address
and determine causes of complaints from airport residents.
• Keeping up-to-date documentation on aircraft noise and
trajectory at Brussels-National airport.
• Facilitate mediation between all parties involved in the activities
of Brussels-National Airport.
• Provide logistical and administrative support to the Consultation
Forum, which should bring together periodically the various
parties concerned by the nuisances caused by overflights of
aircraft (Regions, Provinces, Municipalities, operators,
associations of local residents).
The service is an independent mediator for handling
complaints rather than a reviewer of complaints such as a
typical ombudsman. In addition, the service is focused on
Brussels-National airport, in comparison to the other
ombudsman researched which covered a much wider area.
Limited information is publicly available from the service.

Research summary
Fly Quiet programs

w w w . a sk he l io s . c o m
Fly Quiet programs - Best practice from around the world
• Heathrow airport has a FQ program which
ranks airline performance against noise
related metrics (CDAs, track keeping, early
arrivals, noise certification etc.). Reports are
published quarterly.
• No Fly Quiet programmes.
• No Fly Quiet programmes.
• Vancouver has a FQ program which directly measures aircraft noise and
compliance with noise abatement procedures. Best performers are publicly
reported upon.
• San Francisco has a voluntary FQ program. It
tracks several metrics and has a useful video on
the website. Metrics include: fleet noise quality,
noise limit violations, night runway protocol
compliance etc.
• Chicago O’Hare has run a voluntary Fly Quiet
program since 1997. It is designed to encourage
airlines to use night time runway use and flight
tracks The program tracks performance across 6
metrics - night time runway usage, night time
flight tracks, complaints, ground run-ups and night
time aircraft noise.
• No Fly Quiet
programmes.

w w w . a sk he l io s . c o m
What is a Fly Quiet program?
‘Fly Quiet program’ is a term used to describe a voluntary
initiative designed to encourage airlines to adopt new
aircraft or fly existing aircraft in a manner which minimises
their noise impact on the communities surrounding the
airport. Typically, Fly Quiet programs include the following:
• A set of metrics used to measure noise performance.
• Comparison of performance between different airlines.
• Public reporting of results.
• Awards for the best performing/most improved airlines.
Fly Quiet metrics
Fly Quiet programmes typically have 5 to 6 metrics. The
decision to use a given metric depended on a number of
factors such as ease of measurement, importance to local
communities and whether it was linked to the airport’s
noise abatement procedures (NAP)s. Some metrics
measure noise directly using noise monitors, while others
are “proxy” metrics that give a strong indication of if the
aircraft is being flown in the quietest way possible (e.g.
departure route adherence or continuous descent approach
achievement are two such proxy metrics). In general,
metrics used in Fly Quiet that can be categorised as
follows:
• Strategic metrics: These metrics are easier for airlines to
influence in the longer term such as ‘average’ aircraft noise
certification or fleet composition (e.g. Chapter number
certification).
• Operational metrics: These relate to how aircraft are
being flown and whether they are compliant with NAPs
(e.g. Continuous Descent Approach).
• Night metrics: These are based on restrictions on aircraft
operations at night (e.g. night-time flight tracks).
Comparison of performance
A key element to Fly Quiet programmes is comparing
performance across airlines – either for individual metrics
or across all metrics. This allows airports to identify and
publicise which airlines are having the lowest noise impact.
Airports typically score airline performance in each metric
and based on the results, will work with airlines to address
any identified issues.
Public reporting of results
The incentive for an airline to improve its performance is
the publication of quarterly Fly Quiet reports. As per above,
these reports can include rankings relative to other airlines,
and also how the airline’s performance complies with
minimum criteria set for each metric. Some airports also
have annual awards ceremonies to recognise the best and
most improved performers.
Public reporting in this way is a major incentive to airlines
as FQ reports are often of interest to media outlets who will
“name and shame” the worst performers, particularly if they
are based in the same country.
Fly Quiet programmes - Introduction to the area
98

w w w . a sk he l io s . c o m
Reporting
An annual awards ceremony each year to recognise the best
performers in different aircraft categories. The categories and
2015 winners are:
• Propeller aircraft - WestJet Encore.
• Narrow body jet aircraft – American Airlines.
• Wide body jet aircraft – All Nippon Airways.
Vancouver is the only airport with a Fly Quiet program that
does not produce reports on airline performance.
Where are Fly Quiet programs used?
Fly Quiet programs have been implemented at 4 of the 26
airports researched in this study. They are:
• Vancouver,
• London Heathrow,
• San Francisco,
• Chicago O’Hare.
Case studies of each are provided on the following pages.
Fly Quiet programs - Introduction to the area
99
Case Study – Vancouver airport. Vancouver has had a Fly
Quiet programme for 12 years. The program is based on noise
monitor data and compliance with NAPs.
Qualification criteria
Airlines qualify for the program if they fly a regular service to
the airport.
Metrics used
Two metrics are used:
• The airline must not be in suspected violation of any of the
published Noise Abatement Procedures.
• The airline must have the lowest average annual noise level
for their aircraft category (as measured by the Aircraft Noise
& Operations Monitoring System).
Vancouver Fly Quiet award winners (2012-2014) (source:
http://www.yvr.ca/en/about-yvr/noise-management/publications)

w w w . a sk he l io s . c o m
,
Fly Quiet programs - Case studies
100
Case Study - Heathrow airport. Heathrow airport has run a
Fly Quiet program since 2013. The program is intended to
further encourage airlines to use quieter aircraft and to fly them
in the quietest way possible.
Qualification criteria
Airlines qualify for Heathrow’s Fly Quiet program if they ranked
in the top 50 in terms of number of movements in a given
quarter. This covers over 90% of the flights at Heathrow airport
and is done to avoid airlines with low movements at Heathrow
achieving inconsistent rankings due to small variations in
actual performance (i.e. one extra violation could cause such
an airline to drop significantly in terms of overall ranking).
Metrics used
The program tracks airline performance across 6 metrics.
These are split between strategic, operational and nigh-time
metrics:
• Quota count/seat/movement: This strategic metric is
based on the quota count system described as part of the
“quieter fleet initiatives” section. The aim of this metric is to
score the noise produced per flight whilst accounting for the
fact that different aircraft operate with different frequencies
and carry a different number of passengers.
• Chapter number: This strategic metric accounts for the
average ICAO noise chapter certification of an airline’s fleet.
• Track keeping achievement: This operational metric
measures how closely a departure follows its planned route.
• Continuous descent arrival achievement: This
operational metric measures whether aircraft on arrival
descended in accordance with the published definition
which focuses on the use of continuous descent, with
minimal level segments until touchdown. This method of
flying reduces the noise impact on communities.
• Pre 0430 arrivals: This is the first of two night metrics.
Aircraft are not allowed to arrive at Heathrow before 0430. A
violation is registered when an aircraft arrives before this
time without a dispensation (which are granted in
exceptional circumstances).
• Unscheduled pre 0600 arrivals: Aircraft that are scheduled
to arrive at Heathrow after 0600 may not arrive before that
time (without a dispensation). This metric measures the
number of violations of this restriction.
(continued on next page)

w w w . a sk he l io s . c o m
,
Fly Quiet programs - Case studies
101
Case Study - Heathrow airport (continued)
Reporting
Heathrow airport publishes quarterly FQ reports /league tables
which describe the performance of each airline in two different
ways:
• Overall ranking & league table: Each airline’s score in the
6 metrics is combined to give an overall Fly Quiet ranking.
• RAG score: Instead of providing a numerical score in each
metric, Heathrow airport sets Red-Amber-Green thresholds
for performance in each metric. For example, if over 75% of
an airline’s flights use CDAs, then a green score is
awarded. Above 55% (but lower than 75%) an amber score
is awarded. Measurement of each metric and the thresholds
are described in the fly quiet reports.
Reports are publicised via the airport’s website and via press
releases. These have often been picked up by the media and
prompted airlines to work with the airport to improve their
performance. Heathrow airport does not currently hold an
awards event to recognise good performance.
An example report can be found here:
http://www.heathrow.com/file_source/HeathrowNoise/Static/Fly
Quiet_Q4_2016.pdf
Working with ‘red dot’ operators
If an airline has a ‘red dot’ in a particularly area of the leagues
table, Heathrow works closely with them to improve
performance.
Extract of Q3 2016 league table showing airline rankings and RAG scores. Source:
http://www.heathrow.com/file_source/HeathrowNoise/Static/FlyQuiet_Q3_2016.pdf
Media headlines related to Heathrow Fly Quiet program
Source: various – ITV, The Daily Telegraph, News 24

w w w . a sk he l io s . c o m
,
Fly Quiet programs - Case studies
102
Case Study – San Francisco airport. San Francisco’s Fly
Quiet program is a Community Round table initiative
implemented by the Aircraft Noise Abatement Office. The goal
of the program is to reduce single event and total noise levels
by influencing airlines to operate as quietly as possible in the
San Francisco Bay area. The San Francisco airport website
contains a 15 minute video explaining the program, its goals
and the rationale for the metrics used.
Qualification criteria
There is no information available on qualification for the
program.
Metrics used
The program consists of 6 metrics, 4 of which are specific to
the local environment:
• Fleet noise quality rating: This strategic metric is similar to
the chapter number metric at Heathrow airport. It grades the
overall noise performance of each airline’s fleet. This is
likely to be based on certified noise levels (although that is
not explicitly stated).
• Noise exceedance rating: The airport sets maximum limits
on the noise levels allowed at each of its noise monitors.
This operational metric measures the number of violations
for each airline.
• Night time runway use rating: San Francisco airport
implemented voluntary preferential runways
scheme in 1988 to maximise the number of night flights that
operated over water. This operational metric measures the
use of these preferential runways.
• Shoreline departure quality rating: This operational metric
measures track keeping on a VFR route designed to keep
aircraft over industrial areas
• Gap departure quality rating: Flights departing runway 28
use a procedure that involves them flying straight out over
urban areas (referred to locally as gap departure). This
operational metric scores aircraft depending on their altitude
at on mile intervals over these areas.
• Foster city arrival quality rating: This operational metric
scores approaches to the airport depending on whether or
not they arrived using an over water procedure at night and
thereby avoided overflying Foster City
Reporting
San Francisco produces a quarterly Fly Quiet report which ranks
airline performance across the 6 metrics. It also presents awards
each year in the following categories:
• Quietest overall airline.
• Most improved airline.
• Chairperson’s award for exceptional commitment to all aspects of
the Fly Quiet program.
An example report can be found here: http://media.flysfo.com/SFO%20Fly%20Quiet%20Report%204Q201
6.pdf

w w w . a sk he l io s . c o m
,
Fly Quiet programs - Case studies
103
Case Study – San Francisco airport (continued) Case Study – Chicago O’Hare airport. Chicago O’Hare has
had a Fly Quiet program since 1997. It is a voluntary program
that is designed to encourage the use of night time preferential
runways and flight tracks. Chicago O’Hare’s Fly Quiet program
is slightly different to others as it combines elements of
traditional noise reports with elements of a Fly Quiet program.
Qualification criteria
There is no information available on qualification.
Metrics used
The program measures five metrics, two of which are used to
compare airline performance.
• Night time runway usage: summarises night time runway
usage on each of the 7 runways. Graphs and charts are
presented showing the number of movements by aircraft per
runway, per hour and per airline.
• Night time flight tracks: This operational metric compares
the average deviation from planned flight tracks for each
airline departing from 09R or 28R at night.
• Night-time complaints: This metric tracks complaints and
complainants per community.
• Ground run-ups: This metric describes the number and
location of engine run-up tests for different airlines and
aircraft types. Unlike other metrics it is measured throughout
the day.
Extract of Q4 2016 league table showing airline rankings, scores for each metric
and overall scores. Source:
http://media.flysfo.com/SFO%20Fly%20Quiet%20Report%204Q2016.pdf

w w w . a sk he l io s . c o m
,
Fly Quiet programs - Case studies
104
Case Study – Chicago O’Hare airport (continued)
• Night time aircraft noise: This metric presents the average
Leq measured at each noise monitor during the night for a
given quarter.
Reporting
Chicago O’Hare publishes Fly Quiet reports quarterly. Data is
presented for each metric using a number of graphs, tables
and charts (depending on what is appropriate) to illustrate how
performance has changed over time.
Red-Amber-Green (RAG) scoring is to emphasis different
levels of performance for the night flight tracks and night time
aircraft noise metrics.
An example report can be found here:
https://www.flychicago.com/SiteCollectionDocuments/Commun
ity/Noise/OHare/FQ/QuaterlyReports/2016/2016-Q2.pdf
Extract of Q2 2016 Fly Quiet report for average deviation from night-time
preferential runway. Source:
https://www.flychicago.com/SiteCollectionDocuments/Community/Noise/OHare/FQ/
QuaterlyReports/2016/2016-Q2.pdf

w w w . a sk he l io s . c o m
The diagram on the right
summarises the metrics that have
been used in airport Fly Quiet
programs.
Metrics have also been categorised
into either strategic, operational,
night (or a combination of two).
Although complaints are part of
Chicago O’Hare’s Fly Quiet program,
this metric does not fit into any of the
categories.
Where metrics used are similar at
different airports they have been
grouped into a generic description
(e.g. Heathrow’s chapter number
metric is similar to San Francisco’s
fleet noise quality rating and
therefore these have been grouped
into ‘fleet noise certification’).
Fly Quiet programmes – Summary of metrics used
105
QC/seat/movement
Fleet noise certification
Continuous descent
arrivals achievement
(CDA)Flight track keeping
achievement (TK)
Pre 0430 arrivals
Unscheduled
pre 0600
arrivals
STRATEGIC
OPERATIONAL
NIGHT
Noise exceedances
Night time
runway use
Over water
departure
achievement
Minimum
height
achievement
Night time over water
departure achievement
Complaints
Night time
TK
Average
measured
night noise
Ground run up
monitoring
Violation
of NAPs
Average annual noise

Research summary
Reporting of noise monitor data

w w w . a sk he l io s . c o m
Introduction
This area of research investigated how airports report on
aircraft noise. It concentrates on the types of noise
measures used and how noise information is presented to
the public.
Typical practices
Traditional metrics: A number of different metrics were
used by airports to measure noise. The majority of these
were internationally recognised, such as Leq, or a variation
of these. Decibel units were commonly used but these are
considered difficult to understand on paper as they are a
logarithmic measure.
Online platforms: Online flight tracking tools such as
WebTrak or CASPER were commonly used to report live
and historical noise data. The tools displayed the location
and noise measurements at each noise monitor,
accompanied by a colour scale to provide an idea of
relative volume.
Traditional noise reports: Many airports produced “print
friendly” noise reports, either monthly, quarterly or annually.
These typically presented charts and graphs of noise
monitor. The level of detail varied significantly, with some
including additional explanation of data and others, only
graphs.
Special and unique practices
Number above metrics: Sydney airport uses “number
above” metrics to report on noise data. This metric
describes the number of noise events that exceed a
threshold set by the airport.
Bespoke noise reports: Heathrow, Chicago O’Hare and
Sydney airports use temporary noise monitors to produce
bespoke noise reports for specific communities.
Noise contours: Some airports produced noise contours
either based on historical or forecast noise data. Typically
contours were based on traditional noise metrics.
Regional trends
There were no significant regional trends in this research
area. The majority of airports measured and reported
noise, although the specifics of how this was done were up
to the discretion of each airport.
Reporting of noise monitor data - Introduction to the area
107

w w w . a sk he l io s . c o m
Reporting of noise monitor data - Best practice from around the world
108
• Airports have noise monitoring systems which are
sometimes integrated with flight tracking systems. Data is
reported as Leq, LAeq and dBA depending on the airport.
• Airports prepare reports available online. In general these
present data in bar charts or similar.
• Reports are generally either too simple to be meaningful or
too technical to be understandable. However, online tools
are useful.
• Heathrow produces specialist noise reports for specific local
areas.
• Hong Kong has 16 noise
monitors along with a flight
track monitoring system.
Reported in a table online
but cannot be sure how
often it’s updated. Covers
all noise monitors and the
percentage of noise levels
between various limits
(<65, 65-69, 70-74 and
>75.).
• Airports use online tools which are integrated with web tracking
tools, Data reported in Leq in Sydney and dBA in Casper.
• Reports are generated on a annually. However they are
technical and could be improved with description and layout.
• Sydney identifies the number and location of noise events
above 70dBA and reports these online along with the aircraft
type which broke the limit.
• Sydney reports are also not easy to understand as noise is
reported in dBA which is different to the online tool.
• YVR, Toronto and Montreal use Leq as reported in online
monitoring tools.
• Reports are produced annually and summarise data over
the entire year. However, by the time the reports are
produced they are often out of date.
• Airports have online tracking systems
which are integrated into noise monitor
systems. Data is reported using a variety of
metrics but Leq and CNEL are most
common.
• Noise reports are produced annually but
these could be considered to be a “data
dump”.
• O’Hare provides noise monitor information
in Lmax, Leq and Sel for each monitor.
However, although this provides a detailed
overview it could be considered confusing.
• No information
available on noise
reporting.

w w w . a sk he l io s . c o m
Noise metrics – Overview of research
The key findings of the research were:
• 22 of 26 airports researched used noise monitors.
• A number of different metrics were used by different
airports to report noise monitor data.
• The Leq metric was used most frequently.
• All metrics have advantages and disadvantages in terms of
usefulness and understandability.
Traditional noise metrics
The majority of airports reported noise in terms of
traditional acoustic measures such as decibels. A variety of
metrics are used to report on aircraft noise. Some are
internationally recognised such as Leq, while others are
national metrics such as the Australian Noise Exposure
Index (ANEI), often based on variations of internationally
recognised metrics. Traditional noise metrics are often
regarded as difficult to understand by the general public as
they are logarithmic and can be difficult to equate to an
individual’s perception of a noise event.
Number above metrics
Sydney airport reports on the number of aircraft events
above 70 decibels (dBA), referred to has the N70 metric.
The advantage of this metric is that it is simple to
understand and gives an indication of how noise would
change if traffic increased or decreased. For example, if the
number of flights doubled the number of events about
70dBA would double – this of course relies on all things
being equal and does not account for changing in traffic
mix. Another weakness of this metric is that it treats all
events above 70dBA the same. Conversely it is argued that
this does not matter as long as the 70dBA threshold
reflects the point at which aircraft noise becomes an
annoyance. In any case, if necessary it is possible to report
on the number of events over other thresholds.
Number above metrics are typically reported either in
tabular format or using noise contours. If a tabular format is
used, then the table shows the number of events in a fixed
area. If noise contours are used, the number of events is
fixed and the area within the contour varies.
Further detail on the use of the number above metrics at
Sydney airport is provided in a case study on the following
pages.
Reporting of noise monitor data – Noise metrics
109

w w w . a sk he l io s . c o m
Case study – N-above metrics
Sydney airport is the only airport in the study that currently uses
the N-above metric to publicly report noise data and has done so
since 1997. The decision to use the metric arose from extended
consultation with community representatives on understandable
methods of reporting noise data as part of the development of
Sydney’s Long Term Operational Plan (LTOP). Discussions initially
focussed on creating single event dBA noise contours for each
aircraft type and flight path. However, this proved too complicated
to implement for the large number of people concerned and the
multiplicity of flight paths and aircraft types involved. Thus the N-
above metric was deemed more suitable.
Sydney airport currently uses the N70 metric (the number of noise
events above 70dBA) and
produces contour maps for day
time hours and sensitive times of
day (0600-0700 and 2000-2300).
These are available in the Sydney
airport Australian Noise Exposure
Index (ANEI) reports which are
published on a quarterly and
annual basis
Sydney airport Q4 2016 ANEI
report N70 contours. Source:
http://www.airservicesaustralia.co
m/wp-content/uploads/Sydney-
N500-ANEI-Report_Q42016.pdf
Reporting of noise monitor data – Metrics
110
In addition to producing noise contour reports, Sydney airport also
reports on N-above metrics on an online platform. Maps are
presented for each quarter which display the average daily noise
events over 70dBA at each noise monitor. Charts are also
presented showing the hourly distribution of noise events over
70dB, distribution by event noise level and average noise level per
aircraft type.
Short term noise monitoring
Sydney airport also has a number of temporary noise monitors
which are typically installed for a period of 3 months. These are
used to assess the impact of a procedural change, obtain data to
refine the airport’s noise modelling or assess a site’s suitability for
a permanent noise monitor. The airport produced noise reports for
these monitors, focussing on the number of events over 60dBA
and 75dBA.
.
Average daily noise events over 70dBA for Q4 2016. Source:
http://aircraftnoiseinfo.bksv.com/sydney/noise-monitoring/

w w w . a sk he l io s . c o m
Challenges of establishing suitable noise metrics
Establishing a suitable metric for airports to measure and
report noise is challenging. Noise is a complex
phenomenon and as such no one metric is perfect. Each
has its merits and drawbacks. Useful insight into the
challenge is provided by the UK CAA in its survey of noise
attitudes.
Reporting of noise monitor data – Noise metrics
111
Case Study – UK CAA survey of noise attitudes
The UK CAA published its survey of attitudes to noise in 2017.
The overall aims of the survey included understanding current
attitudes to aviation noise, what influences these attitudes and
to examine whether the currently used measure of annoyance
in the UK, LAeq, is the appropriate measure of annoyance for
measuring the impact on people living around major airports.
Methodology
The main body of the survey was composed of two parts:
• Social survey: This aimed to understand the household
characteristics, attitudes to noise (from all sources), noise
sensitivity and attitudes towards the environment of
survey participants.
• Correlating noise exposure and annoyance: The
second part of the survey asked more specific questions
on annoyance caused by aviation noise, combined these
results with the social survey and then with actual noise
data to determine the correlation between noise exposure
and annoyance.
Conclusions
One of the main conclusions of the survey was that, compared
to other noise indicators, the traditional LAeq metric correlated
best with annoyance with aircraft noise, but the population
struggled with the metric. It therefore summarised that ‘there is,
therefore merit in considering greater use of Nx [number
above] metrics as supplemental indicators to help portray noise
exposure, but recognising that evidence-based decisions
should continue to use LAeq’
Source: UK CAA Survey of noise attitudes 2014, CAP1506, 2017.
http://publicapps.caa.co.uk/docs/33/CAP%201506%20FEB17.pdf

w w w . a sk he l io s . c o m
Noise reporting – Overview of research
Four main ways of reporting measurements of aircraft
noise were identified by the research – online platforms,
reporting of noise monitor data, bespoke noise reports for a
given community and noise contours.
Online platforms
12 of the airports researched had an on online platforms
with all except one providing both live and historical noise
data. In general, these presented flight tracking data,
together with the location of noise monitors. As aircraft
passed a given monitor, some form of colour coding was
used to visualise the change in noise levels – typically
louder events were presented as being towards the red end
of a colour scale, and quieter events as towards the green
end of the colour scale. An example for Copenhagen
airport is shown on the right. The peak in aircraft noise due
to the arriving aircraft is clearly visible.
In addition to live data, online platforms are now starting to
emerge which summarise noise data in a given timeframe.
For example, Gatwick’s Casper system presents a series of
charts (see case study on the following page). These can
be updated by the user for a specific timeframe and/or
noise monitor. Sydney uses a simple website to report
quarterly on noise monitor data. For a given
monitor/community the site provides the hourly number of
noise events about 70dBA, number of noise events at
different dBA levels and average noise generated by
aircraft types (see case study regarding N70 metrics on
previous pages).
Best practice
Gatwick’s Casper system presents a series of simple and
easy to understand charts to the user. These can be
updated based on timeframe or for a specific noise monitor
and are provided in addition to “live” reporting. Gatwick’s
system is therefore best practice.
Reporting of noise monitor data – Methods of reporting
112
Copenhagen airport’s WebTrak system showing a single noise event. Source:
http://webtrak5.bksv.com/cph

w w w . a sk he l io s . c o m
Reporting of noise monitor data – Noise metrics
113
Case study – Simple, automatically generated graphs and
charts
Online tools such as Webtrak and Casper are being
implemented by an ever increasing number of international
airports and are proving to be the most effective means of
presenting noise monitor data to communities. This is
particularly true as they are designed for live updates of noise
data and tracking of individual aircraft. Members of the public
can select an individual aircraft and can view the aircraft type,
height, speed and flight path. Furthermore, when an aircraft
passes a noise monitor, users are able to observe the ‘spike’ in
registered noise. Noise monitor data is typically presented with
colour scales to aid understanding of the ‘relative volume’ of
the noise event.
Gatwick’s Casper system also presents noise monitor data in a
series of graphs including (for each monitor):
• Distribution of noise level measurements (top left),
• Noise events per hour (top right),
• Noise events per day (bottom left),
• Cumulative distribution of noise (bottom right).
Live noise monitor data from Gatwick’s Casper system. Source
http://flighttracking.casper.aero/lgw/
Graphs of noise monitor data from Gatwick’s Casper system. Source
http://noiselab.casper.aero/lgw/#page=databrowser

w w w . a sk he l io s . c o m
Traditional noise reports
13 airports produced traditional “print friendly” noise
reports. These were typically produced either monthly or
annually and typically provided information on noise
monitor data only, focussing on data such as the number of
single noise events, average and maximum noise levels,
and noise contours. The level of detail in noise reports
varied significantly. For example, Vancouver airport
presented charts on night operations, runway use, run-ups,
noise concerns and noise monitoring data, all with
accompanying explanations (see case study opposite).
This was particularly useful as it allowed the reader to draw
meaningful conclusions from the information presented.
Other airports published a series of automatically
generated charts per noise monitor.
Bespoke noise reports
Chicago O’Hare, Heathrow and Sydney place temporary
monitors in local communities and produce bespoke noise
reports for that area (see case study on the following
page). These report on both aircraft tracks and noise levels
in the area. For noise, background noise levels, aircraft
noise levels and maximum aircraft noise levels are typically
reporting upon.
Reporting of noise monitor data – Methods of reporting
114
Case study – Vancouver airport annual noise reportsVancouver airport produces annual noise reports that describe the
airport’s noise management initiatives, noise monitor data, operational
statistics and complaint summaries. Detailed tables and graphs are
presented in each section of the report. Most importantly, the reports
contain clear explanation of each graph/chart and any trends that
should be noted. This helps the reader better understand the impact
on them.
Data reported
Specifically, the reports cover the following:
• 2015 highlights: This section details the main changes introduced
by the airport including any new procedures that have been
introduced and the conclusions of any trials/studies.
• Operations in review: This section describes movements and
passenger statistics including graphs showing the change over
time, movements per hour, night flights and fleet noise certification.
• Air traffic flow: This section presents a graph of the monthly
percentage of operations in the easterly or westerly directions.
• Runway use: This section describes the percentage of operations
on each runway on a map of the airport.
• Run-ups: This section describes the number of engine run ups
over the past few years, their locations and a graph of the types of
run-up and percentage of run-ups conducted per hour.
• Noise concerns: This section described the number of complaints
and complainants (see noise complaints section for further details).
• Community survey: The airport conducts an annual survey to
track public opinion of aviation noise. A graph is presented of
percentage of respondents not annoyed by aviation noise each
year.

w w w . a sk he l io s . c o m
Reporting of noise monitor data – Methods of reporting
115
Case study – Vancouver airport annual noise reports
(continued)Noise monitoring data: This section describes the location of
noise monitors, a table of average annual noise (in dBA) for the
past 5 years, the number of single event noise levels above 70dBA
per district and the average daily number of noise events at each
noise monitor.
Case study – Chicago O’Hare bespoke noise reportsChicago O’Hare uses portable noise monitors to provide aircraft
noise information at specific residential areas of interest to citizens.
Noise monitors are typically placed at a site for 2 weeks. Reports
are typically 15 pages long and contain several charts and graphs
describing:
• Daily average noise level (DNL metric) and daily noise events.
• Noise events per hour.
• Average noise level per hour (Leq).
• Average aircraft and average “other community noise” per day.
• Cumulative distribution of aircraft noise events.
• Ranking of loudest noise events (including date, time, operator, max
noise level (Lmax), type of operation, aircraft type).
Extract from one of
Chicago O'Hare's
bespoke noise
reports. Source
https://www.flychicag
o.com/community/O
RDnoise/ANMS/Pag
es/portable.aspxExtract from Vancouver airport 2015 noise report. Source
http://www.yvr.ca/en/about-yvr/noise-management/publications

w w w . a sk he l io s . c o m
Noise contours
Some airports also produce noise contours, presenting
both historical and forecast future noise levels. These are
produced for a variety of reasons – statutory obligations,
future planning, assessing the impact of new aircraft
types/operational changes and noise insulation schemes.
Similar to noise monitor data, noise contours usually use
traditional noise metrics based upon noise exposure over a
given period of time. The exception is Sydney which
includes contours based upon the number of events above
70dBA.
Reporting of noise monitor data – Methods of reporting
116
Sydney airport N70 contours for an average day in 1998. Source
https://infrastructure.gov.au/aviation/environmental/transparent_noise/expanding/4.aspx

29 Hercules Way
Aerospace Boulevard I AeroPark
Farnborough I Hampshire
GU14 6UU I UK
Tel: +44 1252 451 651
www.askhelios.com
Management and technology consultants