Survey of Palestinian Refugees and Internally Displaced Persons
GST 104: Cartographic Design Lab 6: Countries with Refugees and Internally Displaced Persons Over 1 Million Map Design
Objective – Utilize QGIS and Inkscape to Design a Chorolpleth Map
Showing Refugees and IDPs Over 1 Million
Document Version: 2014-05-28 (Beta)
Copyright © National Information Security, Geospatial Technologies Consortium (NISGTC) The development of this document is funded by the Department of Labor (DOL) Trade Adjustment Assistance Community College and Career Training (TAACCCT) Grant No. TC-22525-11-60-A-48; The National Information Security, Geospatial Technologies Consortium (NISGTC) is an entity of Collin College of Texas, Bellevue College of Washington, Bunker Hill Community College of Massachusetts, Del Mar College of Texas, Moraine Valley Community College of Illinois, Rio Salado College of Arizona, and Salt Lake Community College of Utah. This work is licensed under the Creative Commons Attribution 3.0 Unported License. To view a copy of this license, visit http://creativecommons.org/licenses/by/3.0/ or send a letter to Creative Commons, 444 Castro Street, Suite 900, Mountain View, California, 94041, USA.
Author: Richard Smith, Ph.D. :

Lab 6 – Countries with Refugees and Internally Displaced Persons Over 1 Million Map Design
Contents 1 Introduction ................................................................................................................. 3 2 Objective: Utilize QGIS and Inkscape to Complete the Design of a Choropleth Map Showing Worldwide IDPs and Refugees ............................................................................ 4 3 How Best to Use Video Walk Through with this Lab ................................................ 4 Task 1 Load and Symbolize Basemap Data..................................................................... 4 Task 2 Classify and Symbolize Refugee Data ................................................................. 5 Task 3 Symbolize IDP Data ........................................................................................... 11 Task 4 Create Legend and Export Map.......................................................................... 13 Task 5 Challenge: Design Map Layout using Inkscape ................................................. 15 5 Conclusion ................................................................................................................. 16 6 Discussion Questions ................................................................................................ 16
8/23/2014 Page 2 of 16

Lab 6 – Countries with Refugees and Internally Displaced Persons Over 1 Million Map Design
1 Introduction
In this lab, the student will construct a choropleth map showing worldwide refugee and internally displaced people (IDP). As this is the penultimate lab for this lab series, this is the lab where the student will be ‘pushed from the nest’ so-to-speak and they will complete the final map layout without any instruction from this lab. This lab will demonstrate how to design and export the final map design (shown in Figure 1), and the student will be challenged to complete the map layout in Inkscape by modifying the map layout designed in lab 5.
Figure 1: Final Design of Map
This lab will focus primarily on data classification, symbolizing figures and grounds, creating a legend, and exporting the data to Inkscape. It is assumed that the student has completed labs 1,2, 3, 4, and 5 and has a working knowledge of Inkscape and QGIS. Because of this assumption, the student will be asked to complete tasks that were covered in the previous labs without being provided step-by-step instructions. Tasks that have not been covered in previous labs will be covered in detail in this lab. This lab includes the following tasks:
• Task 1 – Load and Symbolize Basemap Data • Task 2 – Classify and Symbolize Refugee Data • Task 3 – Symbolize IDP Data • Task 4 – Create Legend and Export Map • Challenge: Design Map Layout using Inkscape
8/23/2014 Page 3 of 16

Lab 6 – Countries with Refugees and Internally Displaced Persons Over 1 Million Map Design
2 Objective: Utilize QGIS and Inkscape to Complete the Design of a Choropleth Map Showing Worldwide IDPs and Refugees
To achieve a properly designed map, the features on the map must be easily distinguishable, attractive to the map reader, and stand out from the grounds (supporting background information/data). In this lab, the student will learn how to utilize QGIS and Inkscape to compose a well-designed choropleth map. 3 How Best to Use Video Walk Through with this Lab To aid in your completion of this lab, each lab task has an associated video that demonstrates how to complete the task. The intent of these videos is to help you move forward if you become stuck on a step in a task, or you wish to visually see every step required to complete the tasks. We recommend that you do not watch the videos before you attempt the tasks. The reasoning for this is that while you are learning the software and searching for buttons, menus, etc…, you will better remember where these items are and, perhaps, discover other features along the way. With that being said, please use the videos in the way that will best facilitate your learning and successful completion of this lab. Task 1 Load and Symbolize Basemap Data The first task we will tackle is loading all of the basemap data and symbolizing it so we have a nice ground to contrast with our figures that we will add in Tasks 2 and 3.
1. The data for this lab is located at C:\GST 104\Lab 6 on the lab machine. Copy this data to a new working directory of your choosing.
2. Open QGIS Desktop 2.2.0. 3. In QGIS Desktop, add the following vector layers to the project by clicking
Layer -> Add Vector Layer from the menu bar. All of the layers have been projected in to EPSG:54012 - World_Eckert_IV, which is the projection we will use for this project.
• ‘Ocean.shp’ • ‘Graticules 15 Degrees.shp’
4. Order the Ocean layer below the Graticules 15 Degrees layer. 5. Set the following Style properties for the Ocean layer:
• Symbol layer: Simple fill i. Simple fill Color:
1. Hue: 195 2. Sat: 42 3. Val: 97
ii. Border style: No pen
8/23/2014 Page 4 of 16

Lab 6 – Countries with Refugees and Internally Displaced Persons Over 1 Million Map Design
6. Set the following Style properties for the Graticules 15 Degrees layer: • Symbol layer: Simple fill
i. Simple line Color: 1. Hue: 60 2. Sat: 2 3. Val: 105
ii. Pen width: 0.25
Task 2 Classify and Symbolize Refugee Data In this task, you will add the dataset containing the refugee and IDP population information.
1. Add ‘UNHCR Assisted IDPS and Refugees by Country.shp’ to the QGIS Project. Order this layer at the top of the Layers list. This dataset contains two attributes of interest:
• Refugees: The number of refugees living within the country • IDPs: The number of internally displaced persons (IDPs) living within the
country. 2. Let’s take a look at the descriptive statistics of the Refugee field to get a feeling
for its form. Click VectorAnalysis ToolsBasic statistics to open the Basic statistics dialog. We will use this dialog to run basic descriptive statistics on the Refugee field.
3. Set the following options in the Basic statistics dialog then Click OK to see the results shown in Figure 2:
• Input Vector Layer: ‘UNHCR Assisted IDPS and Refugees by Country’ • Target field: ‘Refugees’
8/23/2014 Page 5 of 16

Lab 6 – Countries with Refugees and Internally Displaced Persons Over 1 Million Map Design
Figure 2: Basic Statistics of Refugees Field
Reviewing the statistics, take note of the Mean, StdDev, Min, Max, and Median. Because the Median is significantly lower than the Mean, that tells us that the data is negatively skewed. The StdDev seems reasonable, if not a little large. Finally, notice that the Min value is -99. In this field, -99 represents a country with ‘No Data’ (aka. NULL). Since -99 is a numeric value, it is being included in the basic statistics and is skewing our data. Additionally, the Max value is more than 9 times the standard deviation! This makes the maximum value seem like a prime candidate for being an outlier that we should handle separately.
4. Open the Attribute table and sort the Refugee field in descending order. Note that the largest value is almost twice the next largest value (shown in Figure 3).
Figure 3: Top 5 Refugee Populations
It turns out that Pakistan is the country with the largest refugee population. Because it is so much larger than the rest of the data, we will treat it separately for classification
8/23/2014 Page 6 of 16

Lab 6 – Countries with Refugees and Internally Displaced Persons Over 1 Million Map Design
and statistics purposes. Additionally, we should exclude the -99 values when we run our basic statistics and classification. Let’s do that now.
5. Right-click on the UNHCR… layer in the Layers list and choose Filter…. This opens a Query Builder dialog.
6. Enter the following expression to exclude Pakistan and -99 values. • "admin" != 'Pakistan' AND "Refugees" != -99
7. Click OK to apply the filter. Note that Pakistan and the countries with -99 refugees are now missing from the map and attribute table.
8. Re-run the Basic Statistics from steps 2 and 3. The results are shown in Figure 4.
Figure 4: Re-Run of Basic Statistics on Refugees Field
Review the basic statistics again. Note that they have changed quite significantly. The N value reduced from 177 to 151 which means that 26 countries were filtered out. While the Mean stayed roughly the same, the Median increased by 1,569, and the StdDev decreased by 38,891. These set of statistics give us a better understanding of the nature of the data and will help guide us when classifying the data. Let’s classify the Refugee data now.
9. Close the Basic statistics dialog. 10. Open the Style properties for the UNHCR… layer. 11. Set the following Style properties (shown in Figure 5):
• Classification type: Graduated • Column: Refugees
8/23/2014 Page 7 of 16

Lab 6 – Countries with Refugees and Internally Displaced Persons Over 1 Million Map Design
• Symbol: Click ‘Change…” button i. Simple fill:
1. Border width: 0.3. • Classes: 5 • Color ramp: Greens • Mode: Natural Breaks (Jenks)
12. Click ‘Classify’ button to classify the data.
Figure 5: Refugee Field Style Properties
13. Click OK to apply the style to the map. Notice that there is quite a bit of white
on the map that is a bit overpowering. Additionally, Pakistan and the -99 countries are still missing. Let’s re-introduce and symbolize the missing countries while removing the white class.
14. Clear the Filter for the UNHCR layer. 15. Open the Style properties for the UNHCR… layer. 16. Since the first two classes only range from 2 to 123,485, which is within the first
standard deviation, let’s combine those two classes and re-use the lowest class for the -99 countries. Double-click on the values for the lowest class (2.0000 – 30083.0000) to edit the class bounds.
17. Set the Lower value and Upper value both to -99 then click OK to set the new class bounds. See Figure 6 for reference.
8/23/2014 Page 8 of 16

Lab 6 – Countries with Refugees and Internally Displaced Persons Over 1 Million Map Design
Figure 6: Editing Class Bounds of Lowest Class
18. Double-click on the values for the second-lowest class (30083.0000 – 123485.0000) to edit the class bounds.
19. Set the Lower value to 2.0 then click OK to set the new Lower class bound. 20. Let’s symbolize the -99 data as a grey color so it looks different from the refugee
data; a different hue represents a different ‘type’ of thing, and, no data is different from data.. Double-click on the symbol for the -99 - -99 class to open the Symbol selector.
• Set the following Symbol properties: i. Simple fill:
1. Fill Color: a. Hue: 223 b. Sat: 28 c. Val: 163
2. Border width: 0.3 21. Click ‘Add class’ to add a new class to the style. We will set this class to
represent Pakistan. 22. Change the Lower value and Upper value of the class both to 1621525. 23. Let’s symbolize the Pakistan country as a maroon color so it looks different from
the refugee data and can have attention drawn to it. Double-click on the symbol for the 1621525.0000 – 1621525.0000 class to open the Symbol selector.
• Set the following Symbol properties: i. Simple fill:
1. Fill Color: a. Hue: 4 b. Sat: 255 c. Val: 100
2. Border width: 0.3 24. Click OK to apply the style to the map. Your map should now resemble Figure 7.
8/23/2014 Page 9 of 16

Lab 6 – Countries with Refugees and Internally Displaced Persons Over 1 Million Map Design
Figure 7: Refugees Field Classification So Far
25. Re-open the style properties for the UNHCR… layer.
Let’s review the classification as it stands now. Refer to Figure 8 for a screenshot of the classification. I’d like to make three observations: 1) the labels do not reflect the classification anymore; 2) there are overlapping class boundaries (which class does 301068.0000 below to, for instance?); 3) the class boundaries represent no gaps between the classes (i.e. the class boundaries do not always represent actual data values).
Figure 8: Refugees Field Classification Boundaries
Let’s address all three observations by a) changing the class boundaries to represent actual minimum and maximum values, b) updating the labels to represent the new class boundaries. By sorting the Refugee column values in the attribute table, we can see that the lower boundaries for the top three classes are all wrong (123485 and 301068 do not exist, and 613104 is the upper boundary for the previous class). Let’s change them.
26. Set the lower boundary values for the top three classes so the classes are the same as shown in Figure 9.
8/23/2014 Page 10 of 16

Lab 6 – Countries with Refugees and Internally Displaced Persons Over 1 Million Map Design
Figure 9: Modified Class Boundaries
27. Now that all of the classes are set, we should update the Label field to reflect the
changes we made. Set the following label values as shown in Figure 10. Essentially you are:
• removing the decimal numbers • adding thousands separators • changing -99 to No Data • identifying Pakistan and Iran by name since they are in classes by
themselves and, as they are the highest values, might be countries of interest and easy identification.
Figure 10: Modified Class Labels
Task 3 Symbolize IDP Data With the refugees mapped, now we will map the countries with IDPs numbering over 250,000 so we can bring special attention to those countries. As we have already assigned a fill color to each country, we need to get creative in how we can show which countries have over 250,000 IDPs. Let’s overlay a hachure on the countries with high IDP values.
1. Duplicate the UNHCR… layer by right-clicking the UNHCR… layer in the Layers list then choosing Duplicate.
2. Turn on layer visibility for the original UNHCR… layer. 3. Rename the top UNHCR… layer to ‘High IDP Countries’. 4. Open the style properties for the ‘High IDP Countries’. 5. Click Delete all button to remove all classes. 6. Click Add class button to add a single class. 7. Set the Lower value to 250000 and the Upper value to 4744096 (highest IDP
value).
8/23/2014 Page 11 of 16

Lab 6 – Countries with Refugees and Internally Displaced Persons Over 1 Million Map Design
8. Change the class’ label to ‘More than 250,000 IDPs’ 9. Double-click on the symbol for the class to open the Symbol selector.
• Set the following Symbol properties (shown in Figure 11): i. Simple fill:
1. Symbol layer type: Line pattern fill 2. Distance: 2.0 3. Line:
a. Simple line: i. Color:
1. Hue: 0 2. Sat: 0 3. Val: 0
ii. Pen width: 0.25
Figure 11: IDP Symbol Properties
With all of the symbology now set, your map should look like Figure 12.
Figure 12: Final Map Design
8/23/2014 Page 12 of 16

Lab 6 – Countries with Refugees and Internally Displaced Persons Over 1 Million Map Design
10. Save your QGIS Project as ‘Worldwide Refugee and IDP Population.qgs’. Task 4 Create Legend and Export Map With the map design complete, let’s create a legend then export the map in to Inkscape.
1. Click ProjectNew Print Composer and name it ‘Worldwide IDPs and Refugees’.
2. In the Composition Panel, under the Composition tab, set the following properties:
a. Paper and quality i. Presets: ANSI A (Letter; 8.5x11 in)
ii. Orientation: Landscape iii. Page background:
1. Transparency: 100% iv. Print as raster: unchecked
3. Add the map to the composition and make it the same size as the page. Center the world on the page.
4. With the map selected, in the Composition panel, under the Item properties tab, uncheck ‘Background’ so that the background is transparent.
Now we will add the legend.
5. Click Add new legend button and click on the map. This will add the legend to the map. Let’s change some basic legend properties before we dive in deeper.
6. With the legend selected, in the Composition panel, under the item properties tab, set the following properties:
a. Main properties i. Title: (none)
b. Background: unchecked c. Fonts:
i. Subgroup font… 1. Font: Arial 2. Size: 11
ii. Item font… 1. Font: Arial 2. Size: 10
iii. Font color… 1. Hue: 0 2. Sat: 0 3. Val: 255
d. Symbol: i. Symbol width: 6.00 mm
8/23/2014 Page 13 of 16
Lab 6 – Countries with Refugees and Internally Displaced Persons Over 1 Million Map Design
ii. Symbol height: 4.00 mm 7. Now let’s remove the Ocean and Graticules from the legend. In the Item
properties tab, under Legend items group: a. Select the Graticules 15 Degrees entry then press the remove button
. This will remove it from the legend. b. Remove the Ocean entry from the legend.
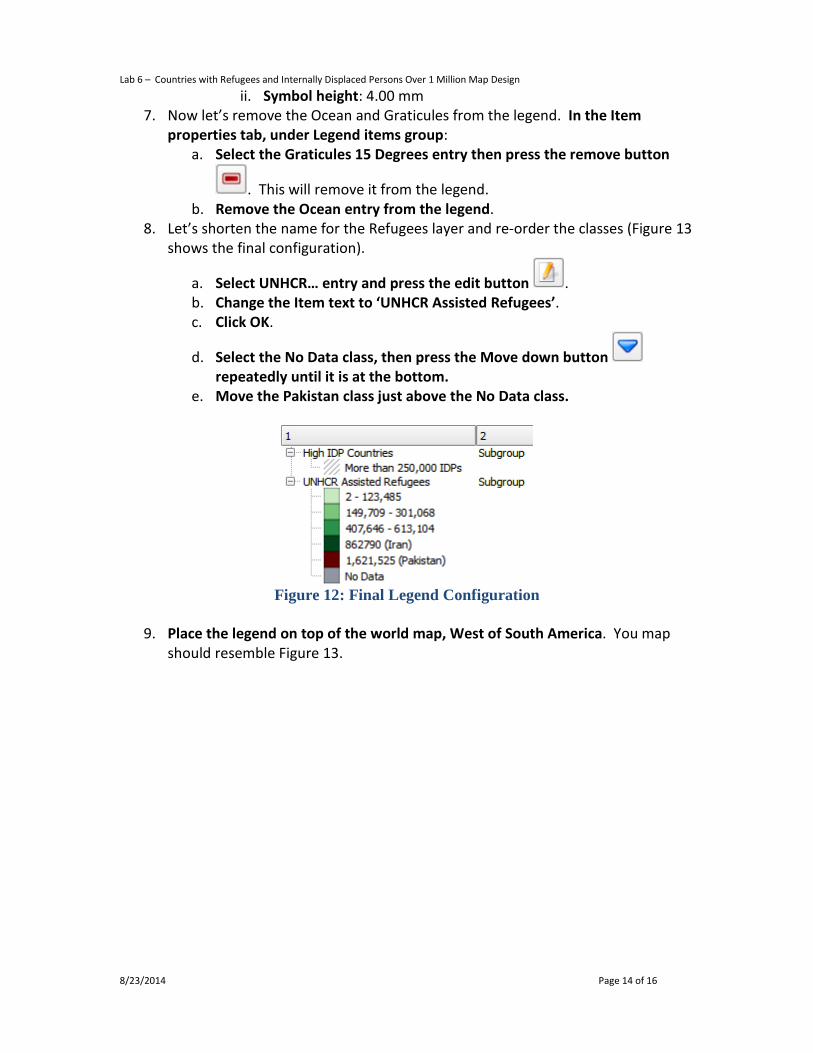
8. Let’s shorten the name for the Refugees layer and re-order the classes (Figure 13 shows the final configuration).
a. Select UNHCR… entry and press the edit button . b. Change the Item text to ‘UNHCR Assisted Refugees’. c. Click OK.
d. Select the No Data class, then press the Move down button repeatedly until it is at the bottom.
e. Move the Pakistan class just above the No Data class.
Figure 12: Final Legend Configuration
9. Place the legend on top of the world map, West of South America. You map
should resemble Figure 13.
8/23/2014 Page 14 of 16

Lab 6 – Countries with Refugees and Internally Displaced Persons Over 1 Million Map Design
Figure 13: Final Map Design Ready for Export
10. Export the map as a PDF named ‘Worldwide Refugee and IDP Population.pdf’.
Task 5 Challenge: Design Map Layout using Inkscape Using what you have learned in all of the labs up to this point, design a final map layout in Inkscape. In your final map layout, use any page size and orientation that you feel would be appropriate for the map. Be sure to add ancillary text and metadata to explain your map (feel free to do some research online to add interesting text/pictures/graphs (cite your sources!)). You may want to start by modifying the layout you designed in Lab 5 so that both maps look like they are part of the same map series, but this is not a requirement.
Additionally, modify the legend so that it looks like the legend in Figure 14 (hint: ungroup a few times to get access to the legend, then move it to its own layer).
Figure 14: Split Legend Design Example ancillary text:
The United Nations High Commissioner for Refugees (UNHCR) defines refugees as individuals who are outside their country of nationality or habitual residence
8/23/2014 Page 15 of 16
Lab 6 – Countries with Refugees and Internally Displaced Persons Over 1 Million Map Design
because of persecution, war, or violence. Internally displaced persons (IDPs) are defined as persons who have been forced to flee their home for the same reason as a refugee, but remain in their own country and have not crossed an international border. This Map the number of refugees each country contains and IDPs in their respective countries of origin. All data are current as of mid-2013 or the latest available estimates.
Example metadata:
Data Sources: data.unhcr.org
naturalearthdata.com
5 Conclusion In this lab, you viewed the descriptive statistics for an attribute, classified data, modified a the classification, designed a hachure symbol for multivariate mapping, designed a legend, and exported a map. Additionally, you were challenged to create a map design in Inkscape. 6 Discussion Questions
1. Save your Inkscape map from Task 5 as a PDF and submit it for grading. 2. In this lab, we used hachures to show the IDP variable. What other visual
variable could you have used to show the IDP variable on the map? What would be the positives and negatives of the visual variable you chose?
3. The World Eckert IV map projection was used in this lab. Was this a good choice for mapping at a global scale? Identify at least two more map projections that would be appropriate for this type of thematic mapping. For each map projection list the projection properties and explain why it would be appropriate.
4. How would you change the classification for the refugee variable? Would you lump countries with less than 100 refugees in with countries with 123,000 refugees? Would you separate out Iran and Pakistan? Design a different classification scheme and explain how yours is an improvement on the one designed in this lab.
8/23/2014 Page 16 of 16