GSM WCDMA Report - FCC ID Search ZTE Corporation Address: ZTE Plaza, Keji Road South, Shenzhen,...
97
Report No.: SET2016-11616 CCIC-SET/T(00) Page 1 of 97 RF TEST REPORT Report No.: SET2016-11616 Product: LTE USB Modem FCC ID: SRQ-MF831 Model No.: MF831 Applicant: ZTE Corporation Address: ZTE Plaza, Keji Road South, Shenzhen, China Dates of Testing: 06/20/2016 — 07/04/2016 Issued by: CCIC-SET Lab Location: Electronic Testing Building, Shahe Road, Xili Town, Shenzhen, 518055, China Tel:86 755 26627338 Fax:86 755 26627238 This test report consists of 97 pages in total. It may be duplicated completely for legal use with the approval of the applicant. It should not be reproduced except in full, without the written approval of our laboratory. The client should not use it to claim product endorsement by CCIC-SET. The test results in the report only apply to the tested sample. The test report shall be invalid without all the signatures of testing engineers, reviewer and approver. Any objections must be raised to CCIC-SET within 15 days since the date when the report is received. It will not be taken into consideration beyond this limit.
Transcript of GSM WCDMA Report - FCC ID Search ZTE Corporation Address: ZTE Plaza, Keji Road South, Shenzhen,...
Report No.: SET2016-11616
CCIC-SET/T(00) Page 1 of 97
RF TEST REPORT
Report No.: SET2016-11616
Product: LTE USB Modem
FCC ID: SRQ-MF831
Model No.: MF831
Applicant: ZTE Corporation
Address: ZTE Plaza, Keji Road South, Shenzhen, China
Dates of Testing: 06/20/2016 — 07/04/2016
Issued by: CCIC-SET
Lab Location: Electronic Testing Building, Shahe Road, Xili Town, Shenzhen,
518055, China
Tel:86 755 26627338 Fax:86 755 26627238
This test report consists of 97 pages in total. It may be duplicated completely for legal use with the approval of the applicant. It should not be reproduced except in full, without the written approval of our laboratory. The client should not use it to claim product endorsement by CCIC-SET. The test results in the report only apply to the tested sample. The test report shall be invalid without all the signatures of testing engineers, reviewer and approver. Any objections must be raised to CCIC-SET within 15 days since the date when the report is received. It will not be taken into consideration beyond this limit.

Report No.: SET2016-11616
CCIC-SET/T(00) Page 2 of 97
Test Report
Product…………………....: LTE USB Modem
Brand Name………………: ZTE
Trade Name……………....: ZTE
Applicant………………….: ZTE Corporation
Applicant Address……...: ZTE Plaza, Keji Road South, Shenzhen, China
Manufacturer……………..: ZTE Corporation
Manufacturer Address….: ZTE Plaza, Keji Road South, Shenzhen, China
Test Standards………..…: 47 CFR FCC Part 2: Frequency Allocations and Radio Treaty
Matters; General Rules and Regulations
47 CFR FCC Part 22(H): Cellular Radiotelephone Service
47 CFR FCC Part 24(E): Personal Communications Services
47 CFR FCC Part 27(L): Miscellaneous Wireless
Communications Services
Test Result……………..…: PASS
Tested by……………….....:
2016.07.05
Lu Lei,Test Engineer
Reviewed by…………..….:
2016.07.05
Zhu Qi, Senior Egineer
Approved by………….......:
2016.07.05
Wu Li’an,Manager

Report No.: SET2016-11616
CCIC-SET/T(00) Page 3 of 97
Table of Contents
1. GENERAL INFORMATION .................................................................................................... 4
1.1 EUT Description ......................................................................................................................... 4
1.2 Maximum ERP/EIRP Power, Frequency Tolerance, and Emission Designator ................... 6
1.3 Test Standards and Results ........................................................................................................ 7
1.4 Test Configuration of Equipment under Test .......................................................................... 9
1.5 Measurement Results Explanation Example ......................................................................... 10
1.6 Facilities and Accreditations .................................................................................................... 10
2. 47 CFR PART 2, PART 22H & 24E REQUIREMENTS ...................................................... 11
2.1 Conducted RF Output Power .................................................................................................. 11
2.2 Peak to Average Radio ............................................................................................................. 14
2.3 99% Occupied Bandwidth and 26dB Bandwidth Measurement ......................................... 22
2.4 Frequency Stability ................................................................................................................... 45
2.5 Conducted Out of Band Emissions ......................................................................................... 49
2.6 Band Edge ................................................................................................................................. 71
2.7 Transmitter Radiated Power (EIRP/ERP) ............................................................................. 80
2.8 Radiated Spurious Emissions .................................................................................................. 85
3. LIST OF MEASURING EQUIPMENT ................................................................................. 96
4. UNCERTAINTY OF EVALUATION ..................................................................................... 97
Change History
Issue Date Reason for change 1.0 2016.07.05 First edition

Report No.: SET2016-11616
CCIC-SET/T(00) Page 4 of 97
1. GENERAL INFORMATION
1.1 EUT Description
EUT Type LTE USB Modem
Hardware Version dkxA
Software Version BD_MF831V1.0.2B18
EUT supports Radios application GPRS/EDGE/WCDMA/HSPA/LTE
Multi Slot Class GPRS: Multi slot Class12, EGPRS: Multi slot Class12
Frequency Range
GSM 850MHz:
Tx: 824.2 - 848.8MHz (at intervals of 200kHz);
Rx: 869.2 - 893.8MHz (at intervals of 200kHz)
GSM 1900MHz:
Tx: 1850.2 - 1909.8MHz (at intervals of 200kHz);
Rx: 1930.2 - 1989.8MHz (at intervals of 200kHz)
WCDMA 850MHz
Tx: 826.4 - 846.6MHz (at intervals of 200kHz);
Rx: 871.4 - 891.6MHz (at intervals of 200kHz)
WCDMA 1700MHz
Tx: 1712.4 - 1752.6MHz (at intervals of 200kHz);
Rx: 2112.4 - 2152.6MHz (at intervals of 200kHz)
WCDMA 1900MHz
Tx: 1852.4 - 1907.6MHz (at intervals of 200kHz);
Rx: 1932.4 - 1987.6MHz (at intervals of 200kHz)
Maximum Output Power to
Antenna
GPRS 850: 32.65dBm
GRPS 1900: 28.51dBm
EDGE 850: 26.74dBm
EDGE 1900: 25.13dBm
WCDMA 850: 23.01dBm
WCDMA 1900: 21.68dBm
WCDMA 1700: 22.40dBm
Type of Modulation
GPRS:GMSK
EDGE:GMSK / 8PSK
WCDMA: QPSK(Uplink)
HSDPA / DC-HSDPA:QPSK(Uplink)
Report No.: SET2016-11616
CCIC-SET/T(00) Page 5 of 97
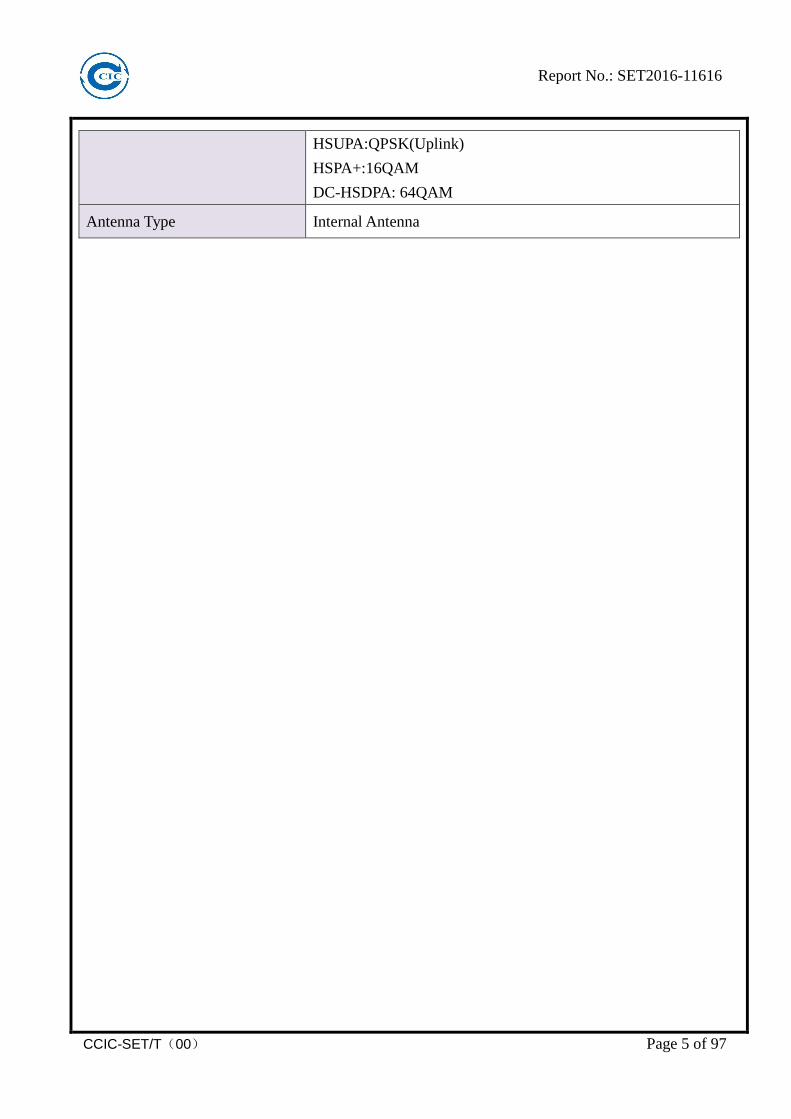
HSUPA:QPSK(Uplink)
HSPA+:16QAM
DC-HSDPA: 64QAM
Antenna Type Internal Antenna

Report No.: SET2016-11616
CCIC-SET/T(00) Page 6 of 97
1.2 Maximum ERP/EIRP Power, Frequency Tolerance, and Emission
Designator
System Type of
Modulation Emission
Designator
Frequency Tolerance
(ppm)
Maximum ERP/EIRP(W)
GPRS 850 GMSK 246KGXW 0.03 1.230
GPRS 1900 GMSK 246KGXW 0.03 0.543
EDGE 850 8PSK 244KG7W 0.03 0.338
EDGE 1900 8PSK 244KG7W 0.03 0.212
WCDMA 850 RMC 12.2Kbps
QPSK 4M16F9W 0.03 0.152
WCDMA 1900 RMC 12.2Kbps
QPSK 4M16F9W 0.03 0.115
WCDMA 1700 RMC 12.2Kbps
QPSK 4M20F9W 0.03 0.140

Report No.: SET2016-11616
CCIC-SET/T(00) Page 7 of 97
1.3 Test Standards and Results
1. 47 CFR Part 2, 22(H), 24(E), 27(L)
2. ANSI / TIA / EIA-603-D-2010
3. FCC KDB 971168 D01 Power Meas. License Digital Systems v02r02
Remark: 1. All test items were verified and recorded according to the standards and without any deviation during the test. 2. This EUT has also been tested and complied with the requirements of FCC Part 15, Subpart B, recorded in a separate test report.
Test detailed items/section required by FCC rules and results are as below:
No. Section
Description Limit Result FCC
1 2.1046 Conducted Output Power Reporting Only PASS
2 24.232(d) 27.50(d)
Peak to Average Radio <13dBm PASS
3
2.1049 22.917(b) 24.238(b) 27.53(g)
Occupied Bandwidth Reporting Only PASS
4
2.1055 22.355 24.235 27.54
Frequency Stability ≤±2.5ppm PASS
5
2.1051 22.917 24.238 27.53
Conducted Out of Band Emissions
< 43+10log10 (P[Watts])
PASS
6
2.1051 22.917 24.238 27.53
Band Edge < 43+10log10
(P[Watts]) PASS
7
22.913 Effective Radiated Power <7Watts PASS
24.232 Equivalent Isotropic
Radiated Power <2Watts PASS
27.50(d) Effective Radiated Power <1Watts PASS

Report No.: SET2016-11616
CCIC-SET/T(00) Page 8 of 97
8
2.1053 22.917 24.238 27.53
Radiated Spurious Emissions
< 43+10log10 (P[Watts])
PASS

Report No.: SET2016-11616
CCIC-SET/T(00) Page 9 of 97
1.4 Test Configuration of Equipment under Test
Antenna port conducted and radiated test items were performed according to KDB 971168
D01 Power Meas. License Digital Systems v02r02 with maximum output power.
Radiated measurements were performed with rotating EUT in different three orthogonal test
planes to find the maximum emission.
Radiated emissions were investigated as following frequency range:
1. 30 MHz to 9000 MHz for GSM850 and WCDMA Band V.
2. 30 MHz to 20000 MHz for GSM1900 and WCDMA Band II.
3. 30 MHz to 18000 MHz for WCDMA Band IV.
All modes and data rates and positions were investigated.
Test modes are chosen to be reported as the worst case configuration below:
Test Modes
Band Radiated TCs Conducted TCs
GSM 850 GPRS Link
EDGE Link
GPRS Link
EDGE Link
GSM 1900 GPRS Link
EDGE Link
GPRS Link
EDGE Link
WCDMA Band V RMC 12.2Kbps Link RMC 12.2Kbps Link
WCDMA Band II RMC 12.2Kbps Link RMC 12.2Kbps Link
WCDMA Band IV RMC 12.2Kbps Link RMC 12.2Kbps Link
Note: The maximum power levels are chosen to test as the worst case configuration as follows:
GPRS mode for GMSK modulation,
EDGE multi-slot class 8 mode for 8PSK modulation,
RMC 12.2Kbps mode for WCDMA band V,
RMC 12.2Kbps mode for WCDMA band II,
RMC 12.2Kbps mode for WCDMA band IV, only these modes were used for all tests.

Report No.: SET2016-11616
CCIC-SET/T(00) Page 10 of 97
1.5 Measurement Results Explanation Example
For all conducted test items: The offset level is set in the spectrum analyzer to compensate the RF cable loss and attenuator factor between EUT conducted output port and spectrum analyzer. With the offset compensation, the spectrum analyzer reading level is exactly the EUT RF output level.
The spectrum analyzer offset is derived from RF cable loss and attenuator factor.
Offset = RF cable loss + attenuator factor. Following shows an offset computation example with cable loss 7dB and 10dB attenuator.
Example:
Offset (dB) = RF cable loss(dB) + attenuator factor(dB). = 7 + 10 = 17 (dB)
1.6 Facilities and Accreditations
1.6.1 Test Facilities
CNAS-Lab Code: L1659 CCIC Southern Electronic Product Testing (Shenzhen) Co., Ltd. CCIC is a third party testing organization accredited by China National Accreditation Service for Conformity Assessment (CNAS) according to ISO/IEC 17025. The accreditation certificate number is L1659. A 12.8*6.8*6.4 (m) fully anechoic chamber was used for the radiated spurious emissions test. FCC-Registration No.: 406086 CCIC Southern Electronic Product Testing (Shenzhen) Co., Ltd. EMC Laboratory has been registered and fully described in a report filed with the FCC (Federal Communications Commission). The acceptance letter from the FCC is maintained in our files. Registration 406086, October 28, 2017.
IC-Registration No.: 11185A-1
CCIC Southern Electronic Product Testing (Shenzhen) Co., Ltd. EMC Laboratory has been registered by Certification and Engineering Bureau of Industry Canada for the performance of radiated measurements with Registration No. 11185A-1 on July. 15, 2013, valid time is until July. 15, 2016.
1.6.2 Test Environment Conditions
During the measurement, the environmental conditions were within the listed ranges:
Temperature (°C): 15℃- 35℃ Relative Humidity (%): 30% -60% Atmospheric Pressure (kPa): 86KPa-106KPa
Report No.: SET2016-11616
CCIC-SET/T(00) Page 11 of 97
2. 47 CFR PART 2, PART 22H & 24E REQUIREMENTS
2.1 Conducted RF Output Power
2.1.1 Definition
A system simulator was used to establish communication with the EUT. Its parameters were set to enforce EUT transmitting at the maximum power. The measured power in the radio frequency on the transmitter output terminals shall be reported.
2.1.2 Measuring Instruments
The measuring equipment is listed in the section 3 of this test report.
2.1.3 Test Procedures
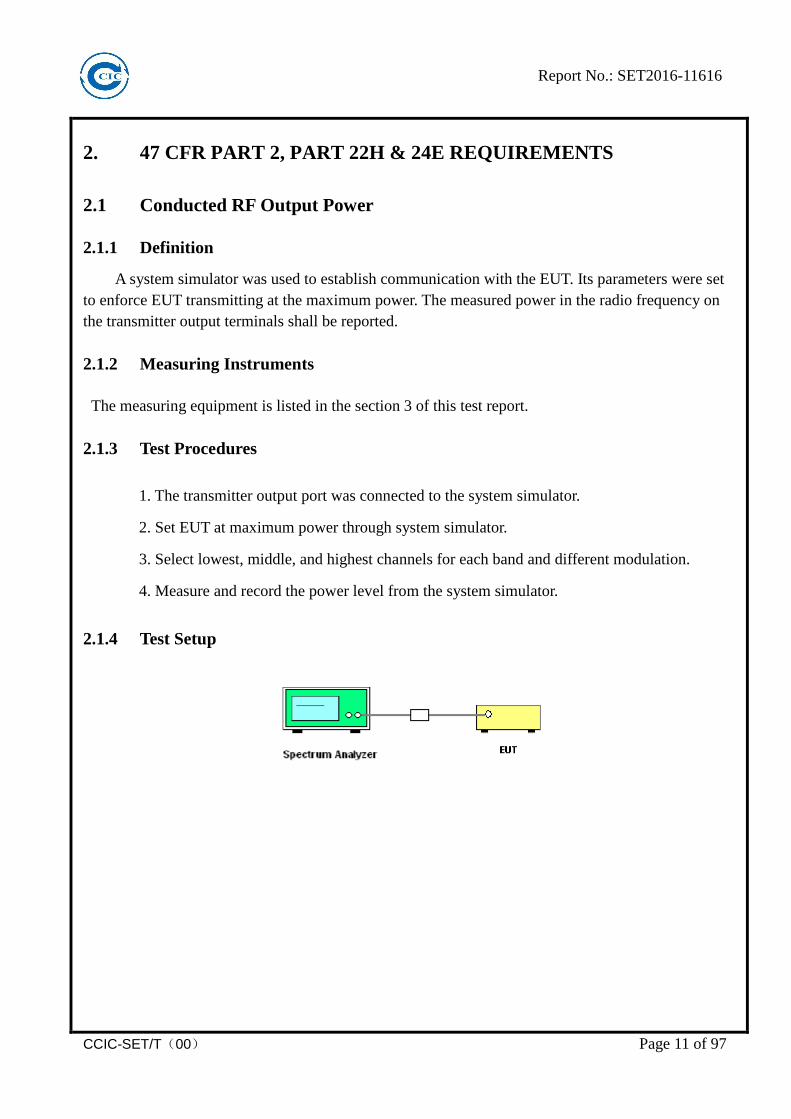
1. The transmitter output port was connected to the system simulator.
2. Set EUT at maximum power through system simulator.
3. Select lowest, middle, and highest channels for each band and different modulation.
4. Measure and record the power level from the system simulator.
2.1.4 Test Setup
Report No.: SET2016-11616
CCIC-SET/T(00) Page 12 of 97
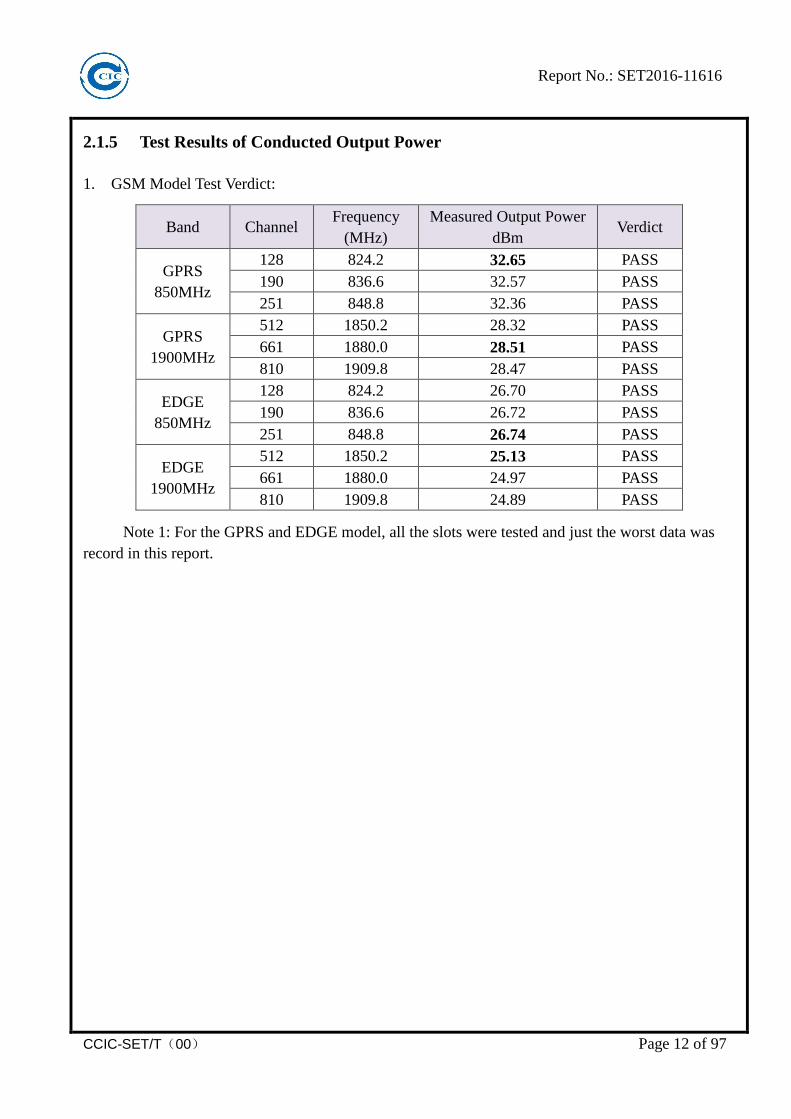
2.1.5 Test Results of Conducted Output Power
1. GSM Model Test Verdict:
Band Channel Frequency
(MHz) Measured Output Power
dBm Verdict
GPRS 850MHz
128 824.2 32.65 PASS 190 836.6 32.57 PASS 251 848.8 32.36 PASS
GPRS 1900MHz
512 1850.2 28.32 PASS 661 1880.0 28.51 PASS 810 1909.8 28.47 PASS
EDGE 850MHz
128 824.2 26.70 PASS 190 836.6 26.72 PASS 251 848.8 26.74 PASS
EDGE 1900MHz
512 1850.2 25.13 PASS 661 1880.0 24.97 PASS 810 1909.8 24.89 PASS
Note 1: For the GPRS and EDGE model, all the slots were tested and just the worst data was record in this report.

Report No.: SET2016-11616
CCIC-SET/T(00) Page 13 of 97
2. WCDMA Model Test Verdict:
Item band WCDMA 850 WCDMA 1900
Frequency 4132 4183 4233 9262 9400 9538 Subtest dBm dBm
WCDMA RMC
12.2Kbps 23.01 22.95 22.89 21.68 21.56 21.57
HSDPA
1 22.25 22.29 22.18 21.08 21.13 21.06
2 21.55 21.57 21.61 20.89 20.93 20.87
3 21.32 21.27 21.21 20.78 20.71 20.75
4 21.27 21.22 21.25 20.48 20.55 20.51
HSUPA
1 22.19 22.21 22.27 21.11 21.19 21.17
2 21.59 21.61 21.64 20.74 20.69 20.72
3 21.41 21.55 21.48 20.45 20.47 20.50
4 21.36 21.33 21.39 20.44 20.48 20.42
5 21.47 21.39 21.42 20.35 20.28 20.31
Item band WCDMA 1700
Frequency 1312 1413 1513 Subtest dBm
WCDMA RMC 12.2Kbps 22.34 22.38 22.40
HSDPA
1 21.85 21.74 21.74 2 21.71 21.65 21.68 3 21.49 21.35 21.37 4 21.24 21.31 21.30
HSUPA
1 21.74 21.77 21.81 2 21.43 21.52 21.49 3 21.47 21.45 21.50 4 21.27 21.31 21.24 5 21.12 21.15 21.21
Report No.: SET2016-11616
CCIC-SET/T(00) Page 14 of 97
2.2 Peak to Average Radio
2.2.1 Definition
Power Complementary Cumulative Distribution Function (CCDF) curves provide a means
for characterizing the power peaks of a digitally modulated signal on a statistical basis. A CCDF
curve depicts the probability of the peak signal amplitude exceeding the average power level. Most
contemporary measurement instrumentation include the capability to produce CCDF curves for an
input signal provided that the instrument’s resolution bandwidth can be set wide enough to
accommodate the entire input signal bandwidth. In measuring transmissions in this band using an
average power technique, the peak-to-average ratio (PAR) of the transmission may not exceed 13 dB.
2.2.2 Measuring Instruments
The measuring equipment is listed in the section 3 of this test report.
2.2.3 Test Procedures
1. The testing follows FCC KDB 971168 D01v02r02 Section 5.7.1.
2. The EUT was connected to the spectrum analyzer and system simulator via a power
divider.
3. For GSM/EGPRS operating modes:
a. Set EUT in maximum power output.
b. Set the RBW = 1MHz, VBW = 3MHz, Peak detector on spectrum analyzer for first trace.
c. Set the RBW = 1MHz, VBW = 3MHz, RMS detector on spectrum analyzer for second
trace.
d. The wanted burst signal is triggered by spectrum analyzer, and measured respectively the
peak level and Mean level without burst-off time, after system simulator has synchronized with the
spectrum analyzer.
4. For UMTS operating modes:
a. Set the CCDF (Complementary Cumulative Distribution Function) option on the
spectrum analyzer.
b. The highest RF powers were measured and recorded the maximum PAPR level
associated with a probability of 0.1 %.
5. Record the deviation as Peak to Average Ratio.

Report No.: SET2016-11616
CCIC-SET/T(00) Page 15 of 97
2.2.4 Test Setup
2.2.5 Test Results of Peak-to-Average Ratio
Band Channel Frequency
(MHz)
Peak to Average radio Limit Verdict
dB Refer to Plot dB
GPRS 1900MHz
512 1850.2 0.38
Plot A1 to A3 13
PASS
661 1880.0 0.58 PASS
810 1909.8 0.54 PASS
EDGE 1900MHz
512 1850.2 0.37
Plot B1 to B3 13
PASS
661 1880.0 0.21 PASS
810 1909.8 0.20 PASS
WCDMA 1900MHz
9262 1852.4 5.88
Plot C1 to C3 13
PASS
9400 1880.0 5.92 PASS
9538 1907.6 5.88 PASS
WCDMA 1700MHz
1312 1712.4 5.88
Plot D1 to D3 13
PASS
1412 1732.4 5.80 PASS
1513 1752.6 5.88 PASS

Report No.: SET2016-11616
CCIC-SET/T(00) Page 16 of 97
2.2.6 Test Results (Plots) of Peak-to-Average Ratio
(Plot A1: GPRS 1900 MHz Channel = 512)
(Plot A2: GPRS 1900 MHz Channel = 661)
Report No.: SET2016-11616
CCIC-SET/T(00) Page 17 of 97
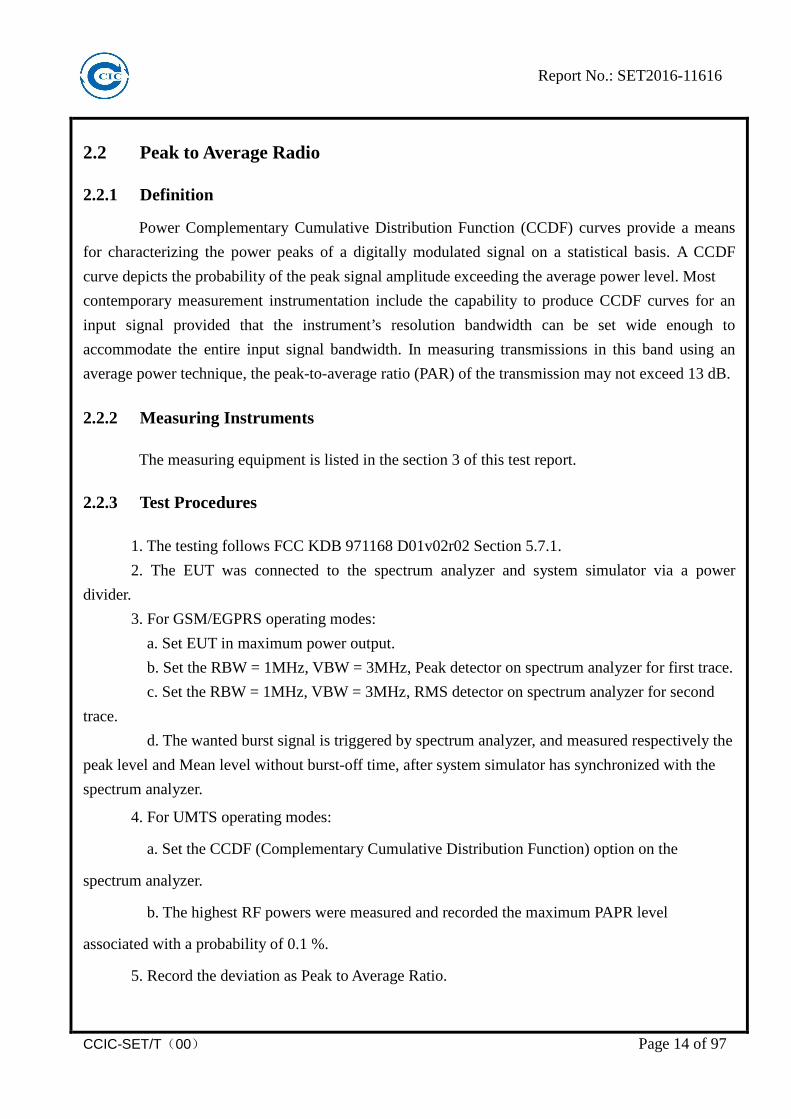
(Plot A3: GPRS 1900MHz Channel = 810)
(Plot B1: EDGE 1900 MHz Channel = 512)

Report No.: SET2016-11616
CCIC-SET/T(00) Page 18 of 97
(Plot B2: EDGE 1900 MHz Channel = 661)
(Plot B3: EDGE 1900MHz Channel = 810)
Report No.: SET2016-11616
CCIC-SET/T(00) Page 19 of 97
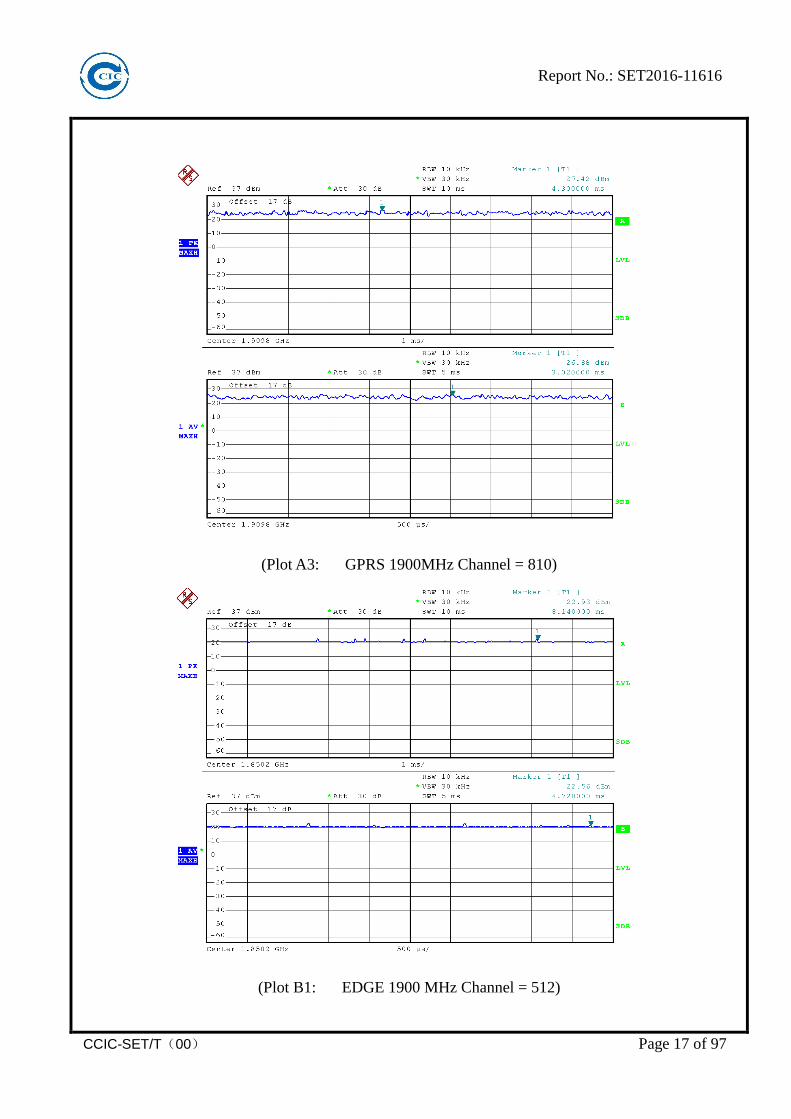
(Plot C1: WCDMA 1900MHz Channel = 9262)
(Plot C2: WCDMA 1900MHz Channel = 9400)

Report No.: SET2016-11616
CCIC-SET/T(00) Page 20 of 97
(Plot C3: WCDMA 1900MHz Channel = 9538)
(Plot D1: WCDMA 1700MHz Channel = 1312)

Report No.: SET2016-11616
CCIC-SET/T(00) Page 21 of 97
(Plot D2: WCDMA 1700MHz Channel = 1412)
(Plot D3: WCDMA 1700MHz Channel = 1513)

Report No.: SET2016-11616
CCIC-SET/T(00) Page 22 of 97
2.3 99% Occupied Bandwidth and 26dB Bandwidth Measurement
2.3.1 Definition
The 99% occupied bandwidth is the width of a frequency band such that, below the lower
and above the upper frequency limits, the mean powers emitted are each equal to a specified
percentage 0.5% of the total mean transmitted power.
The emission bandwidth is defined as the width of the signal between two points, located at
the 2 sides of the carrier frequency, outside of which all emissions are attenuated at least 26 dB below
the transmitter power.
2.3.2 Measuring Instruments
The measuring equipment is listed in the section 3 of this test report.
2.3.3 Test Procedures
1. The testing follows FCC KDB 971168 D01v02r02 Section 4.2.
2. The EUT was connected to the spectrum analyzer and system simulator via a power
divider.
3. The RF output of the EUT was connected to the spectrum analyzer by RF cable and
attenuator.
The path loss was compensated to the results for each measurement.
4. The 99% occupied bandwidth were measured, set RBW= 1% of span, VBW= 3*RBW,
sample detector, trace maximum hold.
5. The 26dB bandwidth were measured, set RBW= 1% of EBW, VBW= 3*RBW, peak
detector, trace maximum hold.
2.3.4 Test Setup
Report No.: SET2016-11616
CCIC-SET/T(00) Page 23 of 97
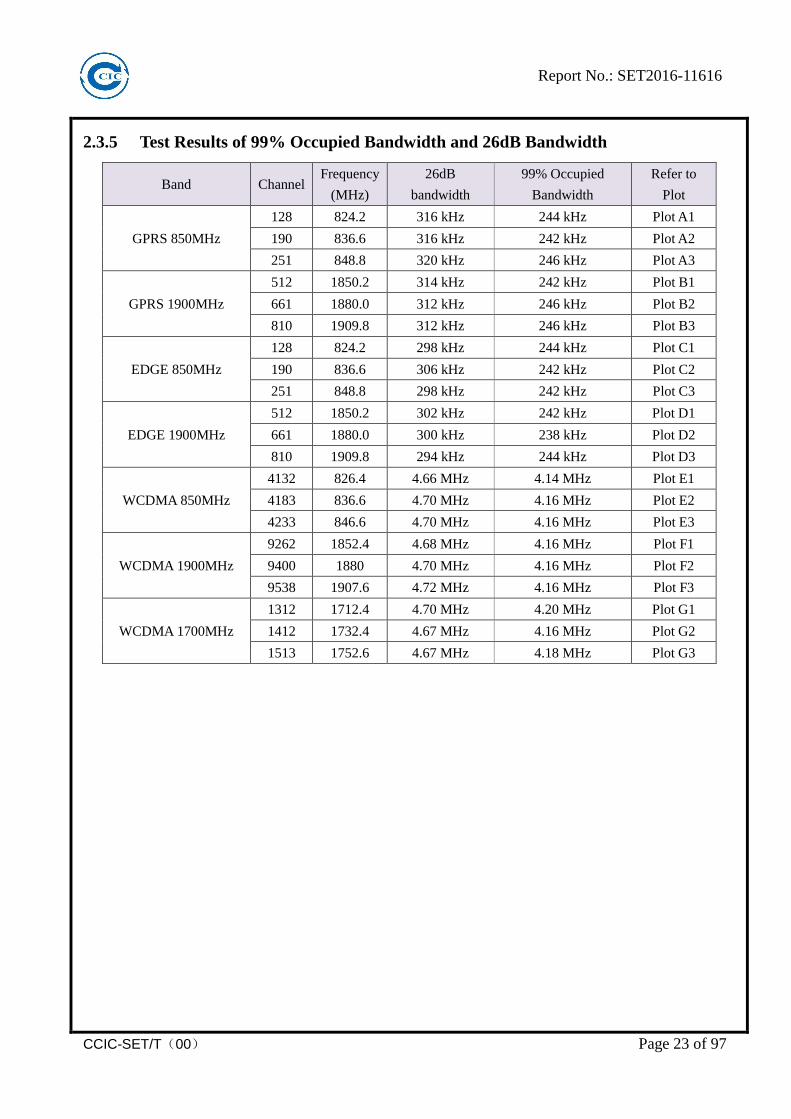
2.3.5 Test Results of 99% Occupied Bandwidth and 26dB Bandwidth
Band Channel Frequency
(MHz)
26dB
bandwidth
99% Occupied
Bandwidth
Refer to
Plot
GPRS 850MHz
128 824.2 316 kHz 244 kHz Plot A1
190 836.6 316 kHz 242 kHz Plot A2
251 848.8 320 kHz 246 kHz Plot A3
GPRS 1900MHz
512 1850.2 314 kHz 242 kHz Plot B1
661 1880.0 312 kHz 246 kHz Plot B2
810 1909.8 312 kHz 246 kHz Plot B3
EDGE 850MHz
128 824.2 298 kHz 244 kHz Plot C1
190 836.6 306 kHz 242 kHz Plot C2
251 848.8 298 kHz 242 kHz Plot C3
EDGE 1900MHz
512 1850.2 302 kHz 242 kHz Plot D1
661 1880.0 300 kHz 238 kHz Plot D2
810 1909.8 294 kHz 244 kHz Plot D3
WCDMA 850MHz
4132 826.4 4.66 MHz 4.14 MHz Plot E1
4183 836.6 4.70 MHz 4.16 MHz Plot E2
4233 846.6 4.70 MHz 4.16 MHz Plot E3
WCDMA 1900MHz
9262 1852.4 4.68 MHz 4.16 MHz Plot F1
9400 1880 4.70 MHz 4.16 MHz Plot F2
9538 1907.6 4.72 MHz 4.16 MHz Plot F3
WCDMA 1700MHz
1312 1712.4 4.70 MHz 4.20 MHz Plot G1
1412 1732.4 4.67 MHz 4.16 MHz Plot G2
1513 1752.6 4.67 MHz 4.18 MHz Plot G3

Report No.: SET2016-11616
CCIC-SET/T(00) Page 24 of 97
2.3.6 Test Results (Plots) of 99% Occupied Bandwidth and 26dB Bandwidth
(Plot A1: GPRS 850MHz Channel = 128)

Report No.: SET2016-11616
CCIC-SET/T(00) Page 25 of 97
(Plot A2: GPRS 850MHz Channel = 190)

Report No.: SET2016-11616
CCIC-SET/T(00) Page 26 of 97
(Plot A3: GPRS 850MHz Channel = 251)

Report No.: SET2016-11616
CCIC-SET/T(00) Page 27 of 97
(Plot B1: GPRS 1900MHz Channel = 512)

Report No.: SET2016-11616
CCIC-SET/T(00) Page 28 of 97
(Plot B2: GPRS 1900MHz Channel = 661)
Report No.: SET2016-11616
CCIC-SET/T(00) Page 29 of 97
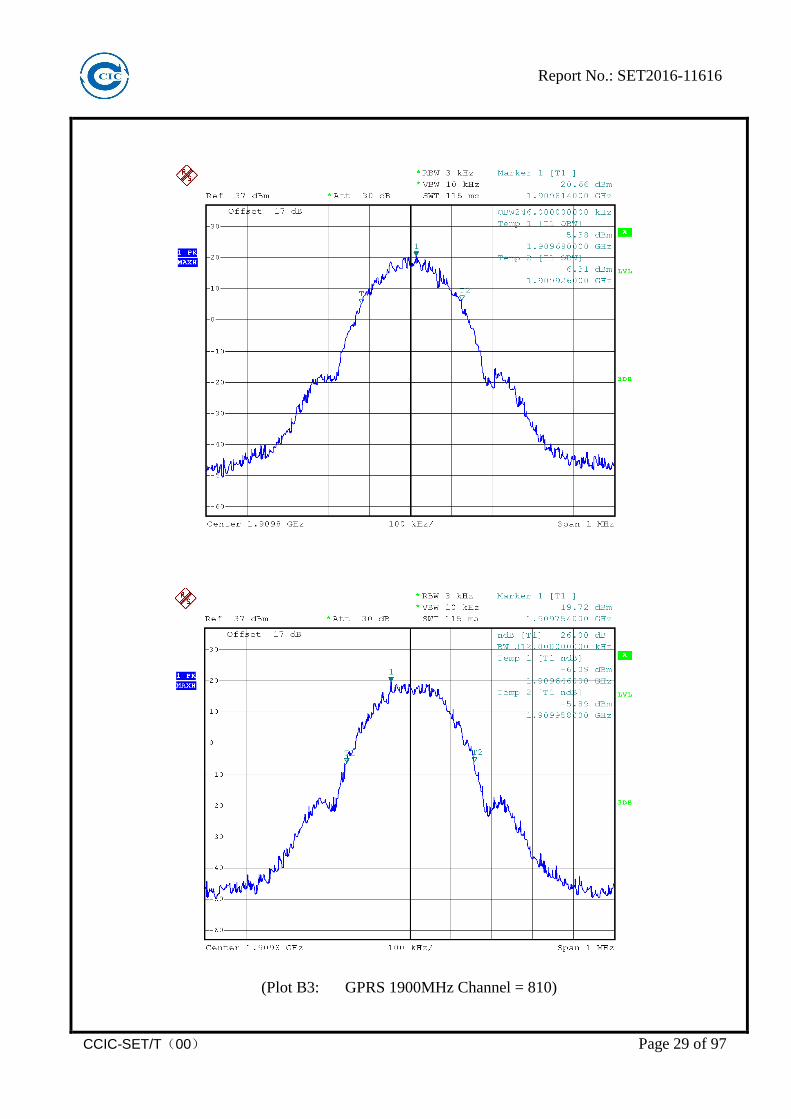
(Plot B3: GPRS 1900MHz Channel = 810)

Report No.: SET2016-11616
CCIC-SET/T(00) Page 30 of 97
(Plot C1: EDGE 850MHz Channel = 128)

Report No.: SET2016-11616
CCIC-SET/T(00) Page 31 of 97
(Plot C2: EDGE 850MHz Channel = 190)

Report No.: SET2016-11616
CCIC-SET/T(00) Page 32 of 97
(Plot C3: EDGE 850MHz Channel = 251)

Report No.: SET2016-11616
CCIC-SET/T(00) Page 33 of 97
(Plot D1: EDGE 1900MHz Channel = 512)

Report No.: SET2016-11616
CCIC-SET/T(00) Page 34 of 97
(Plot D2: EDGE 1900MHz Channel = 661)
Report No.: SET2016-11616
CCIC-SET/T(00) Page 35 of 97
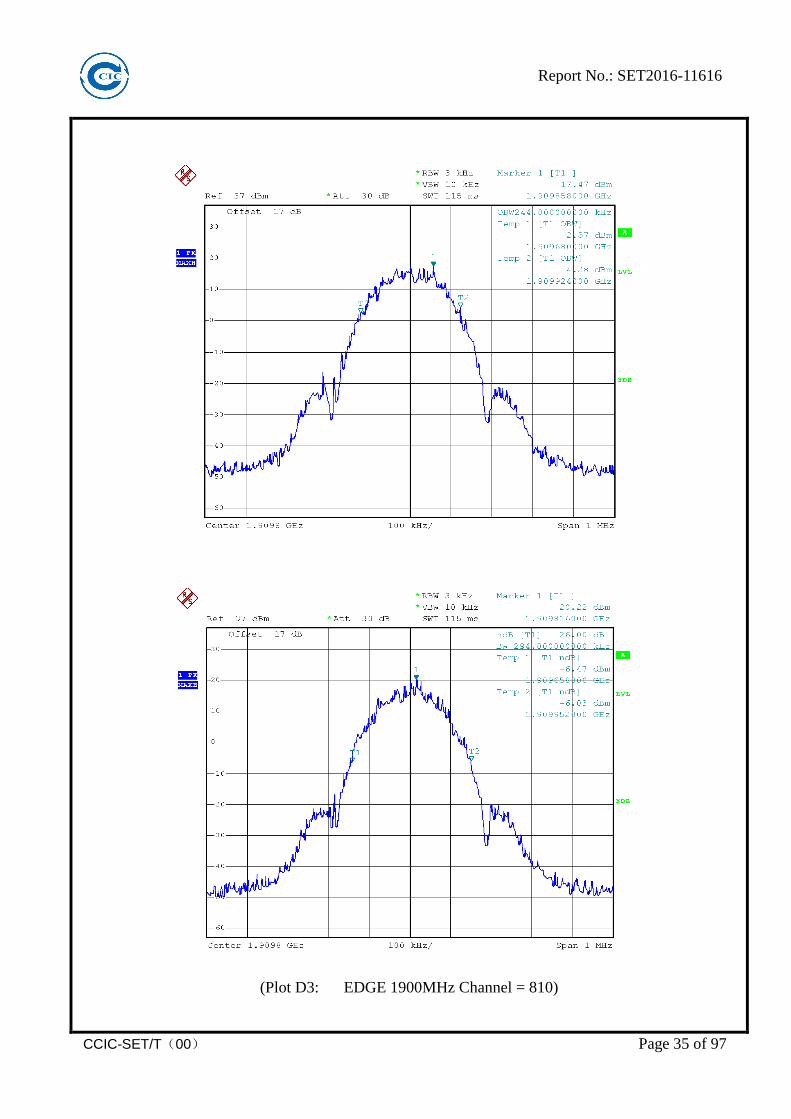
(Plot D3: EDGE 1900MHz Channel = 810)

Report No.: SET2016-11616
CCIC-SET/T(00) Page 36 of 97
(Plot E1: WCDMA 850MHz Channel = 4132)

Report No.: SET2016-11616
CCIC-SET/T(00) Page 37 of 97
(Plot E2: WCDMA 850MHz Channel = 4183)

Report No.: SET2016-11616
CCIC-SET/T(00) Page 38 of 97
(Plot E3: WCDMA 850MHz Channel = 4233)

Report No.: SET2016-11616
CCIC-SET/T(00) Page 39 of 97
(Plot F1: WCDMA 1900MHz Channel = 9262)

Report No.: SET2016-11616
CCIC-SET/T(00) Page 40 of 97
(Plot F2: WCDMA 1900MHz Channel = 9400)

Report No.: SET2016-11616
CCIC-SET/T(00) Page 41 of 97
(Plot F3: WCDMA 1900MHz Channel = 9538)
Report No.: SET2016-11616
CCIC-SET/T(00) Page 42 of 97
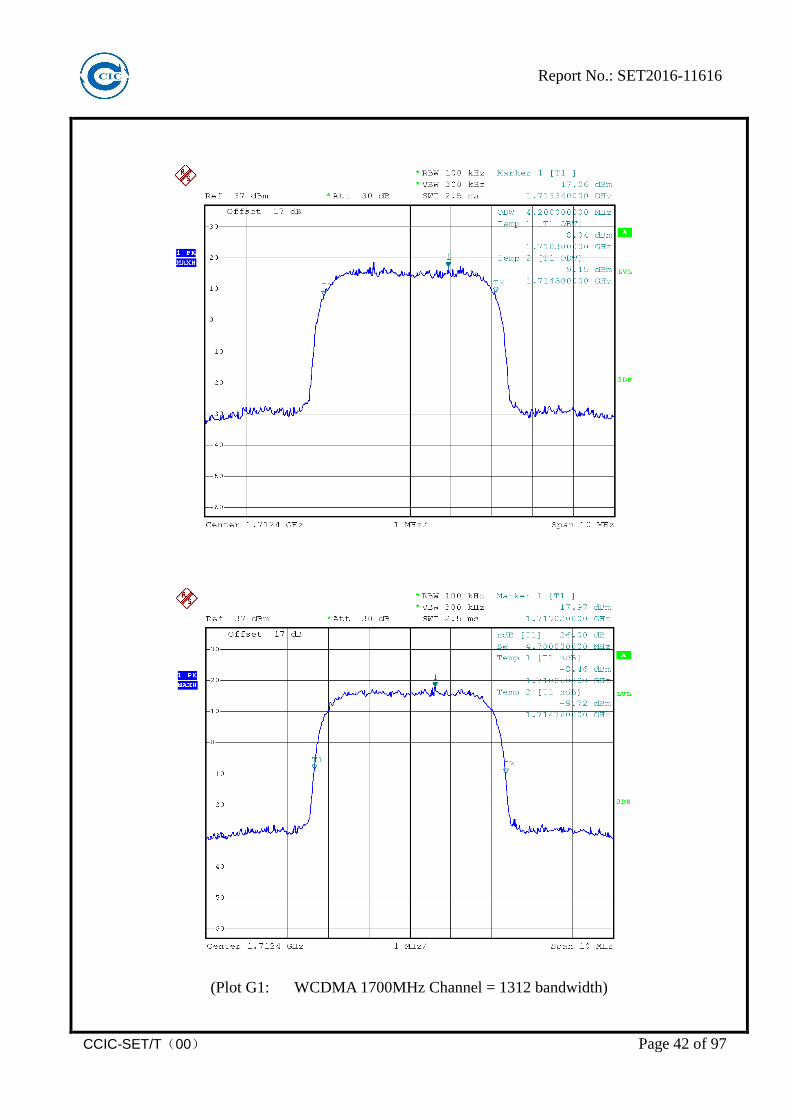
(Plot G1: WCDMA 1700MHz Channel = 1312 bandwidth)

Report No.: SET2016-11616
CCIC-SET/T(00) Page 43 of 97
(Plot G2: WCDMA 1700 MHz Channel = 1412 bandwidth)

Report No.: SET2016-11616
CCIC-SET/T(00) Page 44 of 97
(Plot G2: WCDMA 1700 MHz Channel = 1513 bandwidth)

Report No.: SET2016-11616
CCIC-SET/T(00) Page 45 of 97
2.4 Frequency Stability
2.4.1 Requirement
The frequency stability shall be measured by variation of ambient temperature and variation
of primary supply voltage to ensure that the fundamental emission stays within the authorized
frequency block. The frequency stability of the transmitter shall be maintained within ±0.00025%
(±2.5ppm) of the center frequency.
2.4.2 Measuring Instruments
The measuring equipment is listed in the section 3 of this test report.
2.4.3 Test Procedures for Temperature Variation
1. The testing follows FCC KDB 971168 D01v02r02 Section 9.0.
2. The EUT was set up in the thermal chamber and connected with the system simulator.
3. With power OFF, the temperature was decreased to -30°C and the EUT was stabilized
before testing. Power was applied and the maximum change in frequency was recorded
within one minute.
4. With power OFF, the temperature was raised in 10°C steps up to 50°C. The EUT was
stabilized at each step for at least half an hour. Power was applied and the maximum
frequency change was recorded within one minute.
2.4.4 Test Procedures for Voltage Variation
1. The testing follows FCC KDB 971168 D01v02r02 Section 9.0.
2. The EUT was placed in a temperature chamber at 25±5° C and connected with the system
simulator.
3. The power supply voltage to the EUT was varied from BEP to 115% of the nominal value
measured at the input to the EUT.
4. The variation in frequency was measured for the worst case.

Report No.: SET2016-11616
CCIC-SET/T(00) Page 46 of 97
2.4.5 Test Setup
2.4.6 Test Results of Frequency Stability
1. GSM 850MHz Band
Band: GSM 850 Channel: 190 Limit(ppm): 2.5 Frequency: 836.6MHz
Power (VDC)
Temperature (℃)
GPRS EDGE Result Freq. Dev.
(Hz) Deviation
(ppm) Freq. Dev.
(Hz) Deviation
(ppm)
5.0
-30 18 0.02 12 0.01
PASS
-20 20 0.02 19 0.02 -10 25 0.03 17 0.02 0 10 0.01 13 0.01
+10 11 0.01 26 0.03 +20 19 0.02 19 0.02 +30 17 0.02 12 0.01 +40 25 0.03 25 0.03 +50 8 0.01 10 0.01
5.75 +25 11 0.01 26 0.03 4.25 +25 26 0.03 19 0.02
EUT
Common Antenna
System Simulator
DC Power Supply
Temperature Chamber

Report No.: SET2016-11616
CCIC-SET/T(00) Page 47 of 97
2. GSM 1900MHz Band
Band: GSM 1900 Channel: 661 Limit(ppm): 2.5 Frequency: 1880.0MHz
Power (VDC)
Temperature (℃)
GPRS EDGE Result Freq. Dev.
(Hz) Deviation
(ppm) Freq. Dev.
(Hz) Deviation
(ppm)
5.0
-30 38 0.02 59 0.03
PASS
-20 47 0.02 22 0.01 -10 26 0.01 45 0.02 0 57 0.03 23 0.01
+10 44 0.02 45 0.02 +20 22 0.01 25 0.01 +30 41 0.02 46 0.02 +40 56 0.03 24 0.01 +50 25 0.01 58 0.03
5.75 +25 58 0.03 23 0.01 4.25 +25 22 0.01 57 0.03
3. WCDMA 850MHz Band
Band: WCDMA Band V Channel: 4183 Limit(ppm): 2.5 Frequency: 836.6MHz
Power (VDC)
Temperature (℃)
RMC 12.2Kbps Result Freq. Dev.
(Hz) Deviation
(ppm)
5.0
-30 15 0.02
PASS
-20 16 0.02 -10 27 0.03 0 17 0.02
+10 18 0.02 +20 8 0.01 +30 17 0.02 +40 11 0.01 +50 25 0.03
5.75 +25 19 0.02 4.25 +25 26 0.03
Report No.: SET2016-11616
CCIC-SET/T(00) Page 48 of 97
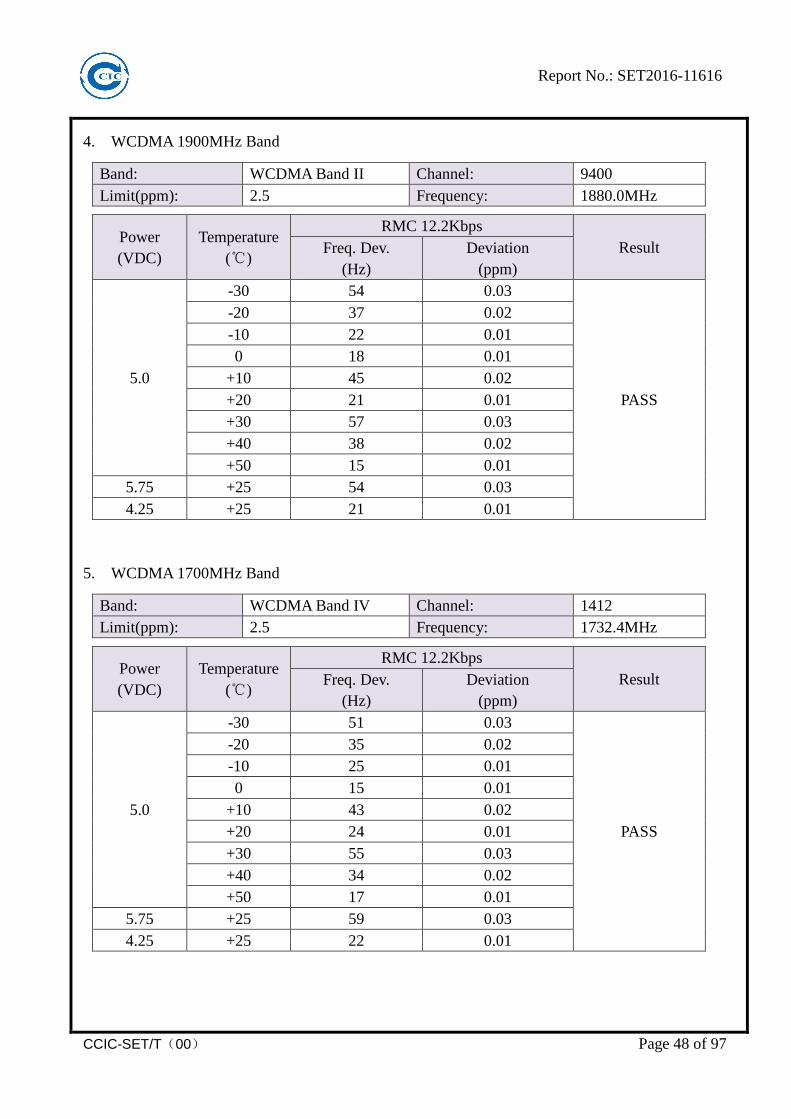
4. WCDMA 1900MHz Band
Band: WCDMA Band II Channel: 9400 Limit(ppm): 2.5 Frequency: 1880.0MHz
Power (VDC)
Temperature (℃)
RMC 12.2Kbps Result Freq. Dev.
(Hz) Deviation
(ppm)
5.0
-30 54 0.03
PASS
-20 37 0.02 -10 22 0.01 0 18 0.01
+10 45 0.02 +20 21 0.01 +30 57 0.03 +40 38 0.02 +50 15 0.01
5.75 +25 54 0.03 4.25 +25 21 0.01
5. WCDMA 1700MHz Band
Band: WCDMA Band IV Channel: 1412 Limit(ppm): 2.5 Frequency: 1732.4MHz
Power (VDC)
Temperature (℃)
RMC 12.2Kbps Result Freq. Dev.
(Hz) Deviation
(ppm)
5.0
-30 51 0.03
PASS
-20 35 0.02 -10 25 0.01 0 15 0.01
+10 43 0.02 +20 24 0.01 +30 55 0.03 +40 34 0.02 +50 17 0.01
5.75 +25 59 0.03 4.25 +25 22 0.01
Report No.: SET2016-11616
CCIC-SET/T(00) Page 49 of 97
2.5 Conducted Out of Band Emissions
2.5.1 Requirement
The power of any emission outside of the authorized operating frequency ranges must be
lower than the transmitter power (P) by a factor of at least 43 + 10 log (P) dB.
It is measured by means of a calibrated spectrum analyzer and scanned from 30 MHz up to a
frequency including its 10th harmonic.
2.5.2 Measuring Instruments
The measuring equipment is listed in the section 3 of this test report.
2.5.3 Test Procedures
1. The testing follows FCC KDB 971168 D01v02r02 Section 6.0.
2. The EUT was connected to the spectrum analyzer and system simulator via a power
divider.
3. The RF output of EUT was connected to the spectrum analyzer by an RF cable and
attenuator. The path loss was compensated to the results for each measurement.
4. The middle channel for the highest RF power within the transmitting frequency was
measured.
5. The conducted spurious emission for the whole frequency range was taken.
6. The RF fundamental frequency should be excluded against the limit line in the operating
frequency band.
7. The limit line is derived from 43 + 10log(P) dB below the transmitter power P(Watts)
= P(W) - [43 + 10log(P)] (dB)
= [30 + 10log(P)] (dBm) - [43 + 10log(P)] (dB)
= -13dBm.
8. For 9KHz to 30MHz: the amplitude of spurious emissions are attenuated by more than
20dB below the permissible value has no need to be reported.

Report No.: SET2016-11616
CCIC-SET/T(00) Page 50 of 97
2.5.4 Test Setup

Report No.: SET2016-11616
CCIC-SET/T(00) Page 51 of 97
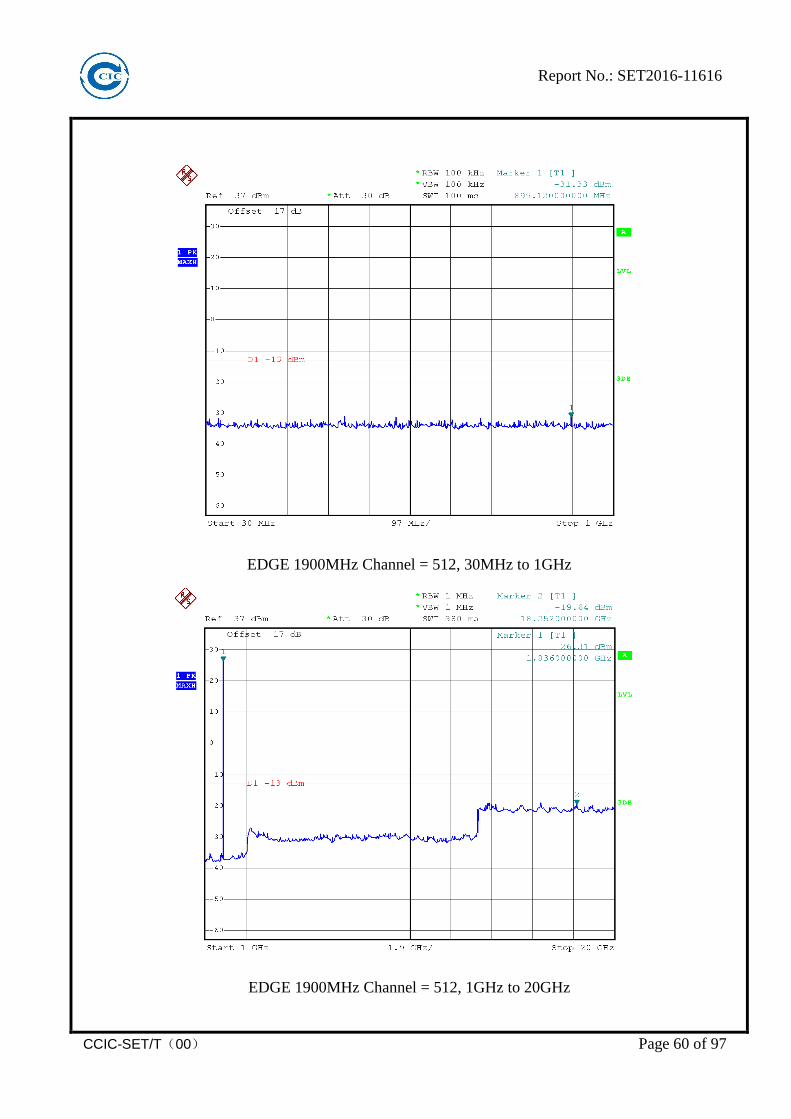
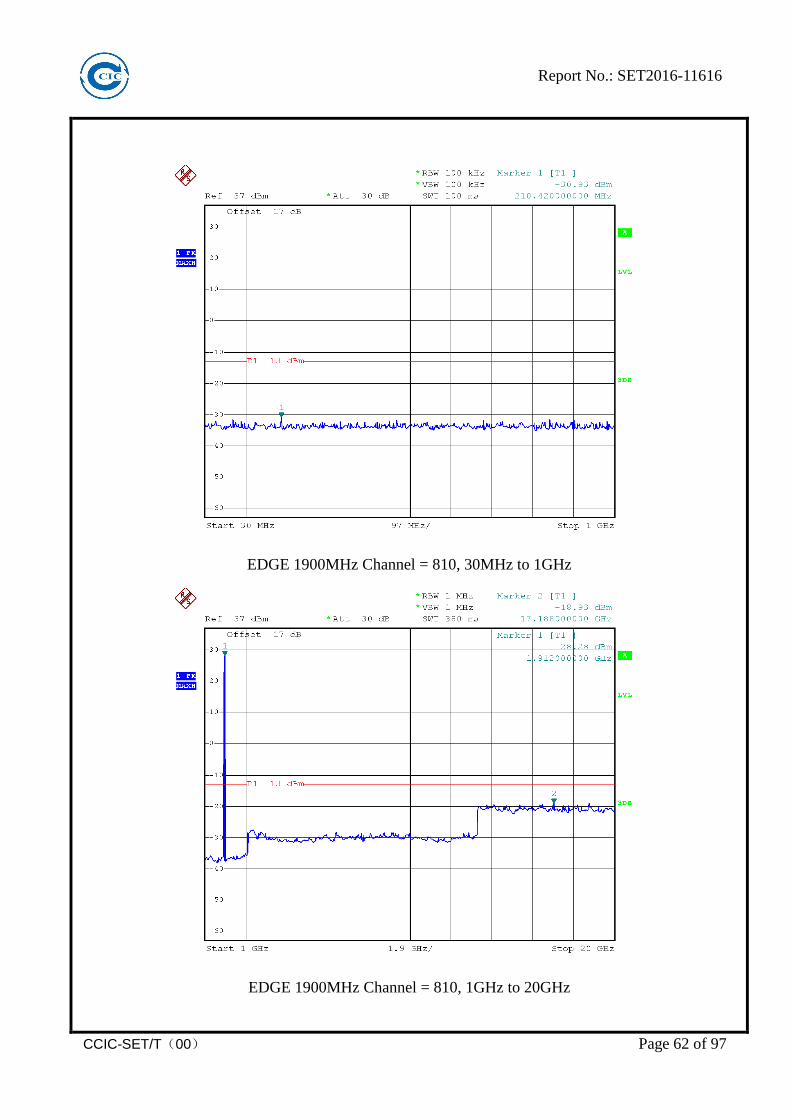
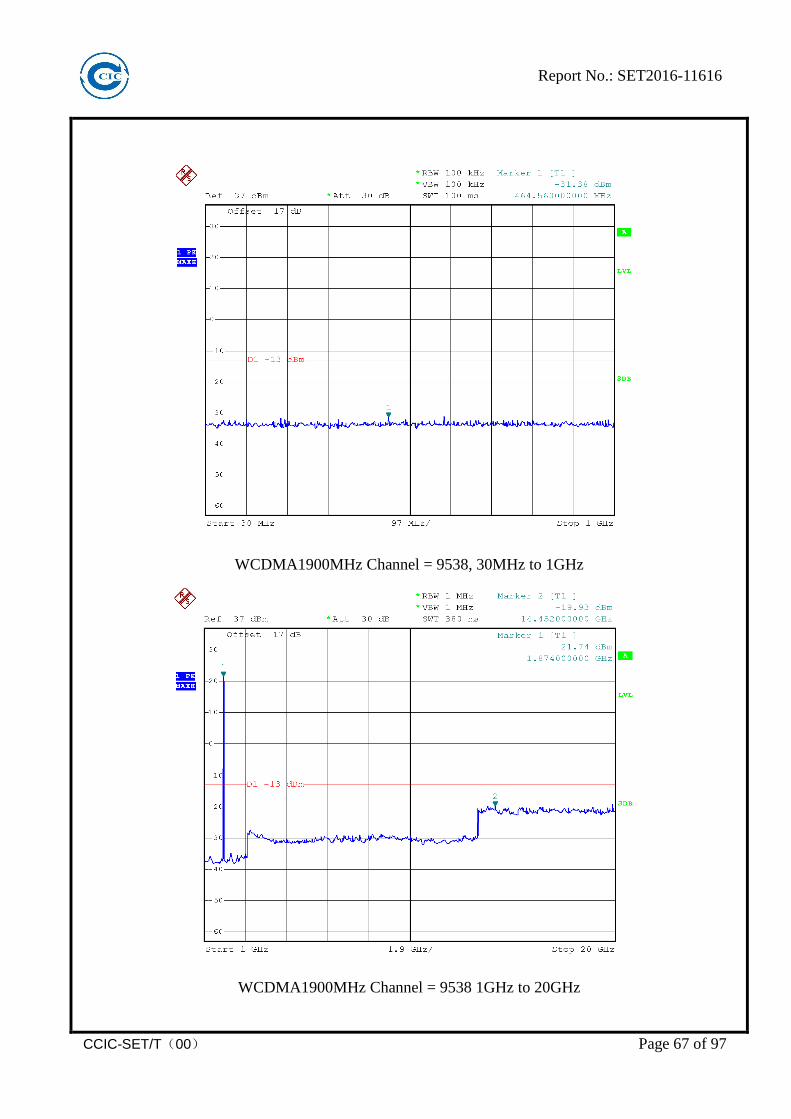
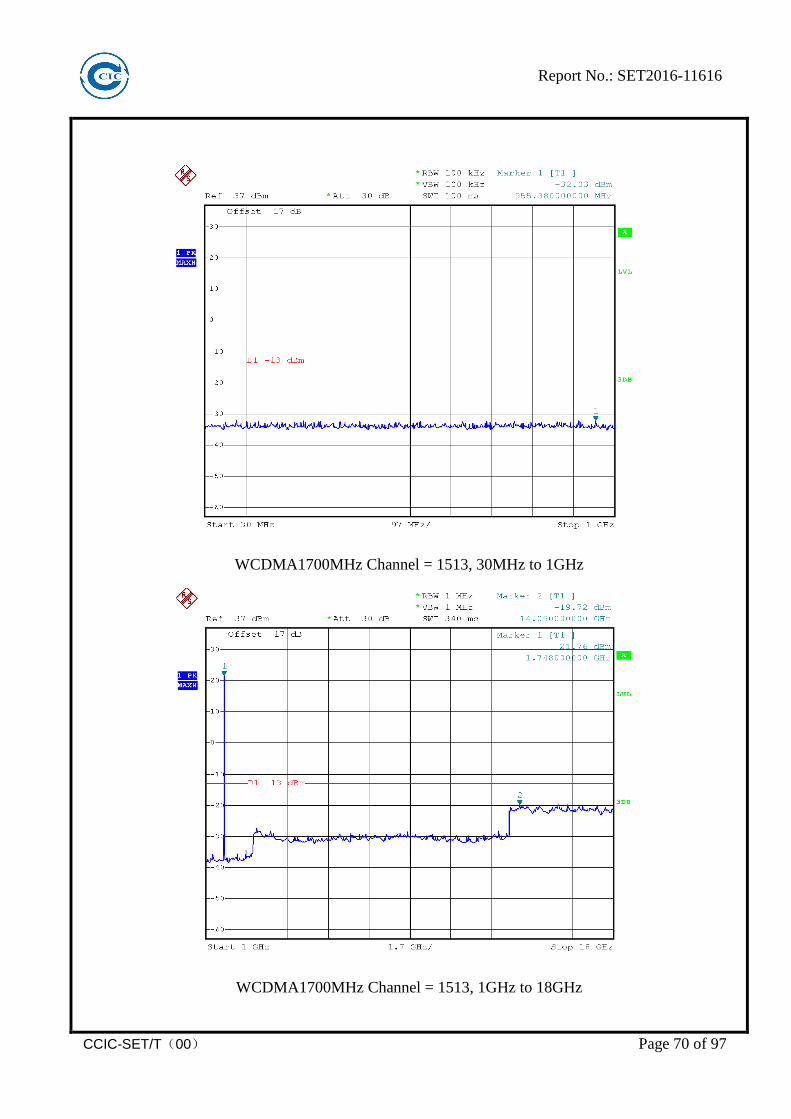
2.5.5 Test Result (Plots) of Conducted Spurious Emission
Note: For 9 KHz to 30MHz: the amplitude of spurious emissions is attenuated by more than 20dB below the permissible value, so we not provide the test result here.
GSM 850MHz Channel = 128, 30MHz to 1GHz
GSM 850MHz Channel = 128, 1GHz to 9GHz

Report No.: SET2016-11616
CCIC-SET/T(00) Page 52 of 97
GSM 850MHz Channel = 190, 30MHz to 1GHz
GSM 850MHz Channel = 190, 1GHz to 9GHz
Report No.: SET2016-11616
CCIC-SET/T(00) Page 53 of 97
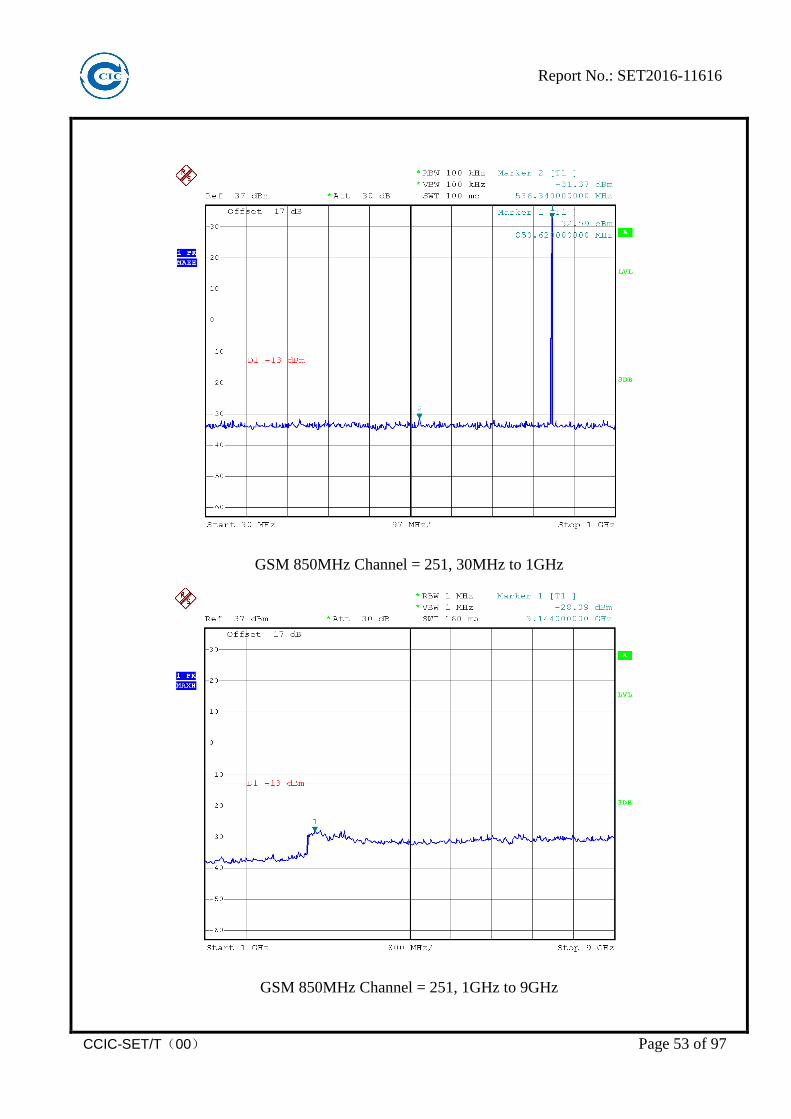
GSM 850MHz Channel = 251, 30MHz to 1GHz
GSM 850MHz Channel = 251, 1GHz to 9GHz

Report No.: SET2016-11616
CCIC-SET/T(00) Page 54 of 97
GSM 1900MHz Channel = 512, 30MHz to 1GHz
GSM 1900MHz Channel = 512, 1GHz to 20GHz

Report No.: SET2016-11616
CCIC-SET/T(00) Page 55 of 97
GSM 1900MHz Channel = 661, 30MHz to 1GHz
GSM 1900MHz Channel = 661, 1GHz to 20GHz

Report No.: SET2016-11616
CCIC-SET/T(00) Page 56 of 97
GSM 1900MHz Channel = 810, 30MHz to 1GHz
GSM 1900MHz Channel = 810, 1GHz to 20GHz
Report No.: SET2016-11616
CCIC-SET/T(00) Page 57 of 97
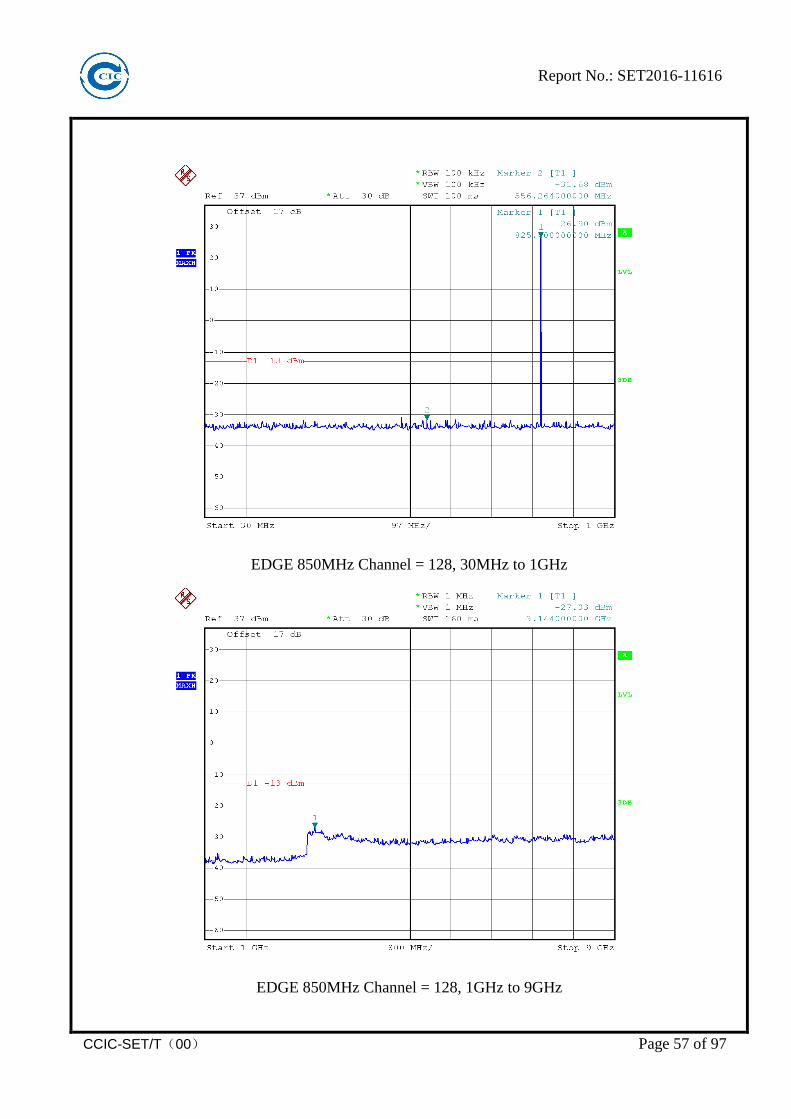
EDGE 850MHz Channel = 128, 30MHz to 1GHz
EDGE 850MHz Channel = 128, 1GHz to 9GHz

Report No.: SET2016-11616
CCIC-SET/T(00) Page 58 of 97
EDGE 850MHz Channel = 190, 30MHz to 1GHz
EDGE 850MHz Channel = 190, 1GHz to 9GHz

Report No.: SET2016-11616
CCIC-SET/T(00) Page 59 of 97
EDGE 850MHz Channel = 251, 30MHz to 1GHz
EDGE 850MHz Channel = 251, 1GHz to 9GHz
Report No.: SET2016-11616
CCIC-SET/T(00) Page 60 of 97
EDGE 1900MHz Channel = 512, 30MHz to 1GHz
EDGE 1900MHz Channel = 512, 1GHz to 20GHz

Report No.: SET2016-11616
CCIC-SET/T(00) Page 61 of 97
EDGE 1900MHz Channel = 661, 30MHz to 1GHz
EDGE 1900MHz Channel = 661, 1GHz to 20GHz
Report No.: SET2016-11616
CCIC-SET/T(00) Page 62 of 97
EDGE 1900MHz Channel = 810, 30MHz to 1GHz
EDGE 1900MHz Channel = 810, 1GHz to 20GHz

Report No.: SET2016-11616
CCIC-SET/T(00) Page 63 of 97
WCDMA850MHz Channel = 4132, 30MHz to 1GHz
WCDMA850MHz Channel = 4132, 1GHz to 9GHz
WCDMA850MHz Channel = 4183, 30MHz to 1GHz
WCDMA850MHz Channel = 4183, 1GHz to 9GHz

Report No.: SET2016-11616
CCIC-SET/T(00) Page 64 of 97
WCDMA850MHz Channel = 4233, 30MHz to 1GHz
WCDMA850MHz Channel = 4233, 1GHz to 9GHz

Report No.: SET2016-11616
CCIC-SET/T(00) Page 65 of 97
WCDMA1900MHz Channel = 9262, 30MHz to 1GHz
WCDMA1900MHz Channel = 9262, 1GHz to 20GHz

Report No.: SET2016-11616
CCIC-SET/T(00) Page 66 of 97
WCDMA1900MHz Channel = 9400, 30MHz to 1GHz
WCDMA1900MHz Channel = 9400, 1GHz to 20GHz
Report No.: SET2016-11616
CCIC-SET/T(00) Page 67 of 97
WCDMA1900MHz Channel = 9538, 30MHz to 1GHz
WCDMA1900MHz Channel = 9538 1GHz to 20GHz

Report No.: SET2016-11616
CCIC-SET/T(00) Page 68 of 97
WCDMA1700MHz Channel = 1312, 30MHz to 1GHz
WCDMA1700MHz Channel = 1312, 1GHz to 18GHz

Report No.: SET2016-11616
CCIC-SET/T(00) Page 69 of 97
WCDMA1700MHz Channel = 1414, 30MHz to 1GHz
WCDMA1700MHz Channel = 1412, 1GHz to 18GHz
Report No.: SET2016-11616
CCIC-SET/T(00) Page 70 of 97
WCDMA1700MHz Channel = 1513, 30MHz to 1GHz
WCDMA1700MHz Channel = 1513, 1GHz to 18GHz

Report No.: SET2016-11616
CCIC-SET/T(00) Page 71 of 97
2.6 Band Edge
2.6.1 Requirement
The power of any emission outside of the authorized operating frequency ranges must be
lower than the transmitter power (P) by a factor of at least 43 + 10 log (P) dB.
2.6.2 Measuring Instruments
The measuring equipment is listed in the section 3 of this test report.
2.6.3 Test Procedures
1. The testing follows FCC KDB 971168 D01v02r02 Section 6.0.
2. The EUT was connected to the spectrum analyzer and system simulator via a power divider.
3. The RF output of EUT was connected to the spectrum analyzer by an RF cable and
attenuator. The path loss was compensated to the results for each measurement.
4. The band edges of low and high channels for the highest RF powers were measured.
5. The RF fundamental frequency should be excluded against the limit line in the operating
frequency band.
6. The limit line is derived from 43 + 10log(P) dB below the transmitter power P(Watts)
= P(W) - [43 + 10log(P) ] (dB)
= [30 + 10log(P)] (dBm) - [43 + 10log(P) ] (dB)
= -13dBm.
2.6.4 Test Setup

Report No.: SET2016-11616
CCIC-SET/T(00) Page 72 of 97
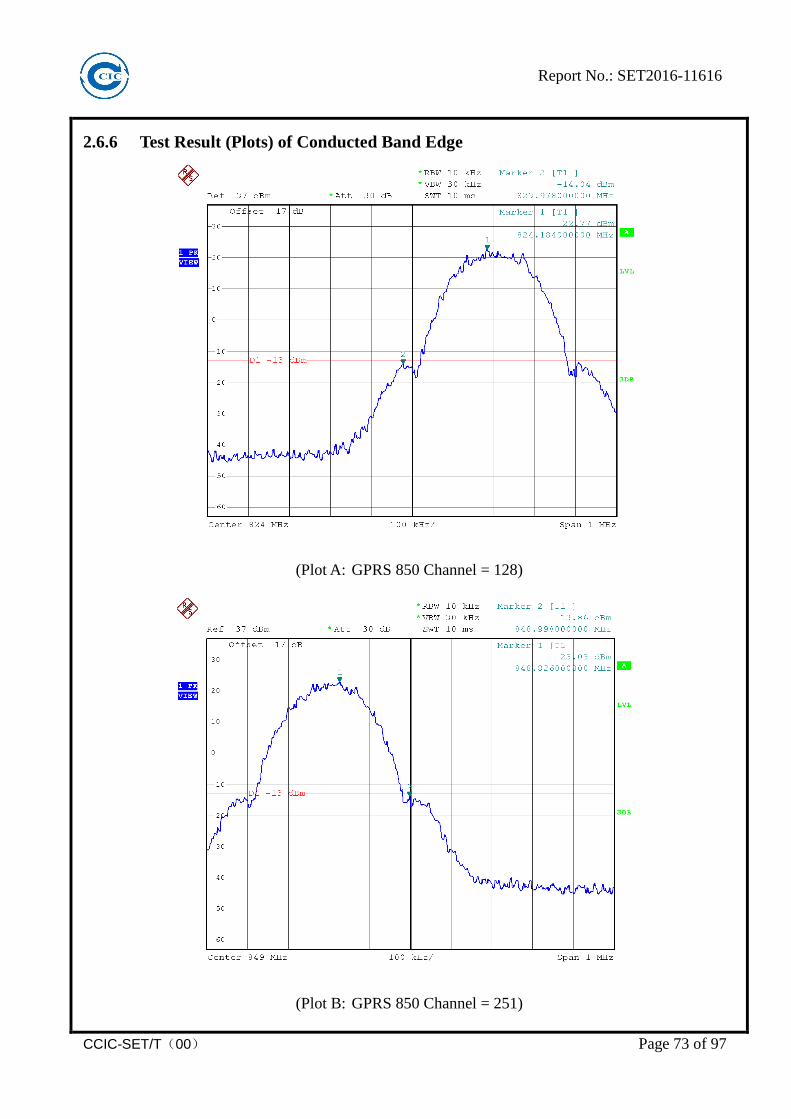
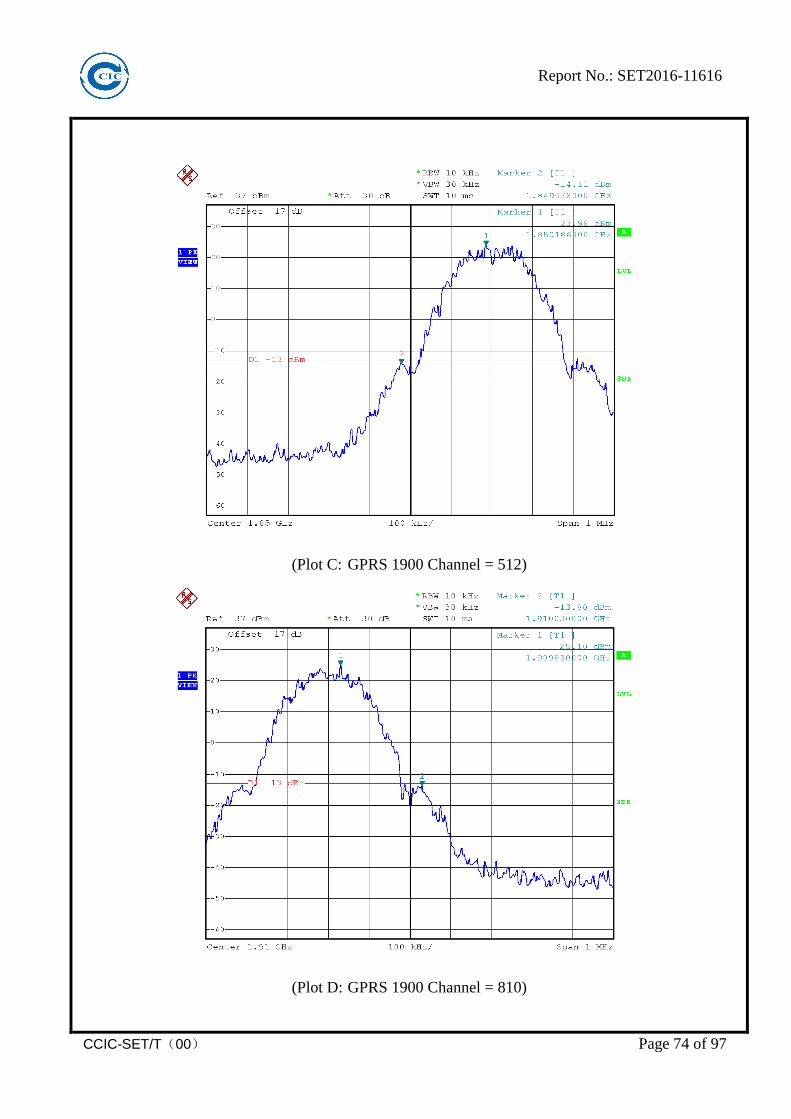
2.6.5 Test Result of Conducted Band Edge
Band Channel Frequency
(MHz)
Measured Max. Band Edge
Emission (dBm)
Refer to Plot
Limit (dBm)
Verdict
GPRS 850MHz
128 824.2 -14.04 Plat A -13
PASS 251 848.8 -13.86 Plot B PASS
GRPS 1900MHz
512 1850.2 -14.11 Plat C -13
PASS 810 1909.8 -13.80 Plot D PASS
EDGE 850MHz
128 824.2 -16.95 Plat E -13
PASS 251 848.8 -16.51 Plot F PASS
EDGE 1900MHz
512 1850.2 -14.70 Plat G -13
PASS 810 1909.8 -15.80 Plot H PASS
WCDMA 850MHz
4132 826.4 -16.18 Plot I -13
PASS 4233 846.6 -15.64 Plot J PASS
WCDMA 1900MHz
9262 1852.4 -16.05 Plot K -13
PASS 9538 1907.6 -15.92 Plot L PASS
WCDMA 1700MHz
1312 1712.4 -16.45 Plat M -13
PASS 1513 1752.6 -18.07 Plot N PASS
Report No.: SET2016-11616
CCIC-SET/T(00) Page 73 of 97
2.6.6 Test Result (Plots) of Conducted Band Edge
(Plot A: GPRS 850 Channel = 128)
(Plot B: GPRS 850 Channel = 251)
Report No.: SET2016-11616
CCIC-SET/T(00) Page 74 of 97
(Plot C: GPRS 1900 Channel = 512)
(Plot D: GPRS 1900 Channel = 810)

Report No.: SET2016-11616
CCIC-SET/T(00) Page 75 of 97
(Plot E: EDGE 850 Channel = 128)
(Plot F: EDGE 850 Channel = 251)

Report No.: SET2016-11616
CCIC-SET/T(00) Page 76 of 97
(Plot G: EDGE 1900 Channel = 512)
(Plot H: EDGE 1900 Channel = 810)

Report No.: SET2016-11616
CCIC-SET/T(00) Page 77 of 97
(Plot I: WCDMA 850 Channel = 4132)
(Plot J: WCDMA 850 Channel = 4233)

Report No.: SET2016-11616
CCIC-SET/T(00) Page 78 of 97
(Plot K: WCDMA 1900 Channel = 9262)
(Plot L: WCDMA 1900 Channel = 9538)

Report No.: SET2016-11616
CCIC-SET/T(00) Page 79 of 97
(Plot M: WCDMA 1700 Channel = 1312)
(Plot N: WCDMA 1700 Channel = 1513)
Report No.: SET2016-11616
CCIC-SET/T(00) Page 80 of 97
2.7 Transmitter Radiated Power (EIRP/ERP)
2.7.1 Requirement
The substitution method, in ANSI / TIA / EIA-603-D-2010, was used for ERP/EIRP
measurement, and the spectrum analyzer configuration follows KDB 971168 D01 Power Meas.
License Digital Systems v02r02. The ERP of mobile transmitters must not exceed 7 Watts (Cellular
Band) and the EIRP of mobile transmitters are limited to 2 Watts (PCS Band) and 1 Watts (AWS
Band).
2.7.2 Measuring Instruments
The measuring equipment is listed in the section 3 of this test report.
2.7.3 Test Procedures
1. The testing follows FCC KDB 971168 D01v02r02 Section 5.2.1. (for CDMA/WCDMA),
Section 5.2.2.2 (for GSM/GPRS/EDGE) and ANSI / TIA-603-D-2010 Section 2.2.17.
2. The EUT was placed on a turntable 1.5 meters high in a fully anechoic chamber.
3. The EUT was placed 3 meters from the receiving antenna, which was mounted on the
antenna tower.
4. GSM operating modes: Set RBW= 1MHz, VBW= 3MHz, RMS detector over burst;
UMTS operating modes: Set RBW= 100 kHz, VBW= 300 kHz, RMS detector over frame,
and use channel power option with bandwidth=5MHz, per KDB 971168 D01 v02r02.
5. The table was rotated 360 degrees to determine the position of the highest radiated power.
6. The height of the receiving antenna is adjusted to look for the maximum ERP/EIRP.
7. Taking the record of maximum ERP/EIRP.
8. A dipole antenna was substituted in place of the EUT and was driven by a signal generator.

Report No.: SET2016-11616
CCIC-SET/T(00) Page 81 of 97
9. The conducted power at the terminal of the dipole antenna is measured.
10. Repeat step 3 to step 5 to get the maximum ERP/EIRP of the substitution antenna.
11. ERP/EIRP = Ps + Et – Es + Gs = Ps + Rt – Rs + Gs
Ps (dBm):Input power to substitution antenna.
Gs (dBi or dBd):Substitution antenna Gain.
Et = Rt + AF Es = Rs + AF
AF (dB/m):Receive antenna factor
Rt:The highest received signal in spectrum analyzer for EUT.
Rs:The highest received signal in spectrum analyzer for substitution antenna.
2.7.4 Test Setup

Report No.: SET2016-11616
CCIC-SET/T(00) Page 82 of 97
2.7.5 Test Result of Transmitter Radiated Power
Test Notes:
1. This device employs GMSK technology with GSM and GPRS capabilities. All configurations were investigated and the worst case emissions were found in GSM mode.
2. This device employs UMTS technology with WCDMA (AMR/RMC), HSDPA, HSUPA capabilities. All configurations were investigated and the worst case UMTS emissions were found in RMC WCDMA mode at 12.2Kbps.
3. This unit was tested with its standard battery.
4. The worst case test configuration was found in the vertical positioning where the EUT is laying on its side. The data reported in the tables below were measured in this test setup.
Band Channel Frequency
(MHz) PCL
Antenna Pol
(H/V)
Measured ERP
dBm
Limit
dBm Verdict
GPRS 850MHz
128 824.20 5 V 30.83
38.5
PASS H 30.81
190 836.60 5 V 30.77
PASS H 30.86
251 848.80 5 V 30.90
PASS H 30.84
Band Channel Frequency
(MHz) PCL
Antenna Pol
(H/V)
Measured EIRP
dBm
Limit
dBm Verdict
GPRS 1900MHz
512 1850.2 0 V 27.21
33
PASS H 27.29
661 1880.0 0 V 27.35
PASS H 27.22
810 1909.8 0 V 27.24
PASS H 27.27

Report No.: SET2016-11616
CCIC-SET/T(00) Page 83 of 97
Band Channel Frequency
(MHz) PCL
Antenna Pol
(H/V)
Measured ERP
dBm
Limit
dBm Verdict
EDGE 850MHz
128 824.20 5 V 25.24
38.5
PASS H 25.18
190 836.60 5 V 25.22
PASS H 25.25
251 848.80 5 V 25.29
PASS H 25.21
Band Channel Frequency
(MHz) PCL
Antenna Pol
(H/V)
Measured EIRP
dBm
Limit
dBm Verdict
EDGE 1900MHz
512 1850.2 0 V 23.22
33
PASS H 23.26
661 1880.0 0 V 23.21
PASS H 23.18
810 1909.8 0 V 23.25
PASS H 23.27
Band Channel Frequency
(MHz)
Antenna Pol
(H/V)
Measured ERP
dBm
Limit
dBm Verdict
WCDMA 850MHz
4132 826.4 V 21.75
38.5
PASS H 21.81
4175 835 V 21.78
PASS H 21.72
4233 846.6 V 21.77
PASS H 21.79
Band Channel Frequency
(MHz)
Antenna Pol
(H/V)
Measured EIRP
dBm
Limit
dBm Verdict
WCDMA 1900MHz
9262 1852.4 V 20.54
33
PASS H 20.48
9400 1880 V 20.51
PASS H 20.59
9538 1907.6 V 20.57
PASS H 20.45

Report No.: SET2016-11616
CCIC-SET/T(00) Page 84 of 97
Band Channel Frequency
(MHz)
Antenna Pol
(H/V)
Measured EIRP
dBm
Limit
dBm Verdict
WCDMA
1700MHz
1312 1712.4 V 21.37
30
PASS H 21.35
1413 1732.4 V 21.41
PASS H 21.37
1513 1752.6 V 21.45
PASS H 21.39

Report No.: SET2016-11616
CCIC-SET/T(00) Page 85 of 97
2.8 Radiated Spurious Emissions
2.8.1 Requirement
The power of any emission outside of the authorized operating frequency ranges must be
attenuated below the transmitter power (P) by a factor of at least 43 + 10 log (P) dB. The spectrum is
scanned from 30 MHz up to a frequency including its 10th harmonic.
2.8.2 Measuring Instruments
The measuring equipment is listed in the section 3 of this test report.
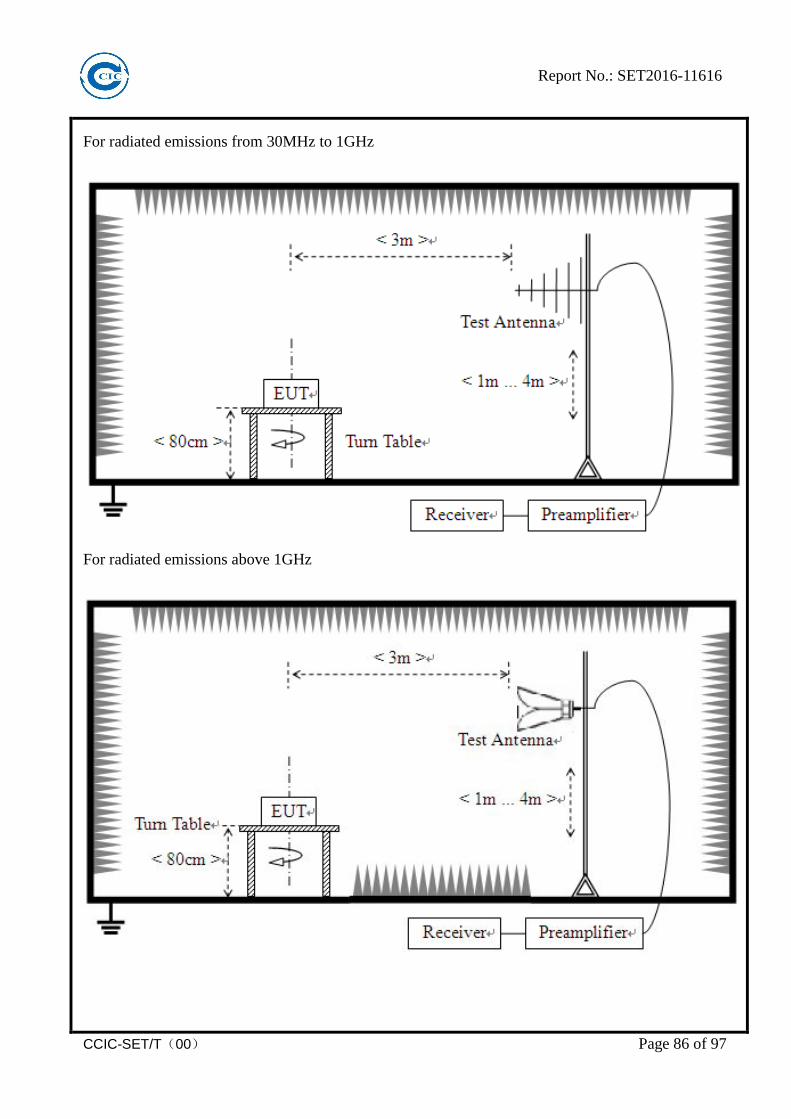
2.8.3 Test Setup
For radiated emissions from 9 kHz to 30MHz
Report No.: SET2016-11616
CCIC-SET/T(00) Page 86 of 97
For radiated emissions from 30MHz to 1GHz
For radiated emissions above 1GHz

Report No.: SET2016-11616
CCIC-SET/T(00) Page 87 of 97
2.8.4 Test Procedures
1. The testing follows FCC KDB 971168 D01v02r02 Section 5.8 and ANSI / TIA-603-D-2010
Section 2.2.12.
2. The EUT was placed on a rotatable wooden table 0.8 meters above the ground.
3. The EUT was set 3 meters from the receiving antenna, which was mounted on the antenna
tower.
4. The table was rotated 360 degrees to determine the position of the highest spurious
emission.
5. The height of the receiving antenna is varied between one meter and four meters to search
for the maximum spurious emission for both horizontal and vertical polarizations.
6. Make the measurement with the spectrum analyzer's RBW = 1MHz, VBW = 3MHz, taking
record of maximum spurious emission.
7. A horn antenna was substituted in place of the EUT and was driven by a signal generator.
8. Tune the output power of signal generator to the same emission level with EUT maximum
spurious emission.
9. Taking the record of output power at antenna port.
10. Repeat step 7 to step 8 for another polarization.
11. The RF fundamental frequency should be excluded against the limit line in the operating
frequency band.
12. The limit line is derived from 43 + 10log(P) dB below the transmitter power P(Watts)
= P(W) - [43 + 10log(P)] (dB)
= [30 + 10log(P)] (dBm) - [43 + 10log(P)] (dB)
= -13dBm.
13. This device employs GMSK technology with GSM and GPRS capabilities. All
configurations were investigated and the worst case emissions were found in GSM mode.
14. This device employs UMTS technology with WCDMA (AMR/RMC), HSDPA, HSUPA
capabilities. All configurations were investigated and the worst case UMTS emissions
were found in RMC WCDMA mode at 12.2Kbps.
15. This unit was tested with its standard battery.
16. All Spurious Emission tests were performed in X, Y, Z axis direction and low, middle, high
channel. And only the worst axis test condition was recorded in this test report.
17. The spectrum is measured from 9 KHz to the 10th harmonic of the fundamental frequency

Report No.: SET2016-11616
CCIC-SET/T(00) Page 88 of 97
of the transmitter using CISPR quasi peak detector below 1GHz. The worst case emissions
are reported however emissions whose levels were not within 20dB of the respective
limits were not reported.
18. For 9KHz to 30MHz: the amplitude of spurious emissions are attenuated by more than
20dB below the permissible value has no need to be reported.
Report No.: SET2016-11616
CCIC-SET/T(00) Page 89 of 97
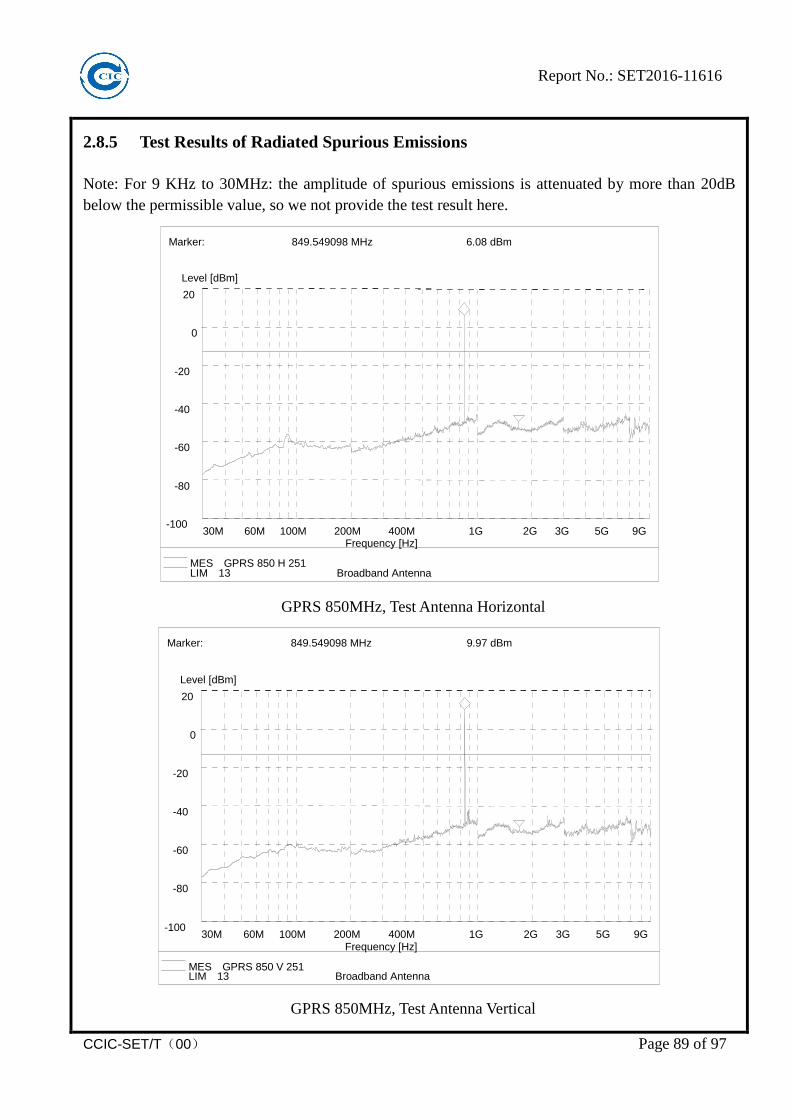
2.8.5 Test Results of Radiated Spurious Emissions
Note: For 9 KHz to 30MHz: the amplitude of spurious emissions is attenuated by more than 20dB below the permissible value, so we not provide the test result here.
GPRS 850MHz, Test Antenna Horizontal
GPRS 850MHz, Test Antenna Vertical
-100
-80
-60
-40
-20
0
20
Level [dBm]
30M 60M 100M 200M 400M 1G 2G 3G 5G 9GFrequency [Hz]
Marker: 849.549098 MHz 9.97 dBm
MES GPRS 850 V 251 LIM 13 Broadband Antenna
-100
-80
-60
-40
-20
0
20
Level [dBm]
30M 60M 100M 200M 400M 1G 2G 3G 5G 9G Frequency [Hz]
Marker: 849.549098 MHz 6.08 dBm
:
MES GPRS 850 H 251 LIM 13 Broadband Antenna

Report No.: SET2016-11616
CCIC-SET/T(00) Page 90 of 97
GPRS 1900MHz, Test Antenna Horizontal
GPRS 1900MHz, Test Antenna Vertical
-100
-80
-60
-40
-20
0
20
Level [dBm]
30M 100M 200M 400M 1G 2G 3G 5G 10G 20GFrequency [Hz]
Marker: 1.877755511 GHz 9.66 dBm
MES GPRS 1900 V 661 Constant: -13 dBm
-100
-80
-60
-40
-20
0
20
Level [dBm]
30M 100M 200M 400M 1G 2G 3G 5G 10G 20GFrequency [Hz]
Marker: 1.881763527 GHz 12.97 dBm
MES GPRS 1900 H 661 Constant: -13 dBm

Report No.: SET2016-11616
CCIC-SET/T(00) Page 91 of 97
EDGE 850MHz, Test Antenna Horizontal
EDGE 850MHz, Test Antenna Vertical
-100
-80
-60
-40
-20
0
20
Level [dBm]
30M 60M 100M 200M 400M 1G 2G 3G 5G 9G Frequency [Hz]
Marker: 837.825651 MHz -3.39 dBm
MES EDGE 850 V 190 LIM 13 Broadband Antenna
-100
-80
-60
-40
-20
0
20
Level [dBm]
30M 60M 100M 200M 400M 1G 2G 3G 5G 9G Frequency [Hz]
Marker: 837.825651 MHz 12.94 dBmDelta Mk: 835.120241 MHz -60.58 dB
MES EDGE 850 H 190 LIM 13 Broadband Antenna

Report No.: SET2016-11616
CCIC-SET/T(00) Page 92 of 97
EDGE 1900MHz, Test Antenna Horizontal
EDGE 1900MHz, Test Antenna Vertical
-100
-80
-60
-40
-20
0
20
Level [dBm]
30M 100M 200M 400M 1G 2G 3G 5G 10G 20GFrequency [Hz]
Marker: 1.877755511 GHz 10.38 dBmDelta Mk: 3.76753507 GHz -59.09 dB
MES EGPRS1900 V 661 Constant: -13 dBm
-100
-80
-60
-40
-20
0
20
Level [dBm]
30M 100M 200M 400M 1G 2G 3G 5G 10G 20GFrequency [Hz]
Marker: 1.877755511 GHz 14.33 dBmDelta Mk: 3.76753507 GHz -62.92 dB
MES EGPRS1900 H 661 Constant: -13 dBm

Report No.: SET2016-11616
CCIC-SET/T(00) Page 93 of 97
WCDMA 850MHz, Test Antenna Horizontal
WCDMA 850MHz, Test Antenna Vertical
-100
-80
-60
-40
-20
0
20
Level [dBm]
30M 60M 100M 200M 400M 1G 2G 3G 5G 9G Frequency [Hz]
Marker: 837.825651 MHz 10.35 dBmDelta Mk: 835.120241 MHz -53.42 dB
MES WCDMA850 V 4408 LIM 13 Broadband Antenna
-100
-80
-60
-40
-20
0
20
Level [dBm]
30M 60M 100M 200M 400M 1G 2G 3G 5G 9G Frequency [Hz]
Marker: 837.825651 MHz 10.41 dBmDelta Mk: 835.120241 MHz -53.58 dB
MES WCDMA850 H 4408 LIM 13 Broadband Antenna

Report No.: SET2016-11616
CCIC-SET/T(00) Page 94 of 97
WCDMA 1900MHz, Test Antenna Horizontal
WCDMA 1900MHz, Test Antenna Vertical
-100
-80
-60
-40
-20
0
20
Level [dBm]
30M 100M 200M 400M 1G 2G 3G 5G 10G 20GFrequency [Hz]
Marker: 1.881763527 GHz 9.21 dBmDelta Mk: 1.879759519 GHz -59.68 dB
MES WCDMA1900 V 9800 Constant: -13 dBm
-100
-80
-60
-40
-20
0
20
Level [dBm]
30M 100M 200M 400M 1G 2G 3G 5G 10G 20GFrequency [Hz]
Marker: 1.881763527 GHz 11.43 dBmDelta Mk: 1.879759519 GHz -59.46 dB
MES WCDMA1900 H 9800 Constant: -13 dBm
Report No.: SET2016-11616
CCIC-SET/T(00) Page 95 of 97
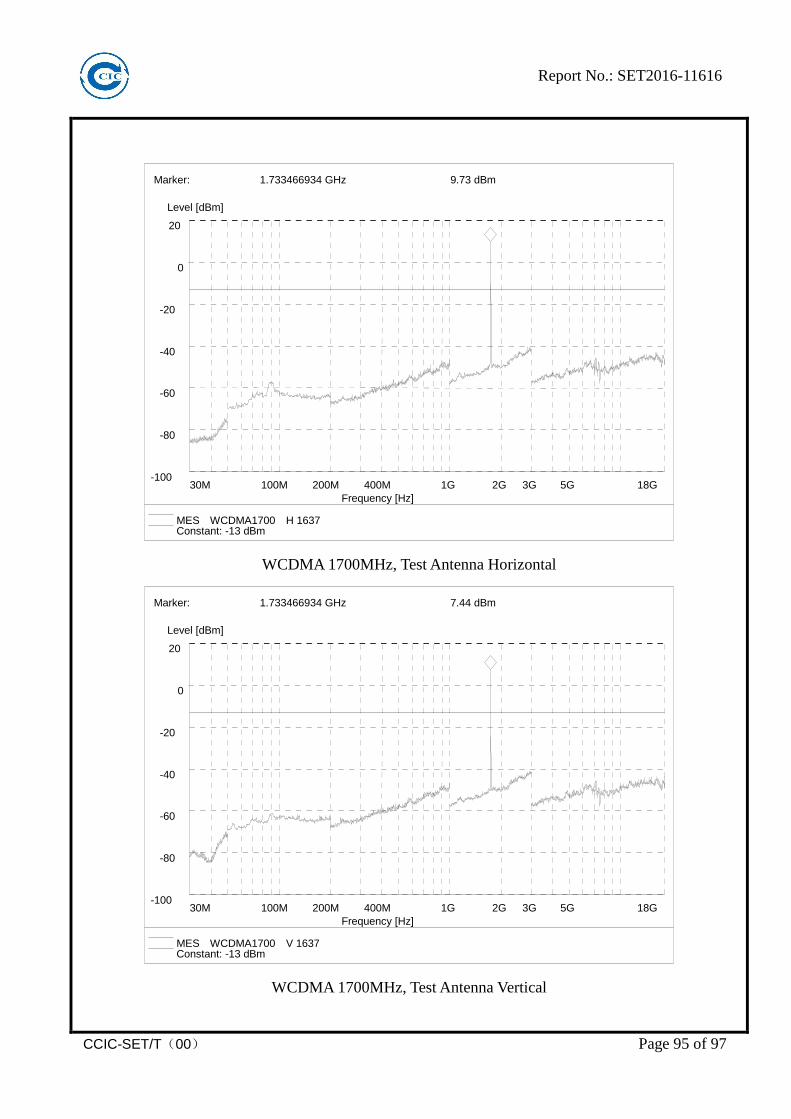
WCDMA 1700MHz, Test Antenna Horizontal
WCDMA 1700MHz, Test Antenna Vertical
-100
-80
-60
-40
-20
0
20
Level [dBm]
30M 100M 200M 400M 1G 2G 3G 5G 18GFrequency [Hz]
Marker: 1.733466934 GHz 7.44 dBm
MES WCDMA1700 V 1637 Constant: -13 dBm
-100
-80
-60
-40
-20
0
20
Level [dBm]
30M 100M 200M 400M 1G 2G 3G 5G 18GFrequency [Hz]
Marker: 1.733466934 GHz 9.73 dBm
MES WCDMA1700 H 1637 Constant: -13 dBm

Report No.: SET2016-11616
CCIC-SET/T(00) Page 96 of 97
3. LIST OF MEASURING EQUIPMENT
Description Manufacturer Model Serial No. Test Date Due Date Remark
EMI Test
Receiver R&S ESIB26 A0304218 2016.06.02 2017.06.01 Radiation
Full-Anechoic
Chamber Albatross
12.8m*6.8m*
6.4m A0412372 2016.06.02 2017.06.01 Radiation
Loop Antenna Schwarz beck HFH2-Z2 100047 2016.06.02 2017.06.01 Radiation
Ultra-wideband
antenna
(30MHz~1GHz)
R&S HL562 100089 2016.06.02 2017.06.01 Radiation
Double ridge
horn antenna
(1G~18GHz)
R&S HF906 100150 2016.06.02 2017.06.01 Radiation
Test Antenna –
Horn
(18G-26.5GHz)
ETS 3160-09 A0902607 2016.06.02 2017.06.01 Radiation
Amplifier
20M~3GHz R&S PAP-0203H 22018 2016.06.02 2017.06.01 Radiation
Ampilier
1G~18GHz R&S
MITEQ
AFS42-00101
800
25-S-42 2016.06.02 2017.06.01 Radiation
Ampilier
18G~40GHz R&S
JS42-180026
00-28-5A 12111.0980.00 2016.06.02 2017.06.01 Radiation
Spectrum
Analyzer R&S FSP40 1164.4391.40 2016.06.02 2017.06.01 Conducted
Power Meter R&S NRP2 1020.1809.02 2016.06.02 2017.06.01 Conducted
Power Sensor R&S NRP-Z81 823.3618.03 2016.06.02 2017.06.01 Conducted
LISN ROHDE&SC
HWARZ ESH2-Z5 A0304221 2016.06.02 2017.06.01 Conducted
Test Receiver R&S ESCS30 A0304260 2016.06.02 2017.06.01 Conducted
Cable SUNHNER SUCOFLEX
100 / 2016.06.02 2017.06.01 Radiation
Cable SUNHNER SUCOFLEX
104 / 2016.06.02 2017.06.01 Radiation
Report No.: SET2016-11616
CCIC-SET/T(00) Page 97 of 97
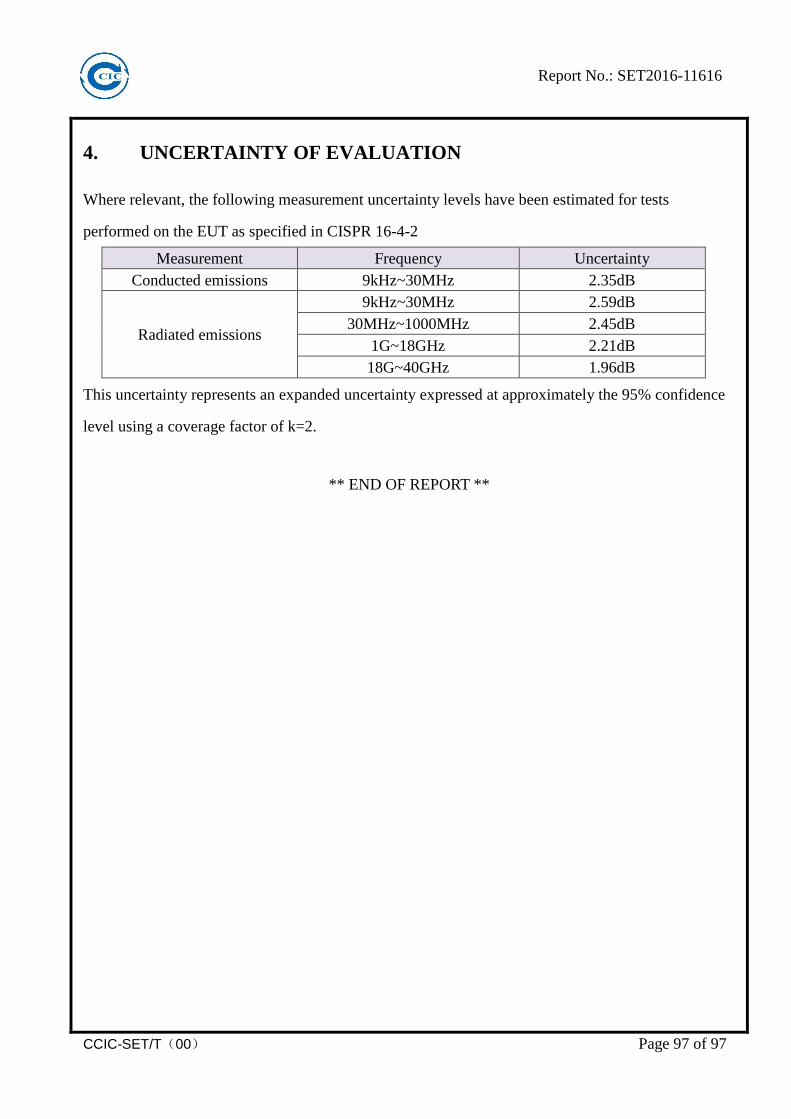
4. UNCERTAINTY OF EVALUATION
Where relevant, the following measurement uncertainty levels have been estimated for tests
performed on the EUT as specified in CISPR 16-4-2
Measurement Frequency Uncertainty Conducted emissions 9kHz~30MHz 2.35dB
Radiated emissions
9kHz~30MHz 2.59dB 30MHz~1000MHz 2.45dB
1G~18GHz 2.21dB 18G~40GHz 1.96dB
This uncertainty represents an expanded uncertainty expressed at approximately the 95% confidence
level using a coverage factor of k=2.
** END OF REPORT **