GSA DATA REPOSITORY 2014287 - Geological Society … · 2 . Figure DR2. Typical Valles Marineris...
5
1 The erosion rate and previous extent of interior layered deposits on Mars revealed by obstructed landslides Supplementary Information P. M. Grindrod and N. H. Warner Figure DR1. Context map of the study area in (a) Valles Marineris and (b) Ophir Chasma. Black boxes show the location of figures in the main text and Supplementary Material. Large-scale interior layered deposits (ILDs) are highlighted throughout the wider Valles Marineris region. GSA DATA REPOSITORY 2014287
Transcript of GSA DATA REPOSITORY 2014287 - Geological Society … · 2 . Figure DR2. Typical Valles Marineris...

1
The erosion rate and previous extent of interior layered deposits on Mars revealed by
obstructed landslides
Supplementary Information
P. M. Grindrod and N. H. Warner
Figure DR1. Context map of the study area in (a) Valles Marineris and (b) Ophir Chasma. Black
boxes show the location of figures in the main text and Supplementary Material. Large-scale
interior layered deposits (ILDs) are highlighted throughout the wider Valles Marineris region.
GSA DATA REPOSITORY 2014287
2
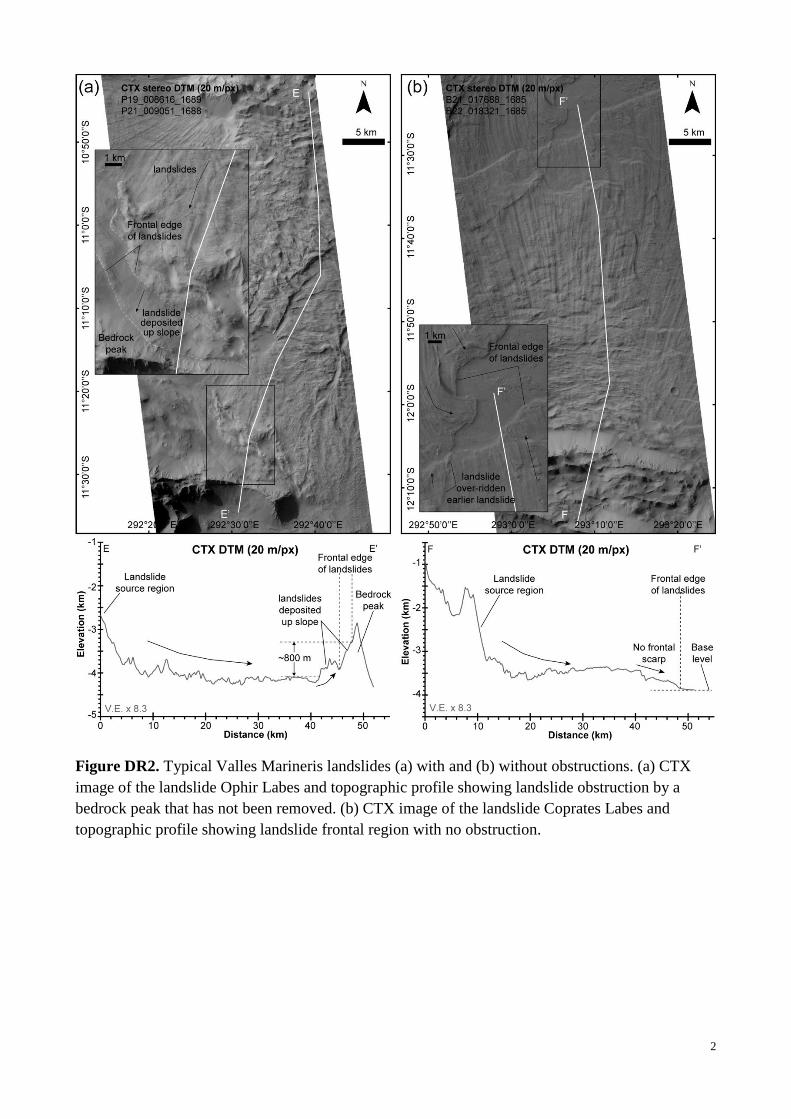
Figure DR2. Typical Valles Marineris landslides (a) with and (b) without obstructions. (a) CTX
image of the landslide Ophir Labes and topographic profile showing landslide obstruction by a
bedrock peak that has not been removed. (b) CTX image of the landslide Coprates Labes and
topographic profile showing landslide frontal region with no obstruction.

3
Figure DR3. Perspective view of an obstructed landslide. The frontal scarp is 1 – 2 km from and
mimics the shape of the ILD. Perspective view made from a CTX stereo DTM and image. Also
shown (inset) is a close-up view of the frontal scarp.
Figure DR4. Schematic diagram, not to scale, showing the proposed formation scenario. (a)
Landslide deposits flow away from their source region and are obstructed by the ILDs. Shown are
both minimum and maximum representative sizes of ILDs that could have caused such an
obstruction. (b) After landslide formation the ILDs have reduced in size, causing limited slumping
at the toe of the landslide, but with landslide material volumes being conserved.

4
Figure DR5. Crater count results for the ILDs. Plot is binned cumulative crater frequency
histogram for all craters greater than 50 m diameter. PF is the production function (Ivanov, 2001)
and CF is the chronology function (Hartmann and Neukum, 2001).
Interior Layered Deposits Volume Loss
We estimate the minimum and maximum volume of material lost from the ILDs by
assuming that the retreat at the front of the landslides is indicative of volume loss elsewhere. To
estimate the minimum volume of ILD material that must have been removed, we calculated the area
defined by the current landslide frontal scarp and multiplied by either the path length or
circumference of the ILD boundaries. Some of the landslide toe (the highest point) has likely fallen
into the void left by the ILD removal, but the overall effect on the results will be small as volume
will be conserved. Therefore if material has been lost just from the northern slopes of the two ILDs,
then the minimum volume removed is ~0.4 x 10³ km
3; if however material has been lost from the
entire circumference of the two ILDs then the minimum volume removed is ~1.2 x 10³ km
3. If
material has been removed from the entire ILD, rather than just at the base close to the landslide,
then we can calculate maximum estimates of material loss. In this case we cropped a 50 m/px

5
HRSC DTM mosaic to the ILD outline, then added 500 m of elevation and calculated the volume
difference. Therefore if material has been lost just from the northern boundary of both ILDs, then
the maximum volume removed is ~1.5 x 10³ km
3; if however material has been lost from the entire
circumference of the two ILDs then the maximum volume removed is ~5.8 x 10³ km
3.
Table DR1. Results of landslide crater counts.
Landslide No. Area
(km2)
N
(craters in age)
Fit Range
(km) N(1) N(10)
Model Age
(Ma)
1 157 130 0.1 – 0.48 2.1 x 10⁻⁴
3.0 x10⁻⁶
423 +55/-58
2 360 276 0.1 – 0.45 1.8 x10⁻⁴
2.6 x10⁻⁶
374 +34/-37
3 308 228 0.1 – 0.45 1.4 x10⁻⁴
2.8 x10⁻⁶
397 +40/-42
4 312 173 0.1 – 0.40 1.5 x10⁻⁴
2.1 x10⁻⁶
308 +35/-38
5 263 115 0.1 – 0.35 1.1 x10⁻⁴
1.6 x10⁻⁶
225 +31/-34
6 509 197 0.1 – 0.48 1.1 x10⁻⁴
1.5 x10⁻⁶
216 +23/-24