Gs503 vcf lecture 2 risk return 310115
50
RISK RISK & & RETURNS RETURNS Prof.Stephen Ong Prof.Stephen Ong BSc(Hons)Econs (LSE), MBA (Bradford) BSc(Hons)Econs (LSE), MBA (Bradford) Visiting Professor, Shenzhen University Visiting Professor, Shenzhen University Academic Fellow, Entrepreneurship & Innovation, Academic Fellow, Entrepreneurship & Innovation, The Lord Ashcroft International Business School, The Lord Ashcroft International Business School, Anglia Ruskin University Cambridge UK Anglia Ruskin University Cambridge UK MSC TECHNOPRENEURSHIP : MSC TECHNOPRENEURSHIP : VENTURE CAPITAL FINANCING VENTURE CAPITAL FINANCING
-
Upload
stephen-ong -
Category
Business
-
view
128 -
download
1
Transcript of Gs503 vcf lecture 2 risk return 310115
RISK RISK & &
RETURNSRETURNS
Prof.Stephen OngProf.Stephen OngBSc(Hons)Econs (LSE), MBA (Bradford)BSc(Hons)Econs (LSE), MBA (Bradford)
Visiting Professor, Shenzhen UniversityVisiting Professor, Shenzhen UniversityAcademic Fellow, Entrepreneurship & Innovation,Academic Fellow, Entrepreneurship & Innovation,
The Lord Ashcroft International Business School, The Lord Ashcroft International Business School, Anglia Ruskin University Cambridge UKAnglia Ruskin University Cambridge UK
MSC TECHNOPRENEURSHIP : MSC TECHNOPRENEURSHIP : VENTURE CAPITAL FINANCINGVENTURE CAPITAL FINANCING
Today’s Overview Today’s Overview
LEARNING OBJECTIVESLEARNING OBJECTIVES
To understanding key measures of To understanding key measures of returns in the VC industry;returns in the VC industry;
To review real returns by VC firms;To review real returns by VC firms;To understand the cost of capital for To understand the cost of capital for
VC firms;VC firms;To learn relevant models to include To learn relevant models to include
various risk factors various risk factors
1.Venture Capital Returns
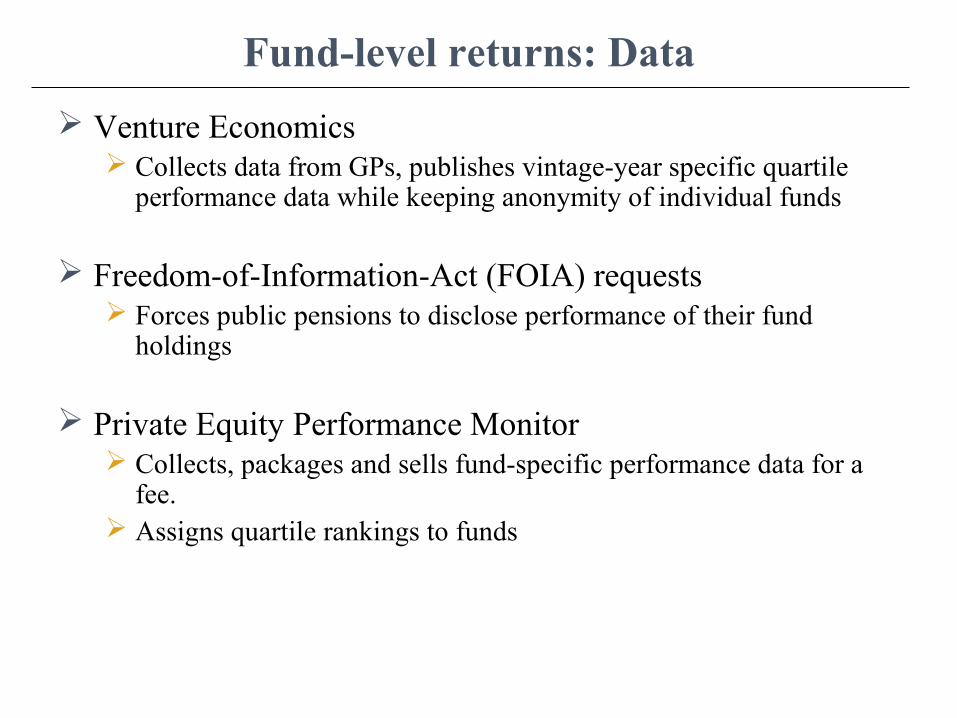
Fund-level returns: Data
Venture Economics Collects data from GPs, publishes vintage-year specific quartile
performance data while keeping anonymity of individual funds
Freedom-of-Information-Act (FOIA) requests Forces public pensions to disclose performance of their fund
holdings
Private Equity Performance Monitor Collects, packages and sells fund-specific performance data for a
fee. Assigns quartile rankings to funds
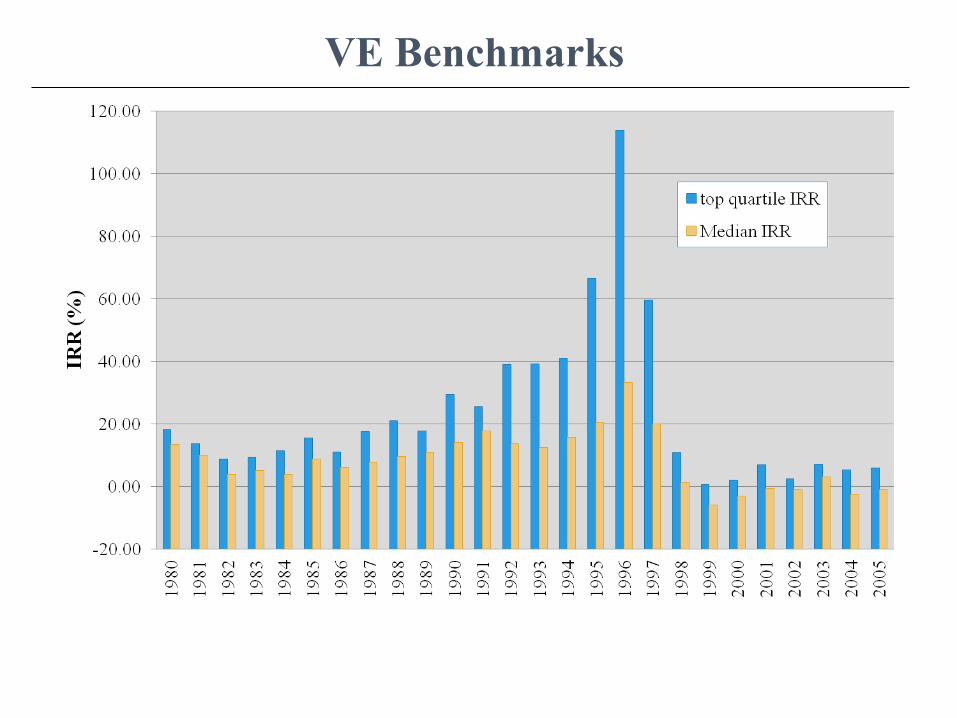
VE Benchmarks
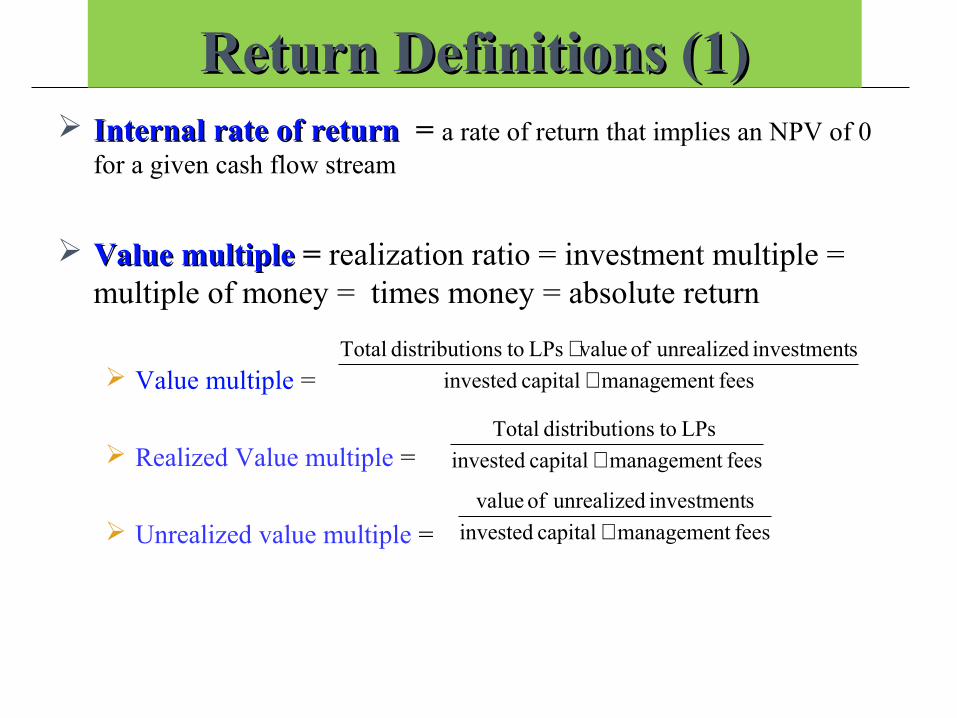
Return Definitions (1)Return Definitions (1) Internal rate of returnInternal rate of return = a rate of return that implies an NPV of 0
for a given cash flow stream
Value multiple Value multiple = realization ratio = investment multiple = multiple of money = times money = absolute return
Value multiple =
Realized Value multiple =
Unrealized value multiple =
fees management capital invested
sinvestment unrealized of value LPs toonsdistributi Total
++
fees management capital invested
LPs toonsdistributi Total
+
fees management capital invested
sinvestment unrealized of value
+
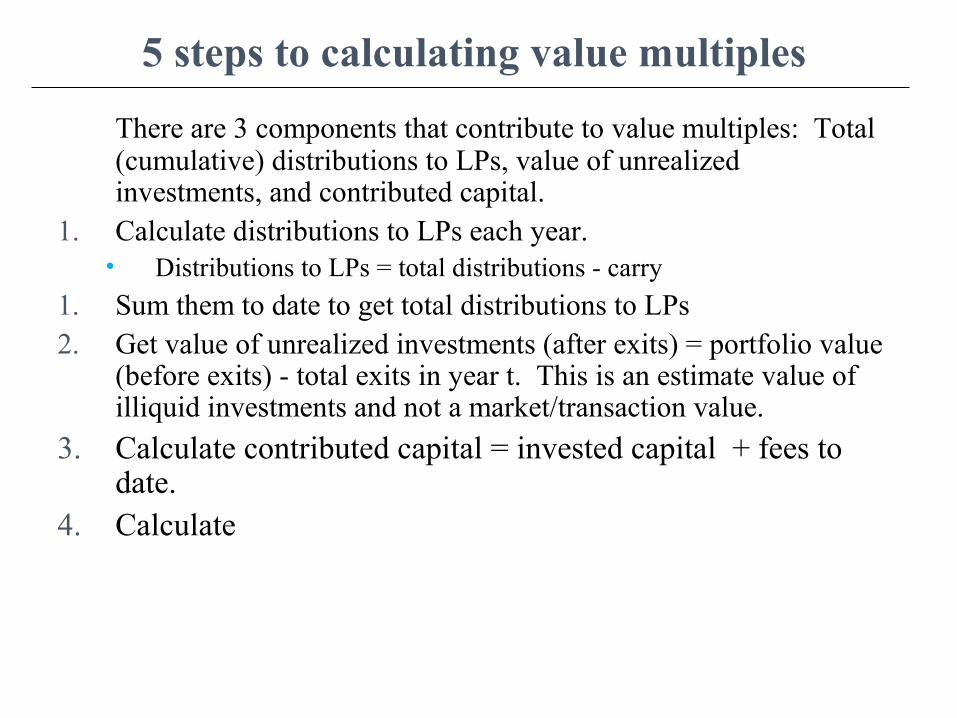
5 steps to calculating value multiples
There are 3 components that contribute to value multiples: Total (cumulative) distributions to LPs, value of unrealized investments, and contributed capital.
1. Calculate distributions to LPs each year. • Distributions to LPs = total distributions - carry
1. Sum them to date to get total distributions to LPs2. Get value of unrealized investments (after exits) = portfolio value
(before exits) - total exits in year t. This is an estimate value of illiquid investments and not a market/transaction value.
3. Calculate contributed capital = invested capital + fees to date.
4. Calculate
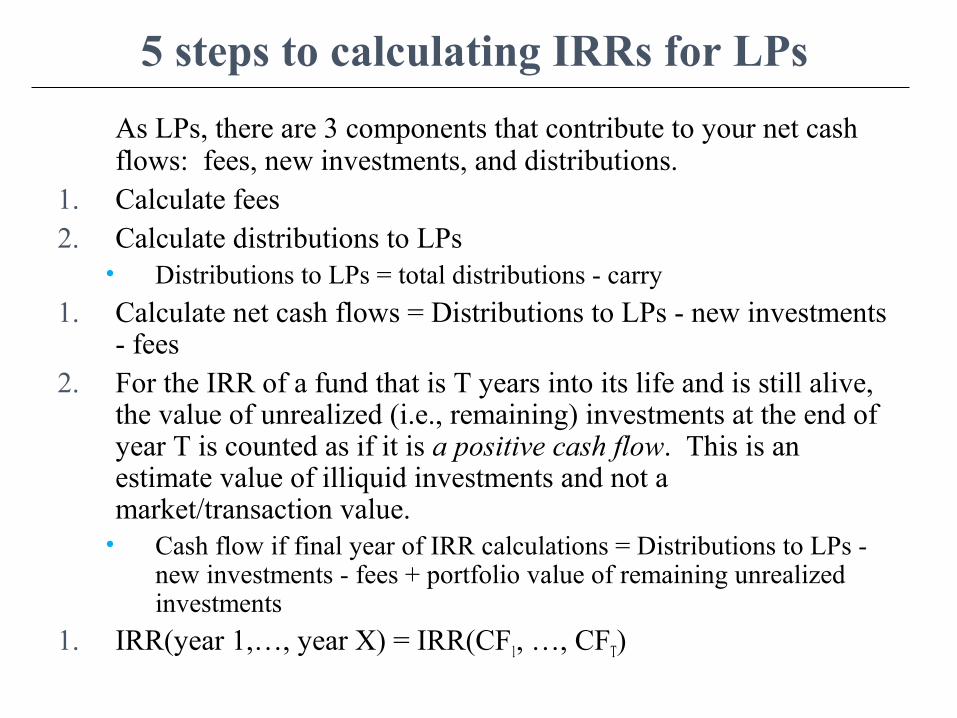
5 steps to calculating IRRs for LPs
As LPs, there are 3 components that contribute to your net cash flows: fees, new investments, and distributions.
1. Calculate fees2. Calculate distributions to LPs
• Distributions to LPs = total distributions - carry
1. Calculate net cash flows = Distributions to LPs - new investments - fees
2. For the IRR of a fund that is T years into its life and is still alive, the value of unrealized (i.e., remaining) investments at the end of year T is counted as if it is a positive cash flow. This is an estimate value of illiquid investments and not a market/transaction value.
• Cash flow if final year of IRR calculations = Distributions to LPs - new investments - fees + portfolio value of remaining unrealized investments
1. IRR(year 1,…, year X) = IRR(CF1, …, CFT)
EXERCISEEXERCISE
IRRIRR
CALCULATIONCALCULATION
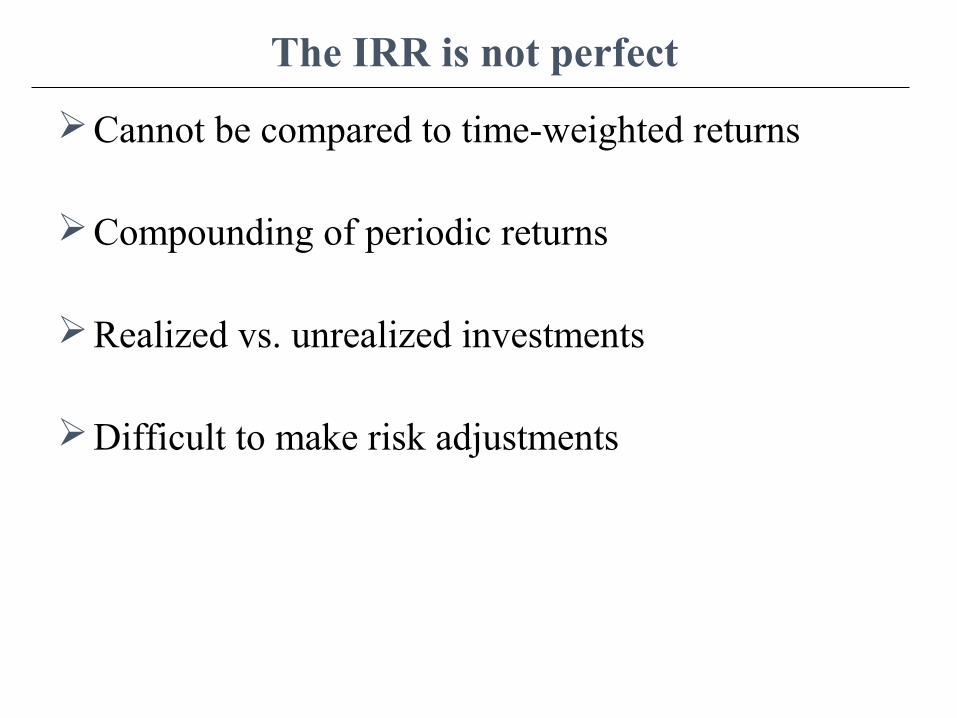
The IRR is not perfect
Cannot be compared to time-weighted returns
Compounding of periodic returns
Realized vs. unrealized investments
Difficult to make risk adjustments
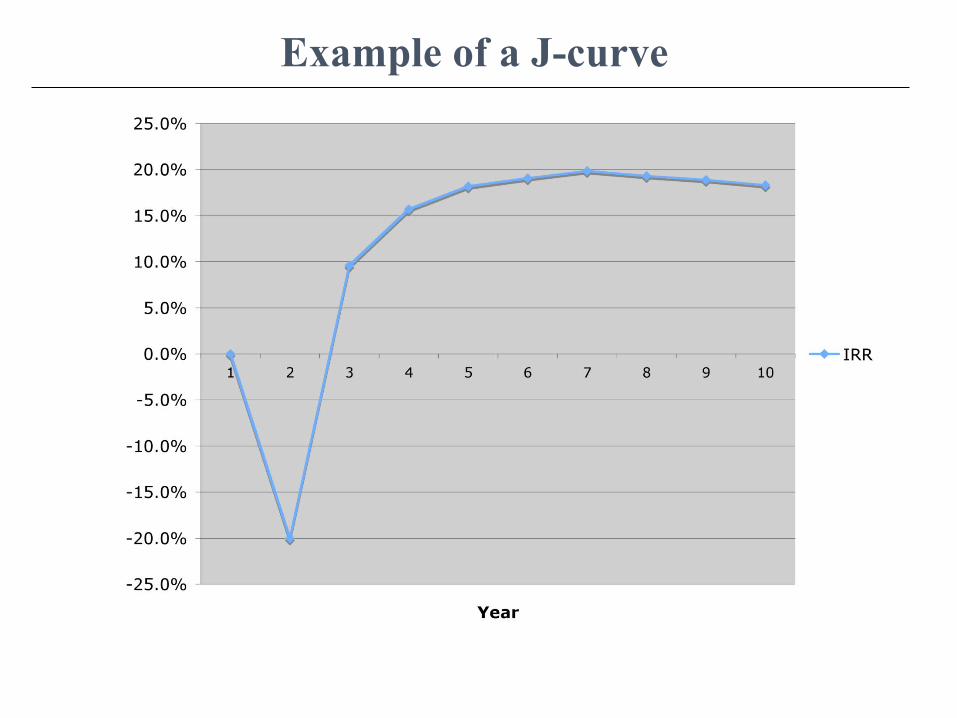
Example of a J-curve
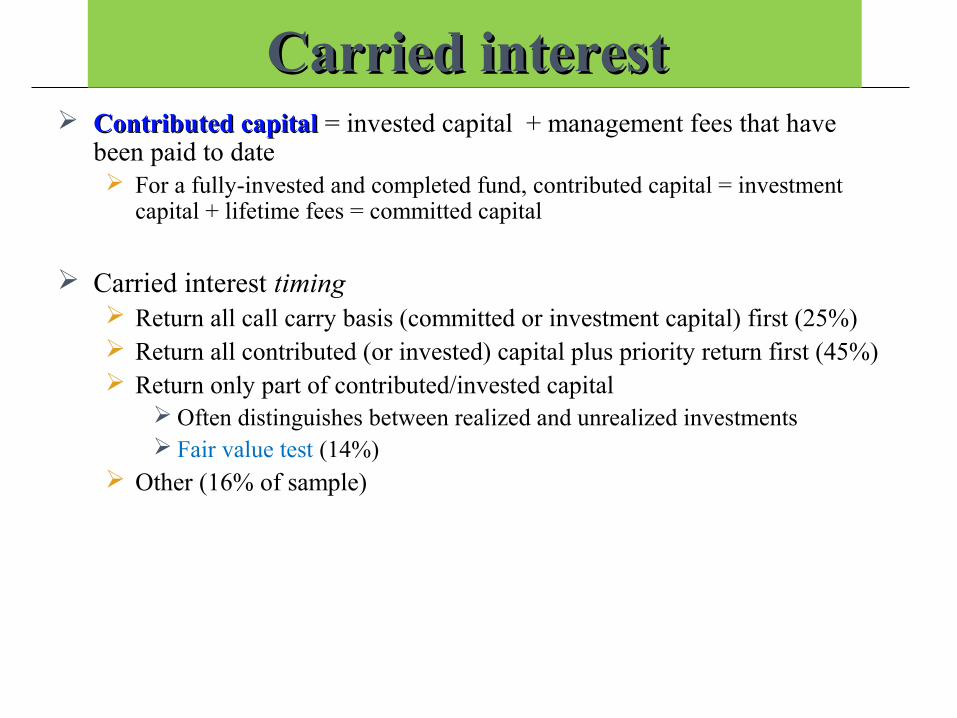
Carried interest Carried interest Contributed capitalContributed capital = invested capital + management fees that have
been paid to date For a fully-invested and completed fund, contributed capital = investment
capital + lifetime fees = committed capital
Carried interest timing Return all call carry basis (committed or investment capital) first (25%) Return all contributed (or invested) capital plus priority return first (45%) Return only part of contributed/invested capital
Often distinguishes between realized and unrealized investments Fair value test (14%)
Other (16% of sample)
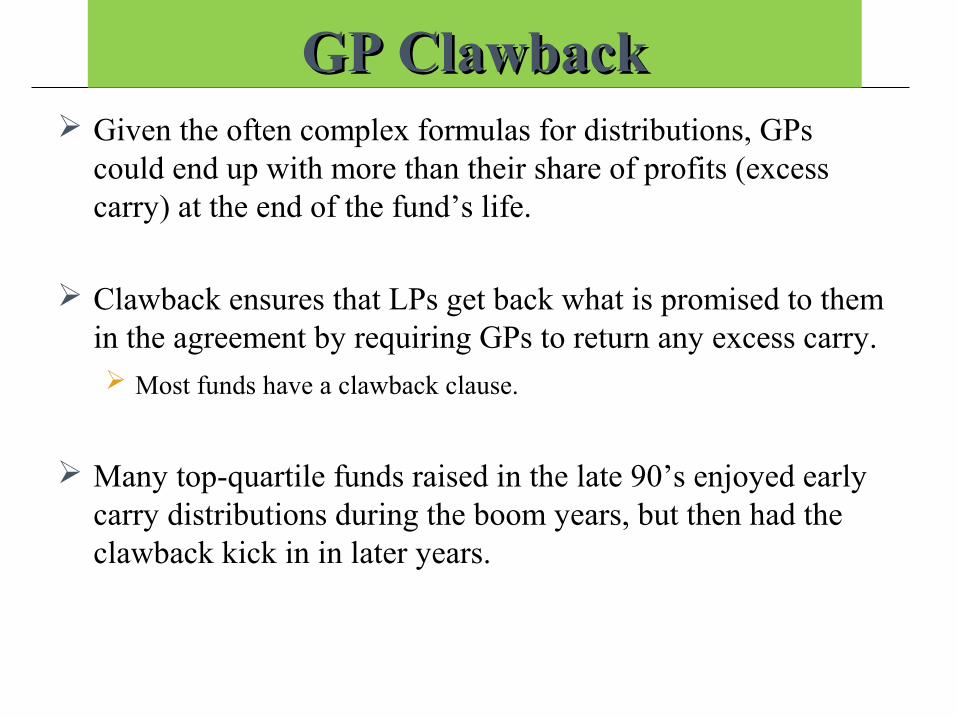
GP ClawbackGP Clawback Given the often complex formulas for distributions, GPs
could end up with more than their share of profits (excess carry) at the end of the fund’s life.
Clawback ensures that LPs get back what is promised to them in the agreement by requiring GPs to return any excess carry. Most funds have a clawback clause.
Many top-quartile funds raised in the late 90’s enjoyed early carry distributions during the boom years, but then had the clawback kick in in later years.
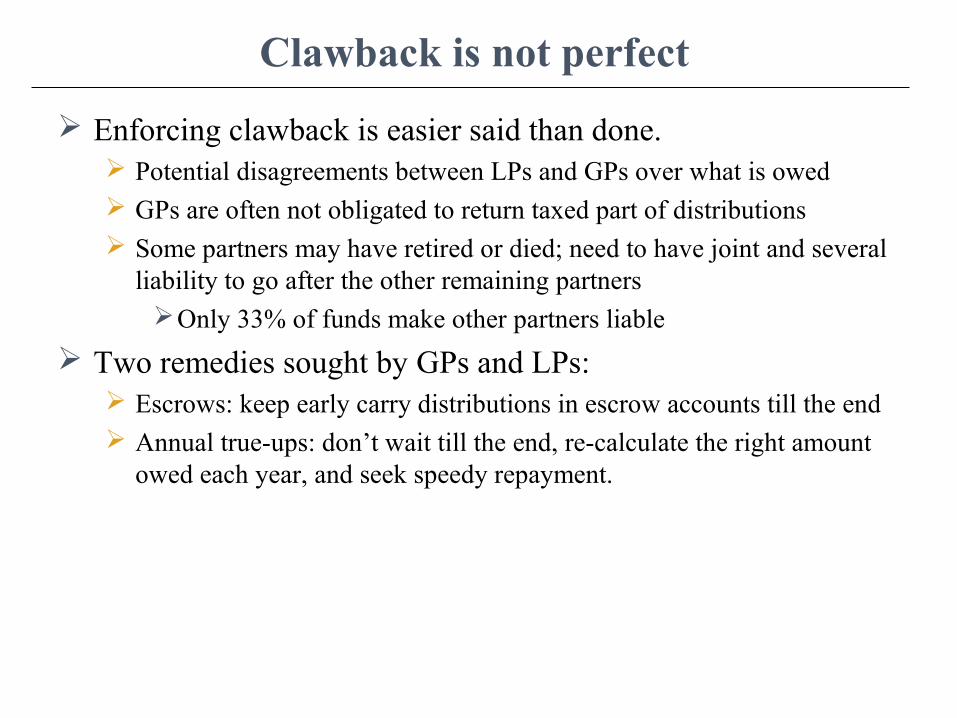
Clawback is not perfect
Enforcing clawback is easier said than done. Potential disagreements between LPs and GPs over what is owed GPs are often not obligated to return taxed part of distributions Some partners may have retired or died; need to have joint and several
liability to go after the other remaining partnersOnly 33% of funds make other partners liable
Two remedies sought by GPs and LPs: Escrows: keep early carry distributions in escrow accounts till the end Annual true-ups: don’t wait till the end, re-calculate the right amount
owed each year, and seek speedy repayment.
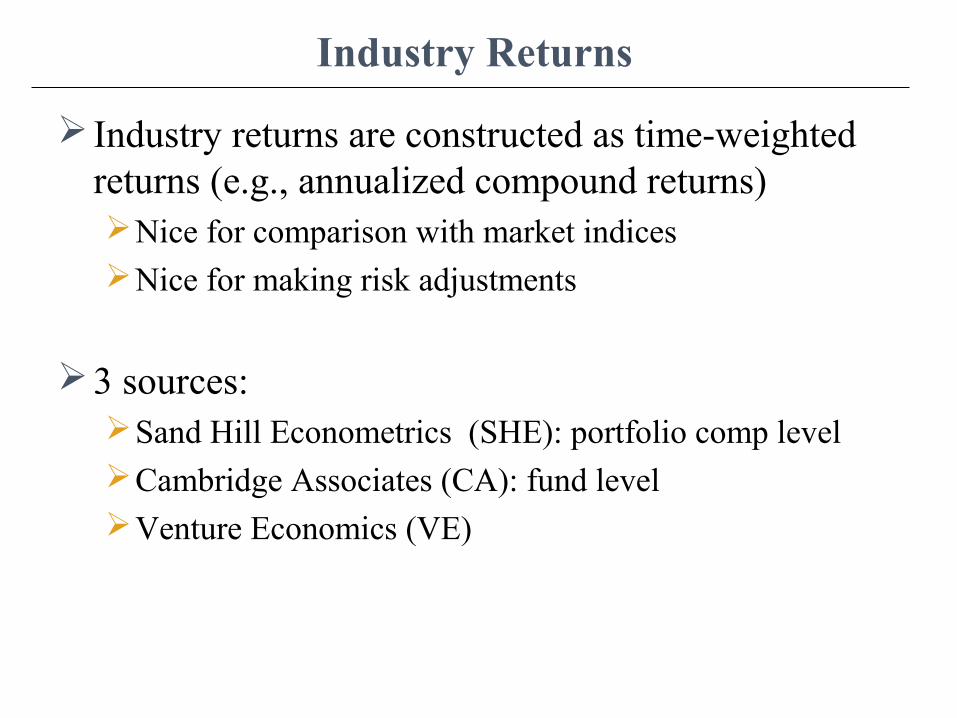
Industry Returns
Industry returns are constructed as time-weighted returns (e.g., annualized compound returns)Nice for comparison with market indicesNice for making risk adjustments
3 sources: Sand Hill Econometrics (SHE): portfolio comp levelCambridge Associates (CA): fund level Venture Economics (VE)
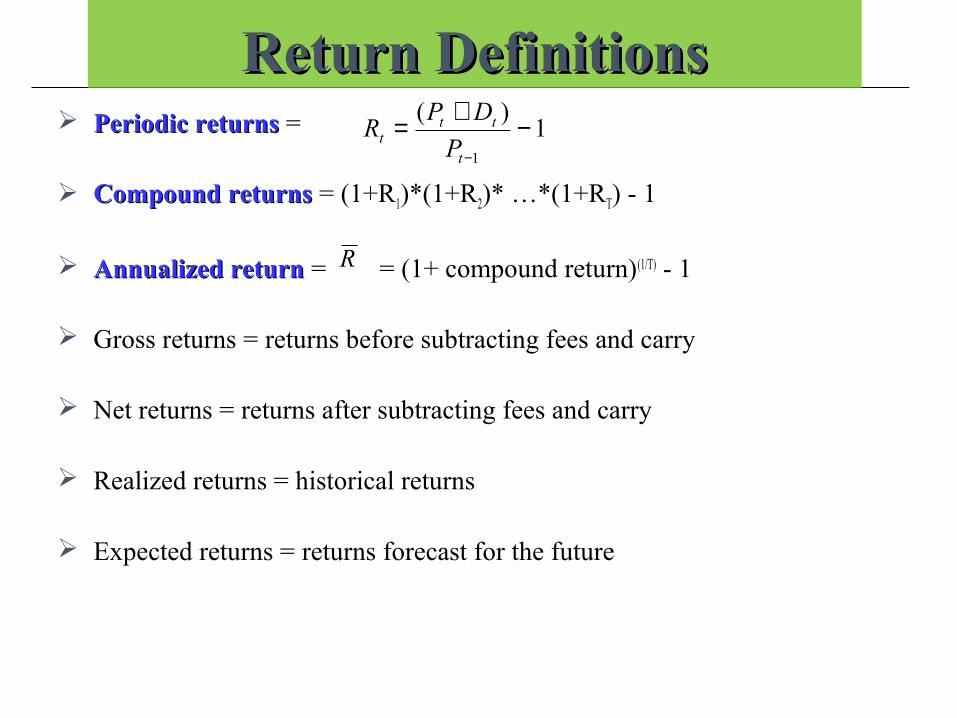
Return DefinitionsReturn Definitions Periodic returns Periodic returns =
Compound returns Compound returns = (1+R1)*(1+R2)* …*(1+RT) - 1
Annualized return Annualized return = = (1+ compound return)(1/T) - 1
Gross returns = returns before subtracting fees and carry
Net returns = returns after subtracting fees and carry
Realized returns = historical returns
Expected returns = returns forecast for the future
1)(
1
−+=−t
ttt P
DPR
R
EXERCISEEXERCISE
RETURNS :RETURNS :Exercise 3.1 (Metrick 2011)Exercise 3.1 (Metrick 2011)
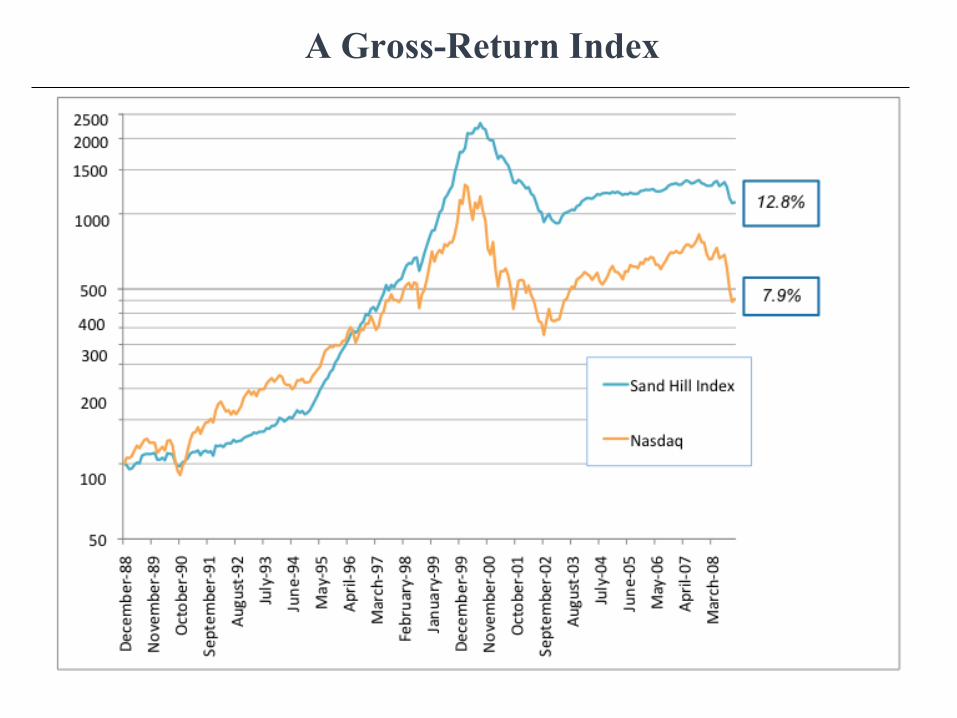
A Gross-Return Index
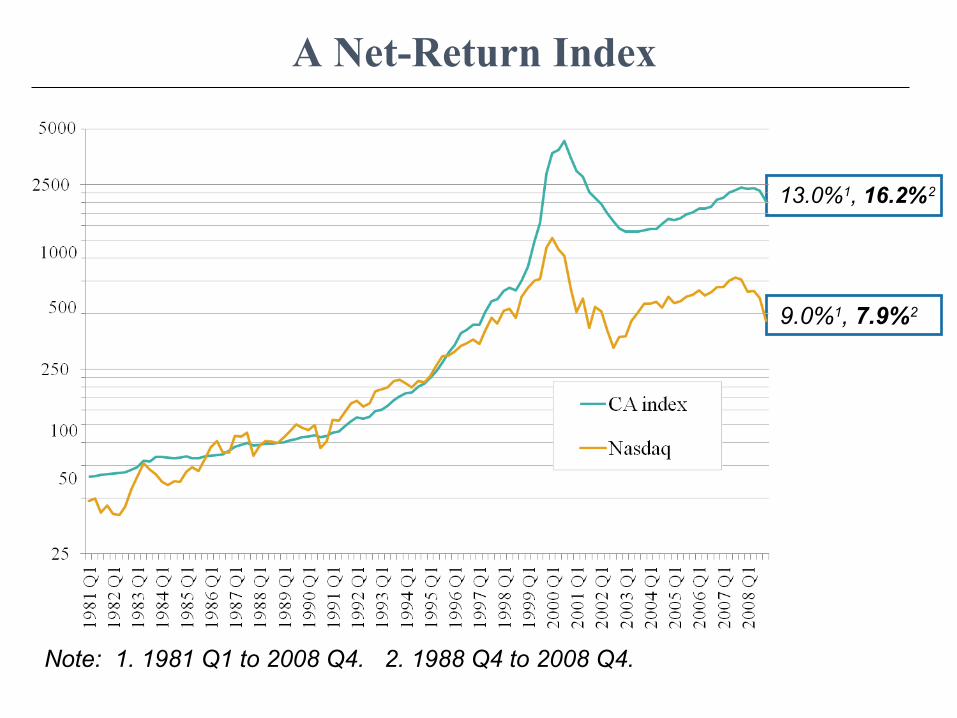
A Net-Return Index
Note: 1. 1981 Q1 to 2008 Q4. 2. 1988 Q4 to 2008 Q4.
13.0%1, 16.2%2
9.0%1, 7.9%2
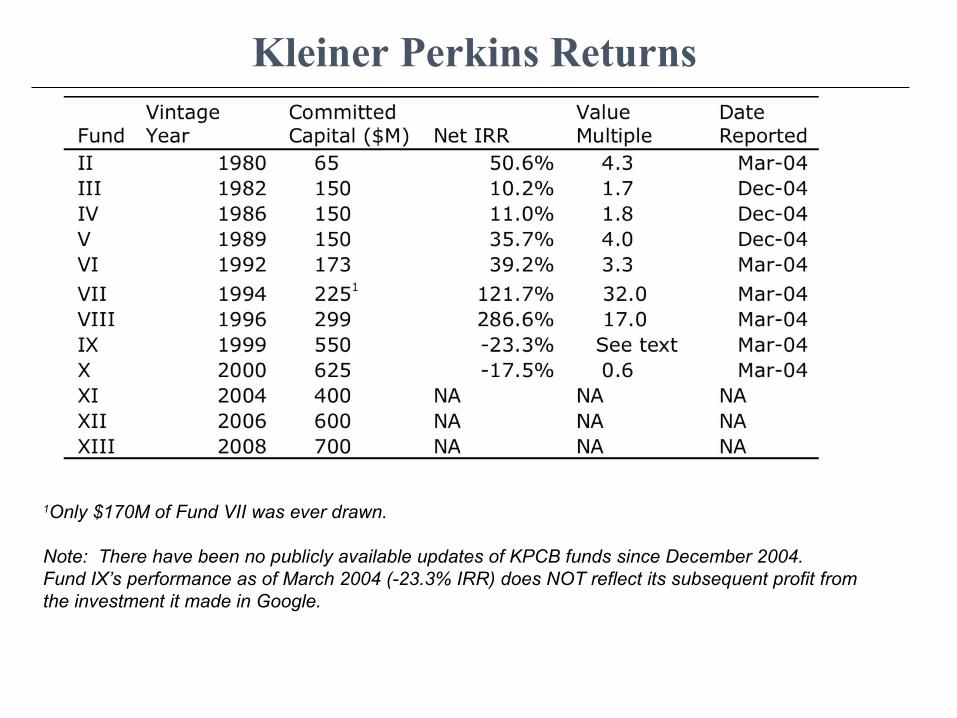
Kleiner Perkins Returns
1Only $170M of Fund VII was ever drawn.
Note: There have been no publicly available updates of KPCB funds since December 2004.Fund IX’s performance as of March 2004 (-23.3% IRR) does NOT reflect its subsequent profit from the investment it made in Google.
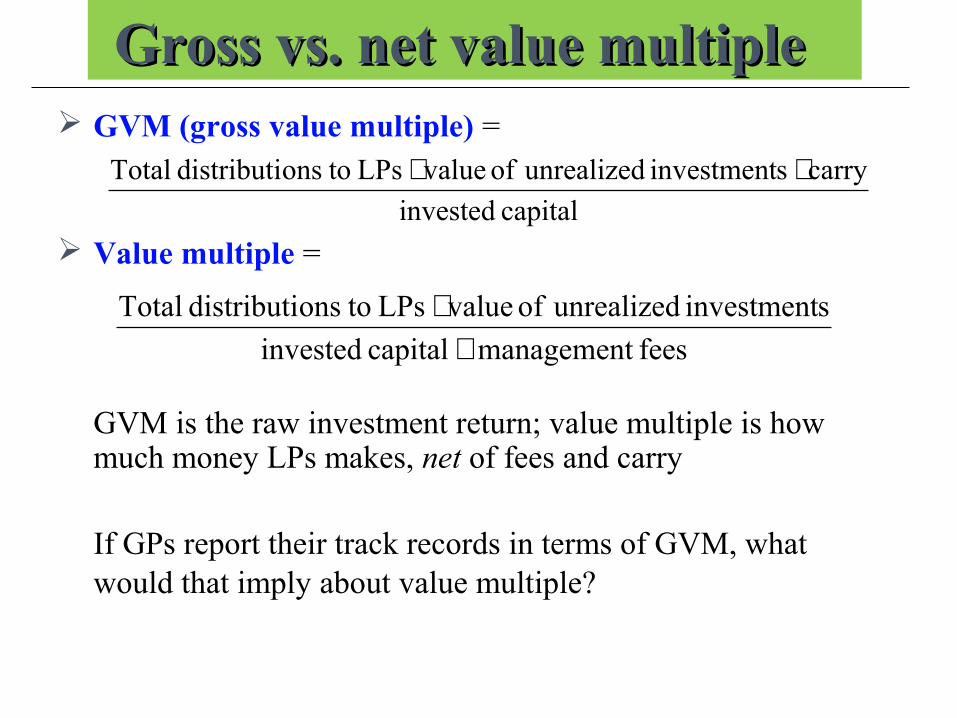
Gross vs. net value multiple Gross vs. net value multiple GVM (gross value multiple) =
Value multiple =
GVM is the raw investment return; value multiple is how much money LPs makes, net of fees and carry
If GPs report their track records in terms of GVM, what would that imply about value multiple?
capital invested
carry sinvestment unrealized of value LPs toonsdistributi Total ++
fees management capital invested
sinvestment unrealized of value LPs toonsdistributi Total
++
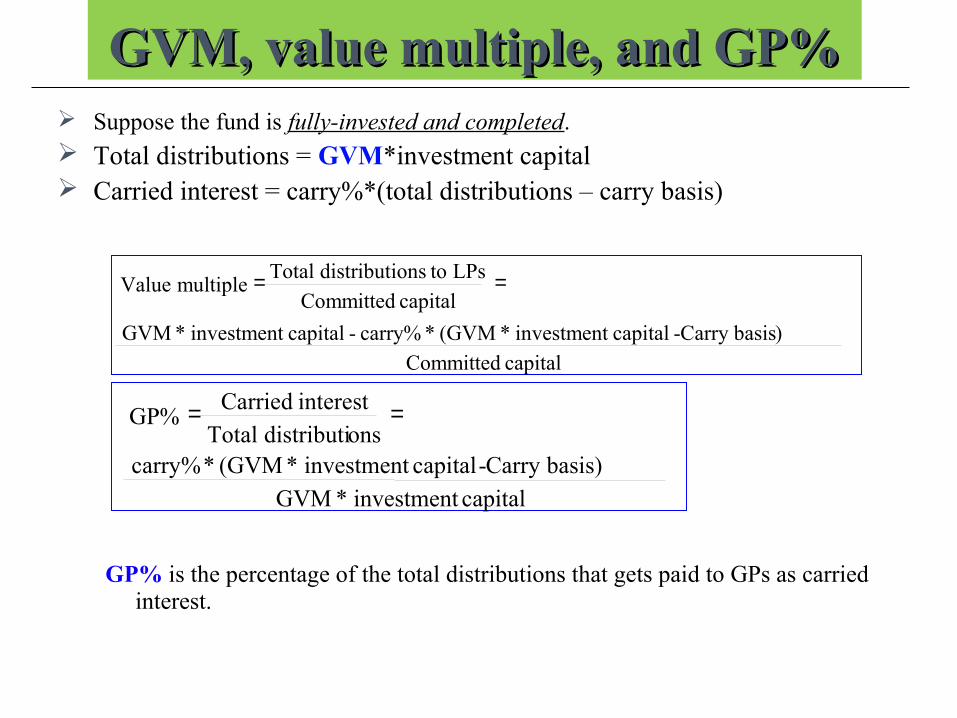
GVM, value multiple, and GP%GVM, value multiple, and GP% Suppose the fund is fully-invested and completed. Total distributions = GVM*investment capital Carried interest = carry%*(total distributions – carry basis)
GP% is the percentage of the total distributions that gets paid to GPs as carried interest.
capital Committed
) Carry basis - capital investment*(GVM*carry% - capital investment*GVM
capital Committed
LPs toonsdistributi Total multiple Value ==
capital investment*GVM
Carry basis) - capital investment*(GVM*carry%onsdistributi Total
interest CarriedGP% ==
2.The Cost of Capital for VC
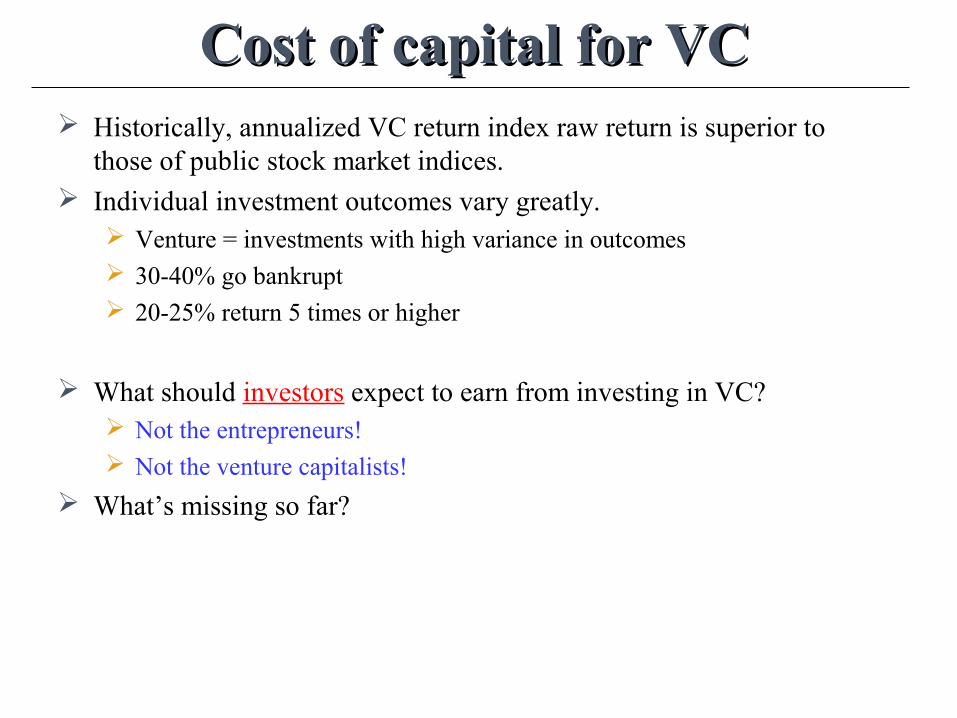
Cost of capital for VCCost of capital for VC Historically, annualized VC return index raw return is superior to
those of public stock market indices. Individual investment outcomes vary greatly.
Venture = investments with high variance in outcomes 30-40% go bankrupt 20-25% return 5 times or higher
What should investors expect to earn from investing in VC? Not the entrepreneurs! Not the venture capitalists!
What’s missing so far?
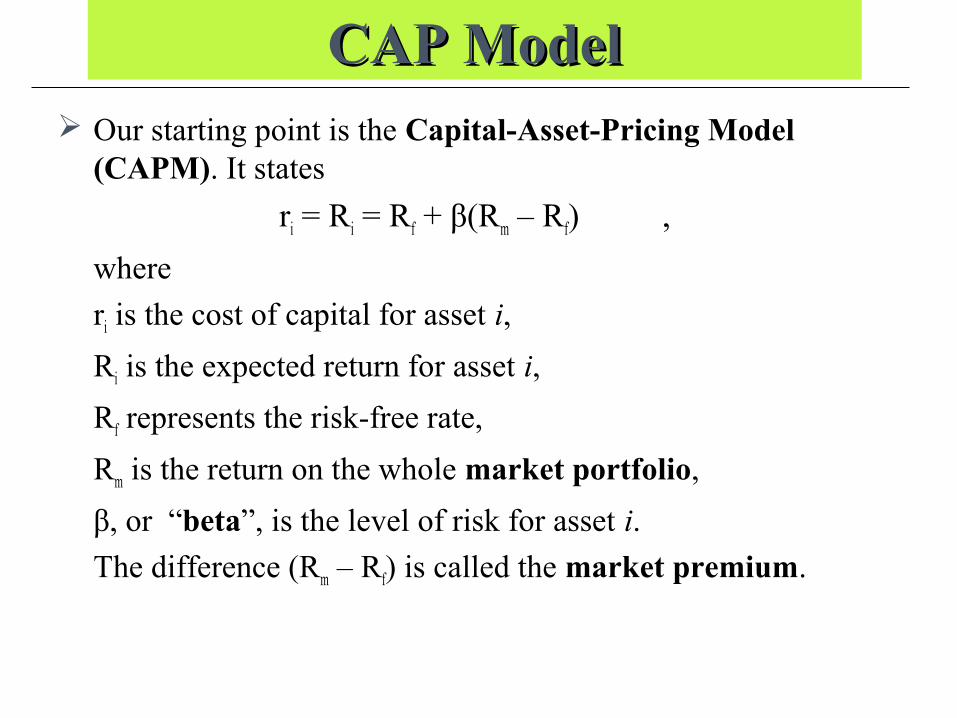
CAP ModelCAP Model Our starting point is the Capital-Asset-Pricing Model
(CAPM). It states
ri = Ri = Rf + β(Rm – Rf) ,
where
ri is the cost of capital for asset i,
Ri is the expected return for asset i,
Rf represents the risk-free rate,
Rm is the return on the whole market portfolio,
β, or “beta”, is the level of risk for asset i.
The difference (Rm – Rf) is called the market premium.
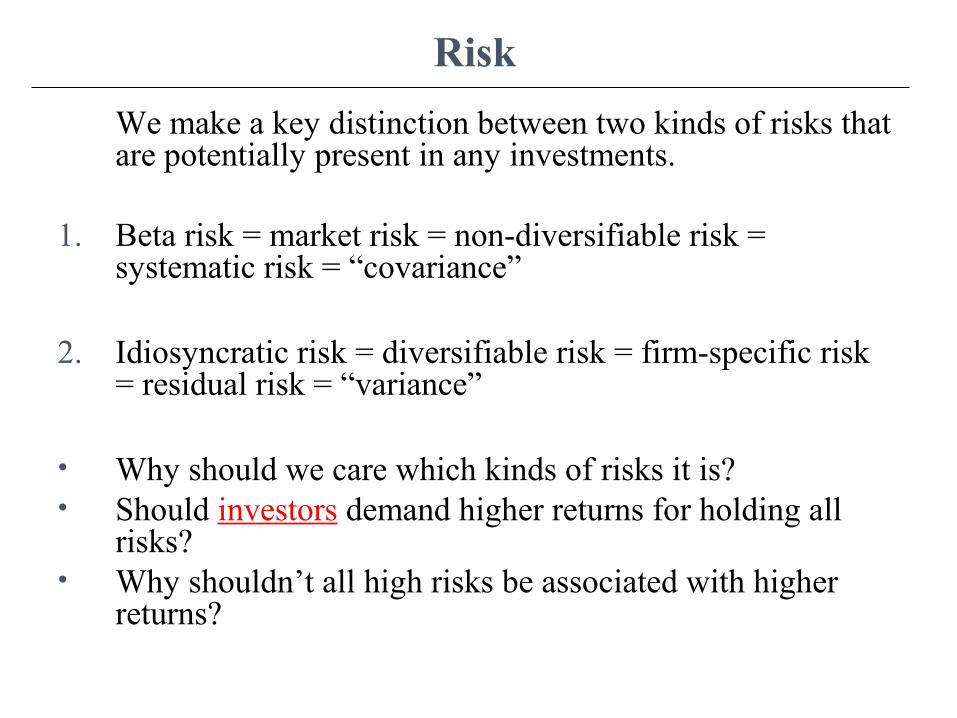
Risk
We make a key distinction between two kinds of risks that are potentially present in any investments.
1. Beta risk = market risk = non-diversifiable risk = systematic risk = “covariance”
2. Idiosyncratic risk = diversifiable risk = firm-specific risk = residual risk = “variance”
• Why should we care which kinds of risks it is? • Should investors demand higher returns for holding all
risks? • Why shouldn’t all high risks be associated with higher
returns?
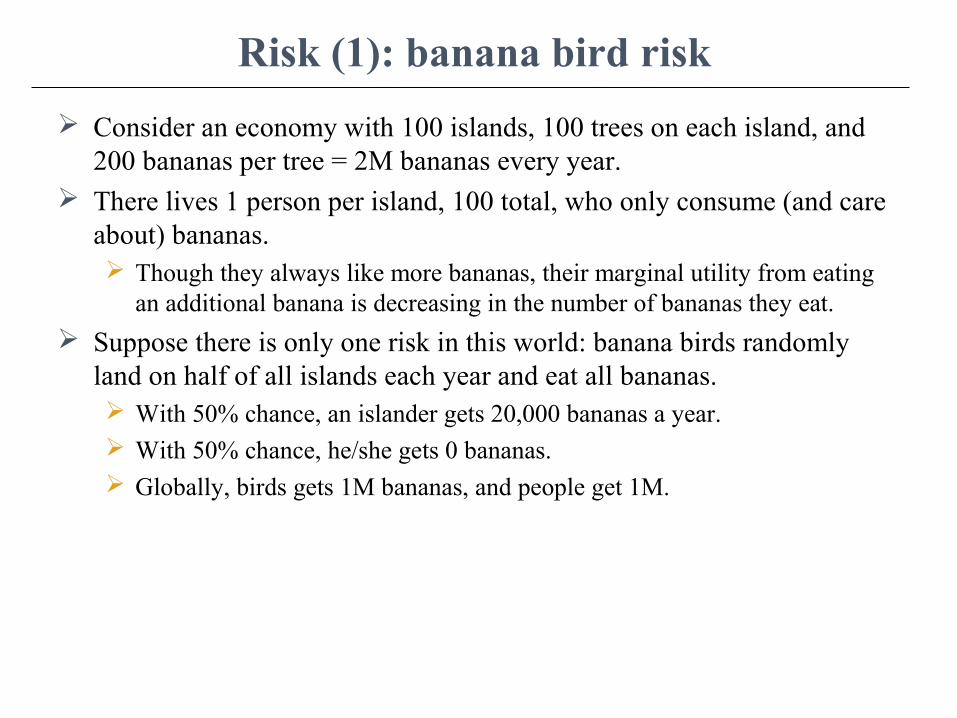
Risk (1): banana bird risk
Consider an economy with 100 islands, 100 trees on each island, and 200 bananas per tree = 2M bananas every year.
There lives 1 person per island, 100 total, who only consume (and care about) bananas. Though they always like more bananas, their marginal utility from eating
an additional banana is decreasing in the number of bananas they eat.
Suppose there is only one risk in this world: banana birds randomly land on half of all islands each year and eat all bananas. With 50% chance, an islander gets 20,000 bananas a year. With 50% chance, he/she gets 0 bananas. Globally, birds gets 1M bananas, and people get 1M.
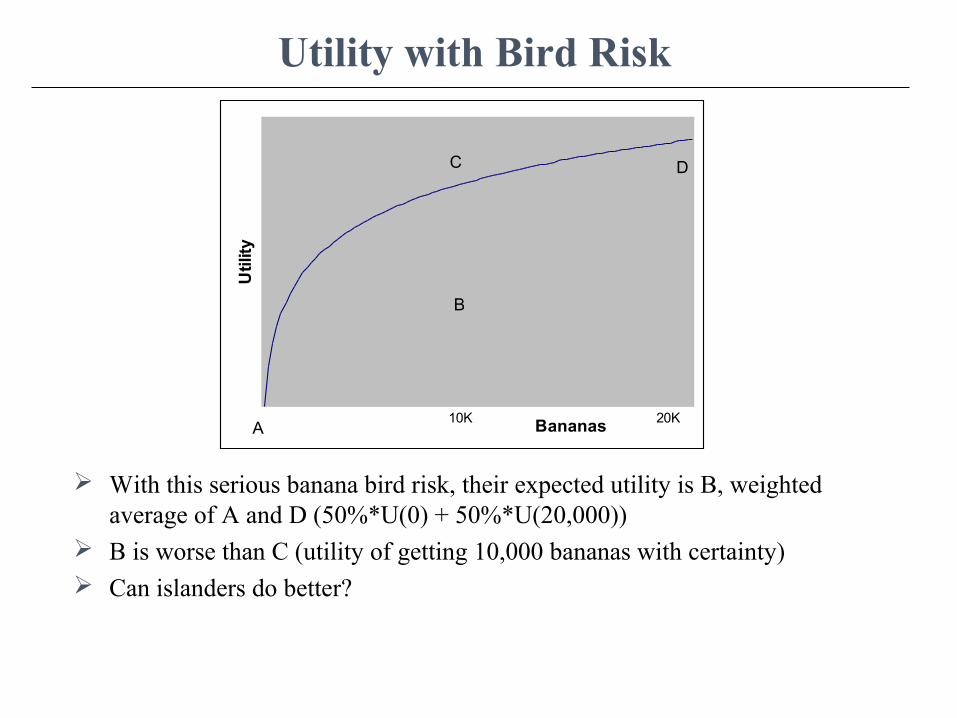
Utility with Bird Risk
With this serious banana bird risk, their expected utility is B, weighted average of A and D (50%*U(0) + 50%*U(20,000))
B is worse than C (utility of getting 10,000 bananas with certainty) Can islanders do better?
Bananas
Utility
D
A
C
B
20K10K
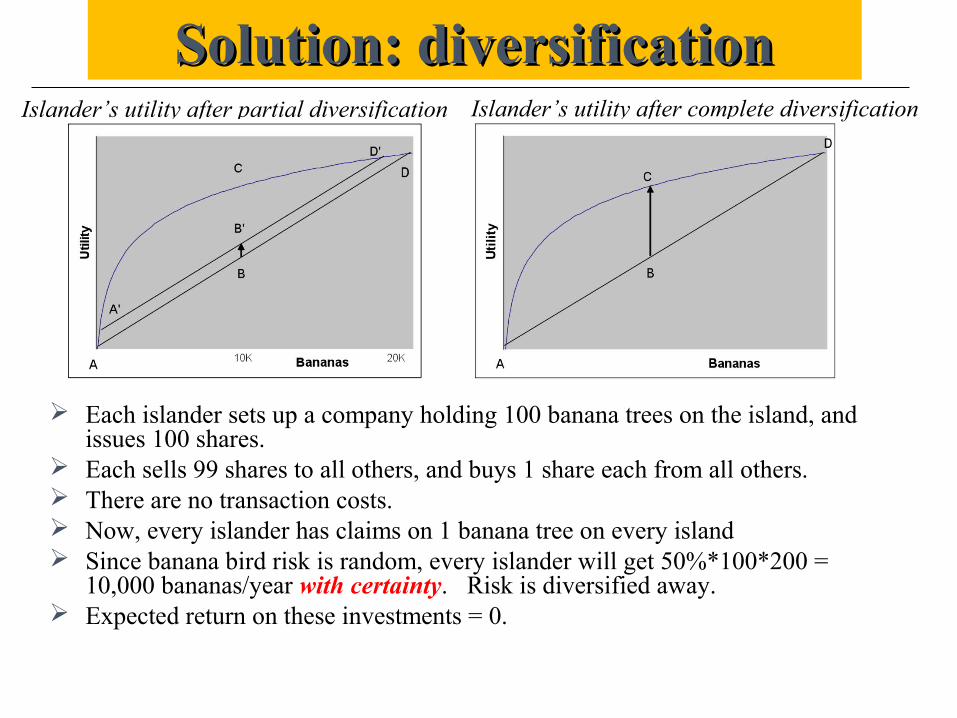
Solution: diversificationSolution: diversification
Each islander sets up a company holding 100 banana trees on the island, and issues 100 shares.
Each sells 99 shares to all others, and buys 1 share each from all others. There are no transaction costs. Now, every islander has claims on 1 banana tree on every island Since banana bird risk is random, every islander will get 50%*100*200 =
10,000 bananas/year with certainty. Risk is diversified away. Expected return on these investments = 0.
Islander’s utility after partial diversification Islander’s utility after complete diversification
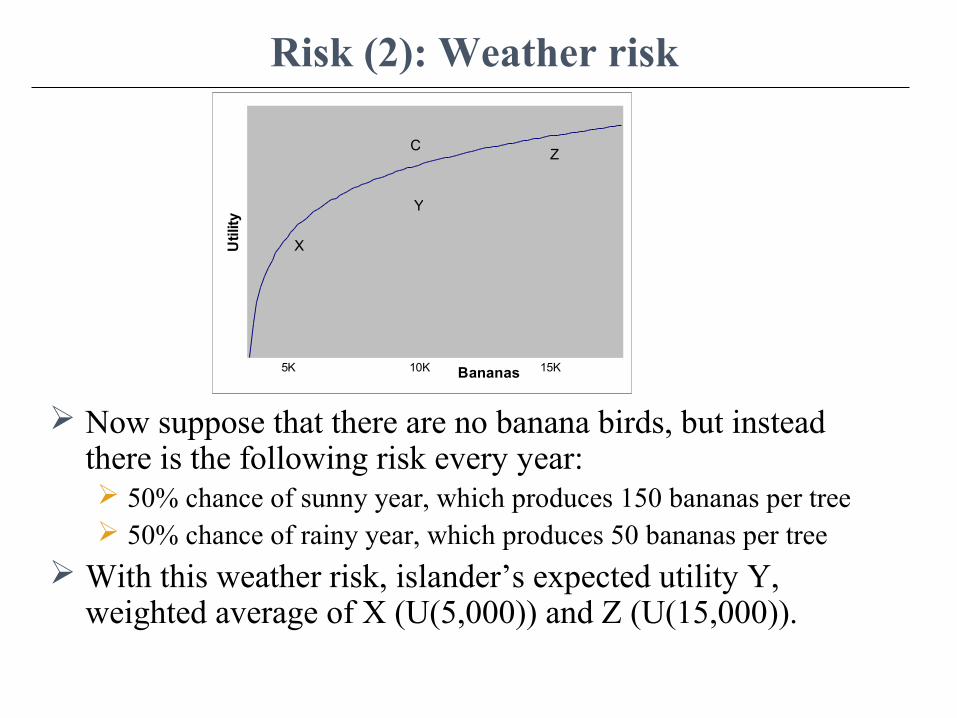
Risk (2): Weather risk
Now suppose that there are no banana birds, but instead there is the following risk every year: 50% chance of sunny year, which produces 150 bananas per tree 50% chance of rainy year, which produces 50 bananas per tree
With this weather risk, islander’s expected utility Y, weighted average of X (U(5,000)) and Z (U(15,000)).
Bananas
Utility
Z
X
C
Y
15K10K5K
Diversifiable and non-diversifiable risk
Weather risk affects the whole economy in a rainy year, so the previous solution would not work. There is perfect covariance among all islands.
Some islanders may agree to sell rights to their bananas in a rainy year for rights to someone else’s bananas in a sunny year. No one would give up 100 bananas in a rainy year for only 100
bananas in a sunny year. To give up bananas in an already rainy year, they would demand a
positive return on the deal. E.g., 50 bananas in a rainy year in return for 150 bananas in a
sunny year. This is analogous to beta risk in CAPM model.
In contrast, with the banana bird risk, nobody would earn extra return by agreeing to bear it, because it was free (as a group) to get rid of it.
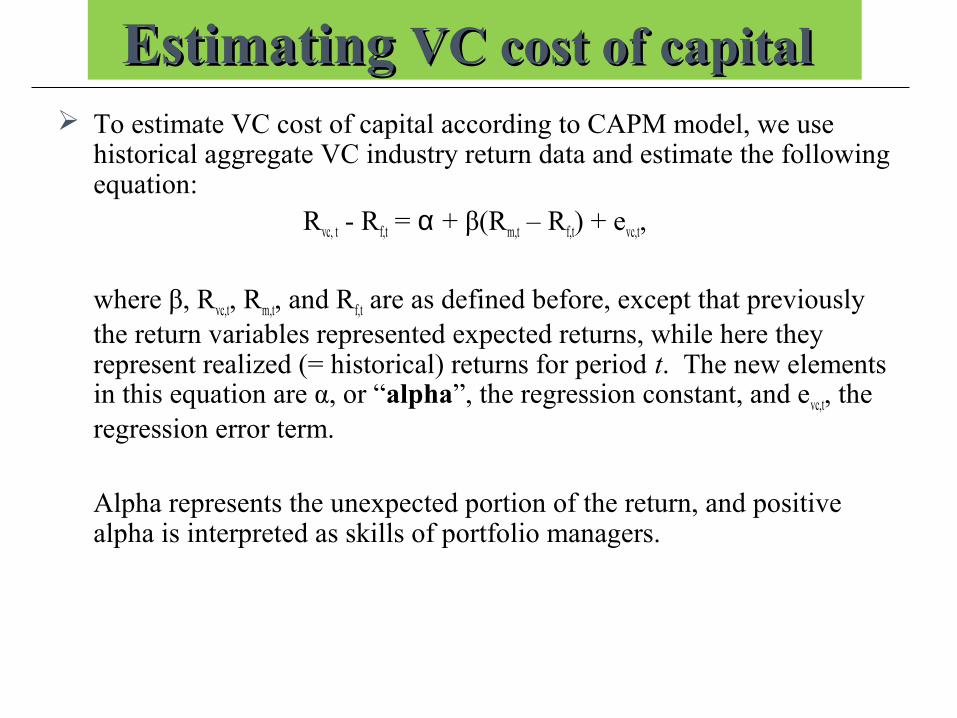
Estimating Estimating VC cost of capitalVC cost of capital To estimate VC cost of capital according to CAPM model, we use
historical aggregate VC industry return data and estimate the following equation:
Rvc, t - Rf,t = α + β(Rm,t – Rf,t) + evc,t,
where β, Rvc,t, Rm,t, and Rf,t are as defined before, except that previously the return variables represented expected returns, while here they represent realized (= historical) returns for period t. The new elements in this equation are α, or “alpha”, the regression constant, and evc,t, the regression error term.
Alpha represents the unexpected portion of the return, and positive alpha is interpreted as skills of portfolio managers.
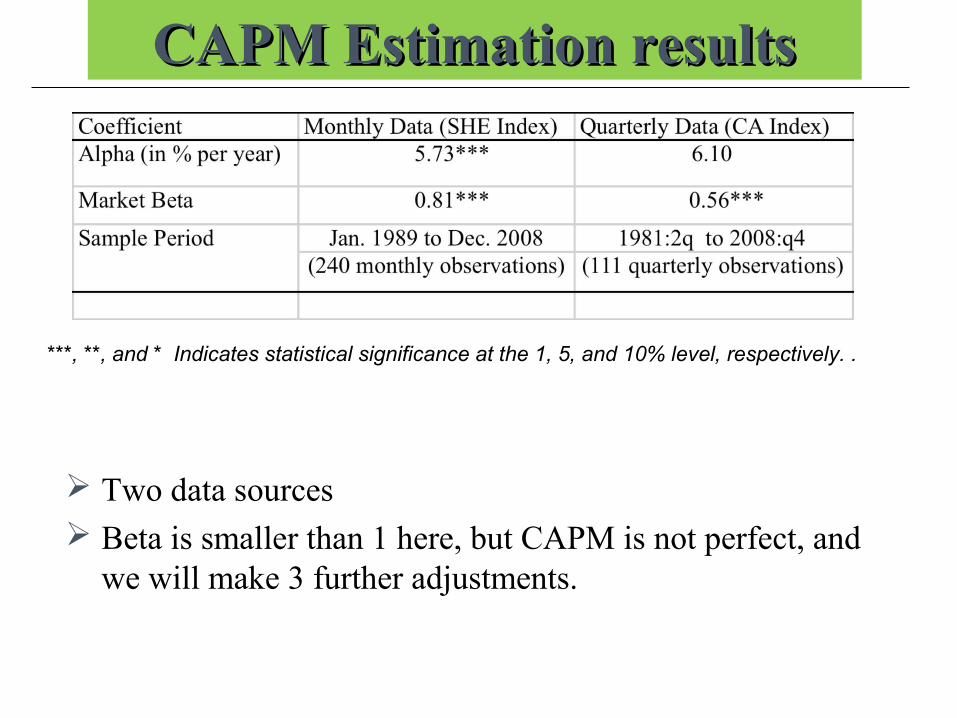
CAPM Estimation resultsCAPM Estimation results
Two data sources Beta is smaller than 1 here, but CAPM is not perfect, and
we will make 3 further adjustments.
***, **, and * Indicates statistical significance at the 1, 5, and 10% level, respectively. .
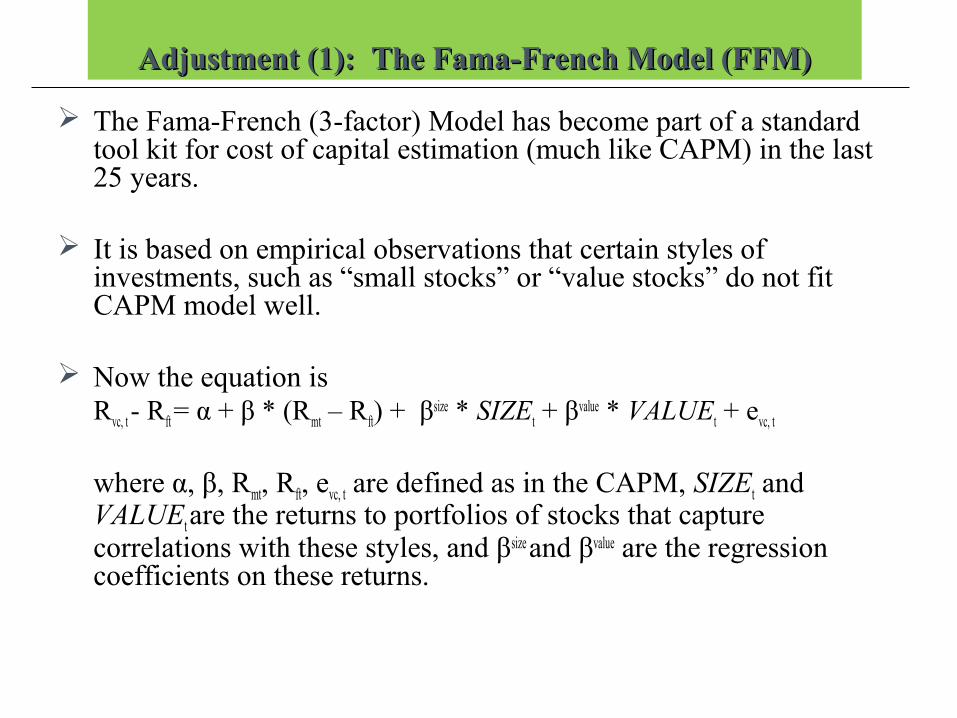
Adjustment (1): The Fama-French Model (FFM)Adjustment (1): The Fama-French Model (FFM)
The Fama-French (3-factor) Model has become part of a standard tool kit for cost of capital estimation (much like CAPM) in the last 25 years.
It is based on empirical observations that certain styles of investments, such as “small stocks” or “value stocks” do not fit CAPM model well.
Now the equation is Rvc, t - Rft = α + β * (Rmt – Rft) + βsize * SIZEt + βvalue * VALUEt + evc, t
where α, β, Rmt, Rft, evc, t are defined as in the CAPM, SIZEt and VALUEt are the returns to portfolios of stocks that capture correlations with these styles, and βsize and βvalue are the regression coefficients on these returns.

Adjustment (2): The Pastor-Stambaugh Model (PSM)Adjustment (2): The Pastor-Stambaugh Model (PSM)
Another relevant issue for VC is that investors may require premium for illiquid investmentspremium for illiquid investments.
The PSM model incorporates this illiquidity risk illiquidity risk as the additional factor to the Fama-French 3-factor model.
The equation isRvc, t - Rft = α + β * (Rmt – Rft) + βsize * SIZEt +
βvalue * VALUEt + βliq * LIQt + evc, t
where LIQ is the new liquidity factor, βliq is its regression coefficient, and all other variables are as defined before.
More sensitive the return on an asset is to the change in this liquidity factor, the higher premium the investors demand when liquidity factor return is high in the economy.
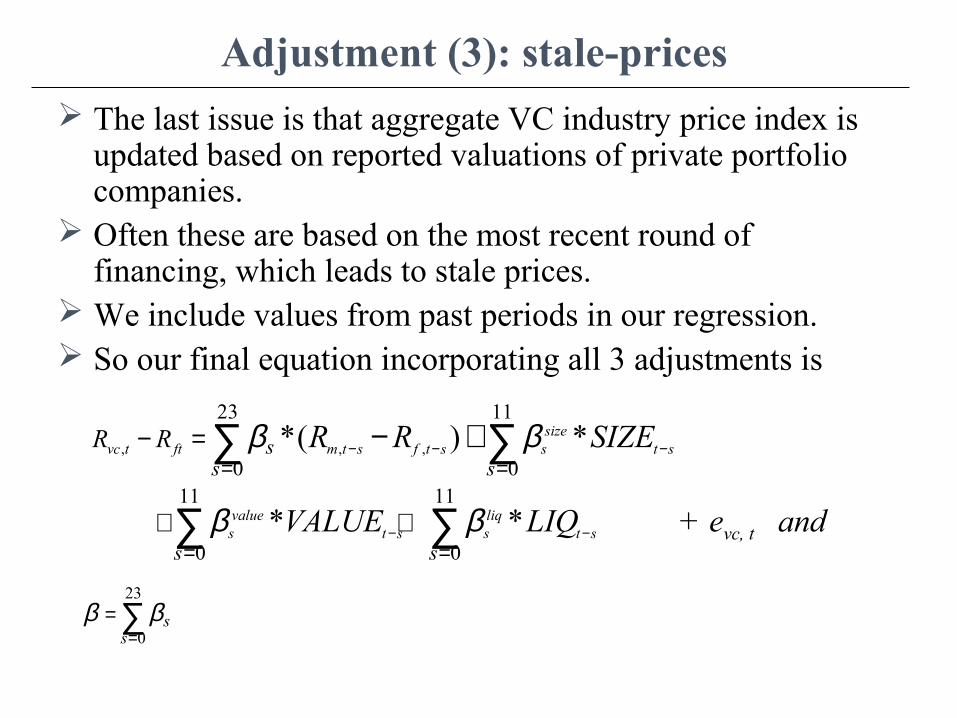
Adjustment (3): stale-prices
The last issue is that aggregate VC industry price index is updated based on reported valuations of private portfolio companies.
Often these are based on the most recent round of financing, which leads to stale prices.
We include values from past periods in our regression. So our final equation incorporating all 3 adjustments is
, , ,
23 11
0 011 11
0 0
*( ) *
* *
sizevc t ft m t s f t s s t s
value liqs t s s t s
ss s
s s
R R R R SIZE
VALUE LIQ
β β
β β
− − −
− −
= =
= =
− =
+ +
− +∑ ∑
∑ ∑23
0s
sβ β
== ∑
+ evc, t and
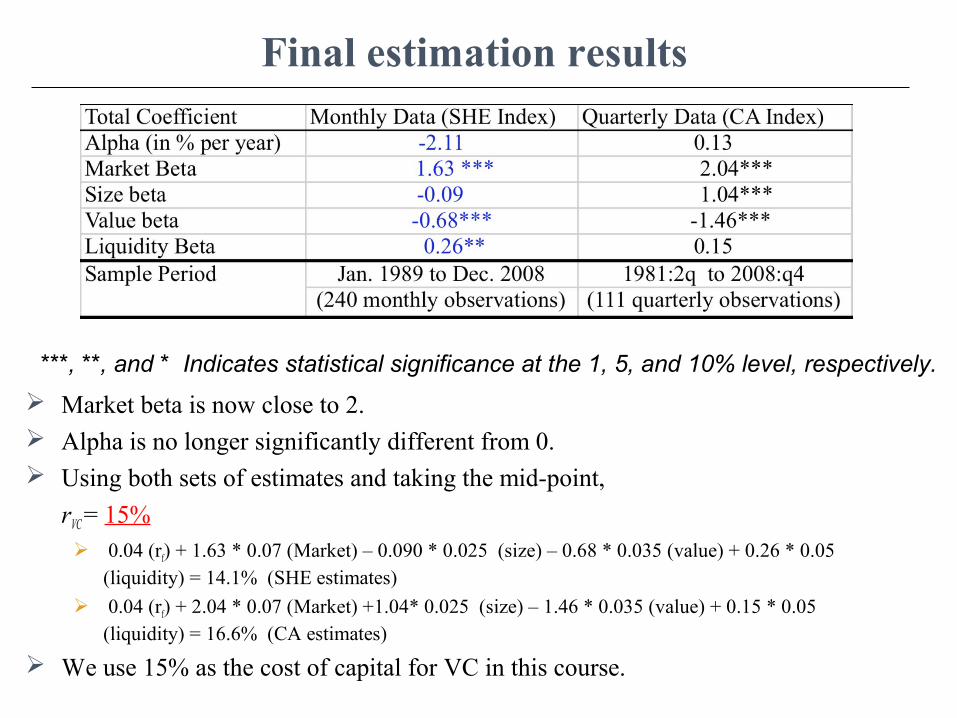
Final estimation results
Market beta is now close to 2. Alpha is no longer significantly different from 0. Using both sets of estimates and taking the mid-point,
rVC = 15% 0.04 (rf) + 1.63 * 0.07 (Market) – 0.090 * 0.025 (size) – 0.68 * 0.035 (value) + 0.26 * 0.05
(liquidity) = 14.1% (SHE estimates)
0.04 (rf) + 2.04 * 0.07 (Market) +1.04* 0.025 (size) – 1.46 * 0.035 (value) + 0.15 * 0.05 (liquidity) = 16.6% (CA estimates)
We use 15% as the cost of capital for VC in this course.
***, **, and * Indicates statistical significance at the 1, 5, and 10% level, respectively.
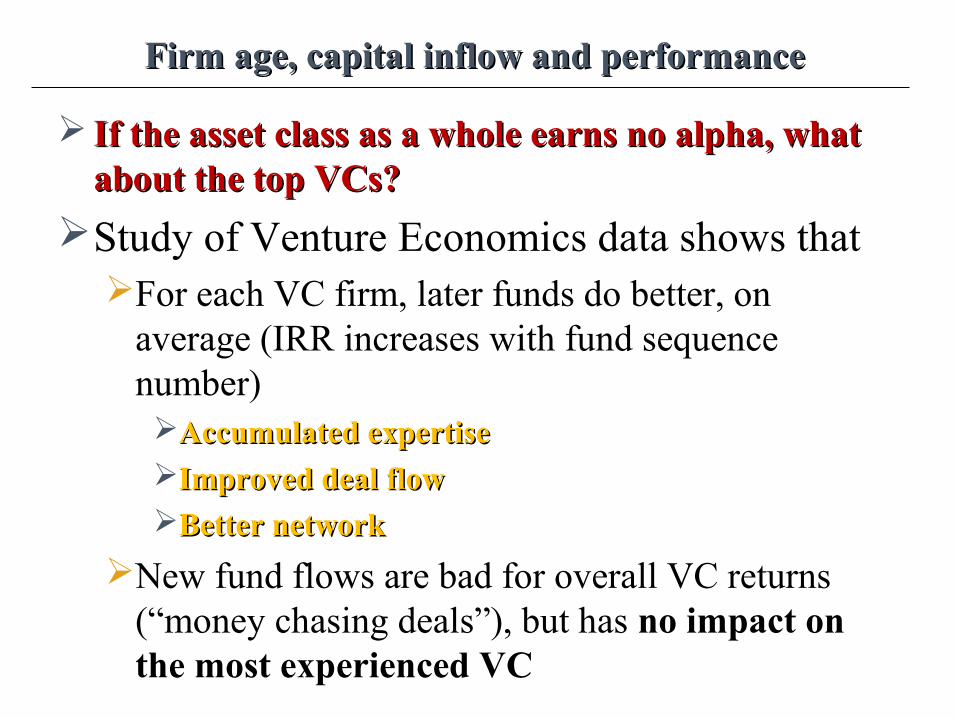
Firm age, capital inflow and performanceFirm age, capital inflow and performance
If the asset class as a whole earns no alpha, what If the asset class as a whole earns no alpha, what about the top VCs? about the top VCs?
Study of Venture Economics data shows thatFor each VC firm, later funds do better, on
average (IRR increases with fund sequence number)Accumulated expertiseAccumulated expertiseImproved deal flowImproved deal flowBetter networkBetter network
New fund flows are bad for overall VC returns (“money chasing deals”), but has no impact on the most experienced VC
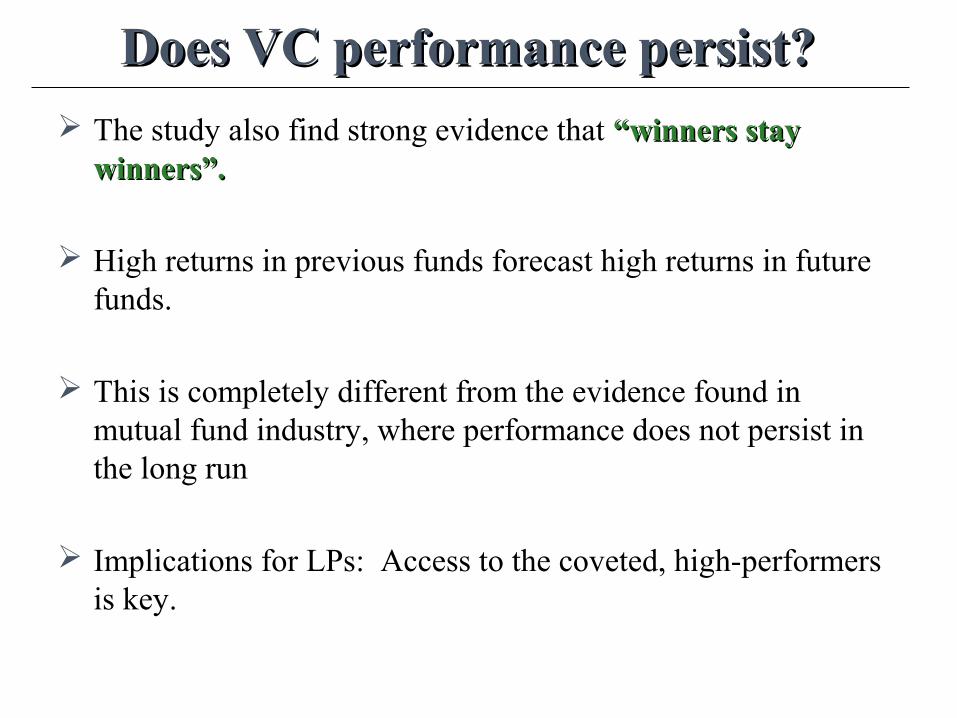
Does VC performance persist? Does VC performance persist? The study also find strong evidence that “winners stay “winners stay
winners”.winners”.
High returns in previous funds forecast high returns in future funds.
This is completely different from the evidence found in mutual fund industry, where performance does not persist in the long run
Implications for LPs: Access to the coveted, high-performers is key.
Cost of capital for international VC Cost of capital for international VC
What cost of capital should (big, What cost of capital should (big, diversified) diversified) investorsinvestors expect to expect to earn from investing in earn from investing in international VC? international VC? Again, not Again, not entrepreneursentrepreneurs Not Not venture capitalistsventure capitalists
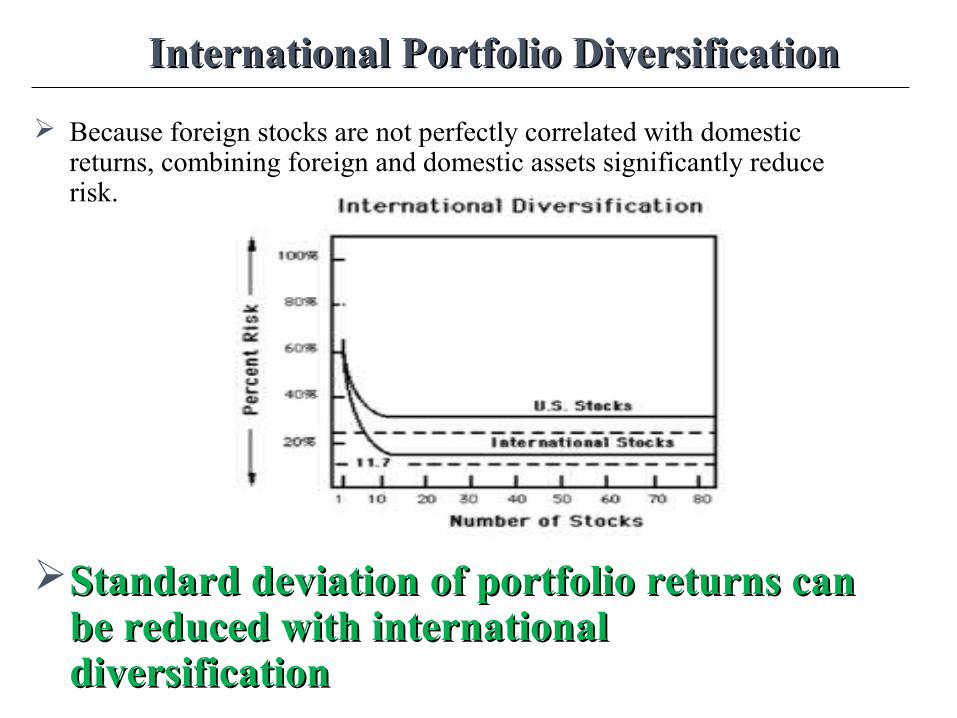
International Portfolio DiversificationInternational Portfolio Diversification
Because foreign stocks are not perfectly correlated with domestic returns, combining foreign and domestic assets significantly reduce risk.
Standard deviation of portfolio returns can Standard deviation of portfolio returns can be reduced with international be reduced with international diversificationdiversification
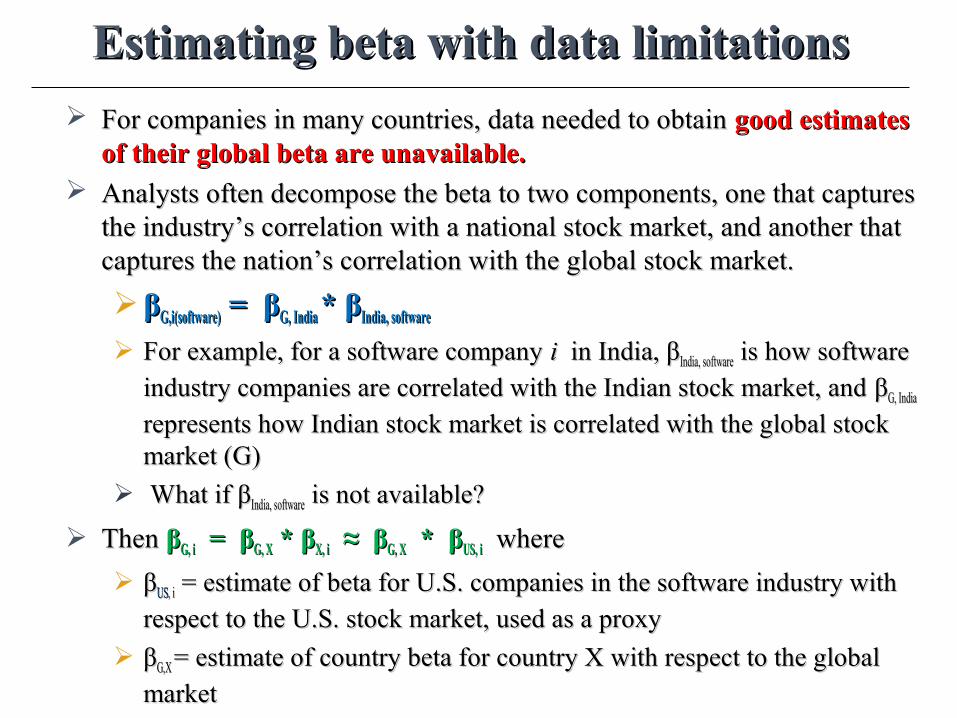
Estimating beta with data limitationsEstimating beta with data limitations
For companies in many countries, data needed to obtain For companies in many countries, data needed to obtain good estimates good estimates of their global beta are unavailable.of their global beta are unavailable.
Analysts often decompose the beta to two components, one that captures Analysts often decompose the beta to two components, one that captures the industry’s correlation with a national stock market, and another that the industry’s correlation with a national stock market, and another that captures the nation’s correlation with the global stock market. captures the nation’s correlation with the global stock market.
ββG,i(software)G,i(software) = = ββG, India G, India * * ββIndia, softwareIndia, software
For example, for a software company For example, for a software company i i in India, βin India, βIndia, softwareIndia, software is how software is how software
industry companies are correlated with the Indian stock market, and industry companies are correlated with the Indian stock market, and ββG, IndiaG, India
represents how Indian stock market is correlated with the global stock represents how Indian stock market is correlated with the global stock market (G)market (G)
What if βWhat if βIndia, softwareIndia, software is not available? is not available?
Then Then ββG, iG, i = = ββG, XG, X * * ββX, iX, i ≈ ≈ ββG, XG, X * * ββUS, iUS, i wherewhere
ββUSUS, i, i = estimate of beta for U.S. companies in the software industry with = estimate of beta for U.S. companies in the software industry with
respect to the U.S. stock market, used as a proxyrespect to the U.S. stock market, used as a proxy
ββG,X G,X = estimate of country beta for country X with respect to the global = estimate of country beta for country X with respect to the global
market market
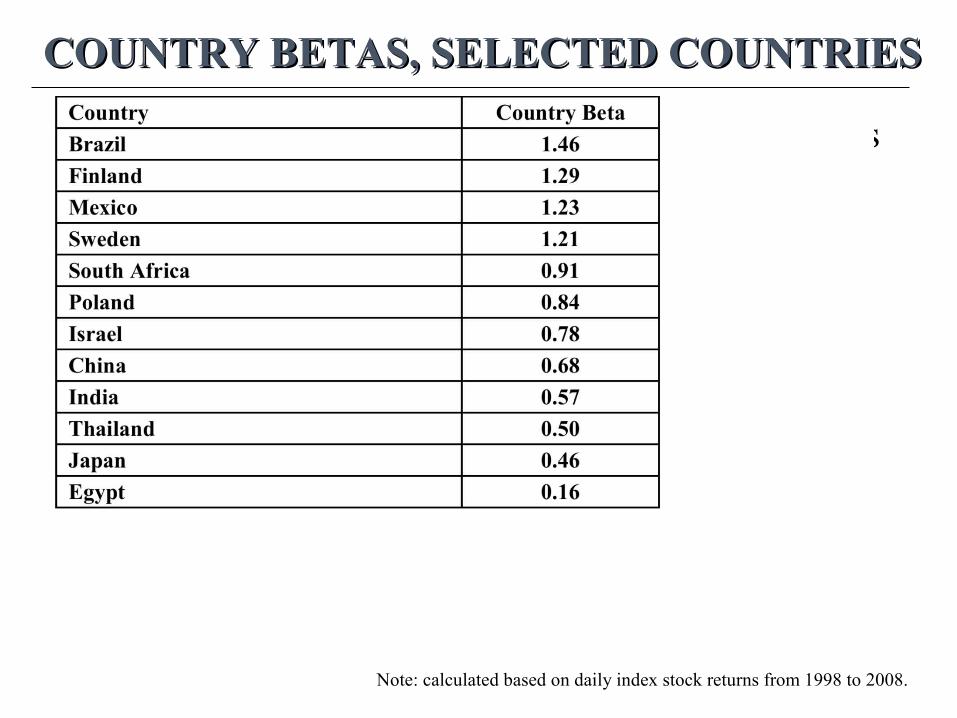
COUNTRY BETAS, SELECTED COUNTRIESCOUNTRY BETAS, SELECTED COUNTRIES
Note: calculated based on daily index stock returns from 1998 to 2008.
Note: calculated based on daily index stock returns from 1998 to 2008.
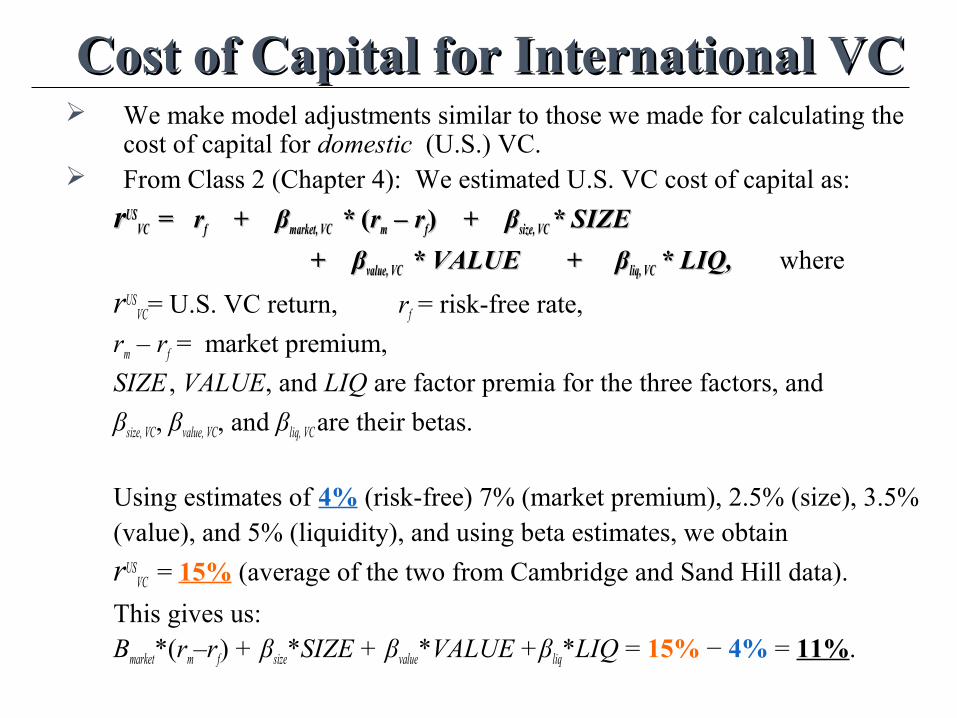
Cost of Capital for International VCCost of Capital for International VC We make model adjustments similar to those we made for calculating the
cost of capital for domestic (U.S.) VC. From Class 2 (Chapter 4): We estimated U.S. VC cost of capital as:
rrUSUSVCVC = = rrff + β + βmarketmarket, VC , VC * * ((rrmm – r – rff)) + β + βsizesize, VC , VC * SIZE* SIZE
+ β+ βvaluevalue, VC , VC * VALUE + β * VALUE + β liqliq, VC , VC * LIQ, * LIQ, where
rUSVC= U.S. VC return, rf = risk-free rate,
rm – rf = market premium,
SIZE , VALUE, and LIQ are factor premia for the three factors, and
βsize, VC, βvalue, VC, and βliq, VC are their betas.
Using estimates of 4% (risk-free) 7% (market premium), 2.5% (size), 3.5% (value), and 5% (liquidity), and using beta estimates, we obtain
rUSVC = 15% (average of the two from Cambridge and Sand Hill data).
This gives us: Βmarket*(rm–rf) + βsize*SIZE + βvalue*VALUE +βliq*LIQ = 15% − 4% = 11%.
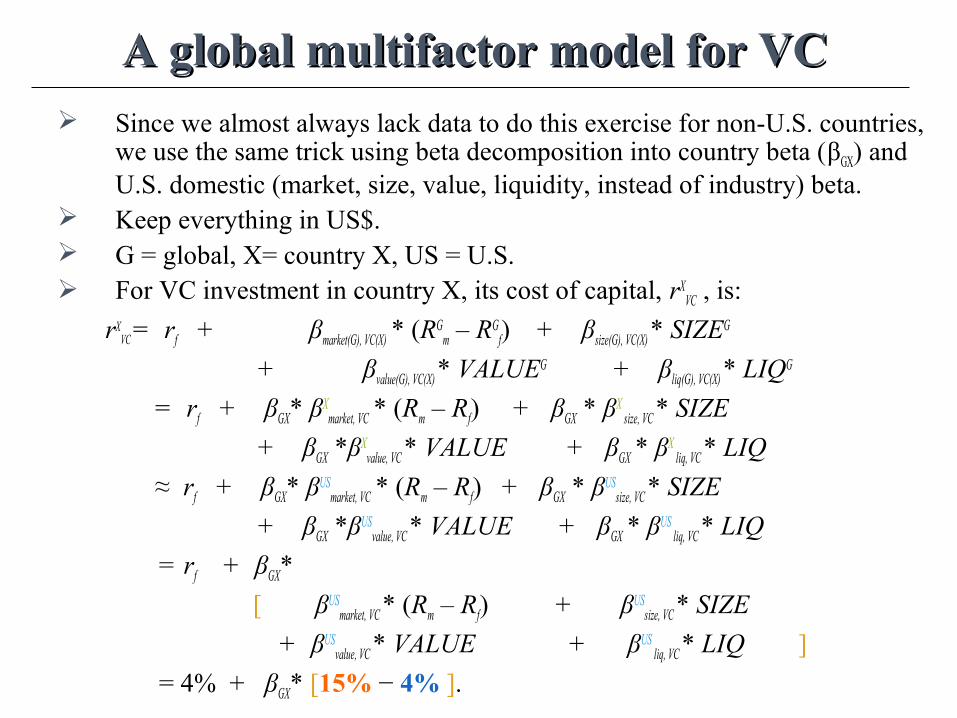
A global multifactor model for VCA global multifactor model for VC Since we almost always lack data to do this exercise for non-U.S. countries,
we use the same trick using beta decomposition into country beta (βGX) and U.S. domestic (market, size, value, liquidity, instead of industry) beta.
Keep everything in US$. G = global, X= country X, US = U.S. For VC investment in country X, its cost of capital, rX
VC , is:
rXVC = rf + βmarket(G), VC(X) * (RG
m – RGf) + βsize(G), VC(X) * SIZEG
+ βvalue(G), VC(X) * VALUEG + βliq(G), VC(X) * LIQG
= rf + βGX* βXmarket, VC * (Rm – Rf) + βGX * βX
size, VC * SIZE
+ βGX *βXvalue, VC * VALUE + βGX * βX
liq, VC * LIQ
≈ rf + βGX* βUSmarket, VC * (Rm – Rf) + βGX * βUS
size, VC * SIZE
+ βGX *βUSvalue, VC * VALUE + βGX * βUS
liq, VC * LIQ
= rf + βGX*
[ βUSmarket, VC * (Rm – Rf) + βUS
size, VC * SIZE
+ βUSvalue, VC * VALUE + βUS
liq, VC * LIQ ]
= 4% + βGX* [15% − 4% ].
Objections and extensionsStyle effects
Currency risk
Country risk
Segmented markets
CASE II : YAHOO 1995
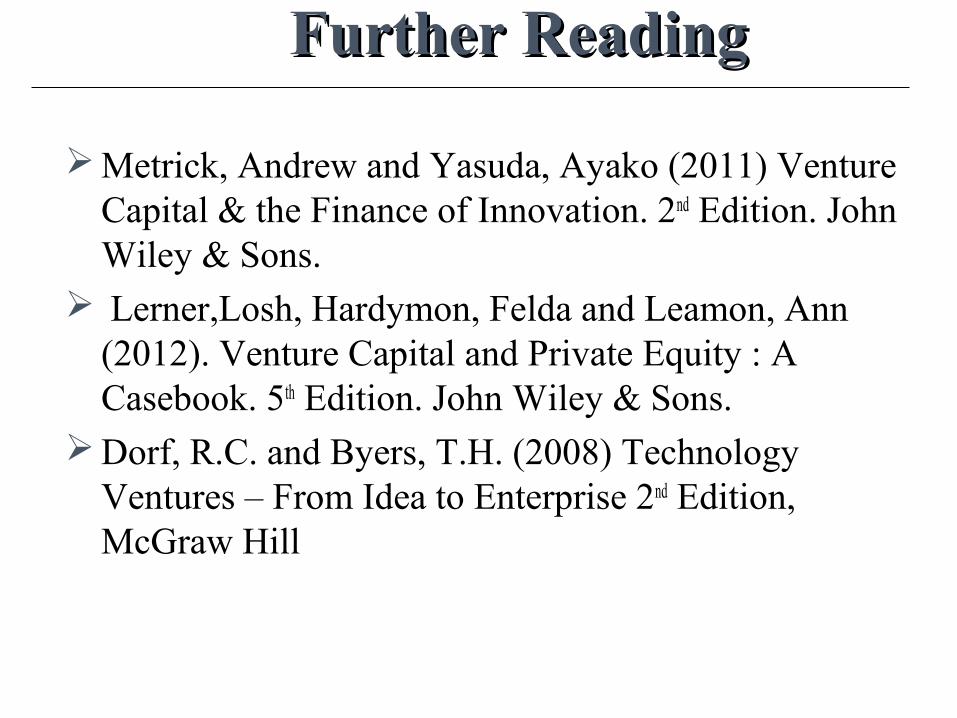
Further ReadingFurther Reading
Metrick, Andrew and Yasuda, Ayako (2011) Venture Capital & the Finance of Innovation. 2nd Edition. John Wiley & Sons.
Lerner,Losh, Hardymon, Felda and Leamon, Ann (2012). Venture Capital and Private Equity : A Casebook. 5th Edition. John Wiley & Sons.
Dorf, R.C. and Byers, T.H. (2008) Technology Ventures – From Idea to Enterprise 2nd Edition, McGraw Hill
QUESTIONS?