


Gs presentation-books-in-room-(final).-pptx
20
NASDAQ: RGLD Goldman Sachs Global Metals and Mining Conference Stefan Wenger CFO and Treasurer November 29, 2017
-
Upload
royalgold -
Category
Investor Relations
-
view
1.439 -
download
0
Transcript of Gs presentation-books-in-room-(final).-pptx

NASDAQ: RGLD
Goldman Sachs Global Metalsand Mining Conference
Stefan WengerCFO and TreasurerNovember 29, 2017
NASDAQ: RGLD
|
Cautionary Statement
2
This presentation contains certain forward-looking statements within the meaning of the Private Securities Litigation Reform Act of1995. Such forward-looking statements involve known and unknown risks, uncertainties, and other factors that could cause actualresults to differ materially from the projections and estimates contained herein and include, but are not limited to: statementsconcerning cash flow generation, and operating cash flow growth in Q1 FY18 building on record fiscal year 2017 performance; quicklydelevering; embedded growth and sequential growth catalysts and estimated production at Rainy River, Cortez Crossroads andPeñasquito Pyrite Leach in calendar 2017 and 2018; diverse portfolio; strong margins; lean structure; strategic capital allocation andstrong net revenue on capital deployed, with significant mine life remaining; equity stewardship; dividend returns and historic andcurrent compounded annual growth rate in dividends per share, annual yield and operating cash flow yield; focus on total shareholderreturn; ability of Rainy River project to complete main tailings storage facility and ramp-up to capacity; expected start-up date forCortez Crossroads; expected accelerated start-up date for and estimated production from the Pyrite Leach project; estimatedproduction at each of Rainy River, Cortez Crossroads and the Pyrite Leach project; mine life and reserves estimates and forecasts ofthroughput, recoveries and production from the operators of our stream and royalty interests; and lack of additional fundingrequirements. Factors that could cause actual results to differ materially from these forward-looking statements include, amongothers: the risks inherent in the operation of mining properties; a decreased price environment for gold and other metals on whichour stream and royalty interests are determined; performance of and production at properties, and variation of actual productionfrom the production estimates and forecasts made by the operators of those stream and royalty properties; decisions and activities ofthe Company’s management affecting margins, use of capital and changes in strategy; unexpected operating costs, decisions andactivities of the operators of the Company’s stream and royalty properties; changes in operators’ mining and processing techniques orstream or royalty calculation methodologies; resolution of regulatory and legal proceedings; unanticipated grade, geological,metallurgical, environmental, processing or other problems at the properties; revisions or inaccuracies in technical reports, reserve,resources and production estimates; changes in project parameters as plans of the operators are refined; the results of current orplanned exploration activities; errors or disputes in calculating stream deliveries and royalty payments, or deliveries or paymentsunder stream or royalty agreements; the liquidity and future financial needs of the Company; economic and market conditions; theimpact of future acquisitions and stream and royalty financing transactions; the impact of issuances of additional common stock; andrisks associated with conducting business in foreign countries, including application of foreign laws to contract and other disputes,environmental laws, enforcement and uncertain political and economic environments. These risks and other factors are discussed inmore detail in the Company’s public filings with the Securities and Exchange Commission. Statements made herein are as of the datehereof and should not be relied upon as of any subsequent date. The Company’s past performance is not necessarily indicative of itsfuture performance. The Company disclaims any obligation to update any forward-looking statements.Third-party information: Certain information provided in this presentation has been provided to the Company by the operators ofproperties subject to our stream and royalty interests, or is publicly available information filed by these operators with applicablesecurities regulatory bodies, including the Securities and Exchange Commission. The Company has not verified, and is not in a positionto verify, and expressly disclaims any responsibility for the accuracy, completeness or fairness of such third-party information andrefers readers to the public reports filed by the operators for information regarding those properties.

NASDAQ: RGLD
|
DisciplineEfficiency
20+ Year Track Record
Cash flow generationQuickly deleveringEmbedded growth
Diverse portfolio Strong marginsLean structure
Strategic capital allocation Equity stewardshipDividend returns
3
Performance
NASDAQ: RGLD
|
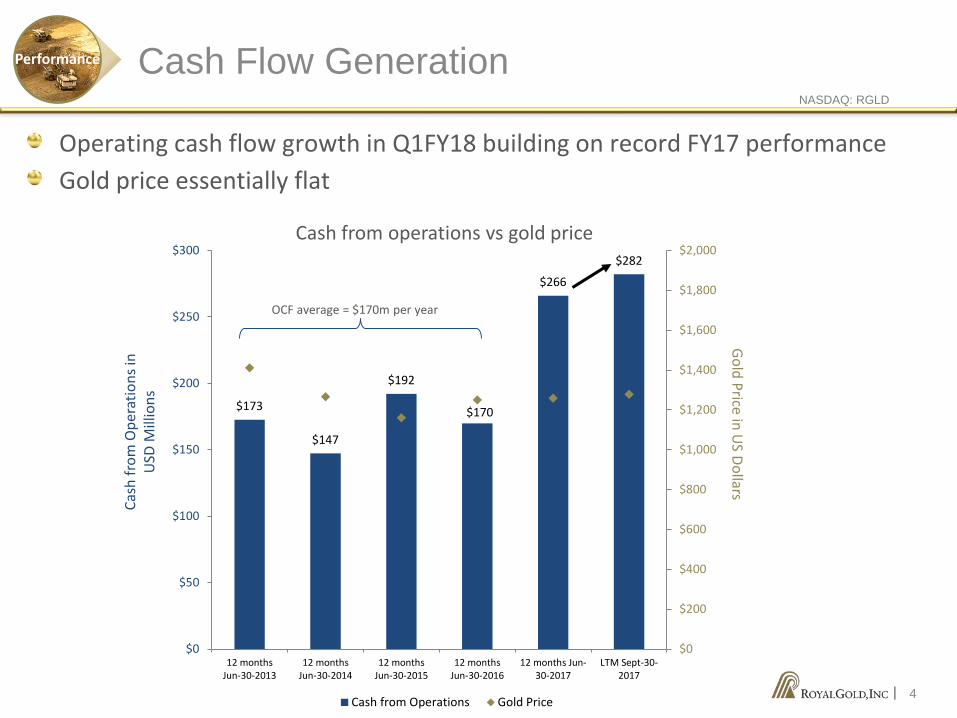
Operating cash flow growth in Q1FY18 building on record FY17 performanceGold price essentially flat
Cash Flow GenerationPerformance
4
$173
$147
$192
$170
$266
$282
$0
$200
$400
$600
$800
$1,000
$1,200
$1,400
$1,600
$1,800
$2,000
$0
$50
$100
$150
$200
$250
$300
12 monthsJun-30-2013
12 monthsJun-30-2014
12 monthsJun-30-2015
12 monthsJun-30-2016
12 months Jun-30-2017
LTM Sept-30-2017
Cash from Operations Gold Price
OCF average = $170m per year
Gold Price in US Dollars
Cash
from
Ope
ratio
ns in
U
SD M
illio
ns
Cash from operations vs gold price
NASDAQ: RGLD
|
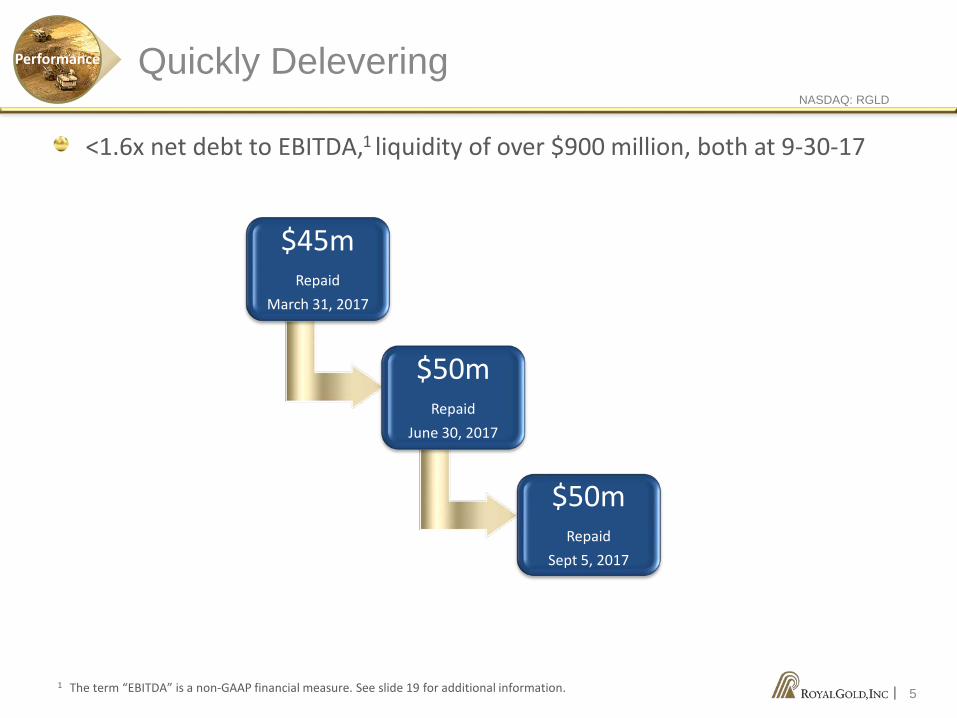
$45mRepaid
March 31, 2017
$50mRepaid
June 30, 2017
$50mRepaid
Sept 5, 2017
Quickly DeleveringPerformance
5
<1.6x net debt to EBITDA,1 liquidity of over $900 million, both at 9-30-17
1 The term “EBITDA” is a non-GAAP financial measure. See slide 19 for additional information.
NASDAQ: RGLD
|
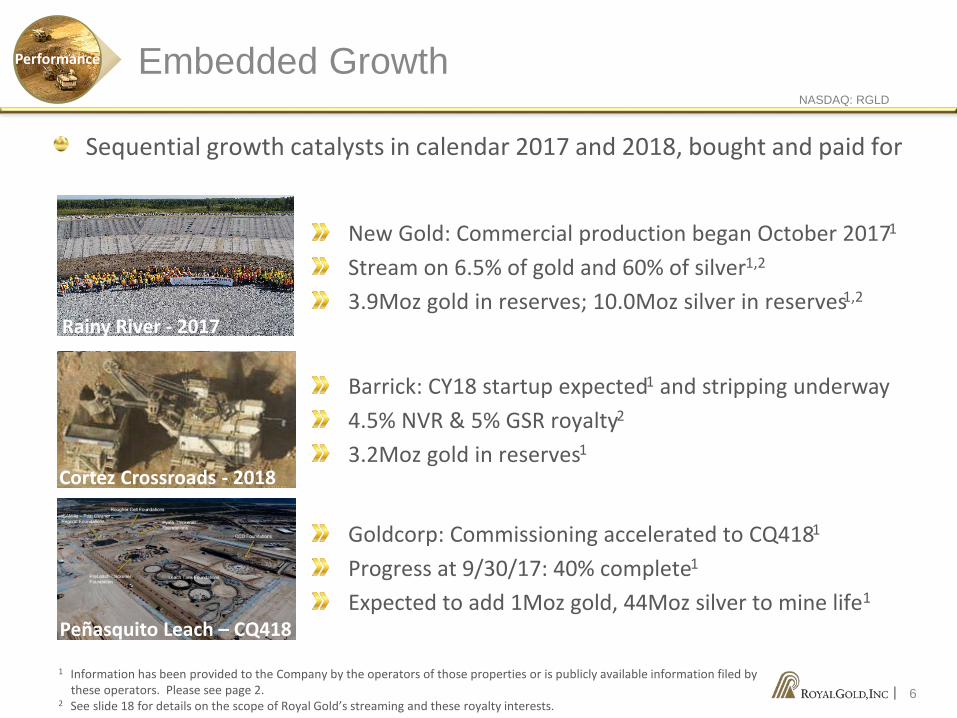
Sequential growth catalysts in calendar 2017 and 2018, bought and paid for
Rainy River - 2017
1 Information has been provided to the Company by the operators of those properties or is publicly available information filed bythese operators. Please see page 2.
2 See slide 18 for details on the scope of Royal Gold’s streaming and these royalty interests.
Rainy River - 2017
Embedded Growth
Rainy River - 2017
New Gold: Commercial production began October 20171
Stream on 6.5% of gold and 60% of silver1,2
3.9Moz gold in reserves; 10.0Moz silver in reserves1,2
Rainy River - 2017
Performance
6
Cortez Crossroads - 2018
Barrick: CY18 startup expected1 and stripping underway 4.5% NVR & 5% GSR royalty2
3.2Moz gold in reserves1
Peñasquito Leach – CQ418
Goldcorp: Commissioning accelerated to CQ4181
Progress at 9/30/17: 40% complete1
Expected to add 1Moz gold, 44Moz silver to mine life1
NASDAQ: RGLD
|
Rainy River - 2017Rainy River - 2017Rainy River - 2017
Performance
7
Cortez Crossroads - 2018
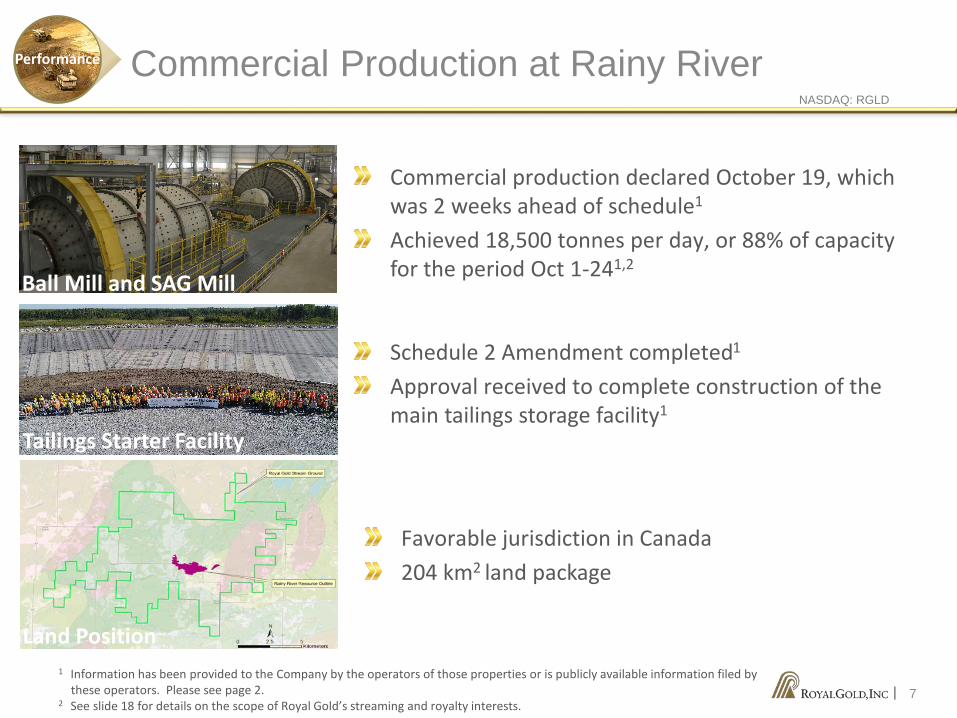
Commercial Production at Rainy River
1 Information has been provided to the Company by the operators of those properties or is publicly available information filed bythese operators. Please see page 2.
2 See slide 18 for details on the scope of Royal Gold’s streaming and royalty interests.
Ball Mill and SAG Mill
Favorable jurisdiction in Canada204 km2 land package
Schedule 2 Amendment completed1
Approval received to complete construction of the main tailings storage facility1
Commercial production declared October 19, which was 2 weeks ahead of schedule1
Achieved 18,500 tonnes per day, or 88% of capacity for the period Oct 1-241,2
Tailings Starter Facility
Land Position
NASDAQ: RGLD
|
Diverse PortfolioEfficiencyEfficiency
8
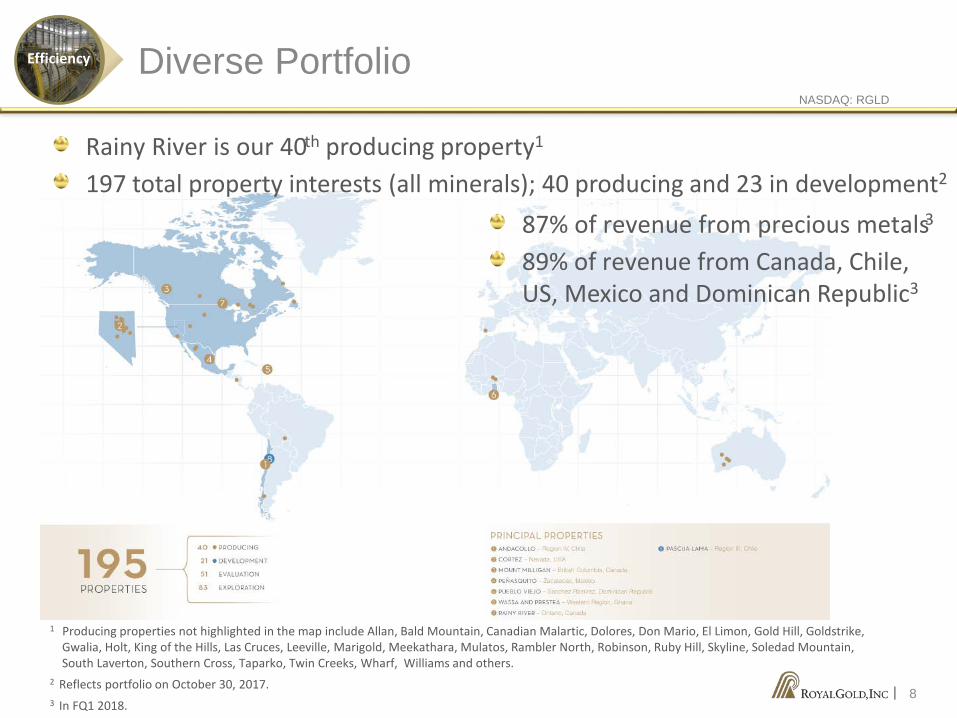
1 Producing properties not highlighted in the map include Allan, Bald Mountain, Canadian Malartic, Dolores, Don Mario, El Limon, Gold Hill, Goldstrike, Gwalia, Holt, King of the Hills, Las Cruces, Leeville, Marigold, Meekathara, Mulatos, Rambler North, Robinson, Ruby Hill, Skyline, Soledad Mountain, South Laverton, Southern Cross, Taparko, Twin Creeks, Wharf, Williams and others.
2 Reflects portfolio on October 30, 2017.3 In FQ1 2018.
Rainy River is our 40th producing property1
197 total property interests (all minerals); 40 producing and 23 in development2
87% of revenue from precious metals3
89% of revenue from Canada, Chile, US, Mexico and Dominican Republic3
NASDAQ: RGLD
|
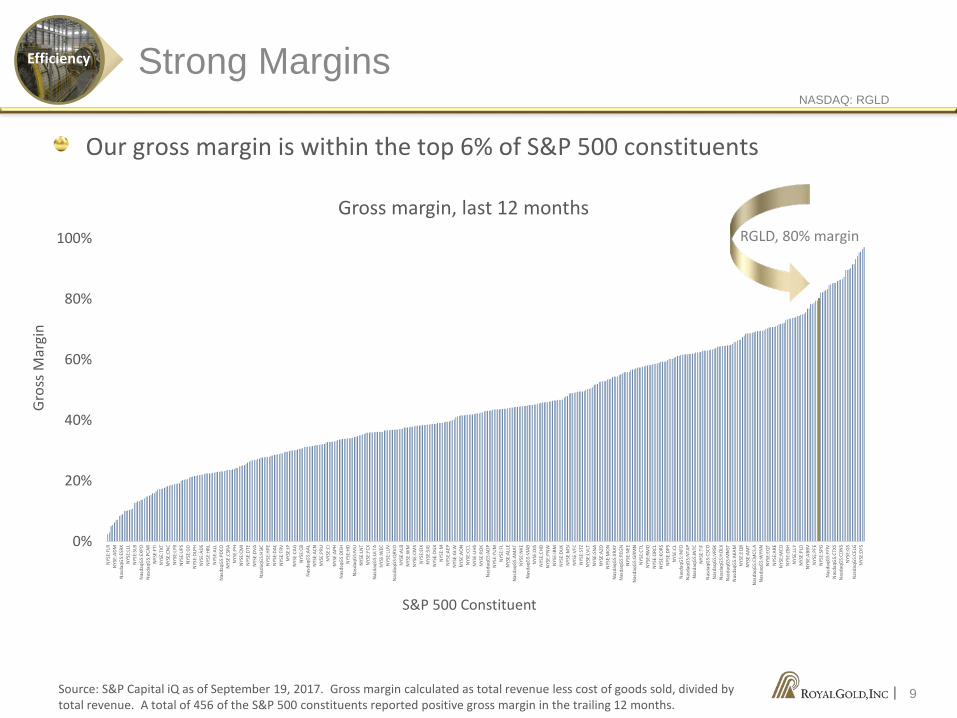
Our gross margin is within the top 6% of S&P 500 constituents
Strong MarginsEfficiency
Source: S&P Capital iQ as of September 19, 2017. Gross margin calculated as total revenue less cost of goods sold, divided by total revenue. A total of 456 of the S&P 500 constituents reported positive gross margin in the trailing 12 months.
9
0%
20%
40%
60%
80%
100%
NYS
E:FL
RN
YSE:
ADM
Nas
daqG
S:ES
RXN
YSE:
LLL
NYS
E:SL
BN
asda
qGS:
EXPD
Nas
daqG
S:PC
ARN
YSE:
FTI
NYS
E:TX
TN
YSE:
CNC
NYS
E:LY
BN
YSE:
UPS
NYS
E:G
DN
YSE:
DLP
HN
YSE:
ADS
NYS
E:H
RLN
YSE:
ALL
Nas
daqG
S:PD
CON
YSE:
CSRA
NYS
E:PH
NYS
E:CM
IN
YSE:
DTE
NYS
E:D
VAN
asda
qGS:
HSI
CN
YSE:
HPE
NYS
E:D
ALN
YSE:
TRV
NYS
E:IP
NYS
E:CA
GN
YSE:
CBN
asda
qGS:
AAL
NYS
E:AC
NN
YSE:
PRU
NYS
E:CI
NYS
E:AP
HN
asda
qGS:
DISH
NYS
E:H
DN
asda
qGS:
MU
NYS
E:LN
TN
YSE:
FCX
Nas
daqG
S:U
LTA
NYS
E:W
ECN
YSE:
LUV
Nas
daqG
S:Q
RVO
NYS
E:AL
BN
YSE:
WM
NYS
E:CM
SN
YSE:
EIX
NYS
E:SI
GN
YSE:
DG
XN
YSE:
MN
YSE:
AEP
NYS
E:G
LWN
YSE:
AON
NYS
E:CC
LN
YSE:
UHS
NYS
E:RO
KN
asda
qGS:
ADP
NYS
E:YU
MN
YSE:
FLN
YSE:
ALLE
Nas
daqG
S:AM
ATN
YSE:
NKE
Nas
daqG
S:VI
ABN
YSE:
DIS
NYS
E:CH
DN
YSE:
PNW
NYS
E:IB
MN
YSE:
DU
KN
YSE:
MSI
NYS
E:VF
CN
YSE:
STZ
NYS
E:LV
LTN
YSE:
SNA
NYS
E:AZ
ON
YSE:
MO
NN
asda
qGS:
XRAY
Nas
daqG
S:RE
GN
NYS
E:N
EEN
asda
qGS:
GRM
NN
YSE:
CTL
NYS
E:RM
DN
YSE:
ORC
LN
YSE:
KORS
NYS
E:D
PSN
YSE:
CLN
asda
qGS:
INFO
Nas
daqG
S:N
TAP
Nas
daqG
S:IN
TCN
YSE:
TIF
Nas
daqG
S:CS
CON
asda
qGS:
VRSK
Nas
daqG
S:H
OLX
Nas
daqG
S:M
NST
Nas
daqG
S:AK
AMN
YSE:
EQR
NYS
E:AM
TN
asda
qGS:
CMCS
.AN
asda
qGS:
WYN
NN
YSE:
EQT
NYS
E:AR
EN
YSE:
MCO
NYS
E:ZB
HN
YSE:
LLY
NYS
E:PL
DN
YSE:
ABBV
NYS
E:PF
EN
YSE:
SPG
Nas
daqG
S:FF
IVN
asda
qGS:
CTXS
Nas
daqG
S:CD
NS
NYS
E:G
SN
asda
qGS:
CELG
NYS
E:D
FS
Gross margin, last 12 months
S&P 500 Constituent
RGLD, 80% margin
Gros
s Mar
gin
NASDAQ: RGLD
|
$0 $10,000,000 $20,000,000NasdaqGS:MAR
NYSE:APHNYSE:UHS
NYSE:MNYSE:LEG
NYSE:OMCNasdaqGS:FAST
NYSE:KSSNYSE:AJG
NasdaqGS:FISVNasdaqGS:IDXXNasdaqGS:INFONasdaqGS:NAVI
NYSE:UTXNYSE:SEE
NYSE:ITNYSE:WFCNYSE:DPS
NYSE:KNYSE:TMO
NYSE:ALKNYSE:JPMNYSE:BACNYSE:CATNYSE:ADSNYSE:UAANYSE:GPNNYSE:TAP
NYSE:AMGNasdaqCM:AMD
NYSE:NINYSE:VNONYSE:BF.BNYSE:PEG
NasdaqGS:PDCONYSE:CHDNYSE:UNHNYSE:AIGNYSE:TRV
NasdaqGS:SNINYSE:HPQ
NasdaqGS:VRSNNYSE:CF
NYSE:PXDNYSE:NRGNYSE:NBLNYSE:DHI
NasdaqGS:CBOENasdaqGS:GILD
NYSE:VTR
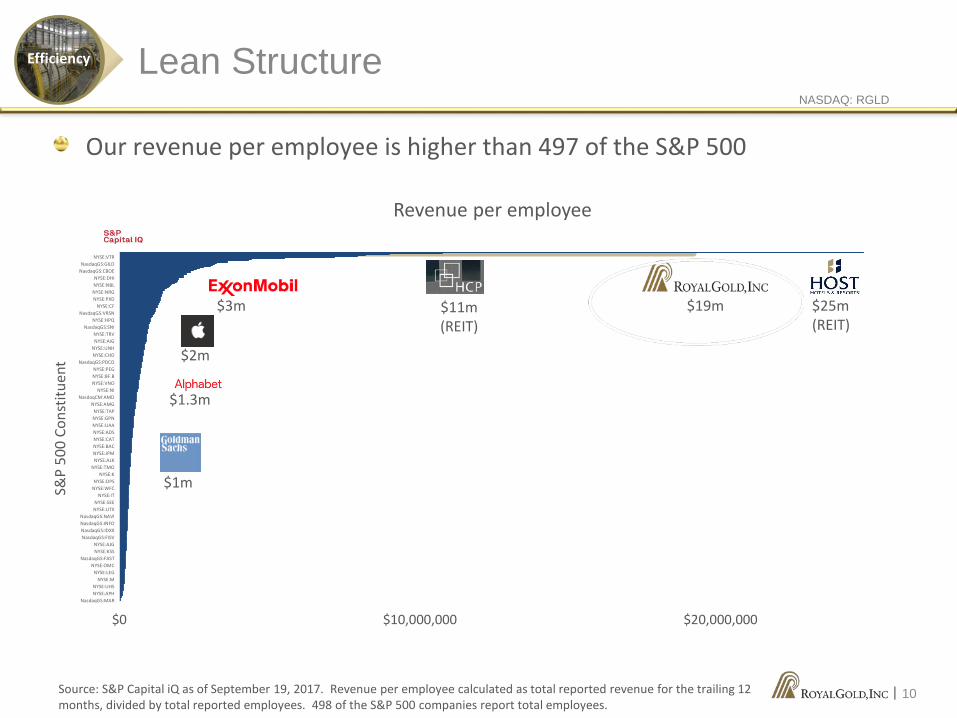
$25m(REIT)
$1m
$1.3m
$3m
$2m
$19m$11m (REIT)
S&P
500
Cons
titue
nt
Revenue per employee
Our revenue per employee is higher than 497 of the S&P 500
Lean StructureEfficiency
Source: S&P Capital iQ as of September 19, 2017. Revenue per employee calculated as total reported revenue for the trailing 12 months, divided by total reported employees. 498 of the S&P 500 companies report total employees.
10
NASDAQ: RGLD
|
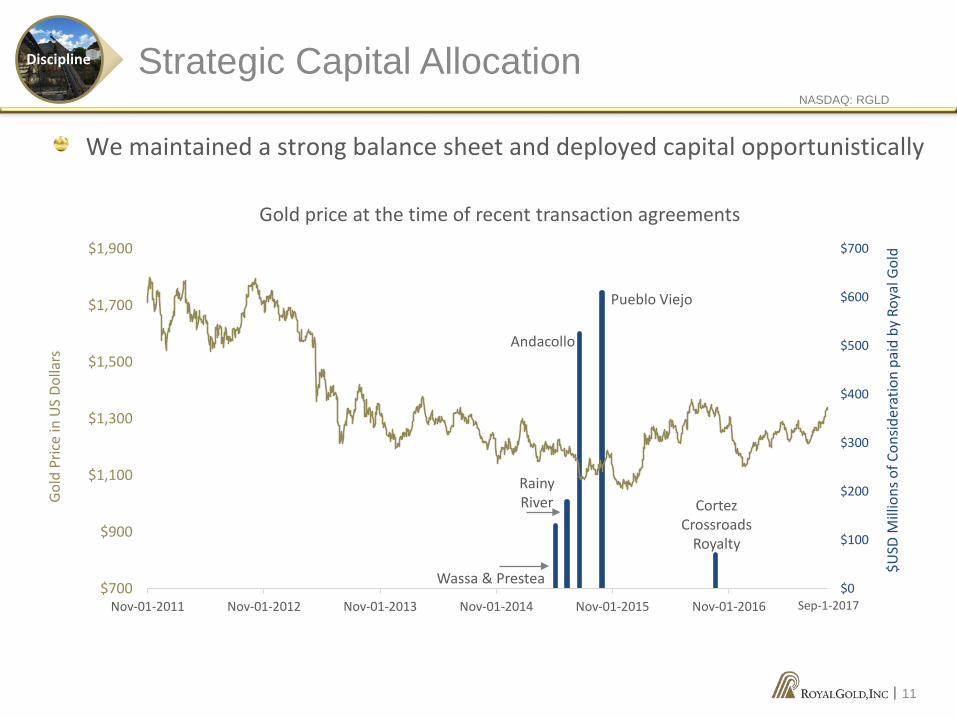
We maintained a strong balance sheet and deployed capital opportunistically
Strategic Capital AllocationDiscipline
11
Rainy River
Cortez Crossroads
Gold price at the time of recent transaction agreements
Gold
Pric
e in
US
Dolla
rs
$0
$100
$200
$300
$400
$500
$600
$700
$700
$900
$1,100
$1,300
$1,500
$1,700
$1,900
Nov-01-2011 Nov-01-2012 Nov-01-2013 Nov-01-2014 Nov-01-2015 Nov-01-2016
$USD
Mill
ions
of C
onsid
erat
ion
paid
by
Roya
l Gol
d
Cortez Crossroads
Royalty
Pueblo Viejo
Wassa & Prestea
Andacollo
RainyRiver
Sep-1-2017
NASDAQ: RGLD
|
-$2,000
-$1,500
-$1,000
-$500
$0
$500
$1,000
$1,500
$2,000
$2,500
$3,000
2015-Q1FY18
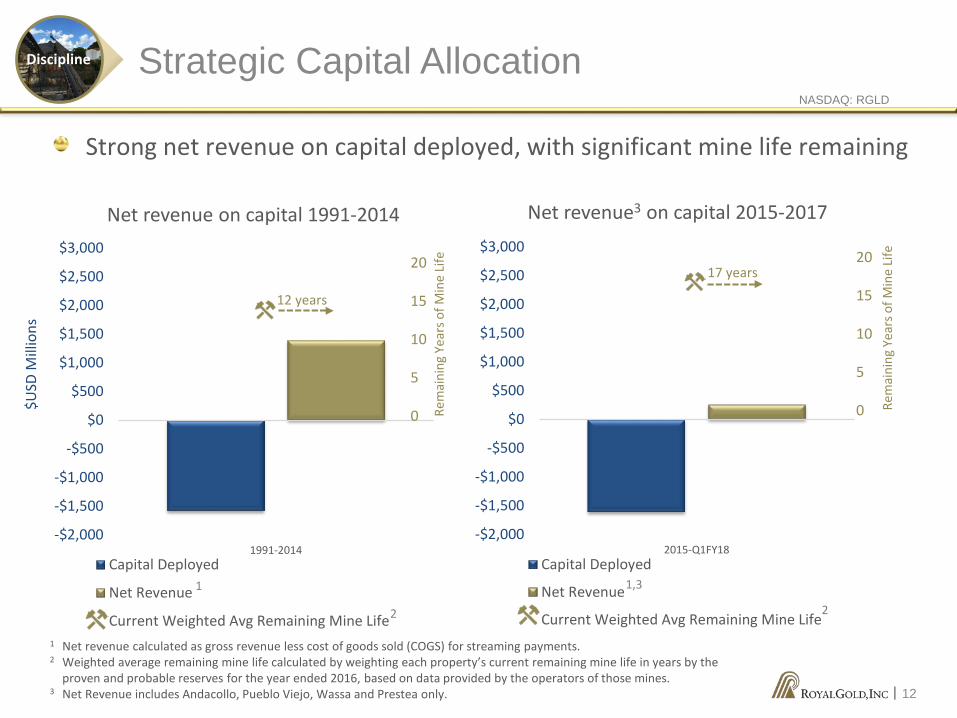
Net revenue3 on capital 2015-2017
Capital Deployed
Net Revenue
Current Weighted Avg Remaining Mine Life
1,3
Rem
aini
ng Y
ears
of M
ine
Life20
15
10
5
0
2
17 years
$USD
Mill
ions
-$2,000
-$1,500
-$1,000
-$500
$0
$500
$1,000
$1,500
$2,000
$2,500
$3,000
1991-2014
Net revenue on capital 1991-2014
Capital Deployed
Net Revenue
Current Weighted Avg Remaining Mine Life
1
2
12 years
20
15
10
5
0 Rem
aini
ng Y
ears
of M
ine
Life
Strong net revenue on capital deployed, with significant mine life remaining
Strategic Capital AllocationDiscipline
12
1 Net revenue calculated as gross revenue less cost of goods sold (COGS) for streaming payments.2 Weighted average remaining mine life calculated by weighting each property’s current remaining mine life in years by the
proven and probable reserves for the year ended 2016, based on data provided by the operators of those mines.3 Net Revenue includes Andacollo, Pueblo Viejo, Wassa and Prestea only.
NASDAQ: RGLD
|
0
200
400
600
800
1,000
1,200
1,400
1,600
1,800
Roya
l Gol
d, In
c.*T
orex
Gol
d Re
sour
ces I
ncEn
deav
our M
inin
g Co
rpor
atio
nRa
ndgo
ld R
esou
rces
Lim
ited
Osis
ko G
old
Roya
lties
Ltd
.*S
SR M
inin
g In
c.Fo
rtun
a Si
lver
Min
es In
c.*P
an A
mer
ican
Silv
er C
orp.
Sand
stor
m G
old
Ltd.
Klon
dex
Min
es L
td.
Firs
t Maj
estic
Silv
er C
orp.
Kirk
land
Lak
e Go
ld L
td.
Guya
na G
oldf
ield
s Inc
.De
tour
Gol
d Co
rpor
atio
nFr
anco
-Nev
ada
Corp
orat
ion
*Coe
ur M
inin
g, In
c.*A
gnic
o Ea
gle
Min
es L
imite
d*C
ompa
ñía
de M
inas
Bue
nave
ntur
a S.
A.A.
Cent
erra
Gol
d In
c.Al
amos
Gol
d In
c.*M
cEw
en M
inin
g In
c.Ta
hoe
Reso
urce
s Inc
.SE
MAF
O In
c.*H
ecla
Min
ing
Com
pany
*Ang
loGo
ld A
shan
ti Li
mite
dW
heat
on P
reci
ous M
etal
s Cor
p.IA
MGO
LD C
orpo
ratio
nHa
rmon
y Go
ld M
inin
g Co
mpa
ny L
imite
dRe
gis R
esou
rces
Lim
ited
St B
arba
ra L
imite
d*N
ewm
ont M
inin
g Co
rpor
atio
nN
ew G
old
Inc.
Inde
pend
ence
Gro
up N
LN
orth
ern
Star
Res
ourc
es L
imite
dO
cean
aGol
d Co
rpor
atio
nEl
dora
do G
old
Corp
orat
ion
Reso
lute
Min
ing
Lim
ited
*New
cres
t Min
ing
Lim
ited
Sara
cen
Min
eral
Hol
ding
s Lim
ited
*Gol
d Fi
elds
Lim
ited
*Gol
dcor
p In
c.Si
bany
e Go
ld L
imite
dYa
man
a Go
ld In
c.B2
Gold
Cor
p.*C
enta
min
Plc
Barr
ick
Gold
Cor
pora
tion
*Kin
ross
Gol
d Co
rpor
atio
nEv
olut
ion
Min
ing
Lim
ited
GDX constituents sorted by shares outstanding
Mill
ions
of S
hare
s Out
stan
ding
at Ju
ne 3
0, 2
017
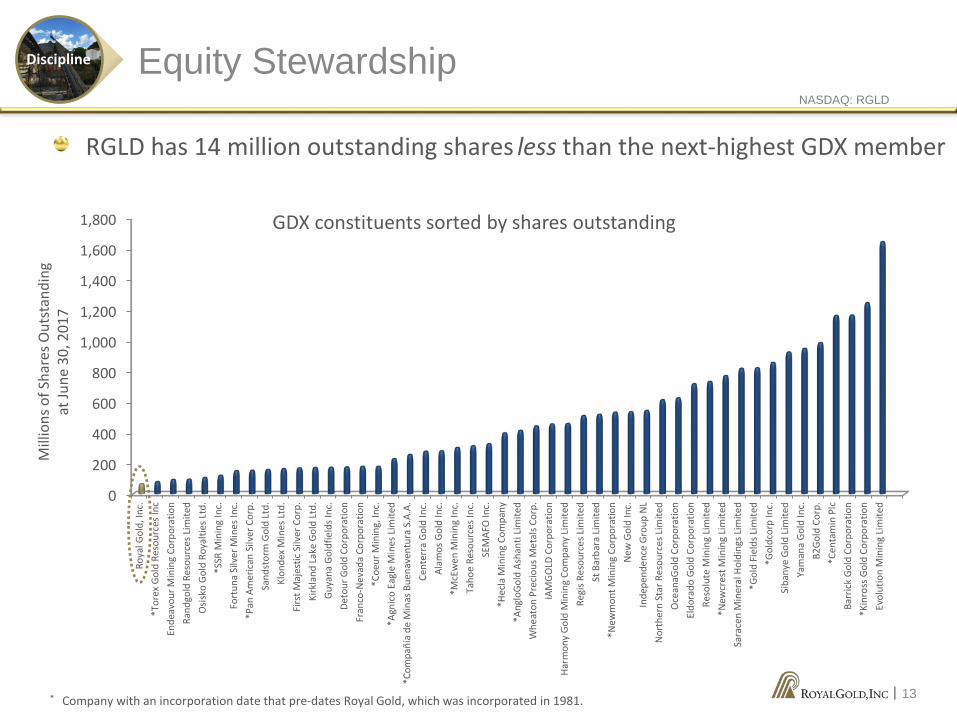
RGLD has 14 million outstanding shares less than the next-highest GDX member
Equity StewardshipDiscipline
13* Company with an incorporation date that pre-dates Royal Gold, which was incorporated in 1981.
NASDAQ: RGLD
|
Rainy River
Cortez Crossroads
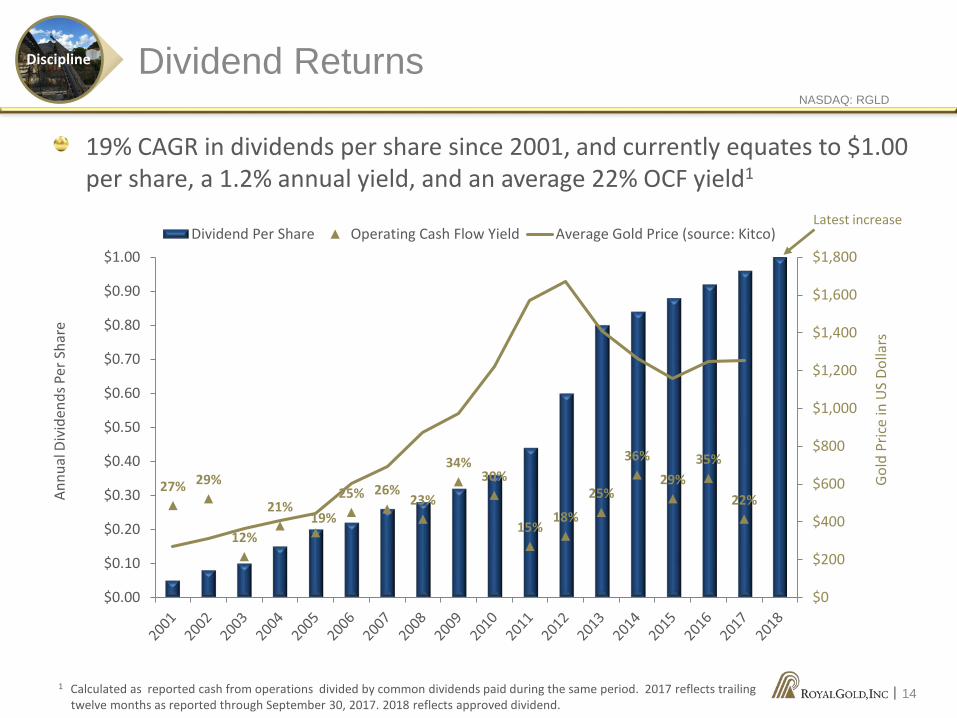
19% CAGR in dividends per share since 2001, and currently equates to $1.00 per share, a 1.2% annual yield, and an average 22% OCF yield1
Dividend ReturnsDiscipline
1 Calculated as reported cash from operations divided by common dividends paid during the same period. 2017 reflects trailingtwelve months as reported through September 30, 2017. 2018 reflects approved dividend.
14
27% 29%
12%
21%19%
25% 26%23%
34%30%
15%18%
25%
36%
29%35%
22%
$0
$200
$400
$600
$800
$1,000
$1,200
$1,400
$1,600
$1,800
$0.00
$0.10
$0.20
$0.30
$0.40
$0.50
$0.60
$0.70
$0.80
$0.90
$1.00Dividend Per Share Operating Cash Flow Yield Average Gold Price (source: Kitco)
Annu
al D
ivid
ends
Per
Sha
re
Gold
Pric
e in
US
Dolla
rs
Latest increase

NASDAQ: RGLD
|
Highly Skilled Board Leadership
Jamie SokalskyIndependent Director;
Former President and CEO, Barrick Gold Corporation
Kevin McArthur Independent Director; Executive Chair, Tahoe
Resources and Former CEO and Director, Goldcorp, Inc.
Tony JensenDirector; President and CEO,
Royal Gold, Inc.
William Hayes Independent Director and Chairman of the
Board; Former EVP, Placer Dome Inc.
Ronald J. Vance Independent Director; Former SVP Corporate Development,
Teck Resources
Christopher M.T. ThompsonIndependent Director; Former Chairman and CEO, Gold Fields
Limited
Sybil VeenmanIndependent Director; Former
Senior Vice President and General Counsel, Barrick Gold Corporation
Discipline
15
NASDAQ: RGLD
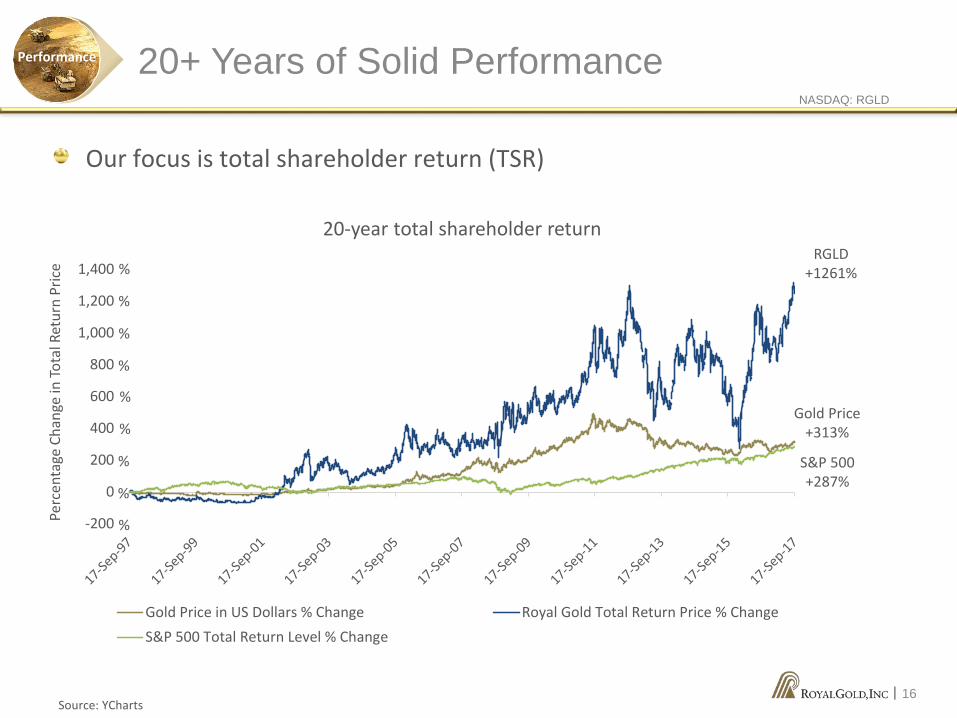
|Source: YCharts
20+ Years of Solid PerformancePerformance
16
-200
0
200
400
600
800
1,000
1,200
1,400
Gold Price in US Dollars % Change Royal Gold Total Return Price % ChangeS&P 500 Total Return Level % Change
RGLD+1261%
S&P 500+287%
Gold Price+313%
%
%
%
%
%
%
%
%
%
20-year total shareholder return
Perc
enta
ge C
hang
e in
Tota
l Ret
urn
Pric
e
Our focus is total shareholder return (TSR)
NASDAQ: RGLD
|
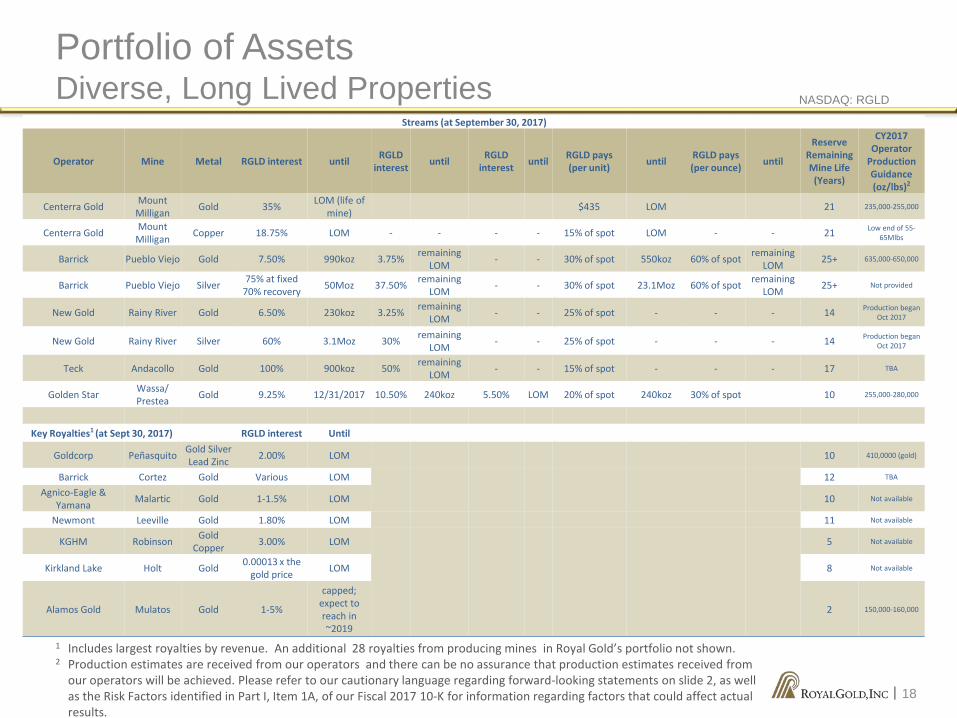
Streams (at September 30, 2017)
Operator Mine Metal RGLD interest until RGLD interest until RGLD
interest until RGLD pays (per unit) until RGLD pays
(per ounce) until
ReserveRemaining Mine Life
(Years)
CY2017Operator
Production Guidance (oz/lbs)2
Centerra Gold Mount Milligan Gold 35% LOM (life of
mine) $435 LOM 21 235,000-255,000
Centerra Gold Mount Milligan Copper 18.75% LOM - - - - 15% of spot LOM - - 21 Low end of 55-
65Mlbs
Barrick Pueblo Viejo Gold 7.50% 990koz 3.75% remaining LOM - - 30% of spot 550koz 60% of spot remaining
LOM 25+ 635,000-650,000
Barrick Pueblo Viejo Silver 75% at fixed 70% recovery 50Moz 37.50% remaining
LOM - - 30% of spot 23.1Moz 60% of spot remaining LOM 25+ Not provided
New Gold Rainy River Gold 6.50% 230koz 3.25% remaining LOM - - 25% of spot - - - 14 Production began
Oct 2017
New Gold Rainy River Silver 60% 3.1Moz 30% remaining LOM - - 25% of spot - - - 14 Production began
Oct 2017
Teck Andacollo Gold 100% 900koz 50% remaining LOM - - 15% of spot - - - 17 TBA
Golden Star Wassa/Prestea Gold 9.25% 12/31/2017 10.50% 240koz 5.50% LOM 20% of spot 240koz 30% of spot 10 255,000-280,000
Key Royalties1 (at Sept 30, 2017) RGLD interest Until
Goldcorp Peñasquito Gold Silver Lead Zinc 2.00% LOM 10 410,0000 (gold)
Barrick Cortez Gold Various LOM 12 TBA
Agnico-Eagle & Yamana Malartic Gold 1-1.5% LOM 10 Not available
Newmont Leeville Gold 1.80% LOM 11 Not available
KGHM Robinson Gold Copper 3.00% LOM 5 Not available
Kirkland Lake Holt Gold 0.00013 x the gold price LOM 8 Not available
Alamos Gold Mulatos Gold 1-5%
capped; expect to reach in ~2019
2 150,000-160,000
Portfolio of AssetsDiverse, Long Lived Properties
1 Includes largest royalties by revenue. An additional 28 royalties from producing mines in Royal Gold’s portfolio not shown. 2 Production estimates are received from our operators and there can be no assurance that production estimates received from
our operators will be achieved. Please refer to our cautionary language regarding forward-looking statements on slide 2, as wellas the Risk Factors identified in Part I, Item 1A, of our Fiscal 2017 10-K for information regarding factors that could affect actualresults.
18
NASDAQ: RGLD
|
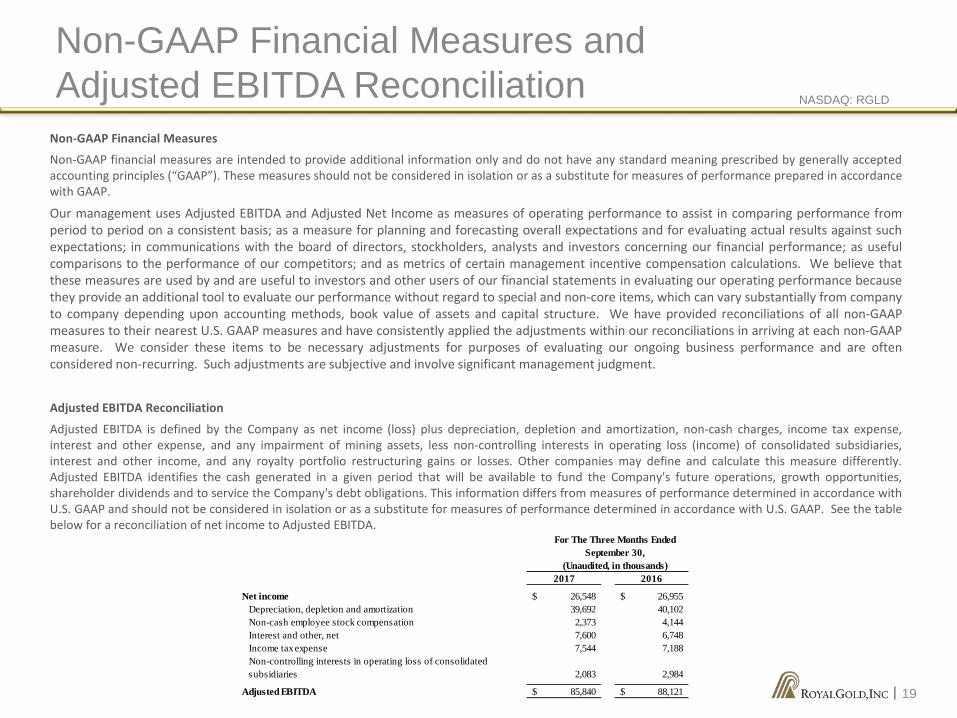
Non-GAAP Financial Measures
Non-GAAP financial measures are intended to provide additional information only and do not have any standard meaning prescribed by generally acceptedaccounting principles (“GAAP”). These measures should not be considered in isolation or as a substitute for measures of performance prepared in accordancewith GAAP.
Our management uses Adjusted EBITDA and Adjusted Net Income as measures of operating performance to assist in comparing performance fromperiod to period on a consistent basis; as a measure for planning and forecasting overall expectations and for evaluating actual results against suchexpectations; in communications with the board of directors, stockholders, analysts and investors concerning our financial performance; as usefulcomparisons to the performance of our competitors; and as metrics of certain management incentive compensation calculations. We believe thatthese measures are used by and are useful to investors and other users of our financial statements in evaluating our operating performance becausethey provide an additional tool to evaluate our performance without regard to special and non-core items, which can vary substantially from companyto company depending upon accounting methods, book value of assets and capital structure. We have provided reconciliations of all non-GAAPmeasures to their nearest U.S. GAAP measures and have consistently applied the adjustments within our reconciliations in arriving at each non-GAAPmeasure. We consider these items to be necessary adjustments for purposes of evaluating our ongoing business performance and are oftenconsidered non-recurring. Such adjustments are subjective and involve significant management judgment.
Adjusted EBITDA Reconciliation
Adjusted EBITDA is defined by the Company as net income (loss) plus depreciation, depletion and amortization, non-cash charges, income tax expense,interest and other expense, and any impairment of mining assets, less non-controlling interests in operating loss (income) of consolidated subsidiaries,interest and other income, and any royalty portfolio restructuring gains or losses. Other companies may define and calculate this measure differently.Adjusted EBITDA identifies the cash generated in a given period that will be available to fund the Company's future operations, growth opportunities,shareholder dividends and to service the Company's debt obligations. This information differs from measures of performance determined in accordance withU.S. GAAP and should not be considered in isolation or as a substitute for measures of performance determined in accordance with U.S. GAAP. See the tablebelow for a reconciliation of net income to Adjusted EBITDA.
Non-GAAP Financial Measures andAdjusted EBITDA Reconciliation
19
For The Three Months EndedSeptember 30,
(Unaudited, in thousands)2017 2016
Net income 26,548$ 26,955$ Depreciation, depletion and amortization 39,692 40,102 Non-cash employee stock compensation 2,373 4,144 Interest and other, net 7,600 6,748 Income tax expense 7,544 7,188 Non-controlling interests in operating loss of consolidated subsidiaries 2,083 2,984
Adjusted EBITDA 85,840$ 88,121$


![1261084 82 GS-30, GS-32, GS-46, GS-47 Slab Scissor [CE] · Operator's Manual CE GS™-1530/32 GS™-1930/32 GS™-2032 GS™-2632 GS™-3232 with Maintenance Information GS™-2046](https://static.fdocuments.in/doc/165x107/5f723aded681a6518a11728a/1261084-82-gs-30-gs-32-gs-46-gs-47-slab-scissor-ce-operators-manual-ce-gsa-153032.jpg)


![[MS-PPTX]: PowerPoint (.pptx) Extensions to the Office ...MS-PPTX].pdf · [MS-PPTX]: PowerPoint (.pptx) Extensions to the Office Open XML File Format ... PowerPoint (.pptx) Extensions](https://static.fdocuments.in/doc/165x107/5ae7f6357f8b9a6d4f8ed3a1/ms-pptx-powerpoint-pptx-extensions-to-the-office-ms-pptxpdfms-pptx.jpg)


![[MS-PPTX]: PowerPoint (.pptx) Extensions to the Office ...interoperability.blob.core.windows.net/files/MS-PPTX/[MS-PPTX... · 1 / 76 [MS-PPTX] — v20140428 PowerPoint (.pptx) Extensions](https://static.fdocuments.in/doc/165x107/5ae7f6357f8b9a6d4f8ed3b3/ms-pptx-powerpoint-pptx-extensions-to-the-office-ms-pptx1-76-ms-pptx.jpg)