Gruppo SOL 2004 ing - Homepage — Italiano M Studio, Milano Printing Leva Arti Grafiche, Sesto San...
64
Sol Group Annual Report 2004
Transcript of Gruppo SOL 2004 ing - Homepage — Italiano M Studio, Milano Printing Leva Arti Grafiche, Sesto San...

Sol G
roup
Ann
ual R
epor
t20
04
Sol G
roup
Ann
ual R
epor
t20
04
Sol SpaPiazza Diaz, 120052 Monza (MI) ItalyTelephone +39.039.23961Fax +39.039.2396371

Design
M Studio, Milano
Printing
Leva Arti Grafiche, Sesto San Giovanni
Inde
x 3 Directors’ report 2004 Sol Group
15 Consolidated financial statements 2004 Sol Group
16 Consolidated balance sheet
20 Consolidated profit and loss account
22 Notes to the consolidated financial statements
58 Consolidated cash flow statement
59 Report of the independent auditors Sol Group
Sol SpaRegistered officePiazza Diaz, 120052 Monza (MI) Italy
Share CapitalEuro 47.164.000,00 fully paid up.
C.F and company register of Milann° 04127270157R.E.A. n° 991655C.C.I.A.A. Milan

Board of Directors Chairman and Managing Director
Aldo Fumagalli Romario
Deputy Chairman and Managing Director
Marco Annoni
Director with special powers
Ugo Marco Fumagalli Romario
Director with special powers
Giovanni Annoni
Directors
Alessandra Annoni
Stefano Bruscagli
Uberto Fumagalli Romario
Luisa Savini
General Manager
Giulio Bottes
Powers granted to the Directors(CONSOB Communication No. 97001574
dated 20 February 1997)
To the Chairman and Deputy Chairman: the legal
representation of the Company in dealings with
third parties and before the legal authorities;
powers of ordinary management acting severally;
powers of extraordinary management, acting
jointly, it being understood that for the execution
of the related acts the signature of one of the
two with the written authorization of the other
is sufficient; exception is made for certain specific
acts of particular importance reserved for the
competence of the Board.
To the Directors with special powers: powers of
ordinary management relating to Administration
and Finance (Ugo Marco Fumagalli Romario) and
to IT Systems Organization (Giovanni Annoni)
signing severally.
Board of Statutory Auditors Chairman
Enrico Aliboni
Statutory Auditors
Alessandro Danovi
Gianfranco Graziadei
Alternate Auditors
Vincenzo Maria Marzuillo
Vittorio Terrenghi
External Auditing Company Deloitte & Touche S.p.a.
Via Tortona, 25
20144 Milan, ItalySo
lSpa

AIRSOL B.V.Amsterdam (NL)
TMG GmbHKrefeld (D)
Vivisol H. GmbH Vienna (A)
Vivisol France Sarl Vaux le Penil (F)
FRANCE OXYGENE SarlAnnoeullin (F)
Vivisol S.r.l.Monza (I)
Vivisol Brescia S.r.l.Brescia (I)
Vivisol Umbria S.r.l.Perugia (I)
Vivisol Napoli S.r.l.Marcianise (I)
Vivisol Silarus S.r.l.Battipaglia (I)
Il Point S.r.l.Verona (I)
Zeus S.A. Piraeus (GR)
HGT S.A. Salonicco (GR)
Ionia Oxigono e.p.e.Salonicco (GR) *
CryoMed S.r.l. in liquidationMilano (I) *
C.T.S. S.r.l.Monza (I)
N.T.G. B.V.Tilburg (NL)
B.T.G. BVBA(5)
Lessines (B)
SOL France SasCergy Pontoise (F)
SOL T. G. GmbHWiener Neustadt (A)
GTS Sh.p.k.Tirana (AL)
TGK Sofia A.D.Sofia (BG)
BEHRINGER S.r.l.Genova (I)
MEDICAL SYSTEM S.r.l. Giussago (I) *
Vivisol Deutschland GmbH Mauern (D)
OXYMED Medizintechnik GmbH Plaue (D)
IMG d.o.o.Belgrado (SCG)
Vivisol B Sprl Lessines (B)
I.C.O.A. S.r.l.Vibo Valentia (I)
Vivisol Calabria S.r.l.Vibo Valentia (I)
Vivisol d. Stretto S.r.l. Gioia Tauro RC (I)
Consorgas S.r.l.Milan (I)*
G.T.E. S.L.Barcellona (E) *
T.G.T. A.D.Trn (BiH)
TGP A.D.Petrovo (BiH)
SOL-INA d.o.o.Sisak (HR)
UTP d.o.o.Pula (HR)
Kisikana d.o.oSisak (HR)
Energetika Z.J.d.o.o.(3)
Jesenice (SLO)
SPG - SOL Plin Gorenjska d.o.o.(2)
Jesenice (SLO)
T.P.J. d.o.o.Jesenice (SLO)
Eurobot Welding S.r.l. in liquidationCostabissara (I)
SOL WELDING S.r.l.Costabissara (I)
TGS A.D.Skopje (MK)
SOL SEE d.o.o.(4)
Skopje (MK)
Stru
ctur
e of
the
Gro
up S
ol S
pa2
SOL Spa (1)
100%
100%
100%
100%
100%
97,37%
95,61%
68,87%
85%
70%
70%
65%
100%
100%
100%
100%
100%
100%
78,46%
80,73%
0,08%
97,60%
25,79%
100%
75,18%
60,96%
62,79%
92,67%
49,45%
64,11%
100%
80,43%
96,16%
84,65%
51%
10%
100%
19,27%
99,92%
30%
70%
34%
95,61%
70%
45,15%
35,89%
(*) Company not included in the consolidated basis. (1) SOL has established the following overseas branches: Vaux le Penil (F), Lugano (SW), Feuly – Seneffe (B), Oisterwijk (NL).(2) The minority interests include an equity investment of SIMEST S.p.A., equating to 5.4%. On the basis of the SOL/SIMEST agreement dated 12/23/02, SOL is obli-
ged to repurchase the SIMEST stock by 30 June 2007.(3) The minority interests include an equity investment of SIMEST S.p.A., equating to 7.33%. On the basis of the SOL/SIMEST agreement dated 03/19/03, SOL is
obliged to repurchase the SIMEST stock by 30 June 2007. (4) The minority interests include an equity investment of SIMEST S.p.A., equating to 12.52%. On the basis of the SOL/SIMEST agreement dated 21 July 2004, SOL
is obliged to repurchase the SIMEST stock by 30 June 2012.(5) B.T.G has established an overseas branch in Dainville (France).
100%
100%
2,83%
98%
100%

Dir
ecto
rs’
repo
rtSo
l Gro
up20
04

Shareholders,
The SOL Group is engaged in production, applied research and distribution activities pertaining to
industrial, pure and medical gases, in home care business, as well as in the sector for related medical
equipment in Italy, presently active in seven other Western European countries and in eight Cen-
tral-Eastern European countries.The products and services of companies belonging to the Group
are used in the chemical, electronic, iron and steel, engineering and foodstuff industries, as well as
in sectors such as environment protection, research and health.
The worldwide macro-economic scenario during 2004 featured a high rate of growth during the
first six months in the United States and in Eastern Asia, especially in China, Indonesia, South Ko-
rea, Japan and Malaysia. In Europe, by contrast a moderate pick-up was noted in industrial activi-
ties and services.
During the second half of the year, we witnessed a general slowdown in both consumption and in-
vestments even if, especially in the United States, this phenomenon was less marked than forecast.
The rise in oil prices, which reached all-time highs during the second half of 2004, had a negative
effect on the expansion of the economies, especially in Europe, where growth was low and inter-
nal demand weak.
In the Euro area, there was a strong appreciation of the Euro against the US dollar throughout the
year.This had the effect of reducing economic growth and price trends, thereby considerably pe-
nalizing exports and, as a consequence, growth in GDP.
The Euro area, therefore, did not experience that extent of growth during 2004 which, by contrast,
the United States, the emerging countries and also Japan were able to generate.
The industrial sectors were those who reported the greatest difficulties in the European countries,
even if to a differing extent from country to country and depending on the manufacturing activi-
ties involved.The increase in international competition, the persistent structural problems and the
weakness of the US dollar were the main causes which led to much lower growth in the other coun-
tries outside Europe.
The South-Eastern European countries, despite being in the presence of political-economic situa-
tions still undergoing considerable change, experienced growth, which was somewhat moderate.
Italy reported moderate growth during the first six months of 2004 followed by a slowdown in do-
mestic demand during the second half of the year, both with regards to consumption and for the
purchase of durable goods.
During 2004, the crisis affecting the Italian manufacturing industry became even more evident, an
industry which continued to lose competitiveness when faced with foreign products, penalized by
oil costs and the appreciation of the Euro against the US dollar, as well as by persistent structural
problems.
The year 2005 promises to be a year of continuation of the trends already consolidated,with growth
worldwide lower than in 2004 and relatively contained inflationary pressure, with extremely high
competitiveness generated by the monetary market.
The technical gases sector once again saw a rise in the cost of electricity, caused essentially by the
Dir
ecto
rs’
repo
rt S
ol G
roup
4

increase in oil product costs and the scarcity of energy products on the deregulated market.
Furthermore, in Italy the process which sees the transfer of manufacturing activities abroad con-
tinued, involving the consequent reduction of technical gas consumption.
Despite operating in the difficult context described, the results achieved by the SOL Group were
positive.
Net sales for 2004 were equal to Euro 320.8 million, representing growth of 7.5% on 2003 (Euro
298.5 million).
The net operating margin amounted to Euro 34.8 million (equal to 10.9% of sales), up by 5% on
the Euro 33.2 million registered in 2003.
Pre-tax profit amounted to Euro 31 million, equal to 9.7% of sales revenues, up 6% on the Euro
29.3 million registered in 2003.
Net income came to Euro 16.9 million, equal to 5.3% of sales revenues, up 11.4% when compared
with the balance of Euro 15.2 million in 2003.
The cash-flow came to Euro 53.9 million (equal to 16.8% of sales revenues), up by 7.7% on the Eu-
ro 50 million registered in 2003.
Investments booked during the year 2004 totalled Euro 53.4 billion, equal to 16.6% of sales revenues.
The average number of staff employed by the Group came to 1,412 (1,331 in 2003).
The Group’s net financial indebtedness was equal to Euro 75.2 million (Euro 65.4 million at the
end of fiscal 2003).
Operating performanceThe technical gas sector disclosed satisfactory rises in sales when compared with last year, mainly
thanks to the growth in volumes of liquid and compressed gases, particularly abroad.The services
area underwent further growth with new applications in the shipyard and petrochemical sectors.
Among the outlet sectors, the chemical, metal, iron and steel areas disclosed a satisfactory perform-
ance, as did the environment and foodstuffs sectors; by contrast, the mechanics and electronics sec-
tor continued to show difficulties.
Sales in the hospital sector rose, mainly thanks to services provided to supplement supplies.
Sales to customers served by means of gas pipelines despite increasing in quantity disclosed a de-
crease with respect to 2003, essentially as a result of new long-term supply contracts stipulated with
key customers.
The home care business once again reported satisfactory growth maintaining the profit margins,
both in Italy and in foreign countries.
In Italy, we are still awaiting the competent ministerial bodies to establish the new reimbursement
price for medical oxygen sold via chemist stores and pharmacies.
A particular depressed market situation, both in Italy and on the other outlet markets, negatively in-
fluenced the results of activities in the welding materials and machines sector.The decision was made
to place the company Eurobot Welding S.r.l. in liquidation and to close down the company Esseti
Dir
ecto
rs’
repo
rt S
ol G
roup
5
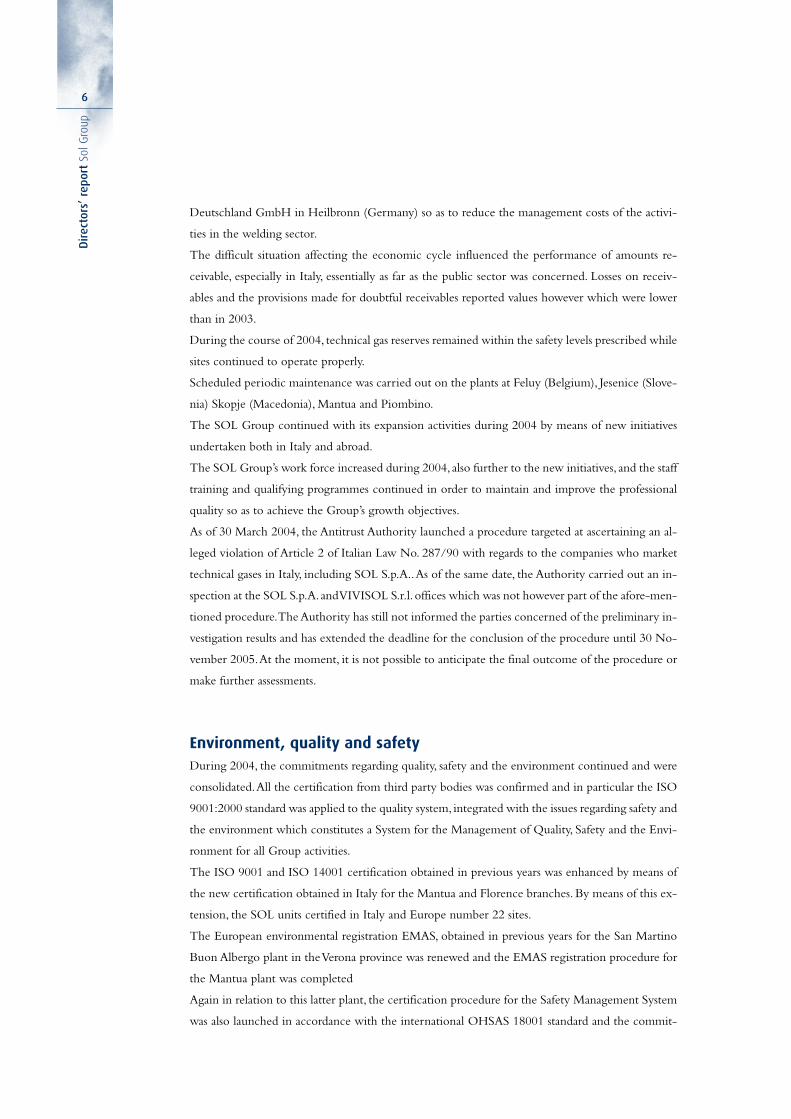
Deutschland GmbH in Heilbronn (Germany) so as to reduce the management costs of the activi-
ties in the welding sector.
The difficult situation affecting the economic cycle influenced the performance of amounts re-
ceivable, especially in Italy, essentially as far as the public sector was concerned. Losses on receiv-
ables and the provisions made for doubtful receivables reported values however which were lower
than in 2003.
During the course of 2004, technical gas reserves remained within the safety levels prescribed while
sites continued to operate properly.
Scheduled periodic maintenance was carried out on the plants at Feluy (Belgium), Jesenice (Slove-
nia) Skopje (Macedonia), Mantua and Piombino.
The SOL Group continued with its expansion activities during 2004 by means of new initiatives
undertaken both in Italy and abroad.
The SOL Group’s work force increased during 2004, also further to the new initiatives, and the staff
training and qualifying programmes continued in order to maintain and improve the professional
quality so as to achieve the Group’s growth objectives.
As of 30 March 2004, the Antitrust Authority launched a procedure targeted at ascertaining an al-
leged violation of Article 2 of Italian Law No. 287/90 with regards to the companies who market
technical gases in Italy, including SOL S.p.A..As of the same date, the Authority carried out an in-
spection at the SOL S.p.A. and VIVISOL S.r.l. offices which was not however part of the afore-men-
tioned procedure.The Authority has still not informed the parties concerned of the preliminary in-
vestigation results and has extended the deadline for the conclusion of the procedure until 30 No-
vember 2005.At the moment, it is not possible to anticipate the final outcome of the procedure or
make further assessments.
Environment, quality and safetyDuring 2004, the commitments regarding quality, safety and the environment continued and were
consolidated.All the certification from third party bodies was confirmed and in particular the ISO
9001:2000 standard was applied to the quality system, integrated with the issues regarding safety and
the environment which constitutes a System for the Management of Quality, Safety and the Envi-
ronment for all Group activities.
The ISO 9001 and ISO 14001 certification obtained in previous years was enhanced by means of
the new certification obtained in Italy for the Mantua and Florence branches. By means of this ex-
tension, the SOL units certified in Italy and Europe number 22 sites.
The European environmental registration EMAS, obtained in previous years for the San Martino
Buon Albergo plant in the Verona province was renewed and the EMAS registration procedure for
the Mantua plant was completed
Again in relation to this latter plant, the certification procedure for the Safety Management System
was also launched in accordance with the international OHSAS 18001 standard and the commit-
Dir
ecto
rs’
repo
rt S
ol G
roup
6

ment concerning the Agenda 21 programme also continued, a programme sponsored and developed
in collaboration with the Civil Service (Municipal, Provincial and Regional authorities).
The ISO 13485:2002 certification (former EN 46001) was also confirmed with EC branding as
medical device for the medical gas distribution, vacuum plants and anaesthetic gas scavenging sys-
tems, in addition to the maintenance of the EC branding for gases and mixtures produced by the
company classified and registered as medical devices.
With regards to Vivisol activities, in addition to confirmation of the third party certification obtained
in previous years, the procedure was started-up for the extension of the ISO 900l:2000 certification
to all the home-care services carried out in Italy and Europe. On conclusion of this procedure, the
Vivisol units certified will amount to 25 sites.
As part of the Responsible Care programme, our participation and collaboration continued for the
drawing up of the Federchimica Environmental Report, in addition to the renewed participation
in the initiative known as “Open Factories”, which during 2004 saw our production plants visited
by several students.
SOL Group investmentsDuring the year under review, investments in the technical gases sector amounted to Euro 42.9 mil-
lion, with Euro 16.5 million of this being invested by the Parent Company SOL S.p.A. and Euro
10.5 million being invested in the home care sector.These investments are broken down below:
• Work was completed at the Cremona plant for modernization and enhancement of the produc-
tion plants which include the creation of a new helium bottling plant, the decanting of liquid he-
lium into cryogenic dewars, the expansion of the ammonia depot, the rationalization and the ex-
tension of the spaces and the compressed gas bottling plants.
• At the Piombino plant work for the improvement and enhancement of the air fractionation gas
production plants was completed including a new air filtration unit employing molecular screens,
as well as the further enhancement of the nitrogen evaporation systems for the emergency sup-
ply of the related pipeline,while work continued for the enhancement of the systems for the com-
pression of oxygen in pipelines.
• In Slovenia, the company SPG d.o.o. almost concluded work for the creation of the new air frac-
tionation and liquefaction plant for the production of high purity liquefied oxygen, nitrogen and
argon and for the supply of gaseous nitrogen and oxygen via gas pipelines to the Jesenice steel-
works.
• In Macedonia, the recently set up company SOL SEE d.o.o. started work for the creation of the
new air fractionation and liquefaction plant for the production of high purity liquefied oxygen,
nitrogen and argon and for the supply of gaseous nitrogen and oxygen via gas pipelines to the
nearby works which produce ferrous alloys in Kavadarci,owned by an important industrial group.
The main elements of the plant have been ordered and are undergoing completion at the work-
shops of the suppliers, while the main civil foundation works have been finished.
Dir
ecto
rs’
repo
rt S
ol G
roup
7

• In Feluy (Belgium) work was started for the creation of a nitrogen liquefying system, a new liq-
uid nitrogen storage tank, the enhancement of the industrial water cooling circuit and the elec-
trical services and the expansion of the offices.The orders for all the main components have been
issued.
• At the Mantua plant, the air fractionation plant was enhanced and improved in order to make it
more flexible and adequate for the needs of the user also during the shutdowns for maintenance
work on the integrated liquefaction plant, and work was completed for the modernization and
automation of the old pre-existing fractionation plant.
• At the Padua, Ravenna and Cuneo factories, work was carried out for adaptation to the GMP
(Good Manufacturing Practice) involving the preparation or improvement of the areas intended
for the filling and storage of medical gases.
• At the Pisa plant, various improvement measures were carried out on the fire-fighting and in-
flammable gas depot systems and a refrigerant fluid conditioning system (bottling).
• At the Bari plant, extension and rationalization work was carried out, following the unification
of the activities previously carried out at Trani.
• At Lessines (Belgium), the company BTG Bvba acquired an industrial goods shed with attached
offices and land adjoining the pre-existing filling plant.
• At Cergy Pontoise (France), the company SOL France Sarl completed the installation of the pro-
duction plant for special oxygen and nitrous oxide-based medical mixtures.
• Improvement and adaptation work continued on our plants from an environmental, safety and hy-
giene point of view both in Italy and abroad.
• Numerous medium and small on-site industrial and medical facilities were also realised and
brought on-stream during the year.
• Facilities for the transport, distribution and sale of products were enhanced involving the purchase
of cryogenic tanks, cryogenic liquid delivery tanks, and cylinders.All such measures were taken to
support and develop the significant commercial growth achieved in all business sectors and geo-
graphical areas.
In the home-care sector, investments were made in particular as follows:
• The expansion of the activities by means of the opening of new centres specifically in Germany
and in France;
• Base and portable units;
• Equipment and systems for ventilation therapy, sleep apnea and inhalation therapy;
• Software programmes for the computerized and more reliable management of home-care activities.
During 2004, the SOL Group continued its expansion abroad and in Italy.
The Parent Company SOL S.p.A. increased its shareholdings in the Italian company SOL Welding
S.r.l. from 68.5% to 80.4% and in the Bulgarian company TGK A.D. from 71.42% to 78.47%, in the
Macedonian company TGS A.D. from 88.6% to 96.15% and in the Slovenian company SOL-INA
d.o.o. from 52.79% to 62.79%.
Dir
ecto
rs’
repo
rt S
ol G
roup
8

SOL S.p.A. also set up the company SOL SEE d.o.o. in Macedonia, which will be involved in the
primary production of technical gases.
The subsidiary company VIVISOL S.r.l. acquired an interest holding of 65% in the company IL
POINT S.r.l. - Verona, whose activities concern the production, repair and sale of aids for the dis-
abled and autonomy devices for the individual.
The subsidiary company AIRSOL B.V. increased its shareholding in the Greek companies HGT
S.A. (from 93.47% to 95.61%) and ZEUS S.A. (from 96.71% to 97.37%).
The subsidiary company Vivisol Deutschland GmbH acquired 100% of OXYMED Medizintech-
nik GmbH located in Plaue (Germany) which is active in the home-case service sector.
Research and Development Activities
Research activities, which have traditionally characterised, justified and supported the Group’s de-
velopment, continued during the financial period; these activities mainly comprise applied research,
currently associated with the development of new production technologies in Europe,with the pro-
motion of new applications for technical gases and with the development of new welding machines.
The costs relating to the R&D activities are charged to the profit and loss account of the relevant
financial year.
SOL S.p.A. dealings with subsidiaries, associated companies and related parties
As regards the dealings with subsidiaries and associated companies, transactions with the said com-
panies are deemed to be within the normal course of Company business, which has given rise to
such transactions in its role as Parent Company.The transactions were all intended and designed to
foster the development in a synergic framework, which makes for beneficial integration within the
Group. No transactions of an extraordinary or unusual nature with respect to the normal course of
business have been carried out. Reference should be made to the information included in the Ex-
planatory Notes to the Statutory and Consolidated Financial Statements of SOL S.p.A. as at 31 De-
cember 2004 for additional details, including the dealings of SOL S.p.A.with Group companies and
other related parties.
Italian Legislative Decree No. 196/2003 concerning the protection of privacy
The Italian Group companies apply Italian Legislative Decree No.196 dated 30 June 2003, the Ital-
ian personal data protection code, and formally acknowledge that they have taken steps to put to-
gether security measures capable of reducing to the minimum the risks of destruction and loss, ac-
cidental or otherwise,of said details,of unauthorized access or processing not permitted or not com-
pliant with the purposes of the data collection.
The companies obliged to do so, shall draw up the Programmatic Security Document within the
legal deadlines.
Dir
ecto
rs’
repo
rt S
ol G
roup
9

Changeover to the International Accounting Standards (IAS/IFRS)
As from 2005, all the EU companies listed on organized markets shall be obliged to draw up the
annual consolidated financial statements and the interim consolidated reports applying the interna-
tional accounting standards (IAS/IFRS).
The SOL Group is currently completing all the activities relating to the preparation of the finan-
cial statements in accordance with the new international standards which shall be applied to the in-
terim consolidated report for the period ending 30 June 2005.
Shares of the Parent Company held by Group Companies
We confirm that as at 31 December 2004, the Parent Company SOL S.p.A. held 1,188,000 ordi-
nary own shares, representing 1.3% of the share capital, carried in the Financial Statements for a val-
ue equal to Euro 2.32 million.
These shares were purchased to execute the resolution approved by the Shareholders’ Meeting held
on 28 April 2000, further to which a stock option scheme was implemented reserved for employ-
ees of the Italian companies of the Group that had subscribed to SOL S.p.A. shares at the time of
the initial offer (IPO) utilising the portion reserved for them.The stock option scheme terminated
on 30 April 2003.
Equity investments of Directors, Statutory Auditors and the General Manager
Full name Investee Number of Number of Number of Number ofcompany shares held shares shares sold shares held at
at the end purchased the end of theof the previous accounting period
accounting period 31 December 2004
Aldo Fumagalli Romario SOL S.p.A. 5,000 0 0 5,000
Marco Annoni SOL S.p.A. 1,000 0 1,000 0
Alberto Enrico Tronconi SOL S.p.A. 2,720,000 * 0 0 2,720,000 *
Stefano Bruscagli SOL S.p.A. 6,800,000 ** 0 0 6,800,000 ** #
Enrico Aliboni SOL S.p.A. 4,000 *** 0 0 4,000 ***
Giulio Bottes SOL S.p.A. 4,000 0 4,000 0
* bare ownership rights and with voting rights.** bare ownership rights.
*** held by spouse.** # 2,721,000 held by dependant children
The remaining Directors and Statutory Auditors do not hold nor have held any equity investments
in Group Companies during 2004.
In order to gain a better understanding of the results, we enclose the reclassified Profit and Loss Ac-
count and Balance Sheet, as well as the net financial position statement for the SOL Group and the
essential data as regards the industrial gases and the home-care sector.
Dir
ecto
rs’
repo
rt S
ol G
roup
10
Dir
ecto
rs’
repo
rt S
ol G
roup
11
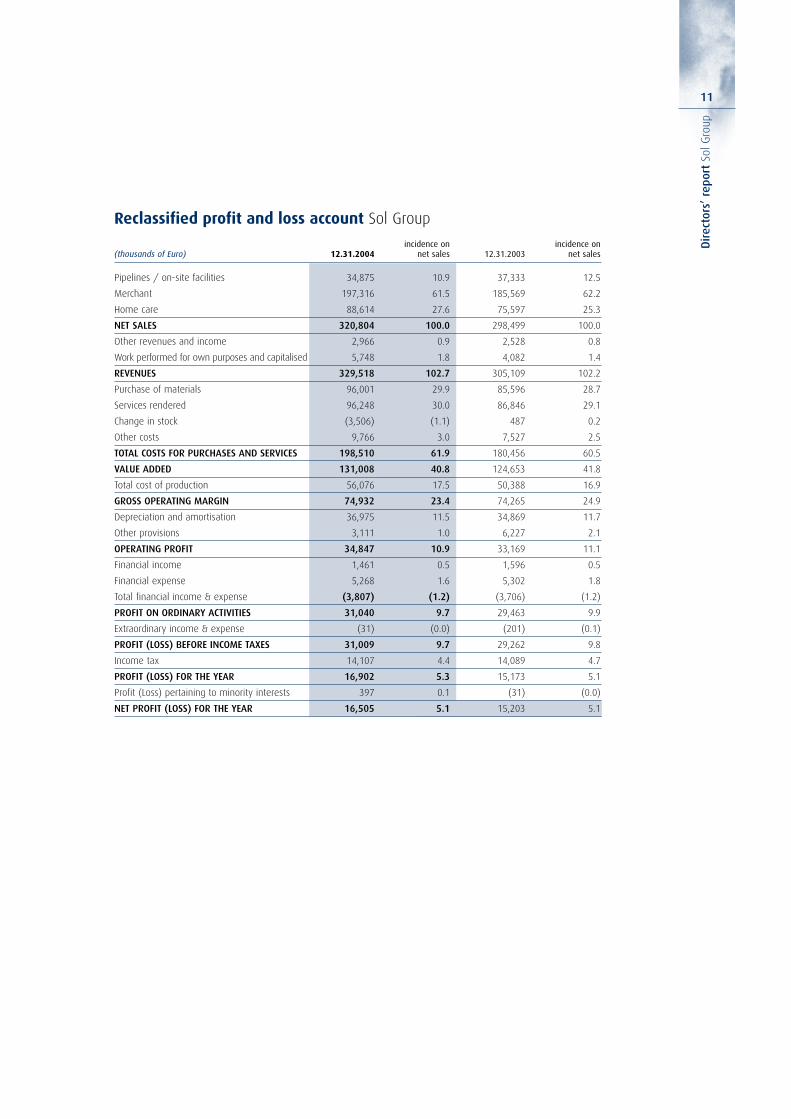
Reclassified profit and loss account Sol Group
incidence on incidence on(thousands of Euro) 12.31.2004 net sales 12.31.2003 net sales
Pipelines / on-site facilities 34,875 10.9 37,333 12.5
Merchant 197,316 61.5 185,569 62.2
Home care 88,614 27.6 75,597 25.3
NET SALES 320,804 100.0 298,499 100.0
Other revenues and income 2,966 0.9 2,528 0.8
Work performed for own purposes and capitalised 5,748 1.8 4,082 1.4
REVENUES 329,518 102.7 305,109 102.2
Purchase of materials 96,001 29.9 85,596 28.7
Services rendered 96,248 30.0 86,846 29.1
Change in stock (3,506) (1.1) 487 0.2
Other costs 9,766 3.0 7,527 2.5
TOTAL COSTS FOR PURCHASES AND SERVICES 198,510 61.9 180,456 60.5
VALUE ADDED 131,008 40.8 124,653 41.8
Total cost of production 56,076 17.5 50,388 16.9
GROSS OPERATING MARGIN 74,932 23.4 74,265 24.9
Depreciation and amortisation 36,975 11.5 34,869 11.7
Other provisions 3,111 1.0 6,227 2.1
OPERATING PROFIT 34,847 10.9 33,169 11.1
Financial income 1,461 0.5 1,596 0.5
Financial expense 5,268 1.6 5,302 1.8
Total financial income & expense (3,807) (1.2) (3,706) (1.2)
PROFIT ON ORDINARY ACTIVITIES 31,040 9.7 29,463 9.9
Extraordinary income & expense (31) (0.0) (201) (0.1)
PROFIT (LOSS) BEFORE INCOME TAXES 31,009 9.7 29,262 9.8
Income tax 14,107 4.4 14,089 4.7
PROFIT (LOSS) FOR THE YEAR 16,902 5.3 15,173 5.1
Profit (Loss) pertaining to minority interests 397 0.1 (31) (0.0)
NET PROFIT (LOSS) FOR THE YEAR 16,505 5.1 15,203 5.1

Dir
ecto
rs’
repo
rt S
ol G
roup
12
Reclassified balance sheet Sol Group
(thousands of Euro) 12.31.2004 12.31.2003
ASSETS
Current assets
Cash and cash at bank 21,888 24,310
Trade debtors 134,604 128,545
Stocks 28,842 25,272
Prepayments and accrued income 838 636
Other short term assets 10,677 10,774
Total current assets 196,849 189,537
Fixed assets
Technical fixed assets 225,202 204,079
Intangible fixed assets 4,478 5,143
Investments 3,365 3,352
Other fixed assets 1,071 1,323
Total fixed assets 234,116 213,897
TOTAL ASSETS 430,965 403,435
LIABILITIES AND SHAREHOLDERS’ EQUITY
Short term liabilities
Bank loans and overdrafts 3,744 5,016
Suppliers 52,070 46,566
Other payables 12,017 12,650
Amounts owed to other financiers 15,867 14,906
Accruals and deferred income 3,067 3,169
Amounts owed to tax administration 3,552 4,803
Total current liabilities 90,318 87,110
Medium/long-term liabilities, provisions
Provisions for risks and charges 20,643 18,043
Employee severance indemnity 9,652 8,921
Other liabilities 78,455 69,583
Total medium/long-term liabilities and provisions 108,750 96,548
Shareholders’ equity
Subscribed capital 47,164 47,164
Reserves 160,938 150,427
Net profit 16,505 15,203
Shareholders’ equity pertaining to the Group 224,607 212,795
Shareholders’ equity pertaining to minority interests 6,893 7,013
Profit (loss) pertaining to minority interests 397 (31)
Shareholders’ equity pertaining to minority interests 7,290 6,982
Total shareholders’ equity 231,897 219,777
TOTAL LIABILITIES AND SHAREHOLDERS’ EQUITY 430,965 403,435

Dir
ecto
rs’
repo
rt S
ol G
roup
13
Net financial position Sol Group
(thousands of Euro) 12.31.2004 12.31.2003
Cash and cash at bank 21,888 24,310
Securities 218 577
Loans – short term portion (14,422) (13,478)
Leases – short term portion (1,445) (1,428)
Short-term amounts due to bank (3,744) (5,016)
Amounts due to Shareholders for loans (44) -
Amounts owed to Shareholders for the purchase of equity investments - (1,332)
Short-term Liquidity, Net 2,451 3,633
Permanent investments 521 484
Loans – long-term portion (74,705) (65,693)
Long-term amounts owed to banks (9) (9)
Amounts due to Financiers for Leasing (1,584) (2,894)
Amounts due to Shareholders for the purchase of equity investments (1,903) (894)
Medium/Long-Term Net indebtedness (77,681) (69,006)
Total Net Liquidity/Indebtedness (75,230) (65,373)
Information by business sector Sol Group
12.31.2004 12.31.2003Technical Home care Write- Consolidated Technical Home care Write- Consolidated
(thousands of Euro) gas sector service downs figures gas sector service sector downs figures
Pipelines / on-site facilities 34,875 - - 34,875 37,333 - - 37,333
Merchant 204,573 - (7,257) 197,316 192,008 - (6,439) 185,569
Vivisol - 88,850 (236) 88,614 - 75,829 (232) 75,597
Net sales 239,448 88,850 (7,493) 320,804 229,341 75,829 (6,671) 298,499
Other revenues and income 3,154 132 (320) 2,966 2,685 154 (311) 2,528
Work performed for own purposes and capitalised 2,644 3,100 4 5,748 1,637 2,440 5 4,082
Revenues 245,246 92,082 (7,810) 329,518 233,663 78,423 (6,977) 305,109
Purchase of materials 76,395 24,500 (4,893) 96,001 70,600 19,507 (4,511) 85,596
Services rendered 71,938 26,699 (2,390) 96,248 66,767 22,004 (1,924) 86,846
Change in stock (2,613) (892) - (3,506) 794 (307) - 487
Other costs 6,588 3,706 (527) 9,766 5,727 2,341 (542) 7,527
Total costs for purchases and services 152,307 54,013 (7,810) 198,510 143,888 43,546 (6,977) 180,456
Value added 92,938 38,069 - 131,008 89,776 34,877 - 124,653
Total cost of production 42,973 13,103 - 56,076 39,695 10,693 - 50,388
Gross operating margin 49,929 24,936 - 74,865 50,081 24,185 - 74,265
12.31.2004 12.31.2003
Total assets 384,516 109,631 (63,182) 430,965 368,430 100,920 (65,915) 403,435
Total liabilities 168,888 63,485 (33,306) 199,068 159,892 56,066 (32,300) 183,658
Investments 42,935 10,455 - 53,391 24,707 9,526 - 34,233
Depreciation and amortisation 27,418 9,557 - 36,975 26,374 8,495 - 34,869

Dir
ecto
rs’
repo
rt S
ol G
roup
14
Significant events which took place after the end of the 2004financial year and foreseeable business developmentsShareholders are informed that during January 2005, the Parent Company SOL S.p.A. sold an in-
terest of 46.05% in the company IMG d.o.o. of Belgrade to SIMEST S.p.A. involving an obligation
to repurchase the stock sold by 30 June 2012.
Shareholders are also informed that in January 2005, the subsidiary company VIVISOL S.r.l. ac-
quired an additional interest of 15% in the company VIVISOL BRESCIA S.r.l., taking its overall
holding to 100%.
As from 1 January 2005, the German company Oxymed Medizintechnik GmbH was merged by
means of absorption in the company VIVISOL Deutschland GmbH, so as to optimise the organi-
zation and home-case service activities in Germany.
In March 2005, SOL S.p.A. reduced its shareholding in SOL-SEE d.o.o. from 84.64% to 61.16% in
favour of SIMEST S.p.A. which consequently increased its holding from 12.52% al 36%, involving
an obligation to repurchase the stock by 30 June 2012.
As far as 2005 is concerned, we believe that it will be characterized by the persistence of the cur-
rent difficult economic phase, involving a pick-up, especially in Italy, which will not emerge before
the second half of the year.
In any event, our objective is to achieve further growth in sales revenues and profitability.
Monza, Italy, March 29, 2005
The Chairman of the Board of Directors
(Aldo Fumagalli Romario)
Dir
ecto
rs’
repo
rt S
ol G
roup
15
Cons
olid
ated
fin
anci
al s
tate
men
tsSo
l Gro
up20
04

Consolidated balance sheet Sol Group
ASSETS 12.31.2004 12.31.2003
A) CALLED UP SHARE CAPITAL NOT PAID
called part 377,327 -
part not called - -
TOTAL 377,327 -
B) FIXED ASSETS
I - Intangible fixed assets
1) Start-up and expansion costs 298,949 411,421
2) Costs for research, development and advertising 55,759 198,445
3) Industrial patents and rights to use intellectual property 243,116 259,025
4) Concessions, licences, trademarks and similar rights 610,947 520,879
5) Goodwill 944,821 1,107,643
6) Assets in course of construction and down payments - 34,892
7) Other 1,263,070 1,431,195
8) Consolidation difference 1,061,630 1,179,726
Total 4,478,292 5,143,226
II - Tangible fixed assets
1) Land and buildings 39,663,777 40,187,566
2) Plants and machinery 69,157,763 71,467,095
3) Fixtures and fittings, tools and equipment 87,716,176 79,105,782
4) Other assets 6,663,887 5,314,420
5) Assets in course of construction and down payments 22,000,651 8,004,339
Total 225,202,254 204,079,202
III - Financial investments
1) Equity investments in:
Non-consolidated Group companies 11,224 31,984
Associated companies 475,582 475,428
Parent companies - -
Other companies 40,584 43,550
2) Receivables
Amounts due fromnon-consolidated group companies - -
Amounts due from associated companies - -
Amounts due from parent companies - -
Other receivables 1,039,640 1,257,939
3) Other securities 520,587 484,016
4) Own shares 2,317,074 2,317,074
Total 4,404,691 4,609,991
TOTAL FIXED ASSETS 234,085,237 213,832,419
Cons
olid
ated
fin
anci
al s
tate
men
ts S
ol G
roup
16
Amounts receivable withinthe following year
12.31.04 12.31.03
- -
- -
- -
5,227 -
5,227 -

(continue) ASSETS 12.31.2004 12.31.2003
C) CURRENT ASSETS
I - Stocks
1) Raw materials, subsidiary materials and consumables 1,568,045 1,910,404
2) Work in progress and semi-finished goods 738,102 686,854
3) Work in progress on contracts 8,284,967 6,607,271
4) Finished goods and goods for resale 18,250,449 16,067,073
5) Down payments - -
Total 28,841,563 25,271,602
II - Receivables
1) Trade receivables 134,604,235 128,545,338
2) Amounts due from non-consolidated group companies - -
3) Amounts due from associated companies - -
4) Amounts due from parent companies - -
4bis) Amounts due from the tax authorities 5,431,084 6,068,900
4ter) Prepaid taxes 2,815,724 2,989,748
5) Amounts due from third parties 1,865,969 1,203,610
Total 144,717,012 138,807,596
III - Financial investments which are not permanent
1) In subsidiary companies - -
2) In associated companies - -
3) In parent companies - -
4) In other companies 38,024 38,082
5) Own shares - -
6) Other investments 180,288 538,889
Total 218,312 576,971
IV - Cash at bank and in hand
1) Post Office and bank deposits 21,620,926 24,001,693
2) Bank cheques - 13,036
3) Cash and cash equivalents on hand 266,659 295,665
Total 21,887,585 24,310,394
TOTAL CURRENT ASSETS 195,664,472 188,966,563
D) PREPAYMENTS AND ACCRUED INCOME
Prepayments and accrued income 837,859 635,668
Premium on loans - -
TOTAL PREPAYMENTS AND ACCRUED INCOME 837,859 635,668
TOTAL ASSETS 430,964,895 403,434,650
Cons
olid
ated
fin
anci
al s
tate
men
ts S
ol G
roup
17
Amounts receivable beyondthe following year
12.31.04 12.31.04
- 48,156
- -
- -
- -
- 1,544
1,119 44,295
29,960 19,067
31,079 113,062

Cons
olid
ated
fin
anci
al s
tate
men
ts S
ol G
roup
18
Consolidated balance sheet Sol Group
LIABILITIES 12.31.2004 12.31.2003
A) CAPITAL AND RESERVES:Pertaining to the Group:
I Share capital 47,164,000 47,164,000II Share premium account 63,334,927 63,334,927 III Revaluation reserve - -IV Legal reserve 3,439,020 3,097,354 V Reserve for own shares 2,317,074 2,317,074VI Statutory reserves - -VII Other reserves:
a) Extraordinary reserve 32,505,195 31,473,537 b) Reserves subject to deferred taxation 4,106,867 4,106,867 c) Reserve for payments to cover losses - -d) Capital and reserves of aggregated companies - -e) Reserve for capital account grants - -f) Reserve for differences arising from application of the equity method - -g) Reserve for translation difference -3,726,412 -2,755,078 h) Undistributed earnings of subsidiaries and other reserves 52,502,221 42,393,598 i) Consolidation reserve 5,871,593 5,871,593 k) Other reserves 587,234 587,234
VIII Profits (losses) carried forward - -IX Profit (loss) for the financial year 16,505,082 15,203,451
Total group shareholders’ equity 224,606,801 212,794,557
Minority interests:X Capital and reserves pertaining to minority interests 6,893,219 7,012,799 XI Profit (loss) pertaining to minority interests 397,057 -30,784
Total shareholders’ equity pertaining to minority interests 7,290,276 6,982,015
TOTAL SHAREHOLDERS’ EQUITY 231,897,077 219,776,572
B) PROVISIONS FOR RISKS AND CHARGES1) Provisions for pensions and similar obligations - -2) Taxation, also deferred 19,804,418 16,991,852 3) Other 838,259 1,051,596 4) Consolidated provisions for risks and charges - -
TOTAL PROVISIONS FOR RISKS AND CHARGES 20,642,677 18,043,448
C) EMPLOYEE SEVERANCE INDEMNITY 9,652,260 8,921,298
D) PAYABLES1) Bonds - -2) Convertible bonds - -3) Amounts due to the shareholders for loans 43,890 - 4) Amounts due to banks 3,753,315 5,024,775 5) Amounts due to other lenders 92,156,222 83,493,399 6) Down payments 5,256,082 5,339,492 7) Amounts due to suppliers 52,069,980 46,478,7378) Bills of exchange payable - -9) Amounts due to non-consolidated group companies - -
10) Amounts due to associated companies 155,104 87,55711) Amounts due to parent companies - - 12) Amounts due to the tax authorities 3,552,439 4,802,736 13) Amounts due to Welfare
and Social Security institutions 2,227,740 1,893,98314) Other payables 6,490,706 6,403,394
TOTAL PAYABLES 165,705,478 153,524,073
E) ACCRUALS AND DEFERRED INCOMEAccruals and deferred income 3,067,403 3,169,259Discount on loans - -
TOTAL ACCRUALS AND DEFERRED INCOME 3,067,403 3,169,259
TOTAL LIABILITIES 430,964,895 403,434,650
Amounts receivable withinthe following year
12.31.04 12.31.03- -
- -
- -
9,307 9,060
76,289,335 68,587,454
- -
- -
- -
- -
- -
- -
- -
- -
- -
2,156,610 986,819
78,455,252 69,583,334

Cons
olid
ated
fin
anci
al s
tate
men
ts S
ol G
roup
19
Consolidated balance sheet Sol Group
MEMORANDUM ACCOUNTS 12.31.2004 12.31.2003
A) GUARANTEES GIVEN
1) to others:
a) Bank guarantees 6,398,298 6,841,266
b) Endorsements - -
c) Other personal guarantees - -
d) Real guarantees - -
Total 6,398,298 6,841,266
2) to associated companies
a) Bank guarantees - -
b) Endorsements - -
c) Other personal guarantees - -
d) Real guarantees - -
Total - -
TOTAL 6,398,298 6,841,266
B) OTHER MEMORANDUM ACCOUNTS
1) Leasing rentals falling due - -
2) Bills and cash orders in circulation - -
3) Raw materials and finished products held by others 209,593 350,030
4) Securities held by others - -
5) Assets owned by others at our premises 17,704 -
6) Foreign currency repurchase commitments - -
TOTAL 227,297 350,030
C) GUARANTEES RECEIVED
a) Bank guarantees 31,187 31,187
b) Endorsements - -
c) Other personal guarantees - -
d) Real guarantees - -
TOTAL 31,187 31,187
TOTAL MEMORANDUM ACCOUNTS 6,656,782 7,222,483

Cons
olid
ated
fin
anci
al s
tate
men
ts S
ol G
roup
20
Consolidated profit and loss account Sol Group 12.31.2004 12.31.2003
A) (+) VALUE OF PRODUCTION
1) Net turnover from sales and services 320,804,332 298,499,051
2) Change in stocks of finished, semi-processed and work in progress 1,859,128 118,069
3) Change in work in progress on contracts 1,677,697 -787,693
4) Work performed for own purposes and capitalised 5,747,586 4,082,434
5) Other revenues and income:
- Other revenues and income 2,527,556 2,098,463
- Financial grants to the financial period account 438,476 429,281
TOTAL 333,054,775 304,439,605
B) (-) Costs of production
6) For raw materials, subsidiary materials, consumables and goods -96,001,305 -85,596,317
7) For services -96,248,235 -86,846,494
8) For use of assets owned by others -6,065,117 -4,730,963
9) For staff costs:
a) wages and salaries -40,490,875 -36,477,651
b) Social Security costs -14,180,595 -12,544,348
c) employee severance indemnity -1,404,048 -1,366,132
d) pension costs and similar obligations - -
e) other costs - -
10) Amortisation and write-downs:
a) Amortisation of intangible fixed assets -2,083,377 -3,116,724
b) Depreciation of tangible fixed assets -34,891,336 -31,752,591
c) Other reductions in value of fixed assets - -3,461
d) Allowance for doubtful debtors included in current assets and other accounts included in cash at bank and on hand -3,088,261 -5,785,501
11) Movement in stocks of raw materials, subsidiary materials, consumables and goods -31,288 182,999
12) Amounts provided for risk provisions -21,176 -68,885
13) Other provisions -1,105 -369,063
14) Other operating charges -3,701,193 -2,795,584
TOTAL -298,207,911 -271,270,715
(A - B) DIFFERENCE BETWEEN VALUE AND COSTS OF PRODUCTION 34,846,864 33,168,890

Cons
olid
ated
fin
anci
al s
tate
men
ts S
ol G
roup
21
(continue) Consolidated profit and loss account Sol Group 12.31.2004 12.31.2003
C) FINANCIAL INCOME AND CHARGES
15) (+) Income from equity investments:
in non-consolidated group companies - -
in associated companies - 317
in other companies 6 4
16) (+) other financial income
a) from loans entered under fixed assets
due from others: - 3,015
due from associated companies - -
due from parent companies - -
b) from other permanent investments other than equity investments 17,495 17,694
c) from other investments which are not permanent - 1,869
d) other financial income not included above:
due from others: 711,538 811,856
due from associated companies - -
due from parent companies - -
17) (-) Interest payable and similar charges
payable to others: -4,612,827 -4,822,814
due to associated companies - -
due to parent companies - -
17bis) (-)Exchange (+) gains/ (-) losses 76,754 281,816
TOTAL -3,807,034 -3,706,243
D) VALUE ADJUSTMENTS TO FINANCIAL INVESTMENTS
18) (+) revaluations:
of equity investments 1,248 5,714
of long-term financial assets which are not equity investments 10,234 333
of non-permanent investments which are not equity investments - -
19) (-) write-downs:
of equity investments -59,515 -163,998
of long-term financial assets which are not equity investments -1,360 -5,392
of non-permanent investments which are not equity investments - -
TOTAL VALUE ADJUSTMENTS -49,393 -163,343
E) EXTRAORDINARY INCOME AND CHARGES
20) (+) extraordinary income:
income 661,090 500,108
capital gains from disposal of fixed assets 13,137 41,242
21) (-) extraordinary charges:
charges: -387,983 -374,667
capital losses from disposal of fixed assets - -86,000
taxes from previous financial years -267,709 -118,444
TOTAL EXTRAORDINARY INCOME AND CHARGES 18,535 -37,761
PROFIT OR LOSS BEFORE INCOME TAXES 31,008,972 29,261,543
22) (-) income taxes on the income of the period
current -12,307,821 -12,716,748
deferred -1,799,012 -1,372,128
23) Aggregate net profit or loss 16,902,139 15,172,667
PROFIT (LOSS) FOR THE FINANCIAL YEAR PERTAINING TO OTHERS -397,057 30,784
PROFIT (LOSS) FOR THE FINANCIAL YEAR PERTAINING TO THE GROUP 16,505,082 15,203,451

Explanatory notes to the Consolidated Balance Sheet and Profit andLoss Account as of 31 December 2004
General criteriaThe Balance Sheet and Profit and Loss Account as of 31 December 2004 are in compliance with
the provisions of Article 25 et seq. of Italian Legislative Decree No. 127/91; the accounting princi-
ples adopted are in line with those recommended by the National Commission for Listed Compa-
nies and the Stock Exchange (CONSOB) and established by the Italian Accounting Professional.
The Balance Sheet and the Profit and Loss Account are integrated by the relevant Explanatory
Notes,which were prepared in accordance with the provisions of Article 38 of the above-mentioned
Legislative Decree.The financial statements are presented on a comparative basis with the previous
year, the balances being consistent with current financial years’, with the exception of the amend-
ments introduced by means of the provisions of Italian Legislative Decree No. 6/2003. In particu-
lar, in the balance sheet layout, two specific items “4bis) amounts due from tax authorities”and “4ter)
prepaid taxes” have been added to the Receivables under item CII, and among the liabilities the
item “D3) Amounts due to shareholders for loans” has been added. In the Profit and Loss Account,
the item “17Bis) exchange gains and losses” has been introduced.These changes were also made to
the financial statement layouts for the year ended 31 December 2003.
These Explanatory Notes include a reconciliation of the Parent Company’s profit and sharehold-
ers’ equity and the consolidated profit and shareholders’ equity for the reporting period.
We have enclosed the cash flow statement to these Explanatory Notes for a better understanding
of the Financial Statements.
The reclassified Balance Sheet and Profit and Loss Account are attached to the Directors’ Report.
Accounting reference date
The consolidated financial statements have been prepared and presented on the basis of the financial
statements as of 31 December 2004 of the individual consolidated companies duly approved by the
General Shareholders’ Meetings and prepared in accordance with the Group’s accounting principles.
Group composition and consolidation basis
The consolidated financial statements comprise the financial statements as of 31 December 2004 of
the Parent Company SOL SpA and of the following companies, which are, pursuant to Article 38.2
of Italian Legislative Decree No. 127/91:
22N
otes
to
the
cons
olid
ated
fin
anci
al s
tate
men
ts S
ol G
roup

23
a) directly or indirectly controlled subsidiaries, consolidated on a line-by-line basis;
Company Name and Registered Office Notes Share capital Ownership PercentageDirectly Indirectly Total
AIRSOL BV – Amsterdam Euro 7,724,246.84 100% 100%
BEHRINGER Srl – Genoa Euro 102,000 51% 51%
B.T.G. Bvba – Lessines Euro 3,558,000 100% 100%
C.T.S. S.rl – Monza Euro 156,000 100% 100%
ENERGETIKA Z.J. d.o.o. – Jesenice 1 SIT 239,544,630.42 100% 100%
FRANCE OXYGENE Sarl – Annoeullin Euro 1,300,000 100% 100%
G.T.S. Sh.P.K. – Tirana LEK 59,100,000 100% 100%
HGT S.A. – Thesalonniki Euro 1,069,807.50 95.61% 95.61%
I.C.O.A. Srl – Vibo Valentia Euro 45,760 97.60% 97.60%
Il Point Srl – Verona Euro 98,800 65% 65%
IMG D.o.o. – Belgrade CSD 173,204,676.91 80.73% 19.27% 100%
KISIKANA D.o.o – Sisak Kune 28,721,300 62.79% 62.79%
N.T.G. Bv – Tilburg Euro 2,295,000 100% 100%
OXYMED Medizintechnik GmbH – Plaue Euro 25,564.59 100% 100%
SOL France Sas – Cergy Pontoise Euro 3,000,000 100% 100%
SOL SEE d.o.o. – Skopje 2 DEN 497,554,300 97.17% 2.72% 99.89%
SOL T.G. GmbH – Wiener Neustadt Euro 726,728.34 100% 100%
SOL Welding Srl – Costabissara Euro 2,350,000 80.43% 80.43%
SOL-INA D.o.o. – Sisak Kune 58,766,000 62.79% 62.79%
SPG – SOL Plin Gorenjska D.o.o. – Jesenice 3 SIT 1,970,000,000 54.85% 45.15% 100%
T.G.K. Sofia AD – Sofia Leva 4,541,450 78.46% 78.46%
T.G.P. AD – Petrovo KM 1,177,999 60.96% 60.96%
T.G.S. AD – Skopje DEN 413,001,941 96.16% 96.16%
T.G.T. AD – Trn KM 970,081 75.18% 75.18%
T.M.G. GmbH – Krefeld Euro 2,045,167.52 100% 100%
T.P.J. D.o.o. – Jesenice SIT 633,485,260 64.11% 35.89% 100%
U.T.P. D.o.o – Pula Kune 12,433,000 61.53% 61.53%
VIVISOL B S.p.r.l. – Lessines Euro 162,500 0.08% 99.92% 100%
VIVISOL Brescia S.r.l. – Brescia Euro 41,600 85% 85%
VIVISOL Calabria Srl – Vibo Valentia Euro 10,400 98.32% 98.32%
VIVISOL Deutschland GmbH – Mauern Euro 2,500,000 100% 100%
VIVISOL dello Stretto Srl – Gioia Tauro Euro 213,200 94.00% 94.00%
VIVISOL France Sarl – Vaux Le Penil Euro 500,000 100% 100%
VIVISOL Heimbehandlungsgeräte GmbH – Vienna Euro 726,728.34 100% 100%
VIVISOL Napoli Srl – Marcianise Euro 98,800 70% 70%
VIVISOL S.r.l. – Monza Euro 2,600,000 100% 100%
VIVISOL Silarus S.r.l. – Battipaglia Euro 18,200 49% 49%
VIVISOL Umbria S.r.l. – Perugia Euro 67,600 70% 70%
ZEUS S.A. – Piraeus Euro 2,990,574 97.37% 97.37%
1) The Group’s share as of 31 December 2004 includes a 7.33% equity investment in Simest S.p.A.; under an agreement entered into betweenSOL S.p.A. and Simest on 19 March 2003, SOL SpA is under obligation to repurchase the entire Simest stock by 30 June 2007.
2) The Group’s share as of 31 December 2004 includes a 12.52% equity investment in Simest S.p.A.; under an agreement entered into betweenSOL S.p.A. and Simest on 21 July 2004, SOL SpA is under obligation to repurchase the entire Simest stock by 30 June 2012.
3) The Group’s share as of 31 December 2004 includes a 5.4% equity investment in Simest S.p.A.; under an agreement entered into between SOLS.p.A. and Simest on 23 December 2002, SOL SpA is under obligation to repurchase the entire Simest share by 30 June 2007.
Not
es t
o th
e co
nsol
idat
ed f
inan
cial
sta
tem
ents
Sol
Gro
up
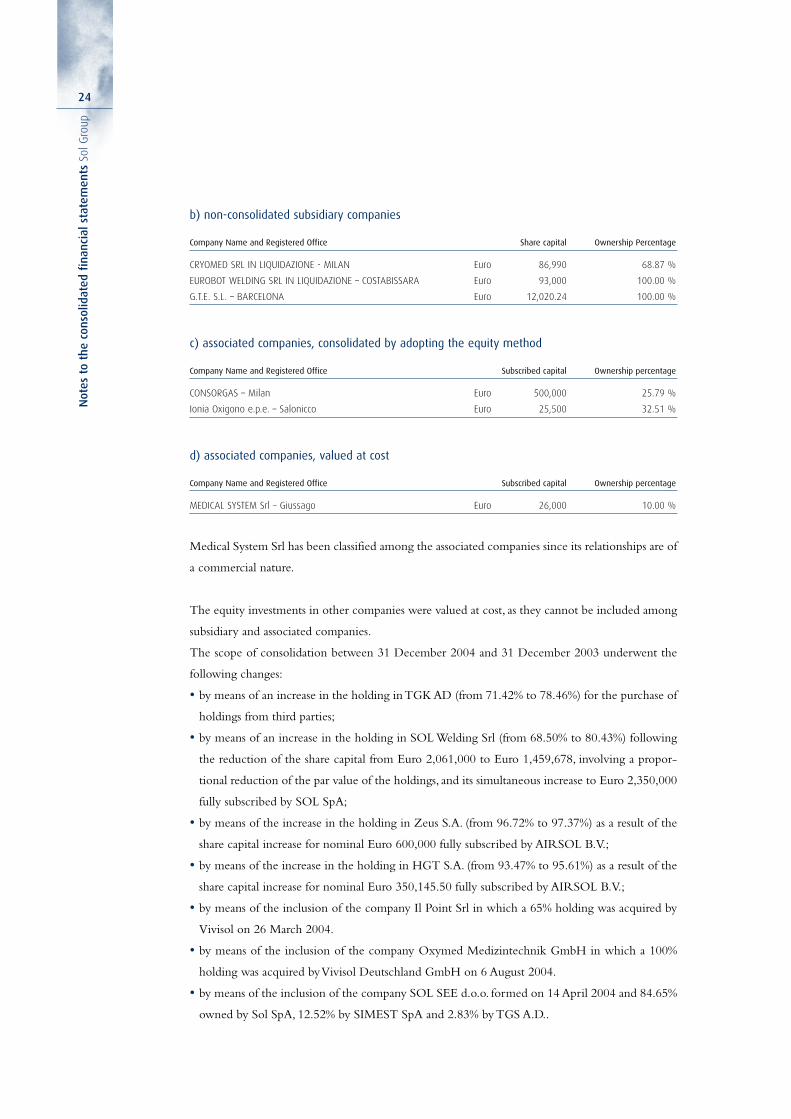
b) non-consolidated subsidiary companies
Company Name and Registered Office Share capital Ownership Percentage
CRYOMED SRL IN LIQUIDAZIONE - MILAN Euro 86,990 68.87 %
EUROBOT WELDING SRL IN LIQUIDAZIONE – COSTABISSARA Euro 93,000 100.00 %
G.T.E. S.L. – BARCELONA Euro 12,020.24 100.00 %
c) associated companies, consolidated by adopting the equity method
Company Name and Registered Office Subscribed capital Ownership percentage
CONSORGAS – Milan Euro 500,000 25.79 %
Ionia Oxigono e.p.e. – Salonicco Euro 25,500 32.51 %
d) associated companies, valued at cost
Company Name and Registered Office Subscribed capital Ownership percentage
MEDICAL SYSTEM Srl – Giussago Euro 26,000 10.00 %
Medical System Srl has been classified among the associated companies since its relationships are of
a commercial nature.
The equity investments in other companies were valued at cost, as they cannot be included among
subsidiary and associated companies.
The scope of consolidation between 31 December 2004 and 31 December 2003 underwent the
following changes:
• by means of an increase in the holding in TGK AD (from 71.42% to 78.46%) for the purchase of
holdings from third parties;
• by means of an increase in the holding in SOL Welding Srl (from 68.50% to 80.43%) following
the reduction of the share capital from Euro 2,061,000 to Euro 1,459,678, involving a propor-
tional reduction of the par value of the holdings, and its simultaneous increase to Euro 2,350,000
fully subscribed by SOL SpA;
• by means of the increase in the holding in Zeus S.A. (from 96.72% to 97.37%) as a result of the
share capital increase for nominal Euro 600,000 fully subscribed by AIRSOL B.V.;
• by means of the increase in the holding in HGT S.A. (from 93.47% to 95.61%) as a result of the
share capital increase for nominal Euro 350,145.50 fully subscribed by AIRSOL B.V.;
• by means of the inclusion of the company Il Point Srl in which a 65% holding was acquired by
Vivisol on 26 March 2004.
• by means of the inclusion of the company Oxymed Medizintechnik GmbH in which a 100%
holding was acquired by Vivisol Deutschland GmbH on 6 August 2004.
• by means of the inclusion of the company SOL SEE d.o.o. formed on 14 April 2004 and 84.65%
owned by Sol SpA, 12.52% by SIMEST SpA and 2.83% by TGS A.D..
24N
otes
to
the
cons
olid
ated
fin
anci
al s
tate
men
ts S
ol G
roup

25
Shareholders are also informed of the deconsolidation of Eurobot Welding Srl since this company
has started winding-up procedures and Esseti Deutschland GmbH since this company ceased ac-
tivities as of 31 December 2004.
Consolidation principles and valuation criteria
Consolidation principles
The Financial Statements utilised for consolidation purposes are those as of 31 December 2004 re-
lating to the individual companies.These Financial Statements have been suitably reclassified and
adjusted in order to harmonise group accounting policies and standards with those of the Parent
Company, which are in accordance with the provisions of Section 2423 et seq. of the Italian Civil
Code, and with the provisions as recommended by CONSOB.
The consolidation principles used and applied are as follows:
• assets and liabilities, as well as income and expenses of consolidated companies are recorded in full;
whereas accounts receivable and payable, income and expenses, profits and losses for material
amounts deriving from transactions of a significant value, executed among companies included in
the consolidation basis, taking possible deferred taxation into due account, are eliminated;
• the book value of investments in consolidated companies is set off against the corresponding shares
of subsidiaries’ net assets; and the possible difference between purchase price and relevant net as-
sets at the book value at the date of acquisition is added to the assets or liabilities items of the con-
solidated companies; the possible residual difference, if negative, is entered in a balance sheet item
denominated consolidation reserve; if positive, it is entered in an assets item denominated con-
solidation difference, and is amortised over a period of 5 years.The shares of shareholders’ equity
and of profit belonging to third party shareholders, calculated on the basis of Financial Statements
adjusted in accordance with the Group’s accounting policies, are stated in the items “Sharehold-
ers’ equity pertaining to minority interests” of the Balance Sheet and “Minority interests - share
of profit (loss)” of the Profit and Loss Account, respectively;
• taxation on undistributed profits of the consolidated companies are not accounted for, as it is pre-
sumed that profits will be permanently reinvested within the Group.
Conversion of Financial Statements denominated in foreign currency
The items under Shareholders’ equity were converted into Euro by adopting the historical exchange
rates for the financial periods in which they were generated. Balance Sheet items are converted in-
to Euro by adopting the exchange rates prevailing as of 31 December 2004,whereas Profit and Loss
Account items are converted into Euro using the average exchange rates recorded in the year 2004.
The difference between the result for the accounting period generated by converting at the aver-
age exchange rates and the result emerging further to conversion at the exchange rates prevailing
as of 31 December 2004 and the effects on assets and liabilities arising from exchange-rate fluctu-
ations between the beginning of the accounting period and 31 December, are carried as part of
Not
es t
o th
e co
nsol
idat
ed f
inan
cial
sta
tem
ents
Sol
Gro
up

shareholders’ equity under the account “Reserve for translation difference”.
The rates of exchange utilised to convert the Financial Statements not expressed in Euro are de-
tailed in the table below:
Currency Exchange Average Exchange Averagerate on exchange rate rate on exchange rate
12.31.04 for 2004 12.31.03 for 2003
Albanian Lek Euro 0.00797 Euro 0.00786 Euro 0.00749 Euro 0.00731
Macedonian Dinar Euro 0.01581 Euro 0.01624 Euro 0.01648 Euro 0.01655
Bulgarian Lev Euro 0.51127 Euro 0.51197 Euro 0.51127 Euro 0.51308
Croatian Kuna Euro 0.13074 Euro 0.13352 Euro 0.13093 Euro 0.13232
Serbian Dinar Euro 0.01226 Euro 0.01384 Euro 0.01469 Euro 0.01466
Slovenian Taller Euro 0.00417 Euro 0.00418 Euro 0.00422 Euro 0.00428
Convertible Mark Euro 0.51129 Euro 0.51129 Euro 0.51129 Euro 0.51129
Valuation criteria
The accounting policies and valuation criteria applied by all consolidated companies are substan-
tially the same.The accounting policies for the Consolidated Balance Sheet and Profit and Loss Ac-
count were those utilised by the Parent Company SOL SpA and in compliance with the legislative
provisions in force as mentioned above, supplemented and interpreted by the Accounting Princi-
ples set out by the Italian Accounting Profession and the Italian Accounting Standard Setter (OIC).
The valuation of the items carried in the consolidated economic and equity position have been
based on the general accounting principles of prudence and accrual, and on the basis of a going con-
cern. For the purposes of accounting, emphasis has been laid on the economic substance of trans-
actions rather than to their legal form; as regards financial assets they were accounted for on the day
of settlement. Income is recognised only if realised within the closing date of the Financial State-
ments, whereas risks and losses are taken into account even if acknowledged at a later date. Het-
erogeneous entries included in the single items of the Financial Statements have been valued sep-
arately. Balance-sheet items that have a useful economic life of more than one year have been stat-
ed among fixed assets.
Write-downs and write-ups
The value of tangible and intangible fixed assets the useful economic life of which is limited in time
is systematically depreciated or amortised.The said assets along with other asset items are written
down whenever a permanent decrease in value is recognised; the prior value is reinstated as long as
the reasons for the preceding write-down are deemed no longer to apply.The detailed methods
adopted for depreciation, amortisation and write-downs are illustrated below.
26N
otes
to
the
cons
olid
ated
fin
anci
al s
tate
men
ts S
ol G
roup

27
Revaluations
No revaluation has ever been made except for those provided for by specific laws regarding tangi-
ble assets and those arising from mergers.
Exceptions
There are no departures from the valuation criteria provided for by the legislation in force con-
cerning the preparation of Financial Statements and consolidated Financial Statements in these and
prior financial years.
Valuation criteria of single itemsIntangible fixed assets
Intangible assets represent costs and expenditures having a useful economic life of more than one
year and are stated at purchase price increased by the expenses incidental thereto and are amortised
on a straight-line basis. In this regard we point out that:
• Start-up and capital increase costs are stated in the specific asset item, and amortised over their
useful economic life, however for a period not exceeding five years.
• Research, development and advertising costs are totally charged to the Profit and Loss Account
for the year in which they were incurred.An exception is represented by costs related to the de-
velopment of new products, provided they are associated with projects in the company’s interests
offering reasonable profitability prospects.
• Industrial patents and rights to use intellectual property are amortised over their estimated useful
economic life, however for a period not exceeding that set out in the relevant license agreements.
• Concessions, licenses, trade marks and similar rights stated among assets are amortised on the ba-
sis of the estimated period of utilisation, in any case not exceeding that set out in the relevant pur-
chase agreements; if the period of utilisation cannot be determined, it is established over five years.
• Goodwill is only carried as part of assets where actually paid for, and for no more than the cost
incurred in this regard, or following a merger, and is amortised over a period not exceeding its
useful life, which is determined as ten years maximum.
• Consolidation differences are amortised over a period of five years.
• Improvements to third party assets are amortised on the basis of the contract’s residual life.
Assets, whose economic value appears to be permanently lower than their cost amortised in accor-
dance with the criteria mentioned above, at the close of the financial year, are adjusted to their ac-
tual economic value. If the reasons that determined the said write-down subsequently appear no
longer to apply, the appropriate write-up is then calculated.
Not
es t
o th
e co
nsol
idat
ed f
inan
cial
sta
tem
ents
Sol
Gro
up

Tangible fixed assets
Tangible assets are stated at purchase price or cost of construction, increased by the expenses inci-
dental thereto.The cost value is only increased in compliance with specific national legal provisions
which allow fixed assets to be revalued following merger deals or assignment of the possible difference
between the value paid to acquire the equity investment and the accruing Shareholders’ equity.
Depreciation is systematically calculated on the cost of assets, increased by any possible revaluation,
dependent upon the residual period of their use.Tangible assets, the economic value of which ap-
pears to be permanently lower than their cost depreciated in accordance with the criteria mentioned
above, at the close of the financial year, are adjusted to their actual economic value.
Costs of ordinary maintenance are charged to the Profit and Loss Account in full.Maintenance costs
including a capital increase element are added to the asset to which they refer and depreciated ac-
cording to the residual period of utilisation of the relevant asset.
The annualised depreciation rates generally adopted are as follows:
Land and buildings
- land -
- residential buildings -
- industrial buildings 4%
- light buildings 10%
Plants and machinery
- plants and machinery - general 7.5% - 10%
- plants and machinery - specific 10% - 12%
Fixtures and fittings, tools and equipment
- other small equipment 25%
- cylinders 9%
- distribution plants 9%
- treatment plants 15%
- base units 17.5%
- remote-measurements 20%
Other assets
- motor vehicles 20%
- motor cars 25%
- furniture and furnishings 12%
- electronic office machines 20%
The depreciation rate of an asset is reduced by 50% in the financial year in which it is purchased,
since we deem this is a method that reasonably approximates the temporal distribution of purchased
assets during the financial year.
Assets that are the subject of finance lease contracts are stated among industrial fixed assets in con-
formity with their class and are systematically depreciated, just as the proprietary assets, according
28N
otes
to
the
cons
olid
ated
fin
anci
al s
tate
men
ts S
ol G
roup

29
to their residual useful life.A balancing entry is made against the relevant short and medium term
obligation in respect of the lessor; rentals are transferred from the costs for use of assets owned by
others and the interest share concerning the reporting year is charged to financial expense. In this
way finance lease transactions are reported in accordance with the so-called “financial method” set
out by the International Accounting Standard I.A.S. 17 that represents the economic substance of
the outstanding finance lease contracts more correctly.
Financial investments
Shares in non-consolidated companies
Fixed investments comprising equity investments in non-consolidated companies are valued at
cost, written down to account for long-term losses in value.
Equity investments in associated companies
Equity investments in associated companies are valued according to the equity accounting method,
i.e. for an amount equal to the stake held in the shareholders’ equity resulting from the last Balance
Sheet of the said companies, after deducting dividends and making the adjustments required by the
accounting principles regarding the preparation of consolidated Financial Statements.
Other financial investments held as fixed assets
Other equity investments and securities are valued at cost. Proper adjustments are made in the case
of a permanent decrease in value, also arising from market quotations as far as listed securities are
concerned, and the prior value is reinstated, in the financial year in which there is no further rea-
son for such a write-down.
Other financial investments representing loans are reported at their estimated realisation value.
Own shares
Own Shares have been valued at cost based on the LIFO method, possibly adjusted to reflect long-
term losses in value.
Stocks
Stocks held in the warehouse are entered at the lower value between the purchase or production
cost, including accessory changes and the estimated realisable value inferable on the basis of the mar-
ket trend.The cost structure generally adopted is denominated as the LIFO method with annual
steps (last-in, first-out).The net realisable value is calculated on the basis of the net sales price less
both possible costs of production to be further incurred and direct sales costs.
Work in progress on contracts is reported on the basis of the accumulated costs incurred at the end
of the financial year.
Stocks regarding obsolete or slow-moving items are written down to take account of actual possi-
bilities of utilisation and realisation.
Not
es t
o th
e co
nsol
idat
ed f
inan
cial
sta
tem
ents
Sol
Gro
up

Receivables
Receivables are entered at their estimated realisable value, taking into account the degree of sol-
vency of each debtor, maturity, outstanding doubtful accounts and enforceable guarantees.
Adjustment of the nominal value of receivables to that of their estimated realisable value is made
through specific provisions for doubtful accounts,directly deducted from the corresponding asset item.
Long-term receivables are entered in the Balance Sheet among financial fixed assets and reported
at their estimated realisable value.
Amounts receivable expressed in non-Euro currencies are valued using the year-end exchange rates.
Financial investments which are not permanent
Securities not held as fixed assets are reported at the lower value between the purchase price or es-
timated realisable value as per market quotations.The said lower value is not maintained if the rea-
sons thereof no longer apply.
Cash and cash at bank
Liquid assets are entered at their nominal value.
Prepayments and accrued income
These items include the reporting year’s share of assets and liabilities affecting two or more finan-
cial years, whose amount is dependent upon time.
Provisions for risks and charges
Provisions for risks and charges are made to cover specific losses or amounts payable, certain or like-
ly to be incurred, but for which the amount or the date on which they will arise is uncertain at the
closing date for the financial year. Risks for which the occurrence of a liability is only possible are
indicated in the explanatory notes. Provisions for risks and charges include the item provisions for
deferred taxation. Provisions reflect the best possible estimate based on the information available.
Employee severance indemnity
The employee severance indemnity represents the whole accumulated liability to employees, net of
advances paid up at the end of the financial year, calculated in accordance with legislation, the col-
lective labour agreements and any possible company employment agreements in force.
Payables
Payables are reported at their nominal value, adjusted for returns or invoicing modifications.
Liabilities for down payments received against the provision of services and contract work in
progress, are classified in the item “Down payments”, while those not collected are directly set off
against the amounts receivable.
Amounts payable expressed in non-Euro currencies are valued using the year-end exchange rates.
30N
otes
to
the
cons
olid
ated
fin
anci
al s
tate
men
ts S
ol G
roup

31
Contingent liabilities, commitments and guarantees
The guarantees included in the memorandum accounts represent guarantees stated at the value cor-
responding to the amount still due as regards loans in respect of which such guarantees were issued.
Real guarantees on proprietary assets are detailed in the Explanatory Notes.
Possible commitments undertaken to purchase and sell foreign currencies are reported in the mem-
orandum accounts at their notional amount, converted at the contractual rate of exchange in the
case of options and at the forward rate of exchange as regards forward foreign exchange contracts.
Conversion criteria for items denominated in currencies other than those adhering to the euro
Monetary items expressed in currencies other than those adhering to the Euro are stated at the rates
of exchange current when they were recorded in the accounts.Any negative or positive differences
arising from the adjustment of foreign currency receivables and payables using the year-end rates, are
recorded in specific Balance Sheet items and reclassified in item 17 bis of the Profit and Loss Account.
Recording of revenues and income, costs and charges
Revenues and income, costs and charges are entered net of returns, discounts, allowances and pre-
miums, as well as taxes directly associated with the sale of goods and the services rendered. Rev-
enues from the sale of goods are recorded when the right of ownership on the relevant goods is
transferred, which normally occurs at the time they are delivered or shipped. Financial revenues are
recorded on an accrual basis.
Income tax
Income tax is determined on the basis of the taxable income of each consolidated company pur-
suant to the tax provisions in force in each country.Amounts due to the tax authorities are report-
ed net of advances paid and tax withheld in the item “Amounts due to the tax authorities”. Fiscal
benefits deriving from fiscal losses are recorded in the Profit and Loss Account of the year in which
such losses are used to offset profits. Provisions for deferred and prepaid taxes have been provided
for on significant differences of a temporary nature between the value of a given asset or liability
based on statutory criteria and the value assigned to that given asset or liability for tax reporting
purposes, by adopting the estimated tax rate in force at the time the temporary differences will be
reversed. Shareholders are informed that SOL SpA, together with the subsidiary Sol Welding Srl, ad-
hered to the national tax consolidation (Italian Legislative Decree No. 344 dated 12 December 2003).
Capital contributions
Capital contributions received from the 1998 financial year, entered in the Profit and Loss Account
as “other operating income”, are recorded over more financial years in accordance with the accru-
al accounting method. Contributions received in previous financial years have been charged to an
equity reserve at 50%; the remaining 50% has been recorded in the Profit and Loss Account over 5
or 10 years according to the time of their disbursement.
Not
es t
o th
e co
nsol
idat
ed f
inan
cial
sta
tem
ents
Sol
Gro
up

ASSETSA) Called up share capital not paid
Balance as at 12.31.04 377,327
Balance as at 12.31.03 -
Movement 377,327
Description 12.31.2004 12.31.2003 Movement
Called part 377,327 - 377,327
Part not called - - -
Total 377,327 - 377,327
B) Fixed Assets
I - Intangible fixed assets
Balance as at 12.31.04 4,478,292
Balance as at 12.31.03 5,143,226
Movement (664,934)
Analysis of intangible assets
Movements in intangible fixed assets were as follows:
Items Balance Increases Revaluations Other (Amor- Balance12.31.2003 (Write-downs) movements tisation) 12.31.2004
Start-up and expansion costs 411,421 13,972 - (4,457) (121,987) 298,949
Costs of research, development and advertising 198,445 7,313 - (8,002) (141,997) 55,759
Industrial patents and rights to use
intellectual property 259,025 220,138 - (38,181) (197,866) 243,116
Concessions, licenses, trade marks and similar rights 520,879 310,256 - 32,914 (253,102) 610,947
Goodwill 1,107,643 - - 8,376 (171,198) 944,821
Assets in course of construction and down payments 34,892 - - (34,892) - -
Other 1,431,195 142,458 - 118,766 (429,349) 1,263,070
Consolidation difference 1,179,726 649,782 - - (767,878) 1,061,630
Total 5,143,226 1,343,919 - 74,524 (2,083,377) 4,478,292
The item “Start-up and expansion costs” for the most part includes costs incurred relating to the
share capital transactions of consolidated companies and for start-up of new plant.
The item “Costs for research, development and advertising” refers mainly to costs incurred to en-
ter European markets.
The item “Industrial patents and rights” refers almost exclusively to costs incurred for the acquisi-
tion of software.The increases for the period are mainly due to charges relating to implementation
of the new software, amortised over 3 years.
32N
otes
to
the
cons
olid
ated
fin
anci
al s
tate
men
ts S
ol G
roup

33
The item “Concessions, licenses and trademarks”comprises almost exclusively costs incurred to ob-
tain user licenses for new software, amortised over a period of 5 years.
The item “Goodwill”mainly includes the values which have merged at the time of mergers of com-
panies in prior years and for the purchase of business segments. Such goodwill is amortized over a
maximum period of 10 years on the basis of the estimated period of economic return of the in-
vestment, taking into consideration the sector in which the companies operate.
The item “Other” primarily includes costs with a useful working life of more than one year which
are being amortised over the same period as that estimated for the income related thereto.They
mainly comprise costs incurred in connection with:
• mergers with other companies
• notary public fees and miscellaneous expenses on medium-term loans
• restructuring works carried out on leased premises
• costs incurred for the construction of the aqueduct owned by the Consortium CIGRI, which
supplies industrial water to the Piombino plant.These costs are amortised over 15 years accord-
ing to the relevant agreement’s maturity terms of the agreement
The item “Consolidation difference” refers to:
• the difference between the purchase price of an additional 15.55% of the equity investment in
the subsidiary VIVISOL Centro Adriatica Srl (merged with VIVISOL Srl during the second half
of 2002) and the adjusted shareholders’ equity value of the same company as at 12.31.1999, equal
to Euro 311,785 (current net value Euro 0).
• the difference between the purchase price of the remaining 14.45% of the equity investment in
the subsidiary VIVISOL Centro Adriatica Srl (merged with VIVISOL Srl during the second half
of 2002) and the adjusted shareholders’ equity value of the same company as at 12.31.2000, equal
to Euro 268,336 (current net value Euro 53,667).
• the difference between the purchase price of the equity investment in the subsidiary France Oxy-
gene Sarl and the adjusted shareholders’ equity value thereof as at 31.07.2000, equal to Euro
1,583,973 (current net value Euro 0).
• the difference between the purchase price of the equity investment in the subsidiary T.G.T.A.D.
and the shareholders’ equity value thereof as at 12.31.2001, equal to Euro 66,300 (current net val-
ue Euro 13,260).
• the difference between the purchase price of the equity investment in the subsidiary Behringer
Srl and the adjusted shareholders’ equity of the same company as at 12.31.2002, equal to Euro
764,800 (current net value Euro 458,880).
• the difference between the purchase price of an additional 15% of the equity investment in the
subsidiary VIVISOL Brescia Srl and the adjusted shareholders’ equity value thereof as of 31 De-
cember 2002, equal to Euro 68,600 (current net value Euro 41,160).
Not
es t
o th
e co
nsol
idat
ed f
inan
cial
sta
tem
ents
Sol
Gro
up

• the difference between the purchase price of the equity investment in the subsidiary Il Point Srl
and the shareholders’ equity of the same company as of 31 March 2004, equal to Euro 117,828
(current net value Euro 94,263).
• the difference between the purchase price of the equity investment in the subsidiary Oxymed
Medizintechnik GmbH and the shareholders’ equity thereof as of 30 June 2004, equal to Euro
500,500 (current net value Euro 400,400).
As for the amortization for the period broken down by class of assets, please see the detail given in
the notes concerning the Profit and Loss Account.
II - Tangible fixed assets
Balance as at 12.31.04 225,202,254
Balance as at 12.31.03 204,079,202
Movement 21,123,052
Analysis of tangible assets
Movements in tangible assets during the year, with reference to their historical cost, depreciation
and net value are as follows:
Movements in tangible Balance Increases Revalu- Other (Disposals) Balanceassets cost 12.31.2003 ations movements 12.31.2004
Land and buildings 68,187,798 2,320,752 181,657 (213,253) (418,286) 70,058,668
Plants and machinery 188,843,363 9,395,837 - (590,344) (55,785) 197,593,071
Fixtures and fittings, tools and equipment 231,305,443 24,594,780 - (349,548) (1,387,998) 254,162,677
Other assets 19,407,921 3,050,827 - 736,499 (341,050) 22,854,197
Assets in course of construction and down payments 8,004,339 14,028,393 - (32,081) - 22,000,651
Total 515,748,864 53,390,589 181,657 (448,727) (2,203,119) 566,669,264
Movements in accumulated Balance Depreciation Write-downs Other (Disposals) Balancedepreciation 12.31.2003 (amortisation) movements 12.31.2004
Land and buildings 28,000,232 2,547,402 - 186,749 (339,492) 30,394,891
Plants and machinery 117,376,268 11,116,264 - (17,342) (39,882) 128,435,308
Fixtures and fittings, tools and equipment 152,199,661 19,049,567 - (3,724,751) (1,077,976) 166,446,501
Other assets 14,093,501 2,178,103 - 203,423 (284,717) 16,190,310
Assets in course of construction and down payments - - - - - -
Total 311,669,662 34,891,336 - (3,351,921) (1,742,067) 341,467,010
34N
otes
to
the
cons
olid
ated
fin
anci
al s
tate
men
ts S
ol G
roup

35
Movements in tangible assets Balance Increases (Amortisation Other (Disposals) BalanceNet value 12.31.2003 & write-downs) movements 12.31.2004
Land and buildings 40,187,566 2,502,409 (2,547,402) (400,002) (78,794) 39,663,777
Plant and machinery 71,467,095 9,395,837 (11,116,264) (573,002) (15,903) 69,157,763
Fixtures and fittings, tools and equipment 79,105,782 24,594,780 (19,049,567) 3,375,203 (310,022) 87,716,176
Other assets 5,314,420 3,050,827 (2,178,103) 533,076 (56,333) 6,663,887
Assets in course of construction and down payments 8,004,339 14,028,393 - (32,081) - 22,000,651
Total 204,079,202 53,572,246 (34,891,336) 2,903,194 (461,052) 225,202,254
• The investments made during the financial year in respect of the item “Land and buildings” are
mainly investments made by the Parent Company (Euro 1,496 thousand) and the subsidiary
companies BTG Bvba (Euro 429 thousand) and TGS d.o.o. (Euro 136 thousand).
• Acquisitions made during the financial year under the item “Plant and machinery”are mainly due
to the purchase of plant for the Parent Company’s factories (Euro 7,675 million) and those of the
subsidiary TPJ d.o.o. (Euro 704 thousand) and to a lesser extent to other capital expenditure car-
ried out by all other group companies.
• The item “Other fixtures and fittings, tools and equipment” comprises commercial equipment
(supplying devices, cylinders, base units, concentrators and medical appliances) as well as other
small equipment.The increase recorded for the financial year was due to investments in com-
mercial equipment in the form of cylinders, dispensing devices and tanks, made by companies of
the technical gases sector for Euro 14,704 thousand (including Euro 4,052 by the Parent Com-
pany) and to investments made by companies operating in the home care sector for Euro 9,891
thousand (including Euro 3,799 thousand by the company VIVISOL Srl), in respect of base units
and other medical appliances.
• The item “Other assets” includes motor vehicles and motor cars, electric office equipment, fur-
niture and fixtures,EDP systems.The increase recorded for the financial year relates to investments
made for motor vehicles, laboratory equipment, hardware, furniture and fixtures,with Euro 1,128
thousand of the total reported pertaining to the Parent Company and the subsidiary companies
C.T.S.SpA (Euro 710 thousand),TGS A.D. (Euro 214 thousand),UTP d.o.o. (Euro 112 thousand),
France Oxygene Sarl (Euro 132 thousand) and BTG Bvba (Euro 168 thousand).
• The item “Assets in course of construction” mainly refers to investments being made by the Parent
Company (Euro 643 thousand) and by the subsidiaries SPG-SOL d.o.o. (Euro 10,586 thousand) and
SOL SEE d.o.o. (Euro 2,836 thousand).The amounts concern the construction of new plant
Revaluations carried out during the year, totalling Euro 181,657, relate to monetary revaluations
made by Zeus S.A. in accordance with local legislation.
As for the amortization for the period broken down by class of assets, please see the detail given in
the notes concerning the Profit and Loss Account.
Please note that the sites located in Monza, Marcianise, Padua, Piombino, Cuneo, Salerno,Verona,
Not
es t
o th
e co
nsol
idat
ed f
inan
cial
sta
tem
ents
Sol
Gro
up

Vibo Valentia, Zola Predosa, Pavia, Pisa, Sesto San Giovanni, Ravenna, Pomezia, Catania, Ancona,
Brescia,Mantua,Romans d’Isonzo,Lessines and Jesenice are encumbered with mortgages and liens per-
taining to medium-term loan agreements entered into by a number of Group companies with banks.
As of 31 December 2004, mortgages amounted to Euro 107,577 thousand.
As of 31 December 2004, liens amounted to Euro 93,986 thousand.
Reference should be made to the reconciliation between the Parent Company’s profit and share-
holders’ equity and the consolidated profit and shareholders’ equity given below as regards the ef-
fects of eliminating fiscal interference and of accounting for leases in accordance with the Interna-
tional Accounting Standard I.A.S. 17.
III - Financial investments
Balance as at 12.31.04 4,404,691
Balance as at 12.31.03 4,609,991
Movement (205,300)
Equity investments
Balance as at 12.31.04 527,390
Balance as at 12.31.03 550,962
Movement (23,572)
The breakdown for the above item is as follows:
Description 12.31.2004 12.31.2003
G.T.E. S.L. 11,224 11,224
Cryo-Cell Italia Srl in liquidation - 20,760
Non-consolidated subsidiary companies 11,224 31,984
CONSORGAS Srl 449,321 448,074
Medical System 18,075 18,075
Ionia Oxigono e.p.e. 8,186 9,279
Associated companies 475,582 475,428
Other equity investments 40,584 43,550
Other companies 40,584 43,550
Total 527,390 550,962
With the exception of Euro 26,261 recorded among equity investments in associated companies
(of which Euro 18,075 concerning the subsidiary AIRSOL B.V. and Euro 8,186 concerning the
subsidiary HGT S.A.) and Euro 26,977 recorded among other minor equity investments (of which
Euro 23,944 relating to investments in local companies made by the subsidiary T.G.S.A.D.), all the
above equity investments are held by the Parent Company
The equity investments in other companies were valued at cost.
36N
otes
to
the
cons
olid
ated
fin
anci
al s
tate
men
ts S
ol G
roup

37
Receivables
Balance as at 12.31.04 1,039,640
Balance as at 12.31.03 1,257,939
Movement (218,299)
The breakdown for the above item is as follows:
Description 12.31.2004 12.31.2003 Movement
Amounts due from non-consolidated group companies - - -
Amounts due from associated companies - - -
Amounts due from parent companies - - -
Amounts due from third parties 1,039,640 1,257,939 (218,299)
Total 1,039,640 1,257,939 (218,299)
The breakdown for the item “Amounts due from third parties” is as follows:
Description 12.31.2004 12.31.2003 Movement
Guarantee deposits 509,349 453,952 55,397
Tax credit pertaining to Employee Severance Indemnity 504,664 580,054 (75,390)
Other 25,627 223,933 (198,306)
Total 1,039,640 1,257,939 (218,299)
The breakdown for the balance is shown by maturity date:
Description Falling due Falling due Total Totalwithin more than after more than 12.31.2004 12.31.2003
12 months 12 months
Guarantee deposits - 509,349 509,349 453,952
Tax credit pertaining to Employee Severance Indemnity - 504,664 504,664 580,054
Other - 25,627 25,627 223,933
Total - 1,039,640 1,039,640 1,257,939
The above-mentioned amounts refer almost exclusively to the Parent Company.
None of the above amounts has a maturity exceeding 5 years.
Not
es t
o th
e co
nsol
idat
ed f
inan
cial
sta
tem
ents
Sol
Gro
up

Other securities
Balance as at 12.31.04 520,587
Balance as at 12.31.03 484,016
Movement 36,571
The breakdown for the item “Other securities” is as follows:
Description 12.31.2004 12.31.2003 Movement
Pledged securities – SOL Tecnische Gase 4,276 4,276 -
VIVISOL Heimbehand securities. 2,381 2,381 -
Other securities - ICOA S.r.l. 513,930 477,359 36,571
Total 520,587 484,016 36,571
Other securities held by ICOA S.r.l. are represented by bonds issued by Ambroveneto (Euro
72,289), bonds issued by Interbanca (Euro 343,000) and bonds issued by Banca Intesa (Euro
98,640).
The above-mentioned securities have the following characteristics:
Description Book value Par value Maturity Currency Rate of interest Market value
AMBROVENETO 72,290 72,304 01/01/2005 Euro Variable 72,290
INTERBANCA 343,000 350,000 21/10/2006 Euro Variable 343,000
BANCA INTESA 98,640 100,000 30/01/2009 Euro Variable 98,640
Own shares
Balance as at 12.31.04 2,317,074
Balance as at 12.31.03 2,317,074
Movement -
We hereby confirm that this portfolio, equal to 1.31% of the share capital, comprises 1,188,000
ordinary shares with a par value of Euro 0.52, purchased by way of implementing the resolution
duly approved by the Shareholders’ Meeting held on 28 April 2000.
A special reserve included as part of shareholders’ equity has been pledged in respect to these
securities.
As of 31 December 2004, the share price came to Euro 4.23 per share, producing a total equivalent
value for capital of Euro 5,025,240.
The changes which have taken place during the accounting period are shown below:
Balance Increases (Disposals) Revaluations Other Balance12.31.2003 (Write-downs) movements 12.31.2004
Own shares 2,317,074 - - - - 2,317,074
Total 2,317,074 - - - - 2,317,074
38N
otes
to
the
cons
olid
ated
fin
anci
al s
tate
men
ts S
ol G
roup

39
C) Current assets
I - Stocks
Balance as at 12.31.04 28,841,563
Balance as at 12.31.03 25,271,602
Movement 3,569,961
The breakdown for the above item is as follows:
Description 12.31.2004 12.31.2003 Movement
Raw materials, subsidiary materials and consumables 1,568,045 1,910,404 (342,359)
Work in progress and semi-finished goods 738,102 686,854 51,248
Works in progress on contracts 8,284,967 6,607,271 1,677,696
Finished goods and goods for resale 18,250,449 16,067,073 2,183,376
Down payments - - -
Total 28,841,563 25,271,602 3,569,961
The valorisation of the inventory does not emerge as any higher than the realizable value.
The valuation of stocks made at an annual average cost would not have been significantly different
from that resulting from the application of the method adopted.
The increase in the item “Finished goods and goods for resale” is due to new products marketed.
II - Receivables
Balance as at 12.31.04 144,717,012
Balance as at 12.31.03 138,807,596
Movement 5,909,416
The breakdown for the above item is as follows:
Description 12.31.2004 12.31.2003 Movement
Amounts due from clients 134,604,235 128,545,338 6,058,897
Amounts due from the tax authorities 5,431,084 6,068,900 (637,816)
Prepaid taxes 2,815,724 2,989,748 (174,024)
Amounts due from third parties 1,865,969 1,203,610 662,359
Total 144,717,012 138,807,596 5,909,416
The balance is broken down by maturity date:
Description Falling due Falling due In doubtful Total Totalwithin after more accts 12.31.2004 12.31.2003
12 months than 12 months
Amounts due from clients 144,312,168 - (9,707,933) 134,604,235 128,545,338
Amounts due from the tax authorities 5,431,084 - - 5,431,084 6,068,900
Prepaid taxes 2,814,605 1,119 - 2,815,724 2,989,748
Amounts due from third parties 1,836,009 29,960 - 1,865,969 1,203,610
Total 154,393,866 31,079 (9,707,933) 144,717,012 138,807,596
Not
es t
o th
e co
nsol
idat
ed f
inan
cial
sta
tem
ents
Sol
Gro
up

There are no amounts receivable after more than 5 years.
Provision for doubtful debts recorded the following movements:
12.31.2003 Provisions (Uses) 12.31.2004
10,361,475 3,088,261 (3,741,803) 9,707,933
The detailed breakdown of the item “Amounts due from the tax authorities” is as follows:
Description 12.31.2004 12.31.2003 Movement
Amounts receivable in respect of income tax 1,512,349 1,897,144 (384,795)
VAT receivables 3,813,695 4,034,665 (220,970)
Other amounts due from the tax authorities 105,040 137,091 (32,051)
Total 5,431,084 6,068,900 (637,816)
The detailed breakdown of the item “Prepaid taxes” is as follows:
Description 12.31.2004 12.31.2003 Movement
As per statutory financial statements
Prepaid taxes for provisions for doubtful receivables 1,592,181 1,719,839 (127,658)
Prepaid taxes for risk provisions 225,331 66,000 159,331
Other minor 777,688 955,799 (178,111)
Total 2,595,200 2,741,638 (146,438)
From consolidation transactions
Prepaid taxes on internal gains 220,524 248,110 (27,586)
Total 220,524 248,110 (27,586)
TOTAL 2,815,724 2,989,748 (174,024)
The tax losses carried forward pertaining to certain companies, amounting to approximately Euro
30 million, have not been taken into account for the purposes of the calculation of the prepaid
taxes since there is no reasonable certainty of generating taxable income in the immediate future
which would be capable of absorbing these losses.
The detailed breakdown for the item “Amounts due from third parties” is as follows:
Description 12.31.2004 12.31.2003 Movement
Amounts due from staff 485,076 379,220 105,856
Other receivables 1,380,893 824,390 556,503
Total 1,865,969 1,203,610 662,359
All “Other receivables” are considered as collectable and therefore no value adjustment was made.
40N
otes
to
the
cons
olid
ated
fin
anci
al s
tate
men
ts S
ol G
roup

41
III - Financial investments which are not permanent
Balance as at 12.31.04 218,312
Balance as at 12.31.03 576,971
Movement (358,659)
The breakdown for this item is as follows:
Description 12.31.2004 12.31.2003 Movement
Equity investments in Arena Tourist 38,024 38,082 (58)
Other equity investments 38,024 38,082 (58)
Open-end investment company (SICAV) 30 30 -
Genercomit funds 163,614 163,614 -
Other fixed-income securities 16,644 375,245 (358,601)
Total other securities 180,288 538,889 (358,601)
Total 218,312 576,971 (358,659)
The equity investment in “Arena Tourist” is held by the subsidiary U.T.P. D.o.o..
Quotas in open-end investment companies are held by the subsidiary company SOL France Sas.
Shares in the Genercomit Tesoreria Fund are held by the subsidiary ICOA Srl.
The other fixed-income securities comprise private bonds held by the subsidiary company U.T.P.D.o.o..
IV - Cash at bank and in hand
Balance as at 12.31.04 21,887,585
Balance as at 12.31.03 24,310,394
Movement (2,422,809)
The breakdown for this item is as follows:
Description 12.31.2004 12.31.2003 Movement
Post Office and bank deposits 21,620,926 24,001,693 (2,380,767)
Bank cheques - 13,036 (13,036)
Cash and cash equivalents on hand 266,659 295,665 (29,006)
Total 21,887,585 24,310,394 (2,422,809)
The above balance represents the liquid assets and cash and cash equivalents existing at the end of
the financial year.
Not
es t
o th
e co
nsol
idat
ed f
inan
cial
sta
tem
ents
Sol
Gro
up

D) Prepayments and accrued income
Balance as at 12.31.04 837,859
Balance as at 12.31.03 635,668
Movement 202,191
These represent the harmonising items for the financial period entered on an accrual basis.
The breakdown for this item is as follows:
Description 12.31.2004 12.31.2003 Movement
Accrued income:
Interest receivable 7,407 11,264 (3,857)
Other accrued income 54,403 82,997 (28,594)
Total accrued income 61,810 94,261 (32,451)
Prepayments:
Insurance premiums 276,179 48,706 227,473
Rents 52,816 58,352 (5,536)
Prepaid expenses 92,624 82,635 9,989
Other prepayments 354,430 351,714 2,716
Total prepayments 776,049 541,407 234,642
Total prepayments and accrued income 837,859 635,668 202,191
The item “Other prepayments” mainly comprises invoices referred to maintenance agreements or
other agreements of a long-term nature.
42N
otes
to
the
cons
olid
ated
fin
anci
al s
tate
men
ts S
ol G
roup

43
LIABILITIESA) Shareholders’ equity
Balance as at 12.31.04 231,897,077
Balance as at 12.31.03 219,776,572
Movement 12,150,505
The share capital of SOL SPA as at 12.31.04 comprised No. 90,700,000 ordinary shares with a par
value of Euro 0.52 each, fully subscribed and fully paid up.
The breakdown of and movements in shareholders’ equity at year-end is detailed below:
Net Equity Balance Transfer Dividends Translation Other Result Balance12.31.2003 of result paid differences movements 12.31.2004
Pertaining to the Group:Share capital 47,164,000 - - - - - 47,164,000 Share premium account 63,334,927 - - - - - 63,334,927 Revaluation reserves - - - - - - -Legal reserve 3,097,354 341,666 - - - - 3,439,020 Reserve for own shares 2,317,074 - - - - - 2,317,074 Statutory reserves - - - - - - -Other reserves - - - - Extraordinary reserve 31,473,537 1,031,658 - - - - 32,505,195 Reserves subject to deferred taxation 4,106,867 - - - - - 4,106,867Reserve for translation difference (2,755,078) - - (971,334) - - (3,726,412)Undistributed earnings of subsidiaries and other reserves 42,393,598 8,370,139 - - 1,738,484 - 52,502,221 Consolidation reserve 5,871,593 - - - - - 5,871,593 Other reserves 587,234 - - - - - 587,234 Profits (losses) carried forward - - - - - - -Profit (loss) for the financial year 15,203,451 (9,743,463) (5,459,988) - - 16,505,082 16,505,082
Total group shareholders’ equity 212,794,557 - (5,459,988) (971,334) 1,738,484 16,505,082 224,606,801
Minority interests:Capital and reserves pertaining to minority interests 7,012,799 (30,784) - - (88,796) - 6,893,219 Profit (loss) pertaining to minority interests (30,784) 30,784 - - - 397,057 397,057 Total shareholders’ equity pertaining to minority interests 6,982,015 - - - (88,796) 397,057 7,290,275
Total Shareholders’s Equity 219,776,572 - (5,459,988) (971,334) 1,649,688 16,902,139 231,897,077
The share capital, legal reserve, extraordinary reserve and the non-taxable provisions and reserves
reflect the amounts reported in the Parent Company’s Financial Statements as at 31 December 2004.
Not
es t
o th
e co
nsol
idat
ed f
inan
cial
sta
tem
ents
Sol
Gro
up

The “Consolidation reserve” appearing in the consolidated balance sheet as of 31 December 2004
reflects:
• the difference between the acquisition value of the equity investment in AIRSOL BV and the
shareholders’ equity value of the group on the date of acquisition (Euro 1,046,659).
• the difference between the acquisition value of the equity investment in TGP A.D. and the share-
holders’ equity value of the same company as at 31 December 2002 (Euro 75,356).
• the difference between the acquisition value of an additional 13.35% of the equity investment in
TGP A.D. and the shareholders’ equity value of the same company as at 31 December 2002 (Eu-
ro 12,407).
• the difference between the acquisition value of the equity investment in ENERGETIKA Z.J.
D.o.o. and the adjusted shareholders’ equity value of the same company, the capital gains pertain-
ing to the investments held as at 31 December 2002 (Euro 3,686,149) duly being taken into ac-
count.
• the difference between the acquisition value of an additional 12.67% of the equity investment in
ENERGETIKA Z.J. D.o.o. and the adjusted shareholders’ equity of the same company, the cap-
ital gains pertaining to the investments held as at 31 December 2003 (Euro 652,414) duly being
taken into account.
• the difference between the acquisition value of an additional 23.54% of the equity investment in
TGT A.D. and the shareholder’s equity value of the same company as at 31 December 2003 (Eu-
ro 228,380).
• the difference between the acquisition value of an additional 20.42% of the equity investment in
TGK A.D. and the shareholders’ equity value of the same company as at 31 December 2003 (Eu-
ro 170,228).
The change in the item “Capital and reserves pertaining to minority interests” was mainly gener-
ated by the increase of additional equity investments in SOL Welding Srl., SOL SEE d.o.o.,TGK
AD, HGT S.A. and Zeus S.A., the inclusion within the scope of consolidation of the company Il
Point Srl and the deconsolidation of ESSETI Deutschland GmbH.
44N
otes
to
the
cons
olid
ated
fin
anci
al s
tate
men
ts S
ol G
roup

45
Reconciliation between the equity and economic position of the Parent Company and theconsolidated equity and economic position.
Net Profit Shareholders’ EquityFor the Group Minority interests For the Group Minority interests
BALANCES AS PER THE EQUITY AND ECONOMIC POSITION FOR THE PARENT COMPANY 28,503,240 - 181,957,557 -
Effect of writing off the value adjustments and the amounts provided for exclusively in compliance with tax regulations net of fiscal effects:- Excess accelerated depreciation due to tax interference (26,898,285) (134,617) - -
Elimination of inter-company transactions,net of tax effects:- Internal profit on tangible fixed assets 35,789 1,018 (446,890) (4,679)- Internal profit on intangible fixed assets 44,566 2,090 (132,080) (14,630)- Reversal of adjustments to investments
in subsidiary companies 10,537,558 (48,625) - - - Dividends paid by consolidated companies (932,318) (11,025) - -
Adjustment of accounting policies to achieve consistent Group accounting policies, net of tax effects:- Adjustment of rates of exchange 185,228 - 185,228 - - Use of finance lease method for leased assets (6,305) 6,925 2,225,815 12,020 - Use of finance lease method for assets leased
to third parties - - - - - Valuation at equity of companies reported at cost 325 (42) 314,227 (21)- Tax on subsidiaries’ undistributed profits - - - -
Carrying value of consolidated equity investments - - (111,587,736) -
Shareholders’ equity and financial year’s results of consolidated companies 5,854,615 512,879 151,231,173 7,188,693
Allocation of the difference to the assets of the companiesand relative depreciation, amortisation and write-downs:- Tangible fixed assets (58,355) 18,149 (202,123) 108,893 - Goodwill on consolidation (767,878) - 1,061,630 -
Effect of other adjustments:- Change in consolidation basis 6,902 50,305 - -
BALANCES AS PER THE CONSOLIDATED EQUITY AND ECONOMIC POSITION 16,505,082 397,057 224,606,801 7,290,276
B) Provisions for risks and charges
Balance as at 12.31.04 20,642,677
Balance as at 12.31.03 18,043,448
Movement 2,599,229
The breakdown for the item “Provisions for risks and charges” is as follows:
Description 12.31.2004 12.31.2003 Movement
Provisions for pensions and similar obligations - - -
Taxation, also deferred 19,804,418 16,991,852 2,812,566
Other:
- Provisions for exchange rate fluctuations - 2,980 (2,980)
- Other minor provisions 838,259 1,048,616 (210,357)
Total other provisions 838,259 1,051,596 (213,337)
Total 20,642,677 18,043,448 2,599,229
Not
es t
o th
e co
nsol
idat
ed f
inan
cial
sta
tem
ents
Sol
Gro
up

The item “Provision for taxes” represents the net balance of deferred tax liabilities provided for in
the consolidated financial statements as of 31 December 2004 with regard to items having a fiscal
nature stated in the statutory financial statements of the Group companies (accelerated deprecia-
tion) and of deferred tax liabilities referring to the other consolidation entries; the item comprises.
Description 12.31.2004 12.31.2003 Movement
As per the statutory financial statements
Deferred taxes on capital gains 591,695 314,392 277,303
Deferred taxes on depreciation 17,599,059 - 17,599,059
Other minor 8,858 8,349 509
Total accrued income 18,199,612 322,741 17,876,871
From consolidation operations
Deferred taxes on leasing 1,353,863 1,352,592 1,271
Deferred taxes for accelerated depreciation - 15,006,256 (15,006,256)
Deferred taxes on the revaluation of assets 250,943 310,263 (59,320)
Total 1,604,806 16,669,111 (15,064,305)
Total 19,804,418 16,991,852 2,812,566
The item “Other minor provisions” refers to provisions for risks not specifically referable to items
carried under assets.
C) Employee severance indemnity
Balance as at 12.31.04 9,652,260
Balance as at 12.31.03 8,921,298
Movement 730,962
Movements in staff severance fund were as follows:
Balance Allocation (Uses) Other Balance12.31.2003 movements 12.31.2004
Movements in employee severance provision
Total 8,921,298 1,404,048 (702,762) 29,676 9,652,260
The reserve represents the company’s entire liability as of 31 December 2004 accrued by the em-
ployees on the payroll as of that date, net of any advances paid.
46N
otes
to
the
cons
olid
ated
fin
anci
al s
tate
men
ts S
ol G
roup

47
D) Payables
Balance as at 12.31.04 165,705,478
Balance as at 12.31.03 153,524,073
Movement 12,181,405
The detailed breakdown of the item ‘Payables’ is as follows:
Description 12.31.2004 12.31.2003 Movement
Bonds - - -
Convertible bonds - - -
Amounts due to the shareholders for loans 43,890 - 43,890
Amounts due to banks 3,753,315 5,024,775 (1,271,460)
Amounts due to other lenders 92,156,222 83,493,399 8,662,823
Down payments 5,256,082 5,339,492 (83,410)
Amounts due to suppliers 52,069,980 46,478,737 5,591,243
Bills of exchange payable - - -
Amounts due to non-consolidated group companies - - -
Amounts due to associated companies 155,104 87,557 67,547
Amounts due to Parent companies - - -
Amounts due to the tax authorities 3,552,439 4,802,736 (1,250,297)
Amounts due to Social Security institutions 2,227,740 1,893,983 333,757
Other payables 6,490,706 6,403,394 87,312
Total 165,705,478 153,524,073 12,181,405
Payables are valued at their nominal value and are broken down according to maturity as follows:
Falling due within Falling due after Falling due Total Total12 months 12 months after more 12.31.2004 12.31.2003
than 5
Amounts due to shareholders for loans 43,890 - - 43,890 -
Amounts due to banks 3,744,008 9,307 - 3,753,315 5,024,775
Amounts due to other financiers 15,866,887 65,487,864 10,801,471 92,156,222 83,493,399
Down payments 5,256,082 - - 5,256,082 5,339,492
Amounts due to suppliers 52,069,980 - - 52,069,980 46,478,737
Amounts due to associated companies 155,104 - - 155,104 87,557
Amounts due to tax administration 3,552,439 - - 3,552,439 4,802,736
Amounts due to Social Security institutions 2,227,740 - - 2,227,740 1,893,983
Other payables 4,334,096 1,140,610 1,016,000 6,490,706 6,403,394
Total 87,250,226 66,637,781 11,817,471 165,705,478 153,524,073
Payables due beyond 5 years are broken down by geographic area s follows:
Description 12.31.2004 12.31.2003Italy EC Non EC Total Italy EC Non EC Total
Amounts due to other lenders 8,380,588 2,420,883 - 10,801,471 11,733,065 86,045 - 11,819,110
Other payables 1,016,000 - - 1,016,000 - - - -
Total 9,396,588 2,420,883 - 11,817,471 11,733,065 86,045 - 11,819,110
Not
es t
o th
e co
nsol
idat
ed f
inan
cial
sta
tem
ents
Sol
Gro
up

The item “Amounts due to other lenders” for the most part comprises loans granted by medium
and long-term credit institutions. Such loans are backed by liens on movable assets and mortgages
on real property, as already mentioned in the notes regarding tangible fixed assets. Furthermore, the
same item also includes amounts due to leasing companies equal to Euro 3,204 thousand, deriving
from the application of the international accounting standard IAS 17 on assets that are the object
of a finance lease.
The detailed breakdown for of the item “Amounts due to other lenders” is as follows (with values
expressed in thousands of Euro):
Finance institute Amount Short-term Rate of Maturity Value Originalamount interest amount
BNL 26 26 (f.r.) 2.71% 11.01.2005 ITL million 300
Deutsche Bank 13 13 (f.r.) 2.88% 19.01.2005 ITL million 400
Mediocredito Lombardo 16 16 (f.r.) 4.25% 31.03.2005 ITL million 500
MPS 9 9 (f.r.) 3.88% 30.11.2005 ITL million 70
Centrobanca 27 27 3.70% 31.12.2005 ITL million 286
Deutsche Bank 65 52 (f.r.) 2.88% 16.01.2006 Euro 207,000
Credito Emiliano 77 51 3.82% 17.02.2006 Euro 150,000
Mediocredito Centrale 709 473 3.20% 14.04.2006 ITL million 4,575
Banque Scalbert Dupont 11 7 3.80% 20.07.2006 Euro 14,000
IMI 3,680 1,394 7.66% 15.03.2007 ITL million 19,000
IMI 139 56 5.30% 15.06.2007 Euro 250,000
Credito Italiano 6,617 2,095 5.15% 30.06.2007 Euro 10,500,000
Credito Emiliano 956 309 (f.r.) 3.15% 01.08.2007 Euro 1,540,000
ERP 763 218 1.95% 01.01.2008 ATS 18,000,000
IMI 5,592 1,598 5.40% 15.03.2008 ITL million 24,750
Bank Austria 577 128 (f.r.) 2.88% 01.07.2009 ATS 15,000,000
Mediocredito Lombardo 1,665 333 5.80% 21.11.2009 Euro 1,831,000
Bank Austria 941 171 (f.r.) 2.88% 01.01.2010 ATS 20,000,000
Credito Emiliano 750 65 6.05% 14.06.2010 Euro 750,000
Mediocredito Centrale 4,500 393 (f.r.) 2.85% 30.06.2010 Euro 4,500,000
IMI 11,143 1,857 3.82% 15.12.2010 Euro 13,000,000
Banco di Brescia 3,000 455 3.77% 31.12.2010 Euro 3,000,000
Banco di Brescia 946 - 4.57% 30.06.2011 Euro 945,540
IMI 5,107 786 4.72% 15.09.2011 Euro 5,500,000
Banco di Brescia 8,000 999 4.39% 30.09.2011 Euro 8,000,000
IMI 6,563 938 5.50% 15.12.2011 Euro 7,500,000
IMI 7,300 - 4.12% 15.12.2012 Euro 7,300,000
IMI 7,500 938 3.34% 15.12.2012 Euro 7,500,000
Credito Italiano 4,000 - 4.10% 31.12.2012 Euro 4,000,000
Mediocredito Centrale 8,262 843 (f.r.) 2.85% 31.12.2012 Euro 8,263,000
Amounts due to leasing companies 3,204 1,620
Total 92,156 15,867
The interest rate of the IMI loan totalling Euro 7.5 million, which was originally floating, has been
made fixed by means of a specific IRS contract with an identical duration and for an identical
amount.
48N
otes
to
the
cons
olid
ated
fin
anci
al s
tate
men
ts S
ol G
roup

49
The item “Down payments” relates to the invoices issued and collected on for works still in progress
as of 31 December 2004 or for other down payments from customers.
The item “Amounts due to associated companies”, which refers to the supply of goods and servicesat arm’s length conditions, is broken down as follows:
12.31.2004 12.31.2003 Movement
CONSORGAS Srl 69,641 36,827 32,814
Medical System 85,463 50,730 34,733
Total 155,104 87,557 67,547
The breakdown for the item “Amounts due to the tax authorities” comprises:
Description 12.31.2004 12.31.2003 Movement
Amounts due in respect of income tax 1,311,016 2,593,174 (1,282,158)
Amounts due to Inland Revenue in respect of VAT 742,683 1,079,101 (336,418)
Amounts due to the tax authorities in respect of withholding tax 1,146,733 1,017,882 128,851
Other amounts due to the tax authorities 352,007 112,579 239,428
Total 3,552,439 4,802,736 (1,250,297)
The breakdown for the item “Other payables” is as follows:
Description 12.31.2004 12.31.2003 Movement
Accrued holidays not taken 2,266,020 2,174,833 91,187
Guarantee deposits 356,992 302,446 54,546
Amounts due for acquisition of equity investments 1,902,599 2,226,276 (323,677)
Amounts due to employees for wages and salaries 1,084,994 773,000 311,994
Other payables 880,101 926,839 (46,738)
Total 6,490,706 6,403,394 87,312
The item “Amounts due for acquisition of equity investments” includes the commitments of the
company SOL S.p.A. to repurchase shares in the companies SPG d.o.o. (Euro 469,814) and SOL
SEE d.o.o. (Euro 1,016,000) and ENERGETIKA ZJ (Euro 416,785) presently held by the com-
pany SIMEST SPA.
Not
es t
o th
e co
nsol
idat
ed f
inan
cial
sta
tem
ents
Sol
Gro
up

E) Accruals and deferred income
Balance as at 12.31.04 3,067,403
Balance as at 12.31.03 3,169,259
Movement (101,856)
These represent the harmonising items for the financial period entered on an accrual basis.
The breakdown for this item is as follows:
Description 12.31.2004 12.31.2003 Movement
Accrued liabilities:
Interest payable on loans 519,278 512,095 7,183
Other 722,919 633,402 89,517
Total accrued liabilities 1,242,197 1,145,497 96,700
Deferred income:
Lump sums granted 1,648,346 1,866,316 (217,970)
Rentals receivable 48,899 31,021 17,878
Other 127,961 126,425 1,536
Total deferred income 1,825,206 2,023,763 (198,556)
Total 3,067,403 3,169,259 (101,856)
The item “Lump sums granted” refers to capital contributions recorded in accordance with the ac-
crual accounting method.
MEMORANDUM ACCOUNTSMemorandum accounts
Balance as at 12.31.04 6,656,782
Balance as at 12.31.03 7,222,483
Movement (565,701)
Description 12.31.2004 12.31.2003 Movement
Guarantees given to third parties 6,398,298 6,841,266 (442,968)
Real guarantees given - - -
Other memorandum accounts 227,297 350,030 (122,733)
Guarantees received 31,187 31,187 -
Total 6,656,782 7,222,483 (565,701)
The guarantees given to third parties refer to guarantees issued in respect of loans granted to SOL
SpA and to group companies.
50N
otes
to
the
cons
olid
ated
fin
anci
al s
tate
men
ts S
ol G
roup

51
PROFIT AND LOSS ACCOUNTA) Value of production
Balance as at 12.31.04 333,054,775
Balance as at 12.31.03 304,439,605
Movement 28,615,170
The breakdown for this item is as follows:
Description 12.31.2004 12.31.2003 Movement
Net turnover from sales and services 320,804,332 298,499,051 22,305,281
Change in stocks 1,859,128 118,069 1,741,059
Change in works in progress on contracts 1,677,697 (787,693) 2,465,390
Work performed for own purposes and capitalised 5,747,586 4,082,434 1,665,152
Other revenues and income 2,527,556 2,098,463 429,093
Financial grants to the financial period account 438,476 429,281 9,195
Total 333,054,775 304,439,605 28,615,170
The change in the scope of consolidation due to the inclusion of the Profit and Loss Account of
the companies Il Point Srl (period from 1 April until 31 December) and OXYMED
Medizintechnik GmbH (period from 1 July until 31 December) led to a net increase in sales of
Euro 1,725,069.
The breakdown for the item “Other revenues and income” is as follows:
Description 12.31.2004 12.31.2003 Movement
Capital gains on disposal of fixed assets 1,490,839 1,113,092 377,747
Insurance indemnities 136,635 107,193 29,442
Real estate rentals 38,458 27,090 11,368
Other 861,624 851,088 10,536
Total 2,527,556 2,098,463 429,093
The item “Other” comprises contingent assets relating to ordinary operations.
Geographical distribution and breakdown of revenues by type of business are detailed below:
Geographical distribution of revenues
Description 12.31.2004 12.31.2003 Movement
Sales - Italy 222,325,026 212,958,966 9,366,060
Sales - EEC (except Italy) 78,431,925 66,635,754 11,796,171
Sales outside EEC 20,047,381 18,904,331 1,143,050
Total 320,804,332 298,499,051 22,305,281
Not
es t
o th
e co
nsol
idat
ed f
inan
cial
sta
tem
ents
Sol
Gro
up

Breakdown of revenues by type of business
Description 12.31.2004 12.31.2003 Movement
Gas pipelines and on-site 34,875,017 37,332,699 (2,457,682)
Merchant 197,315,775 185,569,175 11,746,600
Home care 88,613,540 75,597,177 13,016,363
Total 320,804,332 298,499,051 22,305,281
Reference should be made to the Directors' Report for comments regarding the trend in revenues.
B) Costs of production
Balance as at 12.31.04 298,207,911
Balance as at 12.31.03 271,270,715
Movement 26,937,196
The breakdown for the item “Costs of production” is as follows:
Description 12.31.2004 12.31.2003 Movement
Raw materials, subsidiary materials and goods 96,001,305 85,596,317 10,404,988
Services 96,248,235 86,846,494 9,401,741
Costs for use of assets owned by others 6,065,117 4,730,963 1,334,154
Wages and salaries 40,490,875 36,477,651 4,013,224
Social Security costs 14,180,595 12,544,348 1,636,247
Employee severance indemnity 1,404,048 1,366,132 37,916
Pension costs and similar obligations - - -
Other costs relating to staff - - -
Amortisation of intangible fixed assets 2,083,377 3,116,724 (1,033,347)
Amortisation of tangible fixed assets 34,891,336 31,752,591 3,138,745
Other reductions in value of fixed assets - 3,461 (3,461)
Allowance for doubtful debtors included in current assets 3,088,261 5,785,501 (2,697,240)
Variation in stocks of raw materials 31,288 (182,999) 214,287
Amounts provided for risk provisions 21,176 68,885 (47,709)
Other provisions 1,105 369,063 (367,958)
Other operating charges 3,701,193 2,795,584 905,609
Total 298,207,911 271,270,715 26,937,196
The item “Raw materials, subsidiary materials and goods” includes power costs since, since in view
of the group’s type of business, electricity constitutes de facto the main raw material.
52N
otes
to
the
cons
olid
ated
fin
anci
al s
tate
men
ts S
ol G
roup

53
The percentage incidence of purchases, net of adjustments to inventories of raw materials, in re-
spect of the value of production is shown in the table below.
Description 12.31.2004 12.31.2003
Change in stocks of raw materials 31,288 (182,999)
Purchases of raw materials, subsidiary materials and goods 96,001,305 85,596,317
Adjusted purchases of raw materials, subsidiary materials and goods 96,032,593 85,413,318
Value of production 322,663,460 298,617,119
Percentage incidence 29.76% 28.60%
The breakdown for the item “Services” is as follows:
Description 12.31.2004 12.31.2003 Movement
Freight 42,559,256 39,499,908 3,059,348
Maintenance 12,543,770 12,069,444 474,326
Consulting and general services 8,510,354 6,642,450 1,867,904
Insurance 2,497,076 2,332,420 164,656
Travel and related allowances 4,794,099 5,290,208 (496,109)
Advertising 1,217,189 1,130,172 87,017
Remuneration paid to Directors and fees paid to Statutory Auditors 2,326,777 2,079,000 247,777
Other services 21,799,714 17,802,892 3,996,822
Total 96,248,235 86,846,494 9,401,741
The breakdown of the item “Amortisation and depreciation” of intangible and tangible fixed assets
by asset category, is presented below:
Amortisation of intangible fixed assets
Description 12.31.2004 12.31.2003 Movement
Start-up and expansion costs 121,987 276,585 (154,598)
Costs of research, development and advertising 141,997 163,625 (21,628)
Industrial patents and rights to use intellectual property 197,866 413,242 (215,376)
Concessions, licenses, trade marks and similar rights 253,102 179,279 73,823
Goodwill 171,198 135,146 36,052
Other 429,349 381,293 48,056
Consolidation difference 767,878 1,567,554 (799,676)
Total 2,083,377 3,116,724 (1,033,347)
Depreciation of tangible fixed assets
Description 12.31.2004 12.31.2003 Movement
Land and buildings 2,547,402 2,556,649 (9,247)
Plants and machinery 11,116,264 10,793,299 322,965
Fixtures and fittings, tools and equipment 19,049,567 16,533,800 2,515,767
Other assets 2,178,103 1,868,843 309,260
Tangible fixed assets in course of construction - - -
Total 34,891,336 31,752,591 3,138,745
Not
es t
o th
e co
nsol
idat
ed f
inan
cial
sta
tem
ents
Sol
Gro
up

The breakdown for the item “Other operating charges” is as follows:
Description 12.31.2004 12.31.2003 Movement
Taxes other than income tax 2,761,913 1,625,007 1,136,906
Capital losses related to ordinary activities 66,106 180,622 (114,516)
Losses on amounts receivable not covered by provisions 289,321 627,589 (338,268)
Other minor charges 583,853 362,366 221,487
Total 3,701,193 2,795,584 905,609
The item “Other minor charges” comprises contingent liabilities relating to ordinary operations.
C) Financial income and charges
Balance as at 12.31.04 (3,807,034)
Balance as at 12.31.03 (3,706,243)
Movement (100,791)
The breakdown for the item financial income and expense is detailed in the table below:
Description 12.31.2004 12.31.2003 Movement
Income from equity investments in non-consolidated group companies - - -
Income from equity investments in associated companies - 317 (317)
Income from equity investments in other companies 6 4 2
Income from loans entered under fixed assets 17,495 20,709 (3,214)
Income from securities entered under current assets - 1,869 (1,869)
Other income not included above 711,538 811,856 (100,318)
(Interest payable and other similar financial charges) (4,612,827) (4,822,814) 209,987
Exchange (losses) gains 76,754 281,816 (205,062)
Total (3,807,034) (3,706,243) (100,791)
The breakdown of the item “Other income not included above” is as follows:
Description 12.31.2004 12.31.2003 Movement
Interest on banks and post offices deposits 212,148 297,355 (85,207)
Interest receivable from clients 294,083 202,995 91,088
Interest receivable on other amounts - 35,807 (35,807)
Other financial income 205,307 275,699 (70,392)
Total 711,538 811,856 (100,318)
54N
otes
to
the
cons
olid
ated
fin
anci
al s
tate
men
ts S
ol G
roup

55
The breakdown for the item “Interest payable and other similar financial charges” is as follows:
Description 12.31.2004 12.31.2003 Movement
Interest payable to banks 212,754 260,567 (47,813)
Interest payable to suppliers 4,219 7,913 (3,694)
Interest payable on loans 3,517,552 3,766,054 (248,502)
Total financial charges 878,302 788,280 90,022
Total 4,612,827 4,822,814 (209,987)
The item “Other financial charges” includes mainly expenses and banking fees and charges.
The item “Exchange gains (losses)” is made up as follows:
Description 12.31.2004 12.31.2003 Movement
Exchange gains 732,007 761,225 (29,218)
Exchange losses (655,253) (479,409) (175,844)
Total 76,754 281,816 (205,062)
D) Value adjustments to financial investments
Balance as at 12.31.04 (49,393)
Balance as at 12.31.03 (163,343)
Movement 113,950
The breakdown for the item “Value adjustments to financial investments” is as follows:
Description 12.31.2004 12.31.2003 Movement
Revaluations of equity investments 1,248 5,714 (4,466)
Revaluations of long-term financial assets which are not equity investments 10,234 333 9,901
Revaluations of current receivables - - -
Write-downs of equity investments (59,515) (163,998) 104,483
Write-downs of long-term financial assets which are not equity investments (1,360) (5,392) 4,032
Write-downs of current receivables - - -
Total (49,393) (163,343) 113,950
Not
es t
o th
e co
nsol
idat
ed f
inan
cial
sta
tem
ents
Sol
Gro
up

E) Extraordinary income and charges
Balance as at 12.31.04 18,535
Balance as at 12.31.03 (37,761)
Movement (56,296)
The breakdown for the item “Extraordinary income and charges” is as follows:
Description 12.31.2004 12.31.2003 Movement
Other extraordinary income 661,090 500,108 160,982
Capital gains from disposal of fixed assets 13,137 41,242 (28,105)
Capital losses from disposal of fixed assets - (86,000) 86,000
Taxes from previous financial years (267,709) (118,444) (149,265)
Other extraordinary charges (387,983) (374,667) (13,316)
Total 18,535 (37,761) 56,296
Income taxes for the year
Balance as at 12.31.04 14,106,833
Balance as at 12.31.03 14,088,876
Movement 17,957
The breakdown of income taxes for the year is as follows:
Description 12.31.2004 12.31.2003 Movement
Current taxes 12,307,821 12,716,748 (408,927)
Deferred and prepaid taxes 1,799,012 1,372,128 426,884
Total 14,106,833 14,088,876 17,957
The total amount of current taxation for the financial period corresponds to the sum of the
income taxes calculated by the individual companies.
56N
otes
to
the
cons
olid
ated
fin
anci
al s
tate
men
ts S
ol G
roup
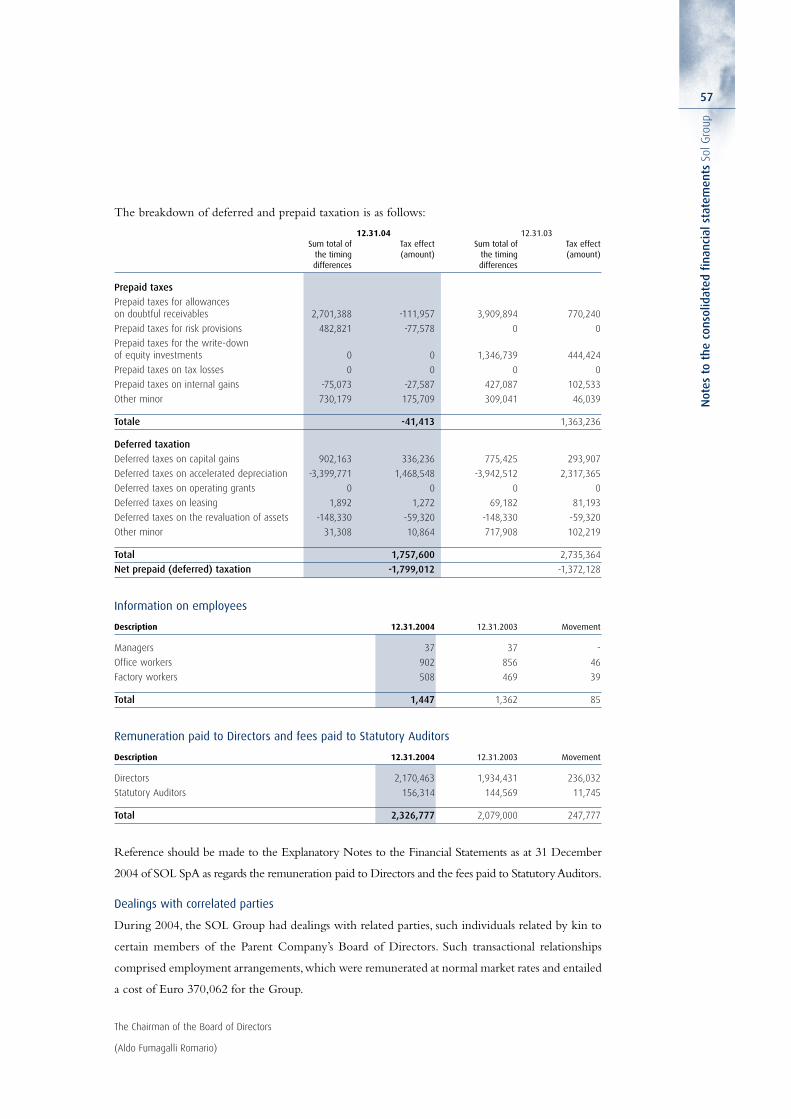
The breakdown of deferred and prepaid taxation is as follows:
12.31.04 12.31.03Sum total of Tax effect Sum total of Tax effect
the timing (amount) the timing (amount)differences differences
Prepaid taxes
Prepaid taxes for allowances on doubtful receivables 2,701,388 -111,957 3,909,894 770,240
Prepaid taxes for risk provisions 482,821 -77,578 0 0
Prepaid taxes for the write-down of equity investments 0 0 1,346,739 444,424
Prepaid taxes on tax losses 0 0 0 0
Prepaid taxes on internal gains -75,073 -27,587 427,087 102,533
Other minor 730,179 175,709 309,041 46,039
Totale -41,413 1,363,236
Deferred taxation
Deferred taxes on capital gains 902,163 336,236 775,425 293,907
Deferred taxes on accelerated depreciation -3,399,771 1,468,548 -3,942,512 2,317,365
Deferred taxes on operating grants 0 0 0 0
Deferred taxes on leasing 1,892 1,272 69,182 81,193
Deferred taxes on the revaluation of assets -148,330 -59,320 -148,330 -59,320
Other minor 31,308 10,864 717,908 102,219
Total 1,757,600 2,735,364
Net prepaid (deferred) taxation -1,799,012 -1,372,128
Information on employees
Description 12.31.2004 12.31.2003 Movement
Managers 37 37 -
Office workers 902 856 46
Factory workers 508 469 39
Total 1,447 1,362 85
Remuneration paid to Directors and fees paid to Statutory Auditors
Description 12.31.2004 12.31.2003 Movement
Directors 2,170,463 1,934,431 236,032
Statutory Auditors 156,314 144,569 11,745
Total 2,326,777 2,079,000 247,777
Reference should be made to the Explanatory Notes to the Financial Statements as at 31 December
2004 of SOL SpA as regards the remuneration paid to Directors and the fees paid to Statutory Auditors.
Dealings with correlated parties
During 2004, the SOL Group had dealings with related parties, such individuals related by kin to
certain members of the Parent Company’s Board of Directors. Such transactional relationships
comprised employment arrangements,which were remunerated at normal market rates and entailed
a cost of Euro 370,062 for the Group.
The Chairman of the Board of Directors
(Aldo Fumagalli Romario)
57
Not
es t
o th
e co
nsol
idat
ed f
inan
cial
sta
tem
ents
Sol
Gro
up

Consolidated cash flow statement Sol Group
(In thousands of Euro) 12.31.2004 12.31.2003
CASH FLOWS PROVIDED BY OPERATING ACTIVITIES
Profit for the period 16,505 15,203
Minority interest - share of profit 397 (31)
Adjustments not affecting liquidity
Depreciation and amortisation 36,975 34,869
Change in staff severance fund 1,404 1,366
Increase (decrease) in provisions for liabilities and charges 2,599 1,986
Write-down of equity investments - -
Total 57,880 53,394
Changes in current assets and liabilities
Stocks (3,570) 563
Receivables (6,287) (17,815)
Prepayments and accrued income (202) (94)
Suppliers 5,659 3,370
Other payables 338 4,626
Accrued liabilities and deferred income (102) (537)
Amounts due to the tax authorities (1,250) 847
Total (5,415) (9,042)
CASH FLOW PROVIDED BY OPERATING ACTIVITIES 52,466 44,352
CASH FLOWS PROVIDED BY INVESTING ACTIVITIES
Acquisitions, revaluation and other movements in industrial fixed assets (56,475) (33,716)
Change in the consolidation basis - -
Net book value of assets 461 769
Increases in intangible assets (1,418) (1,272)
(Increase) decrease in investments 205 744
(Increase) decrease in financial assets not held as fixed assets 359 (237)
TOTAL (56,869) (33,713)
CASH FLOWS PROVIDED BY FINANCING ACTIVITIES
Proceeds from (repayments of) new borrowings 8,663 (3,459)
Repayment of debenture loans - -
Proceeds from (repayments of) shareholders’ loans 44
Dividends paid (5,460) (5,460)
Termination indemnities paid during the year net of transfers from Group companies (673) (516)
Other changes in shareholders’ equity
- increase in share capital - -
- translation differences and other movements 767 (414)
- movements in net equity pertaining to minority interests (89) (1,087)
- change in the consolidation basis - 1,063
TOTAL 3,252 (9,872)
INCREASE (DECREASE) IN CASH IN HAND AND AT BANK (1,151) 767
CASH IN HAND AND AT BANK AT BEGINNING OF YEAR 19,286 18,518
CASH IN HAND AND AT BANK AT END OF YEAR 18,134 19,286
58N
otes
to
the
cons
olid
ated
fin
anci
al s
tate
men
ts S
ol G
roup

Repo
rt o
f th
e in
depe
nden
t au
dito
rsSo
l Gro
up20
04
Repo
rt o
f in
depe
nden
t au
dito
rs S
ol G
roup
60

Design
M Studio, Milano
Printing
Leva Arti Grafiche, Sesto San Giovanni
Inde
x 3 Directors’ report 2004 Sol Group
15 Consolidated financial statements 2004 Sol Group
16 Consolidated balance sheet
20 Consolidated profit and loss account
22 Notes to the consolidated financial statements
58 Consolidated cash flow statement
59 Report of the independent auditors Sol Group
Sol SpaRegistered officePiazza Diaz, 120052 Monza (MI) Italy
Share CapitalEuro 47.164.000,00 fully paid up.
C.F and company register of Milann° 04127270157R.E.A. n° 991655C.C.I.A.A. Milan

Sol G
roup
Ann
ual R
epor
t20
04
Sol G
roup
Ann
ual R
epor
t20
04
Sol SpaPiazza Diaz, 120052 Monza (MI) ItalyTelephone +39.039.23961Fax +39.039.2396371