Gruhn HMI Design (ISA template) - Jim Talbot HMI Design.pdf · HMI Design: The Good, the bad, ......
19
3/18/2015 1 Standards Certification Education & Training Publishing Conferences & Exhibits HMI Design: The Good, the bad, and the ugly (and what makes them so) Paul Gruhn, P.E., ISA Fellow Rockwell Automation Paul Gruhn, P.E. – Global Process Safety Consultant at Rockwell Automation – Safety Systems Specialist for > 25 years – ISA Fellow – Member of ISA 84 committee (25 years) & 101 committee (4 years) – Instructor for ISA’s courses on Safety Instrumented Systems (8 days of material) – Co-author of ISA book on Safety Instrumented Systems – Developer of commercial modeling software – Registered Professional Engineer in Texas (and member of CSE exam team) – ISA 84 Expert
Transcript of Gruhn HMI Design (ISA template) - Jim Talbot HMI Design.pdf · HMI Design: The Good, the bad, ......

3/18/2015
1
Standards
Certification
Education & Training
Publishing
Conferences & Exhibits
HMI Design:The Good, the bad, and the ugly(and what makes them so)
Paul Gruhn, P.E., ISA Fellow
Rockwell Automation
Paul Gruhn, P.E.
– Global Process Safety Consultant at Rockwell Automation
– Safety Systems Specialist for > 25 years– ISA Fellow– Member of ISA 84 committee (25 years)
& 101 committee (4 years)– Instructor for ISA’s courses on Safety
Instrumented Systems (8 days of material)– Co-author of ISA book on Safety
Instrumented Systems– Developer of commercial modeling software– Registered Professional Engineer in Texas
(and member of CSE exam team)– ISA 84 Expert
3/18/2015
2
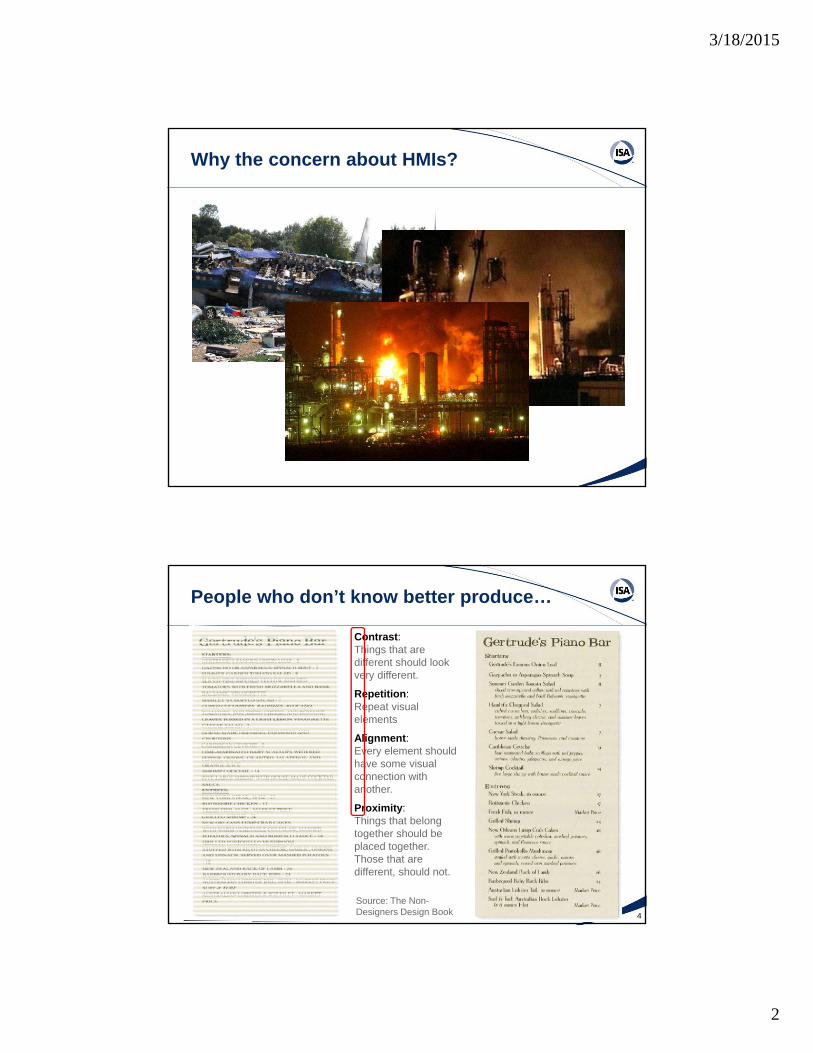
Why the concern about HMIs?
People who don’t know better produce…
4
Contrast: Things that are different should look very different.
Repetition: Repeat visual elements
Alignment:Every element should have some visual connection with another.
Proximity: Things that belong together should be placed together. Those that are different, should not.
Source: The Non-Designers Design Book

3/18/2015
3
Not following convention…
5
“Print” belongs under the “File” menu
Cancel!
A Lack of Situation Awareness
6

3/18/2015
4
Situation Awareness
Three stages:
1. Being aware of the situation around you – Perception of needed data and the
current situation
2. Understanding what the information means to you now – Comprehension of information and
the current situation
3. Understanding what the information means to you in the future– Projection of future status
7Source: Designing For Situation Awareness
Demons of Situation Awareness
• Attention tunneling– Fixating on one set of information to the
exclusion of others
• Memory trap– Relying on limited short-term memory
• Workload, anxiety, fatigue and other stressors– Reduction of a person’s capacity to process
information
• Data overload– Overwhelming amounts of data
8Source: Designing For Situation Awareness

3/18/2015
5
Demons of Situation Awareness
• Misplaced salience– Salience: the compellingness of certain
information
– Being drawn to the wrong information
• Complexity creep– Too many features make it difficult to
develop an accurate mental model
• Errant mental models– Use of the wrong model leads to
misinterpretation of information
• Out-of-the-loop syndrome– Automation can undermine SA
9Source: Designing For Situation Awareness
Find Waldo
10

3/18/2015
6
Where DCS graphics started…
Source: PAS White Paper 11
What we then migrated to…
Source: The High Performance HMI Handbook 12

3/18/2015
7
Fewer colors, but is this really any different?
Is this process healthy? What should the values be? 13
Poor HMI designs have:
• P&ID representation
• No trends
• Flashing/spinning graphics
• Bright colors, 3-D shadows
• Color coding of piping and vessel contents
• Measurement units in large, bright text
• Lots of crossing lines
• Alarm related colors for non-alarm related elements
• Inconsistent colors
Source: The High Performance HMI Handbook 14

3/18/2015
8
So why have we developed things like this?
• User had no internal standard or guideline
• Vendor had no drawings other than P&IDs
• Vendor understood what the control system was doing
• Easiest solution was to display the PI&D with all the control system data
• No one ever asked the operators what their goals were (not tasks!)
• Few understand SA and its demons
15
The medical equivalent: Is this person OK?
98.0 – 99.5
16 – 24
60 – 84
>130 / >85
<200
>40
<130
<150
98.6
20
72
120/80
°F
/min
bpm
mmHg
197Col
52HDL
126LDL
100Tri
Temp
B.R.
Pulse
B.P.
mg/dL
mg/dL
Mg/dL
mg/dL
16

3/18/2015
9
Is this person OK?
How far ahead of its time was this!!
Source: The High Performance HMI Handbook17
The Role of the Operator
• The human in the loop should be predictive, not reactive
• The goal is to predict and prevent problems, not respond to them after they’ve happened
18
Source: The High Performance HMI Handbook

3/18/2015
10
Would this be a good HUD?
19
Alt: 30,501 ft
Spd: 530 kts
Dir: 254
CS: +120 kts
Fl: 2,430 gl
Wpn: Sdwdr
Flps: Up
LG: Up
CR: +110 fpm
DTT: 4,351 ft
TS: 490 kts
TA: 30,490 ft
Lg: 120.35.10
Lt: 41.52.41
Versus…
20

3/18/2015
11
Is this compressor running optimally?
What should the values be?
Source: The High Performance HMI Handbook 21
The compressor graphic is superfluous!
Source: The High Performance HMI Handbook22
3/18/2015
12
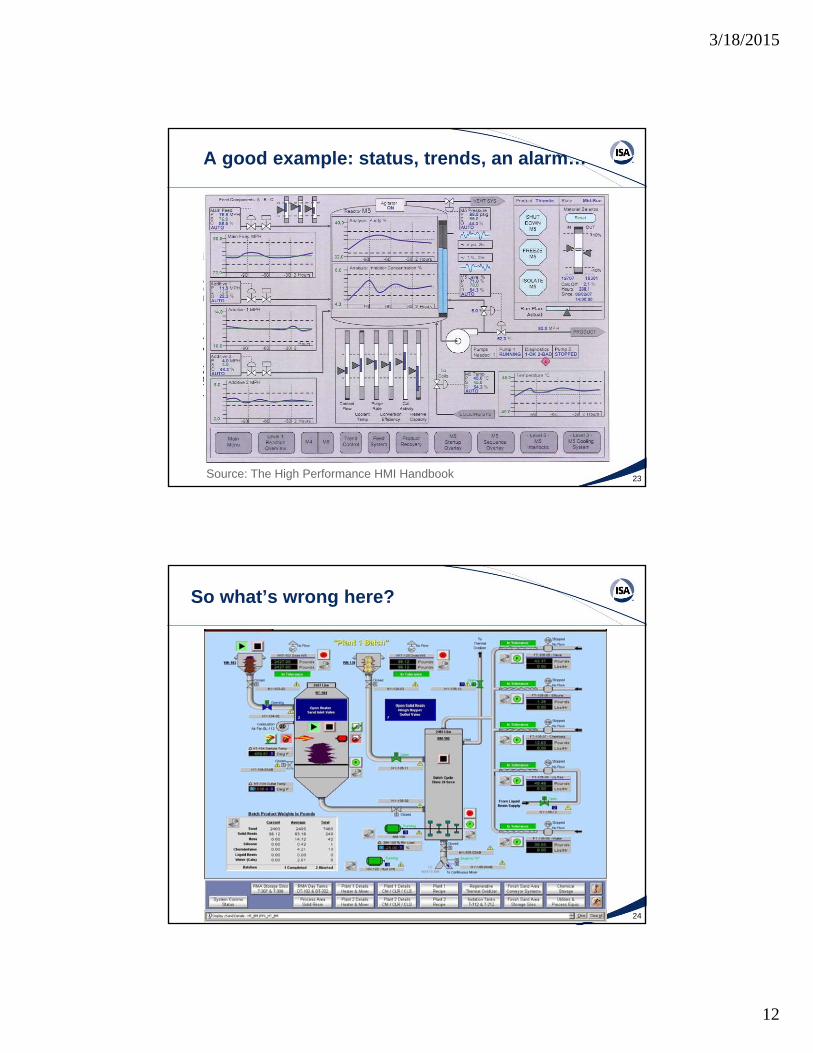
A good example: status, trends, an alarm…
Source: The High Performance HMI Handbook 23
So what’s wrong here?
24

3/18/2015
13
Is this compressor healthy?
25
What should these values be?
26
3/18/2015
14
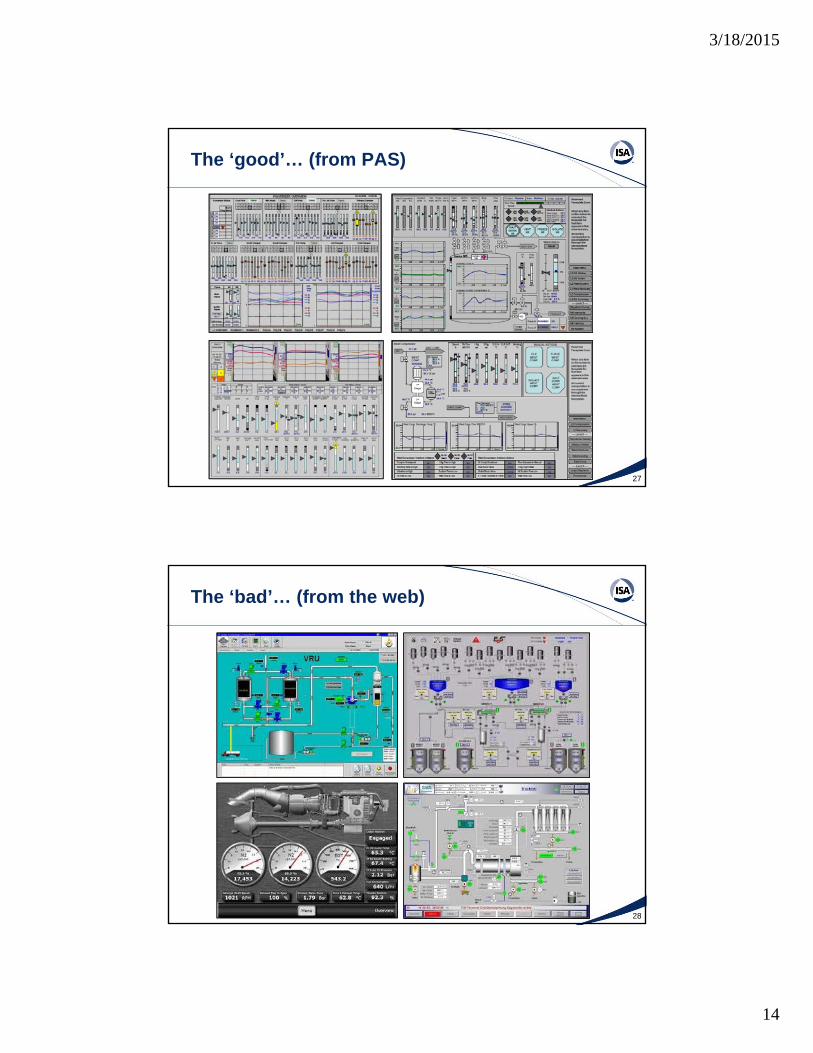
The ‘good’… (from PAS)
27
The ‘bad’… (from the web)
28

3/18/2015
15
The ‘ugly’… (from the web)
29
Let’s improve a design!
30

3/18/2015
16
An initial attempt. What’s better? What’s not?
31
Better, but…
32

3/18/2015
17
Good HMI designs have:
• Depiction of process status and values as information, not numbers
• Layout consistent with operators model of the process (not a P&ID)
• Key Performance Indicators as trends• No gratuitous information• Gray backgrounds, low contrast• Very limited use of color
(for alarming)• Consistent visual and color coding• Gray process lines• Measurement units in low contrast
lettering, if used at all
Source: The High Performance HMI Handbook 33
7 steps to create HP HMIs
1. Create a written philosophy and style guide
2. Assess & benchmark existing graphics
3. Determine and document process performance and goal objectives
4. Perform task analysis to achieve performance and goal objectives
5. Design graphics to address identified tasks
6. Install, commission and train
7. Control, maintain and reassess
34Source: PAS white paper

3/18/2015
18
Change is difficult
• Are you riding the same mule, but just sitting in a different saddle?
• “Human beings, who are almost unique in having the ability to learn from the experience of others, are also remarkable for their apparent disinclination to do so.” Douglas Adams
• Involvement and buy-in will be needed from management, technical staff, and operators
35Source: The High Performance HMI Handbook
For “the rest of the story”…
As well as the ASM consortium: www.asmconsortium.net
36
For more info: www.pas.comand www.mycontrolroom.com

3/18/2015
19
For “the rest of the story”…
By Mica Endsley, Betty Bolté, & Debra Jones
37