Growth linkages in Madagascar - Cornell Food and Nutrition Policy
36
GROWTH LINKAGES I N MADAGASCAR: IMPLICATIONS FOR SECTORAL INVESTMENT PRIORITIES Paul Dorosh and Steven Haggblade
Transcript of Growth linkages in Madagascar - Cornell Food and Nutrition Policy

GROWTH LINKAGES I N MADAGASCAR: IMPLICATIONS FOR SECTORAL INVESTMENT PRIORITIES
Paul Dorosh and Steven Haggblade

The Cornell Food and Nutrition Policy Program (CFNPP) was created in 1988 within the Division of Nutritional Sciences, Col lege of Human Ecology, Cornel 1 University, to undertake research, training, and technical assistance in food and nutrition policy with emphasis on developing countries.
CFNPP is served by an advisory committee of faculty from the Division of Nutritional Sciences, Coll ege of Human Ecology; the Departments of Agricultural Economics, Nutrition, City and Regional Pl anning, Rural Sociology; and from the Cornel 1 Institute for International Food, Agriculture and Development. Graduate students and faculty from these units sometimes collaborate with CFNPP on specific projects. The CFNPP professional staff includes nutritionists, economists, and anthropologists.
CFNPP is funded by several donors including the Agency for International Development, the World Bank, UNICEF, the United States Department of Agriculture, the New York State Department of Health, The Thrasher Research Fund, and individual country governments.
Preparation of this document was financed by the U.S. Agency for International Development under USAID Cooperative Agreement AFR 000-A-0-8045-000.
1994 Cornel 1 Food and Nutrition Pol icy Program ISBN 1-56401-160-7
This Working Paper series provides a vehicle for rapid and informal reporting of results from CFNPP research. Some of the .findings may be prel imi nary and subject to further analysis.
This document was word processed by Diane Cook and the text formatted by Brent Beckley. The cover was produced by Brent Beckley.
For information about ordering this manuscript and other working papers in the series contact:
CFNPP Publications Department 315 Savage Hall
Cornel 1 University Ithaca, NY 14853 607-255-8093

CONTENTS
LIST OF TABLES
LIST OF APPENDIX TABLES
LIST OF FIGURES
LIST OF ABBREVIATIONS
1. INTRODUCTION
2. AGRICULTURE AND INDUSTRY I N THE MALAGASY ECONOMY
3. MODELING LINKAGES I N THE MALAGASY ECONOMY
Overview of the Model Underlying Premises
Linearity Fixed Prices
4. MODEL SIMULATIONS
Impact on Growth Income Investment requirements Income/investment mu1 tip1 iers
Empl oyment and Income Distribution Spat i a1 Linkages
5. CONCLUSIONS
Sectoral Priorities Sustaining the Growth Linkages
REFERENCES
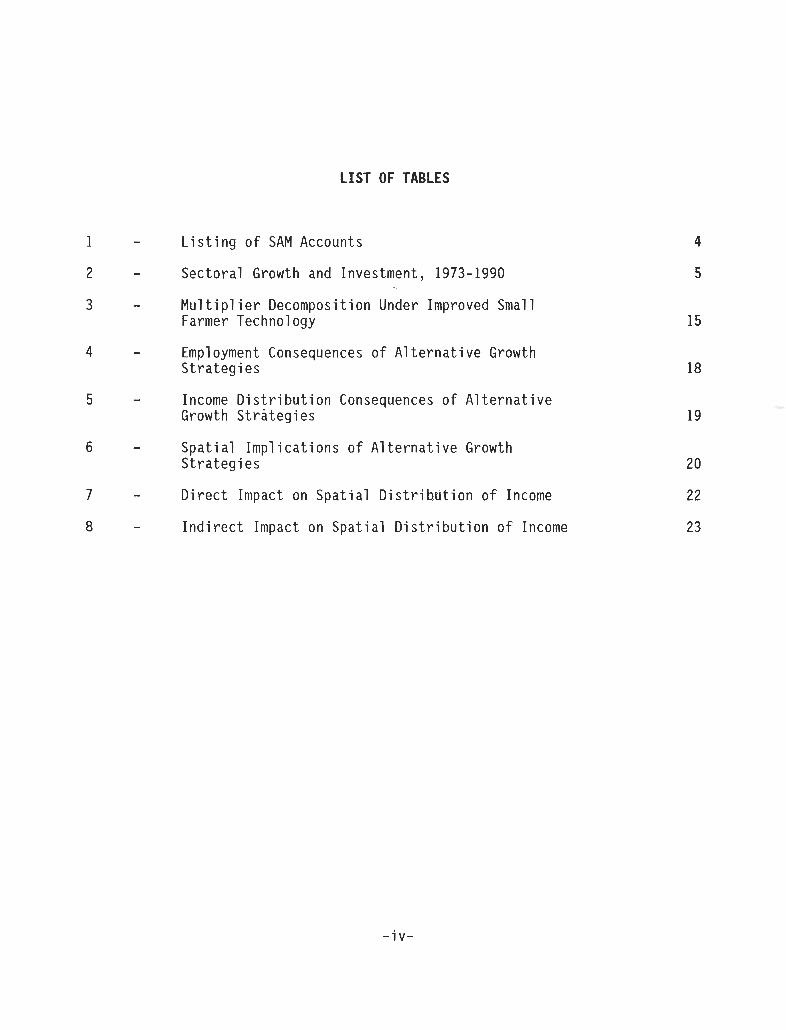
LIST OF TABLES
Listing of SAM Accounts
Sectoral Growth and Investment, 1973- 1990
Mu1 ti pl i er Decomposition Under Improved Small Farmer Technology
Employment Consequences of Alternative Growth Strategies
Income Distribution Consequences of Alternative Growth Strategies
Spat i a1 Imp1 i cati ons of A1 ternati ve Growth Strategies
Direct Impact on Spatial DistribAtion of Income
Indirect Impact on Spatial Distribution of Income

LIST OF APPENDIX TABLES
A.l - Returns to Investment in Agriculture

LIST OF FIGURES
1 - Sectoral Growth
2 - Graphic Representation of Multiplier Effects

ABBREVIATIONS
CGE Computabl e General Equi 1 i b r i um
FMG Franc Ma1 agasy
I COR Incrementa l Capi t a l - o u t p u t Ra t ios
SAM Soci a1 Account ing M a t r i x
SIO Semi- input-output

1. INTRODUCTION
I n t h e l a t e 197OYs, Madagascar launched an ambi t ious investment program, as p a r t o f i t s i n v e s t i r a outrancel development s t r a t e g y t o spur economic growth. For a few sho r t years d u r i n g t h e investment boom, t h e economy surged forward, f u e l e d by massive c a p i t a l i n f l o w s , much o f these shor t - te rm commercial bank loans a t market i n t e r e s t r a t e s . When scheduled payments o f i n t e r e s t and p r i n c i p a l on t h e loans co inc i ded w i t h a d e c l i n e i n terms o f t r a d e i n t h e e a r l y 1980's, however, a balance o f payments c r i s i s ensued. As p a r t o f t h e s t a b i l i z a t i o n and s t r u c t u r a l adjustment e f f o r t s supported by t h e IMF and The World Bank, t h e investment program was sca led back, government spending was slashed and government c o n t r o l s on markets were g r a d u a l l y reduced.
A l though t h e r o l e o f t h e p u b l i c sec to r has d im in ished i n Madagascar, government investment , as embodied i n t h e p u b l i c investment program, remains an impor tan t p a r t o f t h e coun t r y ' s development e f f o r t s . Wi th investment resources l i m i t e d , s t r a t e g i c a l l o c a t i o n o f n a t i o n a l investment i s a c r u c i a l element o f t he t r a n s i t i o n f rom s t r u c t u r a l adjustment t o long-run economic growth. The i n v e s t i r B outrance development push p laced a major emphasis on i n d u s t r y , t o t h e r e l a t i v e neg lec t o f a g r i c u l t u r e . What investments i n a g r i c u l t u r e t h a t were made du r i ng t h e 1970s and 1980s focused l a r g e l y on l a rge -sca le i r r i g a t e d r i c e per imeters , such as Lac A lao t ra , as w e l l as i n increased p roduc t i on o f expor t crops, p a r t i c u l a r l y c o f f e e . O v e r a l l , t h e r e s u l t s o f most o f these investments have been d i s a p p o i n t i n g . A f t e r a decade o f s t a b i l i z a t i o n and s t r u c t u r a l adjustment, as t he coun t r y hopes o f ach iev ing sus ta ined economic growth, i t i s impor tan t t h a t t h e e a r l i e r mis takes a re n o t repeated, bu t t h a t scarce resources a re used e f f i c i e n t l y and e q u i t a b l y .
I n s e t t i n g p r i o r i t i e s , t h e micro-economic p r o f i t a b i l i t y o f t h e investment, i .e. t h e cos t s and b e n e f i t s d i r e c t l y r e s u l t i n g f rom the investment p r o j e c t , p lays a major r o l e . But i n i t i a l p r o j e c t s e l e c t i o n i s a l s o guided by o v e r a l l development s t r a tegy , i n c o r p o r a t i n g a b lend o f o b j e c t i v e s i n c l ud i ng econcmic growth, income d i s t r i b u t i o n and reg iona l o r s p a t i a l c r i t e r i a . Here, l i n kages between t h e p r o j e c t outcome a t a micro-economic l e v e l and i t s impact on t h e r e s t o f t h e economy a1 so become impor tan t ( B e l l , Hazel1 and S l ade, 1982). A thorough unders tanding o f t h e t r a d e o f f s i nvo l ved i n a l t e r n a t i v e growth paths, i n c l u d i n g p o t e n t i a l m u l t i p l i e r e f f e c t s and impacts on income d i s t r i b u t i o n , p rov ides a fundamenta l ly impor tan t i n p u t i n t o p u b l i c d e c i s i o n making.
Th i s chap te r examines t h e imp1 i c a t i o n o f a1 t e r n a t i v e growth s t r a t e g i e s on t h e l e v e l and d i s t r i b u t i o n o f income i n Madagascar. We focus on growth 1 inkages emanating f rom t h e t h r e e key sec to rs o f t h e Malagasy economy most commonly
Investment t o t h e l i m i t .
advanced as o b j e c t s o f p u b l i c a t t e n t i o n - paddy ( t h e major food crop) , c o f f e e ( t h e ma jo r expo r t c rop) and t h e formal manufactur ing sec to r .
A f t e r a b r i e f d i s cuss ion o f t h e r o l e s o f a g r i c u l t u r e and i n d u s t r y i n t h e Malagasy economy, we p resen t a semi- input -output (SIO) model f o r p r o j e c t i n g t he income and employment consequences o f these t h r e e a l t e r n a t i v e growth s t r a t e g i e s . The model uses a Soc ia l Account ing M a t r i x (SAM) as a framework f o r t r a c i n g t h e i n t e r r e l a t i o n s h i p s among p roduc t i ve sec to rs , households and o t h e r i n s t i t u t i o n s i n t h e economy. The r e s u l t s focus on t h e t r a d e o f f s between investments i n r i c e , expo r t c rops and manufactur ing. Summing up, t h e f i n a l s e c t i o n o f f e r s p o l i c y conc lus ions .

2. AGRICULTURE AND INDUSTRY I N THE MALAGASY ECONOMY
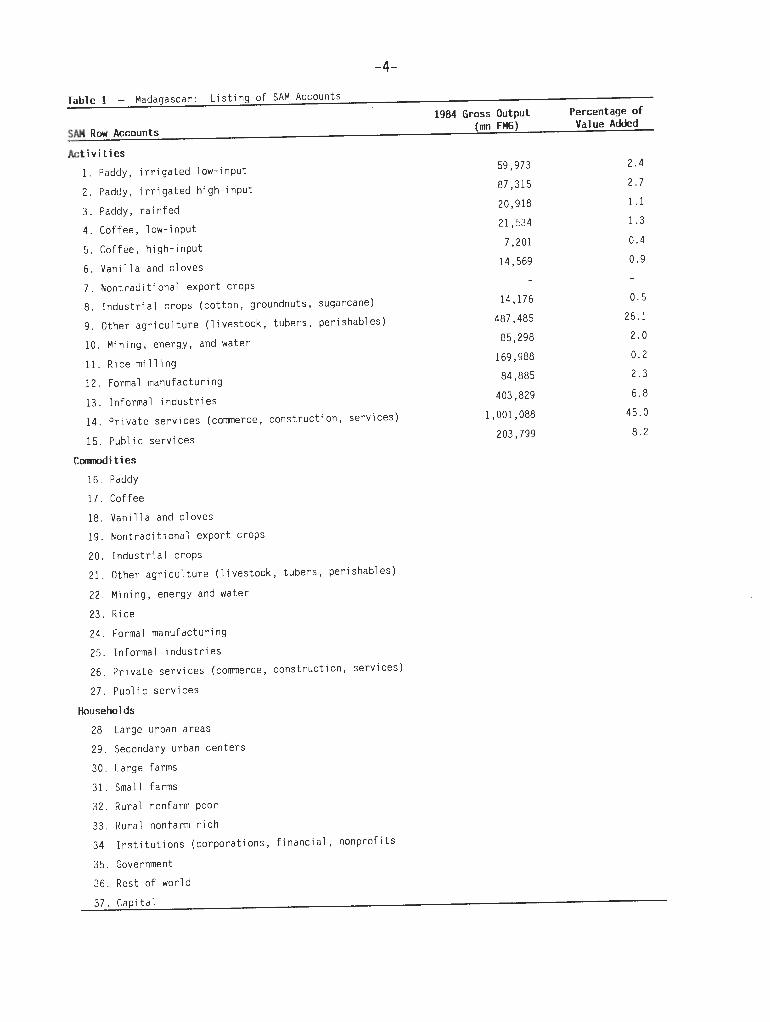
The choices between investment in agr icul ture versus industry - and, within agr icu l tu re , between foodcrops and export crops - are especial ly important given the large s i z e of the agr icul tura l sector and the 1 imited resources available in Madagascar. Agriculture provides the primary source of income for three-quarters of Madagascar's population and i s second only t o services in generating value added (Table 1 ) . The formal indust r ia l sector , dominated by food processing and t ex t i 1 e s , remains small, accounting for only 8 .6 percent of G D P and 3 percent of empl oyment .
By value, farm output i s concentrated in r i c e (paddy), export crops (coffee, vanil l a and c loves) , root crops and 1 ivestock. Paddy, the major s taple , i s grown throughout Madagascar, mostly by small farmers on i r r iga ted land. In the central high1 ands (Hauts-Pl ateaux) , paddy cul t i vat i on forms the base of fhe rural economy. Coffee, vani l la and cloves are grown on the eas t and north coasts .
Apart from the short-lived investment boom, Madagascar's economy stagnated from the ear ly 1970s t o the l a t e 1980s.' Nationalization of indust r ies and increasing government intervention in markets resulted in a disappointing 0.06 per cent average annual decline in real G D P from 1973 t o 1977, (Table 2 ) . The i n v e s t i r a outrance s t ra tegy in the l a t e 1970s was designed t o take advantage of high world coffee prices and readily available c red i t on world markets t o jump-start the economy with massive investments in industry and infras t ructure . Investment as a share of G D P rose t o 13.5 percent in the 1978-80 period, u p from an average of 11.4 percent of G D P from 1973 t o 1977. During these boom years, indust r ia l o u t p u t grew by an average of 4.76 percent per year, though the growth r a t e of agr icul ture was only 1.03 percent per year.
Unfortunately, decl i ni ng world coffee pr ices , increased debt servicing obligations and t i gh t e r world c r ed i t markets in the ear ly 1980s brought about a balance of payments c r i s i s before many of the investment projects were completed. With foreign exchange shortages l imit ing imports of intermediate and capital goods, value added in industry f e l l by an average of 13.17 percent per year in 1981 and 1982, t o a level 9 .1 percent be1 ow the average o u t p u t of 1973-77. The i ndustri a1 sector recovered somewhat the rea f te r , as price control s were gradual ly eliminated and o f f i c i a l lending helped ease foreign exchange const ra ints from 1983 t o 1987. Industr ial growth was a mere 0.67 percent per year from 1988 t o
Further d e t a i l s on the Ma1 agasy economy and economic pol i c i e s are found in Dorosh, Bernier and Sa r r i s (1990), Dorosh (1994) and in chapter x of t h i s book, "Macroeconomic Adjustment and Poor in Madagascar: a C G E Analysis".

1990, however, despi te an overall gain in real G D P averaging 3.16 percent per year in t h i s period.
In contras t t o industry the agr icul ture sector fared be t t e r under s t ructura l adjustment (Figure 1 ) . Since l ibe ra l i za t ion of agricultural markets, beginning in 1983, value added in agricultural increased by .an average of 2.51 percent per year from 1982 t o 1987 and 3.16 percent per year from 1987 t o 1990. However, r i c e output per cap i ta , declined by 20.6 percent between 1975 and 1988, before increasing s l i gh t l y in 1989 and 1990, and r i c e imports averaged 8.2 percent of t o t a l r i c e availabil i t y over the second half of the e igh t ies (Bernier and Dorosh, 1993). Production of t radi t ional export crops also declined in value a f t e r the l a t e seventies.
Po l i t i ca l turmoil in the ear ly 1990s reversed the growth i n GDP following the major t rade l ibe ra l i za t ion of 1987 and 1988. Several key reforms undertaken under s t ructura l adjustment were reversed and more s t r ingent government controls were reimposed on foreign exchange and t rade . Whether economic growth i s restored wil l depend in par t on the pol ic ies of the new Malagasy government w.ith regard t o the extent of l ibe ra l i za t ion of key markets and other policies af fect ing economic incentives and private investment. A key aspect of the government's own investment s t ra tegy, having major implications fo r both growth and equity , wi 1 1 be the sectoral a1 1 ocat i on of pub1 i c investment .
Discouraged by the disappointing record of past investments in 1 arge-scale i r r i ga t ed r i c e perimeters and in manufactured goods, many now argue tha t a heavier emphasis on export crops will y ie ld the greates t prospects fo r long-run growth. A thorough understanding of the t radeoffs invol ved in a1 ternat ive growth paths, including potential mu1 t ip1 i e r e f fec t s and impacts on income d i s t r ibu t ion , provides a fundamentally important input in public decision making.


3. MODELING LINKAGES I N THE MALAGASY ECONOMY
OVERVIEW OF THE MODEL
Investment, 1 i ke new technology, d i r e c t l y increases ou tpu t i n t he t a r g e t sec to r . I n t h e process, t h i s increased ou tpu t s t imu la tes demand f o r p roduc t ion i n p u t s and f o r consumer goods r e q u i r e d by t he households earn ing income i n t h e new p roduc t i on u n i t s . Because o f these t w i n sources o f demand, increased ou tpu t generates no t o n l y d i r e c t income growth w i t h i n a sec to r bu t a l s o i n d i r e c t increases i n demand f o r o t h e r goods and serv ices i n t h e economy. Where excess c a p a c i t y e x i s t s , t h e increased demand t r a n s l a t e s i n t o h igher ou tpu t and consequent ly h i ghe r incomes. Thus t h e t o t a l income g a i n generated by growth i n a g i ven s e c t o r i nc l udes t he d i r e c t sec to ra l income p l u s t h e i n d i r e c t earnings generated i n o t h e r sec to rs .
The measurement o f these i n d i r e c t e f f e c t s r e q u i r e s a model t h a t r e1 ates s e c t o r a l ou tpu t , household income, consumer demand, and i n t e r - i n d u s t r y i n p u t 1 inkages . Since supply responsiveness across sec to rs determines how e f f e c t i v e l y growing demand w i l l t r a n s l a t e i n t o increased domestic ou tpu t and income, any model must make c l e a r assumptions about supply e l a s t i c i t i e s i n a l l sec to rs o f t he economy.
One op t ion , t h e inpu t -ou tpu t model, embodies t h e c l a s s i c approach t o t h i s ques t ion . It se t s t o t a l supply i n each sec to r (Z) equal t o t h e two sources o f demand, i n t e r i n d u s t r y i n p u t demand (AZ) and f i n a l consumption demand (F ) . F ina l demand i nc l udes consumption by households (BY) and exogenous sources o f demand such as expo r t s ( E ) . The va lue added share (v ) i n gross commodity ou tpu t (Z) determines income (Y).
Presuming supply t o be p e r f e c t l y e l a s t i c i n a l l sectors , t o t a l ou tpu t and incomes become determined by t h e 1 eve1 o f exogenous demand (E ) and t h e m a t r i x o f mu1 t i p 1 i e r s (I-M)-', where M o f f e r s shorthand n o t a t i o n f o r t h e parameters (Atp) .
Because t h e y assume p e r f e c t l y e l a s t i c supply i n a1 1 sectors , inpu t -ou tpu t models over-est imate ou tpu t responses f o l l o w i n g f rom any i n t e r v e n t i o n . Yet i n r e a l i t y , i n most develop ing c o u n t r i e s some sec to rs face supply c o n s t r a i n t s . Th is i s e s p e c i a l l y t r u e f o r a g r i c u l t u r e , where land, 1 abor, r a i n f a l l and technology f r e q u e n t l y 1 i m i t ou tpu t . I n d u s t r i a l ou tpu t i s a l so o f t e n cons t ra ined by l a c k o f c a p i t a l . By i g n o r i n g supply c o n s t r a i n t s a1 together , inpu t -ou tpu t models
t y p i c a l l y exaggerate t h e s i z e o f the i n te r - sec to ra l l inkages. I n the case o f crop-based a g r i c u l t u r e , input-output model s overs ta te growth mu1 t i p l i e r s by a f a c t o r o f two t o ten (Haggblade, Hammer and Hazel l , 1991).
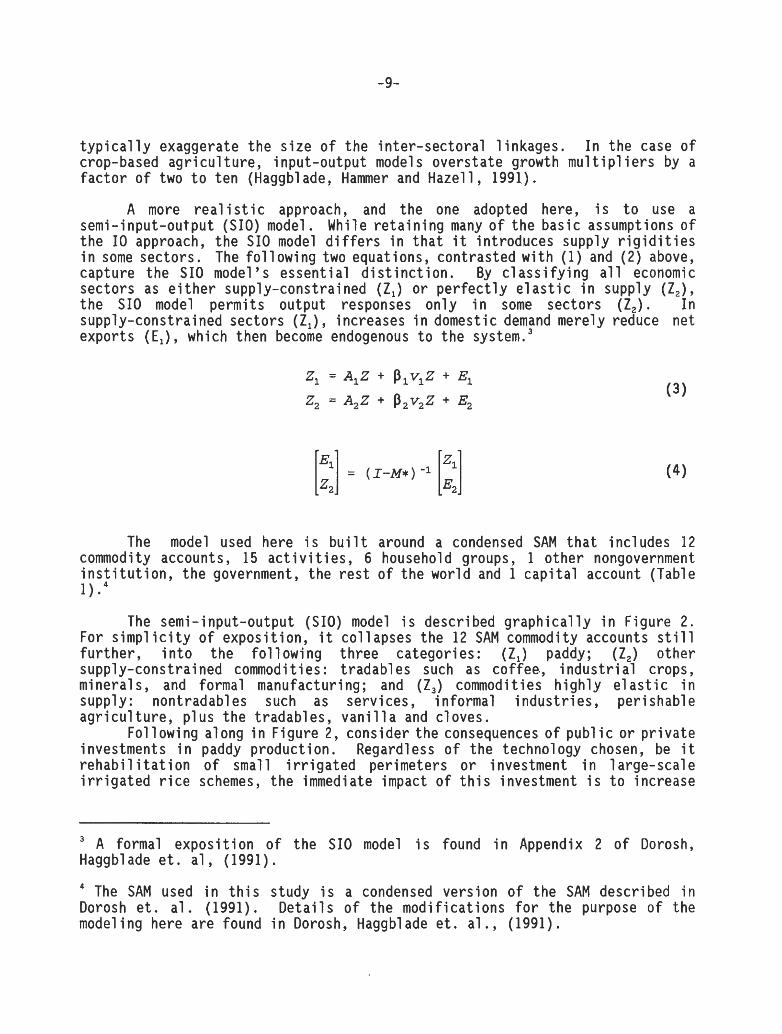
A more r e a l i s t i c approach, and the one adopted here, i s t o use a semi- input-output (SIO) model. While re ta i ' n i ng many o f the basic assumptions o f the I 0 approach, the S I O model d i f f e r s i n t h a t i t int roduces supply r i g i d i t i e s i n some sectors. The f o l l o w i n g two equations, contrasted w i t h (1) and (2) above, capture the SIO model ' s essent ia l d i s t i n c t i o n . By c l a s s i f y i n g a l l economic sectors as e i t h e r supply-constrained (Z,) o r p e r f e c t l y e l a s t i c i n supply (Z,), t he S I O model permi ts output responses on ly i n some sectors ( Z ) . I n supply-constrained sectors (Z,) , increases i n domestic demand merely reduce net exports (El), which then become endogenous t o the ~ y s t e m . ~
The model used here i s b u i l t around a condensed SAM t h a t inc ludes 12 commodity accounts, 15 a c t i v i t i e s , 6 household groups, 1 o ther nongovernment i n s t i t u t i o n , t h e government, the r e s t o f t he wor ld and 1 c a p i t a l account (Table 1) . 4
The semi-input-output (S IO) model i s described g r a p h i c a l l y i n Figure 2 . For simp1 i c i t y o f exposi t ion, i t col lapses the 12 SAM commodity accounts s t i l l f u r t h e r , i n t o the f o l l o w i n g th ree categor ies: (Z,) paddy; (Z,) other supply-constrained commodities: t radables such as coffee,, i n d u s t r i a l crops, minerals, and formal manufacturing; and (Z,) commodities h i g h l y e l a s t i c i n supply: nontradables such as services, in formal i ndus t r i es , per ishable a g r i c u l t u r e , p lus the t radables, v a n i l l a and cloves.
Fol 1 owing along i n F igure 2, consider the consequences o f pub1 i c o r p r i v a t e investments i n paddy product ion. Regardless o f the technology chosen, be i t r e h a b i l i t a t i o n o f small i r r i g a t e d perimeters o r investment i n large-scale i r r i g a t e d r i c e schemes, t he immediate impact o f t h i s investment i s t o increase
A formal expos i t i on o f t he S I O model i s found i n Appendix 2 o f Dorosh, Haggblade e t . a l , (1991).
The SAM used i n t h i s study i s a condensed vers ion o f t he SAM described i n Dorosh e t . a l . (1991). D e t a i l s o f the mod i f i ca t ions f o r the purpose o f the modeling here are found i n Dorosh, Haggblade e t . a l . , (1991).

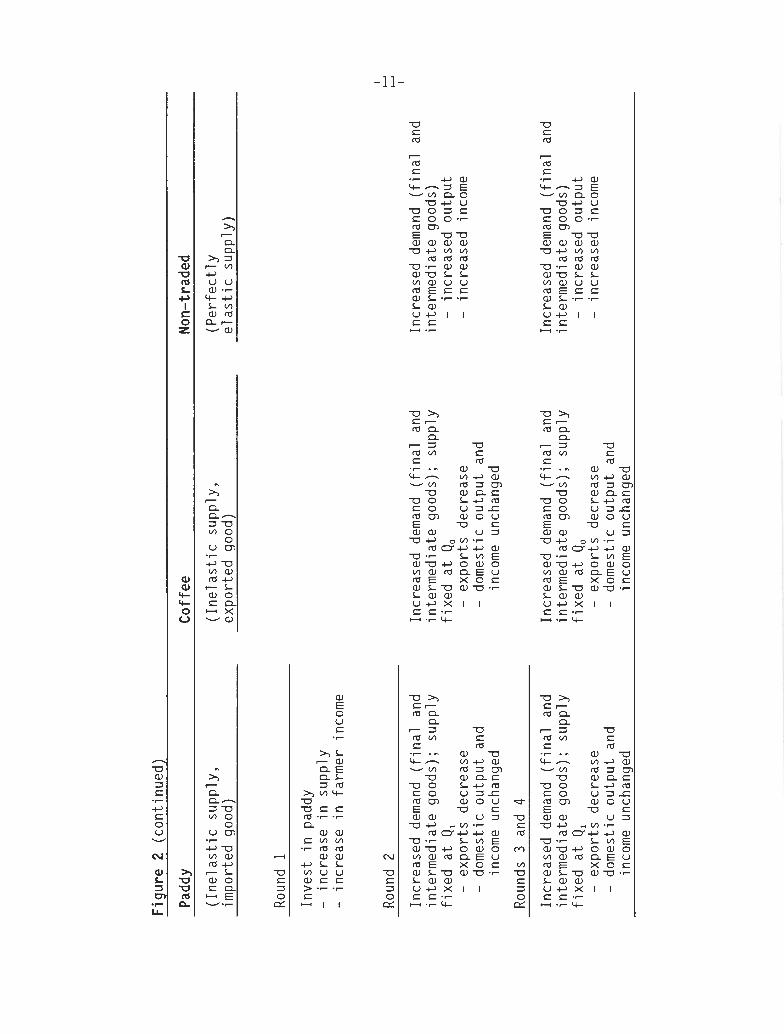
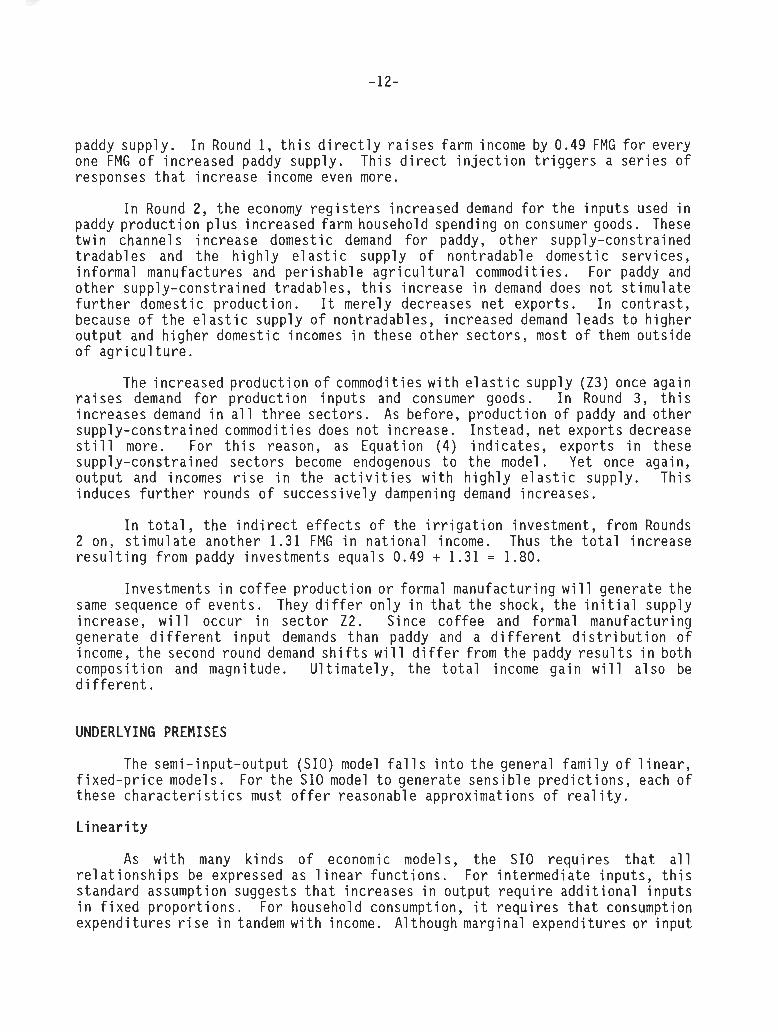
paddy supply. In Round 1, this directly raises farm income by 0 . 4 9 FMG for every one FMG of increased paddy supply. This direct injection triggers a series of responses that increase income even more.
In Round 2, the economy registers increased demand for the inputs used in paddy production plus increased farm household spending on consumer goods. These twin channels increase domestic demand for paddy, other supply-constrained tradabl es and the highly el astic supply of nontradabl e domestic services, informal manufactures and perishable agricultural commodi t i es. For paddy and other supply-constrained tradables, this increase in demand does not stimulate further domestic production. It merely decreases net exports. In contrast, because of the elastic supply of nontradables, increased demand leads to higher output and higher domestic incomes in these other sectors, most of them outside of agri cul ture.
The increased production of commodi t i es with el ast i c supply (23) once again raises demand for production inputs and consumer goods. In Round 3 , this increases demand in all three sectors. As before, production of paddy and other supply-constrained commodities does not increase. Instead, net exports decrease still more. For this reason, as Equation ( 4 ) indicates, exports in these supply-constrained sectors become endogenous to the model. Yet once again, output and incomes rise in the activities with highly elastic supply. This induces further rounds of successively dampening demand increases.
In total, the indirect effects of the irrigation investment, from Rounds 2 on, stimulate another 1 .31 FMG in national income. Thus the total increase resulting from paddy investments equals 0 . 4 9 + 1 .31 = 1 . 8 0 .
Investments in coffee production or formal manufacturing will generate the same sequence of events. They differ only in that the shock, the initial supply increase, will occur in sector 22. Since coffee and formal manufacturing generate different input demands than paddy and a different distribution of income, the second round demand shifts will differ from the paddy results in both composition and magnitude. Ultimately, the total income gain will also be different.
UNDERLYING PREMISES
The semi-input-output (SIO) model falls into the general family of 1 inear, fixed-price models. For the SIO model to generate sensible predictions, each of these characteristics must offer reasonable approximations of real i ty.
Li near i ty
As with many kinds of economic models, the SIO requires that all relationships be expressed as linear functions. For intermediate inputs, this standard assumption suggests that increases in output require additional inputs in fixed proportions. For household consumption, it requires that consumption expenditures rise in tandem with income. A1 though marginal expenditures or input
demands may d i f f e r from the average, the increments must be expressed as l i n e a r functions of output and income.
In genera l , t h i s s impl i f ica t ion does not pose grea t problems. Non-linear systems can be approximated by l i n e a r functions in the short-run. And they o f fe r considerable conveniences in computing model so lu t ions .
Fixed Prices
Fixed pr ices 1 i kewi se vas t ly simpl i fy computational requirements by side-stepping cumbersome issues of subs t i tu t ion in production and consumption. Input-output coe f f i c i en t s and marginal budget shares, which remain fixed in a f i xed-pri ce worl d, become endogenous vari abl e s in a worl d where re1 a t i ve pri ces vary. Whi 1 e computational convenience i s not a strong ra t iona le fo r imposing f ixed p r i ces , i t does o f f e r a strong incentive t o inves t iga te the p l a u s i b i l i t y of such an assumption.
For t r adab le goods, most analys ts agree t h a t the f ixed-price assumption i s appropriate in small countr ies . World markets will determine t h e i r pr ice 1 eve1 . Madagascar, a small country, takes world pr ices as given in a l l markets except van i l l a and cloves where they account f o r over half of world t rade . We will re turn t o the pr ice f i x i t y of van i l l a and cloves in a moment.
For nontraded goods, such as services , informal manufactured goods and many perishable ag r i cu l tu ra l commodities, f ixed prices depend on firms' a b i l i t y t o increase output a t constant cos t . Formally, t h i s requi res a perfec t ly e l a s t i c output supply. Because of the considerable unemployment and excess capacity present in Madagascar, e spec ia l ly in the 1984 base year f o r which the SAM was constructed, the constant cos t assumption appears t o be a reasonable approxi mat i on of real i t y .
Vanilla and cloves, too , even though they are t radable commodities, a re highly el a s t i c in supply. Essenti a1 ly wild gathered crops requir ing primarily harvesting l abor , t h e i r output can be increased a t constant cos t so long as wage r a t e s do not r i s e . Given current underemployment, i t appears t h a t van i l l a and cloves supply can be considered highly e l a s t i c , a t l e a s t in the shor t run.
A t some point , as expansion and 1 iberal iza t ion proceed, supply cons t ra in ts may develop in some of Madagascar's nontradable sec to r s . When t h i s day a r r ives , the SIO model wi l l overs ta te income mu1 t i p l i e r s emanating from sectoral growth. Consequently, some s o r t of adjustment will be required t o capture the income-dampening e f f e c t s of the in f l a t ion t h a t will follow. Recent experiments suggest t h a t in the face of upward-sloping nontradable supply, SIO models overs t a t e t r u e income mu1 t i p l i e r s by 10 t o 25% (Haggblade, Hammer and Hazel 1 , 1991). So the simpl e s t accommodation would involve rul e-of-thumb discounting based these r e s u l t s . A much more complicated a l t e r n a t i v e i s t o use a computable general equi 1 i bri um model . 5
See Dorosh (1994) f o r a descr ip t ion of a C G E model f o r Madagascar.
4 . MODEL SIMULATIONS
The f o l l o w i n g r e s u l t s e x p l o r e t h e t h r e e most commonly cons ide red a1 t e r n a t i ve inves tmen t s t r a t e g i e s f o r Madagascar: foodcrops ( r i c e ) , e x p o r t c rops ( c o f f e e ) and m a n u f a c t u r i n g . I n a g r i c u l t u r e , we model what observe rs c o n s i d e r t h e most l i k e l y sources o f a g r i c u l t u r a l growth, those focused on improved smal l f a rmer t e c h n o l o g y . H i g h - i n p u t techno logy, and i n t h e case o f r i c e , r e h a b i l i t a t i o n o f smal l - s c a l e i r r i g a t i o n p e r i m e t e r s r a t h e r than 1 arge-sca le p e r i m e t e r s o r r a i n f e d c u l t i v a t i o n , seem t h e most v i a b l e avenues f o r f u t u r e inves tmen t . For manu fac tu r ing , we focus on t h e fo rma l sectorQhere, a f t e r decades o f n e g l e c t , supp ly -s ide inves tmen t s e r i o u s l y c o n s t r a i n s growth.
The model s imu l a t i o n assumes t h a t consumers spend a d d i t i o n a l income t h e same way t h e y have i n t h e p a s t , t h a t i s , t h a t average budget shares equal m a r g i n a l s , and t h a t sav ings i s n o t t r a n s l a t e d i n t o investment e x p e n d i t u r e i n t h e s h o r t r u n . Thus inves tmen t i s taken as exogenous.
IMPACT ON GROWTH
Income
Under these assumptions, a 1 FMG i n c r e a s e i n a g r i c u l t u r a l o u t p u t w i l l genera te r o u g h l y 2 FMG i n n a t i o n a l income, 1.802 FMG f o r paddy and 1.974 FMG f o r c o f f e e (Tab le 3 ) . I n c o n t r a s t , manufactured goods produce o n l y h a l f as much income, 0.963 FMG f o r eve ry 1 FMG i n i nc reased o u t p u t . T h i s d i f f e r e n c e a r i s e s p r i m a r i l y because o f s m a l l e r v a l u e added generated by t h e d i r e c t i nc rease i n m a n u f a c t u r i n g o u t p u t . M a t e r i a l i n p u t s used i n formal manu fac tu r ing account f o r 70% p e r c e n t o f t h e v a l u e o f p r o d u c t i o n . Consequent ly, va lue added p e r u n i t o f o u t p u t s tands a t o n l y 30%. Yet i n t h e a g r i c u l t u r a l s e c t o r s , t h e v a l u e added i n t o t a l o u t p u t i s much h i g h e r , 49% i n paddy and 63% f o r c o f f e e . I f d i r e c t i nc rease i n paddy p r o d u c t i o n generates o n l y 0.49 FMG i n income p e r u n i t o f o u t p u t , where does t h e r e m a i n i n g 1.310 FMG (1.802 - 0.492) come from? It comes f rom t h e second and t h i r d round 1 inkages, t h e i n p u t demand and consumption g rowth emanating f rom
6 Smal l - sca l e and i n f o r m a l manu fac tu r ing i s n o t a p p r o p r i a t e f o r comparison i n these s i m u l a t i o n s because i t i s n o t c o n s t r a i n e d by investment c a p i t a l . Because c a p i t a l requ i rements a r e so v e r y smal l i n i n f o r m a l and smal l - s c a l e manu fac tu r ing a c t i v i t i e s , most observe rs c o n s i d e r them t o be c o n s t r a i n e d by d i s c r i m i n a t o r y p o l i c i e s , work ing c a p i t a l , o r by demand, b u t n o t by investment c a p i t a l ( K i l b y , L iedho lm and Meyer, 1984; Haggblade, L iedho lm and Mead, 1986; L iedho lm and Mead, 1987; Page and S t e e l , 1984). Whi le pub1 i c i n t e r v e n t i o n i n suppor t o f these smal l e n t e r p r i s e s i s a p p r o p r i a t e , t h a t i n t e r v e n t i o n w i l l p r i m a r i l y i n v o l v e removal o f d i s c r i m i n a t o r y p o l i c i e s , p r o v i s i o n o f i n f r a s t r u c t u r e , i n c l u d i n g a w e l l - f u n c t i o n i n g c r e d i t system, and f o s t e r i n g a p a t t e r n o f genera l economic growth t h a t genera tes buoyant demand t o which these smal l e n t e r p r i s e s can respond.
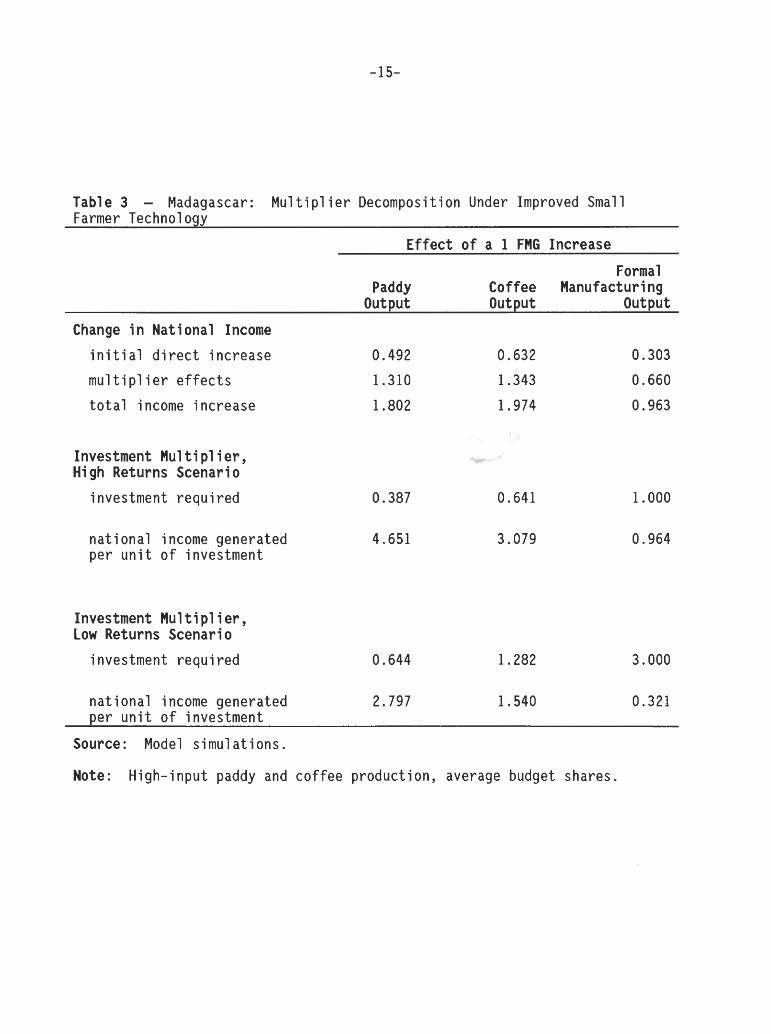
the injection of agricultural growth. Clearly the linkages are important. They account for over two-thirds of total income created, in all three sectors (Table 3 ) .
All three sectors generate large linkages. But in agricultural they are larger, primarily because of larger initial income (value added) and consequently larger second round of consumer spending on local goods and services.
Investment requirements
Ultimately, the efficiency of a1 ternat ive investment strategies depends on how much investment is required to initiate output growth in the first place. Once output grows by 1 FMG, the income consequences are broadly similar in the two agricultural sectors, though only half as large in manufacturing.
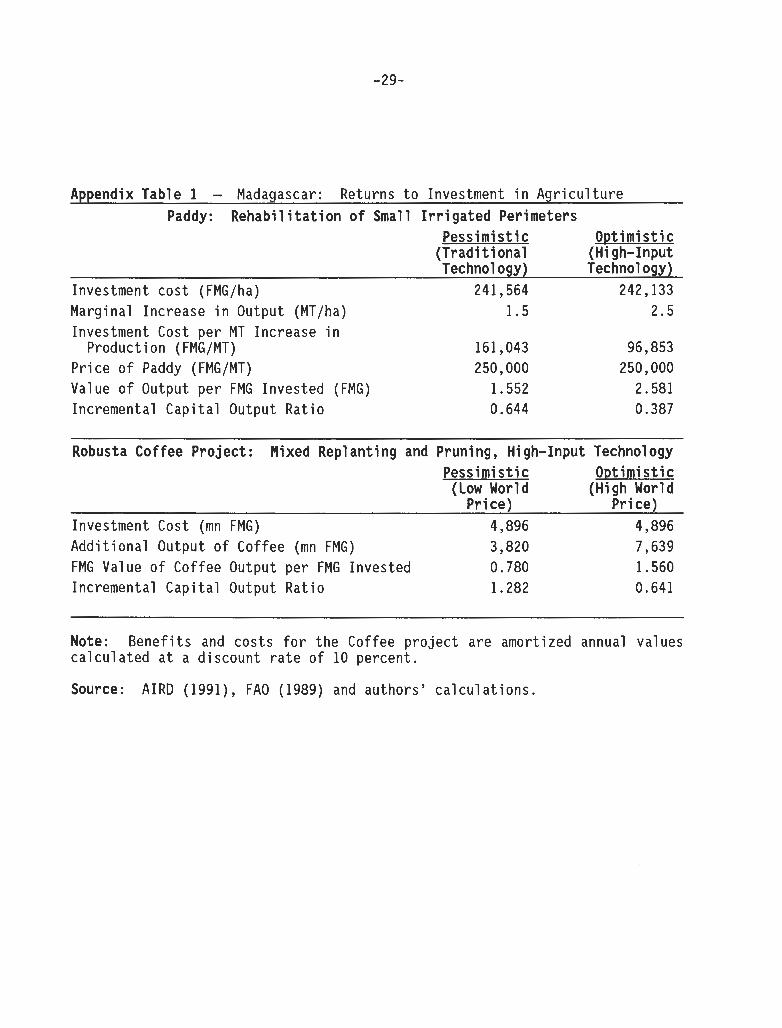
But the investment necessary to increase output of paddy, coffee and formal sector manufactured goods by 1 FMG differ substantially from one another. Given that investment data in all sectors suffer from considerable uncertainty, Table 3 offers both optimistic and pessimistic projections for each of the three sectors under review. For paddy and coffee, the analysis presents two investment scenarios, based on traditional cost-benefit analysis (see Appendix Table 1 for details of the calculations). The paddy scenarios show the costs and benefits for rehabilitation of small irrigated perimeters in the high plateaus using traditional and i nput-intensive technologies (AIRD, 1991). These yield pessimistic and optimistic projections, respectively. The coffee scenarios are based on FA0 (1989) under high and low world coffee price assumptions. For the formal manufacturing sector, it is clear that some industries, such as textiles and food processing require lower fixed investments than others, such as chemicals, metal products and pharmaceuticals. Synthesizing from a variety of sources, Table 3 contrasts two a1 ternative incremental capital -output ratios (ICORs) for manufacturing, 1 for the low-investment industries and 3 for the more capital - i ntensive (World Bank, 1978; Liedholm and Mead, 1987; World Bank, 1991).
Although these investment costs vary considerably across locations (rural versus urban) and over time (short-run investments in paddy versus longer-run investments in coffee and manufacturing), it appears that under best- and worst-case settings for each investment opportunity, policy makers can increase paddy output at significantly lower investment cost than for coffee or manufactured goods. Investment requirements for producing one unit of paddy range from 0.4 - 0.6. This compares with 0.6 - 1.3 in coffee and 1.0 to 3.0 in manufacturing. Under the most optimistic scenario for each activity, paddy requires investments 30% to 60% lower than coffee and manufacturing.
Income/investment multipliers
Given low investment costs and high income per unit of output, paddy generates the largest income multipliers of the three. In the worst-case setting, assuming high-input technology but low marginal increase in output, 1 FMG invested in paddy rehabilitation will generate 2.8 FMG in national income (GDP) . The same 1 FMG invested in coffee, under current 1 ow world prices, would
only y i e l d 1.5 FMG in nat ional income, while t h e gain from a s i m i l a r investment in manufactured goods i s s t i l l smaller , only 0.3 FMG in value added.
Even with more op t imis t i c assumptions on e f f i c i ency of investment in manufacturing, t h e pess imis t i c , low-yield scenario f o r paddy s t i l l r e s u l t s in a much l a r g e r gain in GDP, 2.8 FMG from paddy versus 0.964 FMG f o r manufacturing (Table 3 ) . S imi l a r ly , r e tu rns t o investment in paddy under the low y ie ld scenar io a r e l a r g e r than r e tu rns t o investment in cof fee under the high world cof fee p r i ce scenar io . Thus, on e f f i c i ency grounds i t appears t h a t investments in a g r i c u l t u r e - espec ia l ly paddy - y i e l d much higher r e tu rns than investments in manufacturing.'
EMPLOYMENT AND INCOME DISTRIBUTION
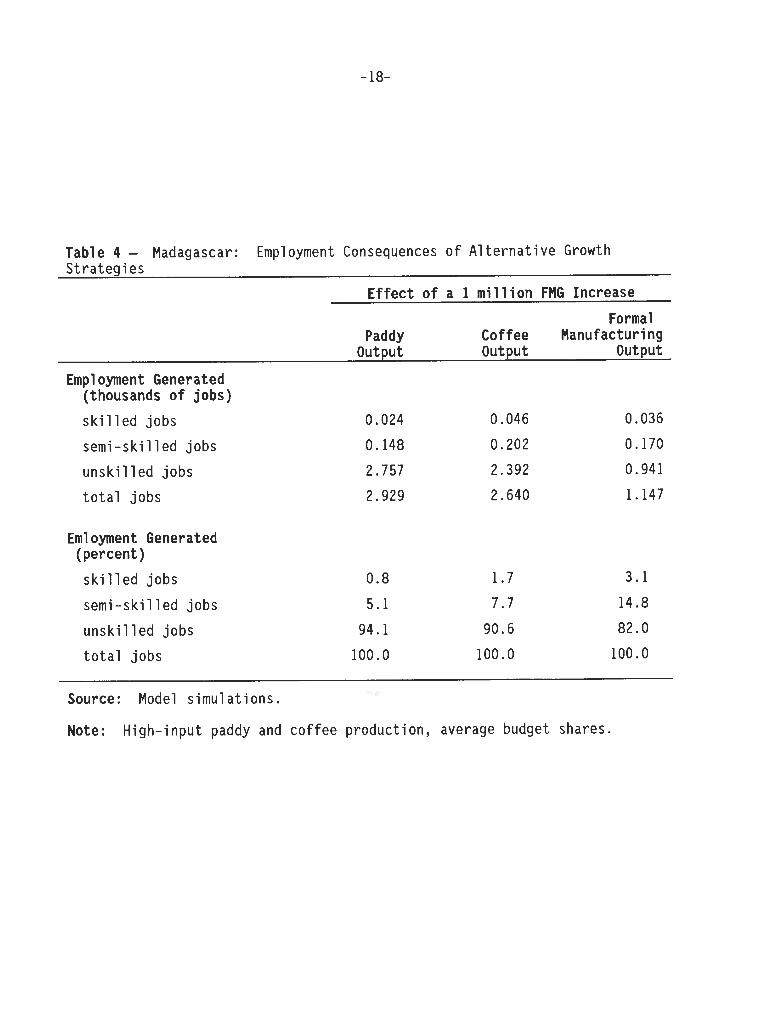
Investment in a g r i c u l t u r e a1 so generates more employment, pa r t i cu l a r l y f o r unski l led l abor , than does investment in manufacturing (Table 4 ) . For each 1 mi l l ion FMG increase in output of paddy and coffee , employment increases by 2.9 and 2.6 jobs , r e spec t ive ly . The same 1 mi l l ion FMG increase in manufacturing output increases employment by only 1 . 1 jobs. Moreover, more than 90 percent of t h e employment generated with increased paddy and coffee output i s f o r unski l led l abor , compared with 82 percent f o r an increase in manufacturing investment.
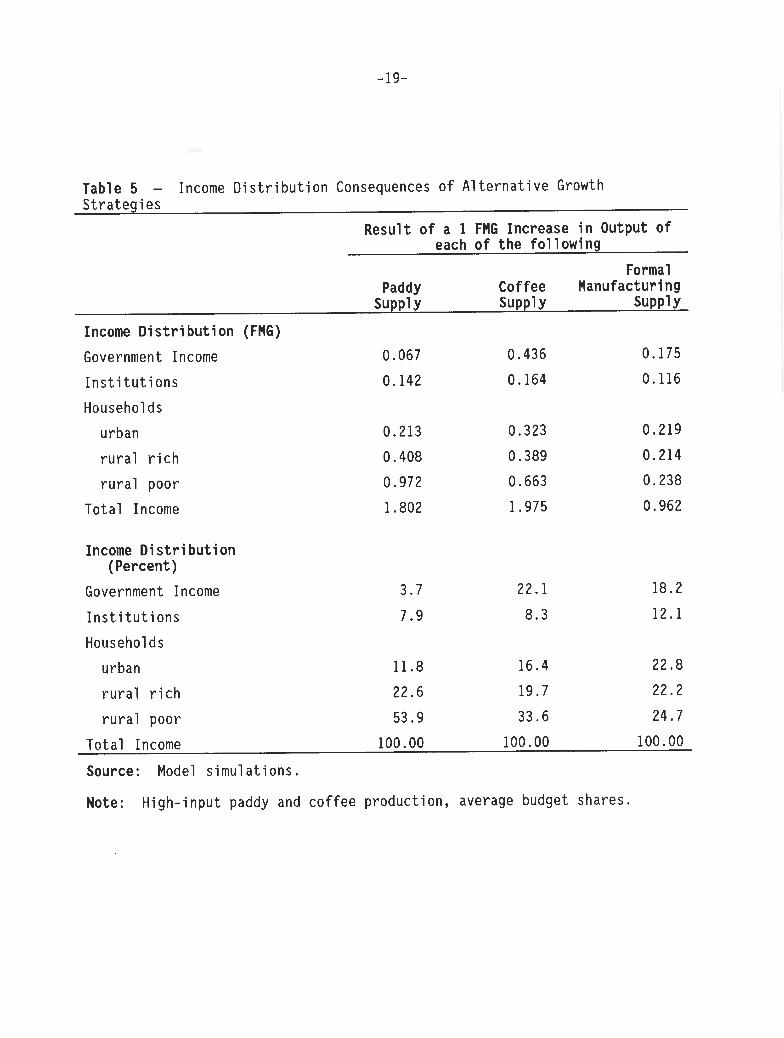
Because t h e g r e a t e r employment generated by paddy and coffee i s concentrated among unski l led workers, these investments r e s u l t in a more equ i t ab le d i s t r i b u t i o n of income as well (Table 5 ) . The ru ra l poor, who c o n s t i t u t e 88 percent of Madagascar's poor (Dorosh, Bernier and S a r r i s , 1990), en joy a much 1 arger gain in incomes when ag r i cu l tu ra l output i s increased. With increased paddy output , t h e rura l poor earn 54 percent of a l l income crea ted , while they rece ive only 34 percent from coffee and 25 percent from manufactured goods.
Su rp r i s ing ly , t h e change in urban household income i s approximately the same f o r a l l t h r e e s e c t o r s , 0.20 t o 0.30 FMG per uni t of output increased. How i s i t poss ib l e t h a t agr icu l ture- led growth generates a t l e a s t as much urban income a s t h a t focused on urban manufacturing? The answer 1 i e s in spa t i a l 1 inkages.
SPATIAL LINKAGES
Not s u r p r i s i n g l y , ru ra l incomes r i s e most with increases in paddy and co f fee , t h e two a g r i c u l t u r a l outputs (Table 6 ) . In absolute terms, rura l incomes r i s e by 1.38 FMG f o r each 1 FMG increase in output of paddy, nearly th ree times
' These scenar ios d i f f e r s l i g h t l y from those in Dorosh and Haggbl ade (1993). For r i c e , t h e pess imis t i c scenar io now models a high input technology but with only a small marginal increase in output of only 1.5 Mt/ha. For cof fee , only t h e value of incremental co f fee output i s used in t h e mu1 t i p 1 i e r ca l cu la t ions here.

as much as t h a t resul t i ng from increased manufacturing output. Three-quarters of the gain in incomes generated from increased paddy output accrue t o rural households. For both coffee and manufactured goods, the income share earned by rural households i s about 50 percent.
The large urban centers a t t r a c t 20 t o 50 percent of a l l income gains under each of the th ree growth scenarios. A1 though the percentages vary, absolute income increments are roughly comparable f o r paddy and manufacturing. For coffee, however, urban income generation i s roughly double t ha t of the other two sectors . The large urban linkages fo r coffee a r i s e mainly because 45% of crop value accrues t o the government and t raders as commodity taxes and commercial margins.
Secondary c i t i e s , so important in many decentralized schemes of development, appear unaffected by any of these s t r a t eg i e s . Yet a growing contingent of geographers, regional pl anners, anthropol ogi s t s and pub1 i c finance economists have become increasingly concerned about the importance of these small towns in fos ter ing an equitable and decentral ized pattern of economic growth (Bendavid-Val, 1989; Karaska and Blesky, 1987; Rondinelli, 1983; Evans, 1989).
Decomposing the t o t a l income gain reveals tha t d i r ec t income accrues, as expected, primarily in rural areas f o r paddy and in urban areas fo r manufacturing (Table 7 ) . Coffee, however, generates large d i r ec t income in urban areas, primarily through heavy taxation of t h i s export crop.
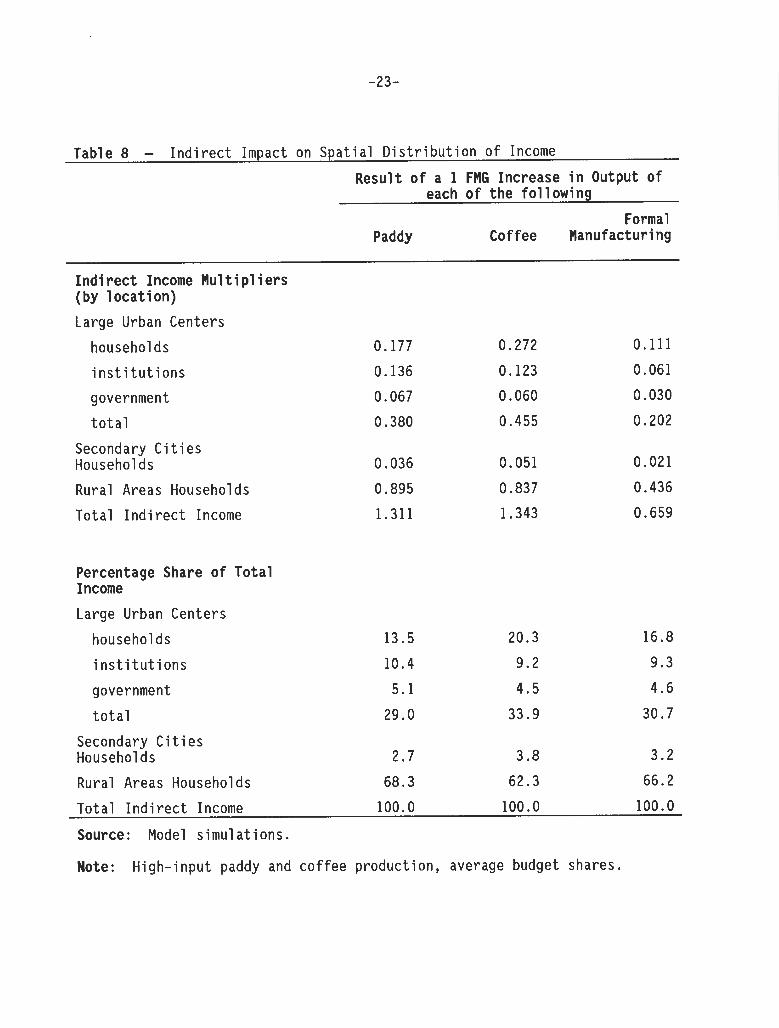
Yet ind i rec t linkages r u n strongly in both di rect ions (Table 8 ) . Agricultural growth generates urban income through increases in demand fo r pr ivate services and informal manufactures. Conversely, manufacturing generates rural income through increases in demand fo r nontradable agr icul tura l products such as milk, meat and vegetables. The share of indirect income accruing t o rural households i s roughly the same fo r a l l three types of investment, 4 2 t o 50 percent.
I n f a c t , in absolute magnitude, indirect 1 i nkages from agr icul ture t o 1 arge c i t i e s are double those from manufacturing (Table 8 ) . This resu l t a r i s e s because of the high use of imported inputs in formal manufacturing as well as the higher import content of urban consumption.


5. CONCLUSIONS
SECTORAL PRIORITIES
Structural adjustment in Madagascar succeeded in generating only a few short years of per capita economic growth after 1988 before pol itical turmoil and a subsequent reversal of liberalization measures led to economic declines again in the early nineties. Restoring and sustaining this growth will require both market reforms, sound government pol icies and appropri ate pub1 ic sector investments as part of a coherent overall development strategy.
The simulation results presented in this chapter strongly suggest that an agricultural ly based investment strategy - particularly one focused on rehabilitation of small irrigated paddy perimeters - will generate the most rapid income growth, the most jobs, the most equitable income distribution, and rapid urban economic growth. Even under the most optimistic assumptions about manufacturing and the most pessimistic returns in agriculture, paddy investments outperform those in manufacturing by a factor of three. And over half of the agricultural income accrues to the rural poor, compared to only 25% for manufacturing. On both equity and efficiency grounds, investments in paddy emerge as the priority option.
As an additional bonus, the urban spinoffs projected from agricultural growth appear surprisingly strong. Both paddy and coffee generate substantial income and employment in large urban centers.
Yet, like manufacturing, they make little impact on secondary urban centers. This is surprising, and disappointing, given the considerable emerging interest in decentralized urbanization. In a modeling exercise such as this, parameters built on present locational patterns may not faithfully forecast the future growth of small towns. Given the 1 arge volume of evidence from el sewhere on the importance of rural towns, it would be premature to discount the rural town 1 i nkages based on this one empirical exercise (Anderson and Lei serson, 1980; Haggbl ade, Hazel 1 and Brown, 1989; Bendavid-Val , 1989; Karaska and Be1 sky, 1987; Evans, 1989). Clearly, more field work is warranted. Perhaps, too, the secondary cities of Madagascar have simply not benefitted from the basic infrastructural investments that el sewhere faci 1 i tate agricultural processing and marketing linkages to develop there.
SUSTAINING THE GROWTH LINKAGES
Growth linkages across urban-rural boundaries have been shown to be signifi.cant for both urban and rural investments. Nearly one quarter of the income generated from increased paddy production accrues to urban households and institutions (including the government). Similarly, rural households earn almost one half the total income generated from investments in formal sector manufacturing. Government policies can help assure that these growth linkages achieve their full potential.
F i r s t , a t t e n t i o n t o r u r a l i n f r a s t r u c t u r e - roads, e l e c t r i c i t y , water, and communications - i s e s p e c i a l l y impor tan t s i nce i t w i l l bo th a f f e c t t h e a b i l i t y o f nonfarm sec to r s t o respond t o t h e increased demand o f farm households and f a c i l i t a t e t h e response o f farm sec to r s t o increased demand o f non-farm households. To ensure t h a t s p i n o f f s achieve t h e i r f u l l p o t e n t i a l w i l l r e q u i r e ongoing dec i s i ons about t h e s i t i n g , cons t ruc t i on , maintenance and f i nance o f r u r a l i n f r a s t r u c t u r e . I n a1 1 these phases, l o c a l d e c i s i o n making and t h e a b i l i t y t o m o b i l i z e l o c a l resources w i l l be key. Th i s makes l o c a l governments impor tan t a c t o r s i n a g r i c u l t u r e - l e d growth s t r a t e g i e s . To p l a y t h e i r r o l e e f f e c t i v e l y , t h e l o c a l a u t h o r i t i e s must en joy t h e necessary p o l i t i c a l and f i n a n c i a l a u t h o r i t y as w e l l as t h e management s k i l l s necessary t o m o b i l i z e l o c a l resources and coo rd i na te d e c i s i o n making.
Second, d i r e c t i n t e r v e n t i o n on b e h a l f o f nonfarm and secondary farm a c t i v i t i e s can e f f e c t i v e l y acce le ra te t h e i r growth. To en joy t h e f u l l b e n e f i t o f t h e a g r i c u l t u r a l l y induced demand s t imu lus , evidence suggests t h a t suppor t ing supp ly -s ide i n t e r v e n t i o n s can be c o s t - e f f e c t i v e (Haggblade, Hazel1 and Brown 1989). Whi le work ing c a p i t a l c r e d i t programs have proven most popu la r , p o l i c y r e fo rm and t e c h n i c a l ass is tance can a l s o be v i a b l e i f j u d i c i o u s l y t a rge ted .
The exper ience o f t h e l a t e 1970s w i t h t h e f a i l e d investment push i n Madagascar i l l u s t r a t e s t h e importance o f p r o j e c t design, fund ing and p o l i c y environment f o r sus ta i nab le growth. I n a d d i t i o n t o these f a c t o r s , maximizing t h e e f f i c i e n c y o f scarce government resources f o r pub1 i c investment wi 11 r e q u i r e s an app rop r i a t e sec to ra l focus as p a r t o f t h e o v e r a l l development s t r a tegy . The growth 1 inkage a n a l y s i s here p rov ides evidence t h a t an a g r i c u l t u r a l l y focused growth s t r a tegy , w i t h c o l l a t e r a l i n c e n t i v e s and suppor t f o r r u r a l i n f r a s t r u c t u r e and nonfarm e n t e r p r i s e s w i l l l i k e l y y i e l d t h e most r a p i d and e q u i t a b l e p a t t e r n o f g rowth f o r Madagascar.
REFERENCES
Anderson, Dennis and Mark Le iserson. 1980. Rural Nonfarm Employment i n Devel o p i nq Count r ies , " Economic Devel o ~ m e n t and Cul t u r a l Chanqe. Vol 28 (2 ) : pp 227-248.
. 1978. Rura l E n t e r p r i s e and Nonfarm Employment. A World Bank Paper. Washington, DC: The World Bank.
Assoc ia tes f o r I n t e r n a t i o n a l Resources and Development. 1991. Madaqascar: I r r i q a t e d sub-sector Review: An Economic and F inanc ia l Ana lys is . Somerv i l l e , MA. D r a f t .
. 1984. Etude du Secteur R i z i c o l e : Rapport F i na le . Somerv i l l e , MA.
Barghout i , Shawki and Guy Lemoigne. 1990. I r r i q a t i o n i n Sub-Saharan A f r i c a : The Development o f Pub1 i c and P r i v a t e Systems. World Bank Technical Paper No. 123. Washington, D.C.: The World Bank.
B e l l , C.P., P. Haze l l , and R. Slade. 1982. P r o j e c t Eva lua t i on i n Reqional Perspec t i ve : A Study o f an I r r i q a t i o n P r o j e c t i n Northwest I n d i a . Ba l t imore , MD: The Johns Hopkins U n i v e r s i t y Press.
Bendavid-Val, Avrom. 1989. "Rural-Urban Linkages: Farming and Farm Households i n Regional and Town Economies. " Review o f Urban and Reqional Development 2:89-97.
Be rn i e r , Ren6 and Paul Dorosh. 1993. Cons t ra i n t s on Rice Product ion i n Madagascar: The Farmer's Perspect ive. Working Paper 34. I thaca , N.Y.: Co rne l l Food and N u t r i t i o n P o l i c y Program.
Dorosh, Paul, Ren6 Be rn i e r , Armand Roger Randri anar ivony and C h r i s t i a n Rasolomanana. 1991. A Soc ia l Account inq M a t r i x f o r Madaqascar: Method01 0q.y and Resu l t s . Working Paper 6. I t haca , N.Y. : Corne l l Food and N u t r i t i o n P o l i c y Program.
Dorosh, Paul A. and Steve Haggblade. 1993. "Ag r i cu l tu re -1 ed Growth: Foodgrains versus Expor t Crops i n Madagascar." A s r i c u l t u r a l Economics ( 9 ) . pp. 165-180.
Dorosh, Paul A , , Steve Haggbl ade, e t . a1 . 1991. " A g r i c u l t u r a l Growth Linkages i n Madagascar." Working Paper 22. I thaca , N.Y.: Co rne l l Food and N u t r i t i o n P o l i c y Program.
Dorosh, Paul A., Rene E. Be rn i e r and Alexander H. S a r r i s . 1990. Macroeconomic Adjustment and t h e Poor: The Case o f Madaqascar. Monograph 9. I thaca , N.Y.: Co rne l l Food and N u t r i t i o n P o l i c y Program.
Dorosh, Paul . 1994. S t r u c t u r a l Adjustment. Growth and Pover tv i n Madaqascar: A CGE Ana l vs i s . Cornel 1 U n i v e r s i t y Food and N u t r i t i o n Pol i c y Program. Monograph No. 17. I thaca , NY.
Evans, Hugh Emrys. 1989. "Rural-Urban Linkages: D r a f t F i n a l Repor t . " (mimeo) Urban Development D i v i s i o n . Washington, DC: The World Bank.
F.A.O. 1989. Madaqascar: P r o j e t de Financement du Sous Secteur Cafe - Rapport de P repa ra t i on . Rapport du Programme de Cooperat ion FAO/Banque Mondiale Cent re d ' Inves t i ssement 18/89 CP-MAG27. Rome: Food and A g r i c u l t u r e O rgan i za t i on .
Haggbl ade, S., J. Hammer and P. Hazel 1. 1991. "Model i n g A g r i c u l t u r a l Growth Mu1 t i p 1 i e r s . " American Journa l o f Aq r i c u l t u r a l Economics. Volume 73 No. 2. May.
Haggblade, S., P. Hazel1 and J . Brown. 1989. "Farm-NonFarm Linkages i n Rural Sub-Saharan A f r i c a . " World Development. Vo l . 17, No. 8.
.Haggblade, Steven, Car l L iedholm and Donald C. Mead. 1986. "The E f f e c t o f Pol i c y and Pol i c y Reforms on Non-Agri c u l t u r a l En te rp r i ses and Employment i n Develop ing Count r ies : A Review o f Past Experiences." EEPA Discuss ion Paper No.1. Cambridge: Harvard I n s t i t u t e f o r I n t e r n a t i o n a l Development.
Karaska, Gera ld J . and E r i c S. Belsky. 1987. "Rural /Urban Dynamics i n Regional Pl anni ng : Exampl es f rom Underdeveloped Regions . " i n Bar-el e t . a1 , eds. P a t t e r n s o f Chanqe i n Devel o ~ i nq Reqi ons. Boulder, Colorado: Westview Press.
K i l by, Pe te r ; Car l Liedholm, and Richard L. Meyer. 1984. "Working Cap i t a l and Nonfarm Rural En te rp r i ses . " Undermininq Rural Development w i t h Cheap C r e d i t . D. Adams, D. Graham and J.D. Von Pischke, E d i t o r s , Boulder, Colorado: Westview Press.
Liedholm, Car l and Mead, Donald. 1987. "Small Scale I n d u s t r i e s i n Developing Count r ies : Emp i r i ca l Evidence and P o l i c y I m p l i c a t i o n s . " MSU I n t e r n a t i o n a l Development Papers, No. 9. East Lansing, M I : Department o f A g r i c u l t u r a l Economics, M ich igan S t a t e U n i v e r s i t y .
Page, John and S tee l , W i 11 i am F. 1984. "Small E n t e r p r i s e Development: Economic Issues f rom A f r i c a n Exper ience." World Bank Technica l Paper No. 26. Washington, DC: World Bank.
R o n d i n e l l i , Dennis. 1983. Secondarv C i t i e s i n Developinq Count r ies : P o l i c i e s f o r D i f f u s i n q Urban iza t ion . Bever l y H i l l s , CA: Sage P u b l i c a t i o n s .

World Bank. 1993. World Tables. Washington, DC.: World Bank.
. 1991. World Development Report. New York: Oxford U n i v e r s i t y Press.
. 1978. "Employment and Development o f Small En te rp r i ses . " Sector P o l i c v P a ~ e r . Washington, DC.: World Bank.