Growth in emission transfers via international trade from 1990 to 2008
6
Growth in emission transfers via international trade from 1990 to 2008 Glen P. Peters a,1 , Jan C. Minx b,c , Christopher L. Weber d,e , and Ottmar Edenhofer c,f a Center for International Climate and Environmental Research–Oslo, N-0318 Oslo, Norway; b Department for Sustainable Engineering, and c Department for the Economics of Climate Change, Technical University Berlin, 10623 Berlin, Germany; d Science and Technology Policy Institute, Washington, DC 20010; e Civil and Environmental Engineering, Carnegie Mellon University, Pittsburgh, PA 15213; and f Potsdam Institute for Climate Impact Research, D-14412 Potsdam, Germany Edited by William C. Clark, Harvard University, Cambridge, MA, and approved March 29, 2011 (received for review May 12, 2010) Despite the emergence of regional climate policies, growth in global CO 2 emissions has remained strong. From 1990 to 2008 CO 2 emis- sions in developed countries (defined as countries with emission- reduction commitments in the Kyoto Protocol, Annex B) have sta- bilized, but emissions in developing countries (non-Annex B) have doubled. Some studies suggest that the stabilization of emissions in developed countries was partially because of growing imports from developing countries. To quantify the growth in emission transfers via international trade, we developed a trade-linked global database for CO 2 emissions covering 113 countries and 57 economic sectors from 1990 to 2008. We find that the emissions from the production of traded goods and services have increased from 4.3 Gt CO 2 in 1990 (20% of global emissions) to 7.8 Gt CO 2 in 2008 (26%). Most developed countries have increased their consumption-based emissions faster than their territorial emissions, and non–energy-intensive manufacturing had a key role in the emission transfers. The net emission transfers via international trade from developing to developed countries increased from 0.4 Gt CO 2 in 1990 to 1.6 Gt CO 2 in 2008, which exceeds the Kyoto Pro- tocol emission reductions. Our results indicate that international trade is a significant factor in explaining the change in emissions in many countries, from both a production and consumption per- spective. We suggest that countries monitor emission transfers via international trade, in addition to territorial emissions, to ensure progress toward stabilization of global greenhouse gas emissions. carbon footprint | carbon leakage | emissions embodied in trade | input- output analysis | emission inventory S ubstantial reductions in global emissions are needed to re- duce the risk of “dangerous” anthropogenic climate change (1, 2). According to the United Nations Framework Convention on Climate Change (UNFCCC), the level of mitigation for an in- dividual country should be based on “equity and in accordance with their common but differentiated responsibilities and respective capabilities” (2). This concept is implemented in the Kyoto Pro- tocol as a fragmented, two-tier mitigation strategy in which de- veloped countries are given a “quantified emission limitation or reduction commitment” (3) for the period 2008 to 2012, usually relative to the base year 1990. The developing countries do not have emission commitments to allow for the needed economic devel- opment. Under the Intergovernmental Panel on Climate Change (IPCC) accounting rules, mitigation only applies to “greenhouse gas emissions and removals taking place within national territory and offshore areas over which the country has jurisdiction” (4). Even though the Kyoto Protocol will soon expire (2012), it is within this context that the UNFCCC, the Kyoto Protocol, and potential future alternatives will be evaluated. In addition, re- gional climate policies, such as the European Union Emission Trading System, are often based—and hence evaluated—on sim- ilar underlying principles. A challenge with a territorial-based emission accounting system in the context of a fragmented mitigation architecture is that connections between economies are not directly considered. In particular, international trade and investment flows provide a link between production and consumption in different countries. Ig- noring these connections might result in a misleading analysis of the underlying driving forces of global, regional, and national emission trends and mitigation policies. In the context of in- ternational trade, the development of CO 2 emissions since 1990 can be used to illustrate this point. Global emissions have grown 39% from 1990 to 2008, with accelerated growth in the last de- cade (5). At the regional level, however, emissions in the group of developed countries (denoted here as Annex B countries in the Kyoto Protocol, with quantified emission limitations) have largely stabilized, but emissions in the group of developing countries have doubled (5). Emission trajectories vary for individual countries, but a general trend is that emissions have increased most in rap- idly growing economies (5, 6). From this territorial perspective, developing countries have the largest share of emissions and are allocated most of the emissions growth. However, this viewpoint does not consider the connections between developed and de- veloping countries via international trade. Some have argued that the divergent emission trends between developed and developing countries are partially the result of a transfer of emissions between countries facilitated via rapidly growing international trade flows (5, 7). Numerous static studies exist for individual countries (8, 9) and a growing number of studies are appearing in time-series, such as China (10, 11) as a net ex- porter and the United Kingdom (12, 13) and the United States (14) as net importers. Global models have provided more country detail, but lack the ability to consistently track changes over time (15–19). All these studies show a growing importance of international trade in regional emissions trends and indicate strong regional dis- parities, with most developed countries as net importers of emis- sions and most developing countries as net exporters. If such studies are found to be robust across more countries and over relevant time periods, then growth in international trade may fa- cilitate emission reductions for net importers (currently developed countries) and emission increases in net exporters (currently de- veloping countries). The aims of this study are to quantify the role of international trade in global, regional, and country emission growth and to determine if changes in international trade may have facilitated emission reductions in developed countries. We construct an an- nual time-series from 1990 to 2008 of CO 2 emission inventories based on consumption by adjusting territorial emission in- ventories with estimates of the net emission transfers via in- ternational trade (20). The net emission transfers represent the CO 2 emissions in each country to produce exported goods and services minus the emissions in other countries to produce imported goods and services, and are sometimes called the “bal- ance of emissions embodied in trade” (21). For the figures and Author contributions: G.P.P., J.C.M., and C.L.W. designed research; G.P.P., J.C.M., and C.L.W. performed research; G.P.P., J.C.M., C.L.W., and O.E. analyzed data; and G.P.P., J.C.M., C.L.W., and O.E. wrote the paper. The authors declare no conflict of interest. This article is a PNAS Direct Submission. Freely available online through the PNAS open access option. See Commentary on page 8533. 1 To whom correspondence should be addressed. E-mail: [email protected]. This article contains supporting information online at www.pnas.org/lookup/suppl/doi:10. 1073/pnas.1006388108/-/DCSupplemental. www.pnas.org/cgi/doi/10.1073/pnas.1006388108 PNAS | May 24, 2011 | vol. 108 | no. 21 | 8903–8908 SUSTAINABILITY SCIENCE SEE COMMENTARY
Transcript of Growth in emission transfers via international trade from 1990 to 2008

Growth in emission transfers via internationaltrade from 1990 to 2008Glen P. Petersa,1, Jan C. Minxb,c, Christopher L. Weberd,e, and Ottmar Edenhoferc,f
aCenter for International Climate and Environmental Research–Oslo, N-0318 Oslo, Norway; bDepartment for Sustainable Engineering, and cDepartment for theEconomics of Climate Change, Technical University Berlin, 10623 Berlin, Germany; dScience and Technology Policy Institute, Washington, DC 20010; eCivil andEnvironmental Engineering, CarnegieMellon University, Pittsburgh, PA 15213; and fPotsdam Institute for Climate Impact Research, D-14412 Potsdam, Germany
Edited by William C. Clark, Harvard University, Cambridge, MA, and approved March 29, 2011 (received for review May 12, 2010)
Despite the emergenceof regional climate policies, growth in globalCO2 emissions has remained strong. From 1990 to 2008 CO2 emis-sions in developed countries (defined as countries with emission-reduction commitments in the Kyoto Protocol, Annex B) have sta-bilized, but emissions in developing countries (non-Annex B) havedoubled. Some studies suggest that the stabilization of emissionsin developed countries was partially because of growing importsfrom developing countries. To quantify the growth in emissiontransfers via international trade, we developed a trade-linkedglobal database for CO2 emissions covering 113 countries and 57economic sectors from 1990 to 2008. We find that the emissionsfrom the production of traded goods and services have increasedfrom 4.3 Gt CO2 in 1990 (20% of global emissions) to 7.8 Gt CO2
in 2008 (26%). Most developed countries have increased theirconsumption-basedemissions faster than their territorial emissions,and non–energy-intensive manufacturing had a key role in theemission transfers. The net emission transfers via internationaltrade from developing to developed countries increased from 0.4Gt CO2 in 1990 to 1.6 Gt CO2 in 2008, which exceeds the Kyoto Pro-tocol emission reductions. Our results indicate that internationaltrade is a significant factor in explaining the change in emissionsin many countries, from both a production and consumption per-spective. We suggest that countries monitor emission transfers viainternational trade, in addition to territorial emissions, to ensureprogress toward stabilization of global greenhouse gas emissions.
carbon footprint | carbon leakage | emissions embodied in trade | input-output analysis | emission inventory
Substantial reductions in global emissions are needed to re-duce the risk of “dangerous” anthropogenic climate change
(1, 2). According to theUnitedNations FrameworkConvention onClimate Change (UNFCCC), the level of mitigation for an in-dividual country should be based on “equity and in accordance withtheir common but differentiated responsibilities and respectivecapabilities” (2). This concept is implemented in the Kyoto Pro-tocol as a fragmented, two-tier mitigation strategy in which de-veloped countries are given a “quantified emission limitation orreduction commitment” (3) for the period 2008 to 2012, usuallyrelative to the base year 1990. The developing countries donot haveemission commitments to allow for the needed economic devel-opment. Under the Intergovernmental Panel on Climate Change(IPCC) accounting rules, mitigation only applies to “greenhousegas emissions and removals taking place within national territoryand offshore areas over which the country has jurisdiction” (4).Even though the Kyoto Protocol will soon expire (2012), it iswithin this context that the UNFCCC, the Kyoto Protocol, andpotential future alternatives will be evaluated. In addition, re-gional climate policies, such as the European Union EmissionTrading System, are often based—and hence evaluated—on sim-ilar underlying principles.A challenge with a territorial-based emission accounting system
in the context of a fragmented mitigation architecture is thatconnections between economies are not directly considered. Inparticular, international trade and investment flows provide a linkbetween production and consumption in different countries. Ig-noring these connections might result in a misleading analysis of
the underlying driving forces of global, regional, and nationalemission trends and mitigation policies. In the context of in-ternational trade, the development of CO2 emissions since 1990can be used to illustrate this point. Global emissions have grown39% from 1990 to 2008, with accelerated growth in the last de-cade (5). At the regional level, however, emissions in the group ofdeveloped countries (denoted here as Annex B countries in theKyoto Protocol, with quantified emission limitations) have largelystabilized, but emissions in the group of developing countries havedoubled (5). Emission trajectories vary for individual countries,but a general trend is that emissions have increased most in rap-idly growing economies (5, 6). From this territorial perspective,developing countries have the largest share of emissions and areallocated most of the emissions growth. However, this viewpointdoes not consider the connections between developed and de-veloping countries via international trade.Some have argued that the divergent emission trends between
developed and developing countries are partially the result of atransfer of emissions between countries facilitated via rapidlygrowing international trade flows (5, 7). Numerous static studiesexist for individual countries (8, 9) and a growing number of studiesare appearing in time-series, such as China (10, 11) as a net ex-porter and theUnited Kingdom (12, 13) and theUnited States (14)as net importers.Globalmodels have providedmore country detail,but lack the ability to consistently track changes over time (15–19).All these studies show a growing importance of international tradein regional emissions trends and indicate strong regional dis-parities, with most developed countries as net importers of emis-sions and most developing countries as net exporters. If suchstudies are found to be robust across more countries and overrelevant time periods, then growth in international trade may fa-cilitate emission reductions for net importers (currently developedcountries) and emission increases in net exporters (currently de-veloping countries).The aims of this study are to quantify the role of international
trade in global, regional, and country emission growth and todetermine if changes in international trade may have facilitatedemission reductions in developed countries. We construct an an-nual time-series from 1990 to 2008 of CO2 emission inventoriesbased on consumption by adjusting territorial emission in-ventories with estimates of the net emission transfers via in-ternational trade (20). The net emission transfers represent theCO2 emissions in each country to produce exported goods andservices minus the emissions in other countries to produceimported goods and services, and are sometimes called the “bal-ance of emissions embodied in trade” (21). For the figures and
Author contributions: G.P.P., J.C.M., and C.L.W. designed research; G.P.P., J.C.M., and C.L.W.performed research; G.P.P., J.C.M., C.L.W., and O.E. analyzed data; and G.P.P., J.C.M., C.L.W.,and O.E. wrote the paper.
The authors declare no conflict of interest.
This article is a PNAS Direct Submission.
Freely available online through the PNAS open access option.
See Commentary on page 8533.1To whom correspondence should be addressed. E-mail: [email protected].
This article contains supporting information online at www.pnas.org/lookup/suppl/doi:10.1073/pnas.1006388108/-/DCSupplemental.
www.pnas.org/cgi/doi/10.1073/pnas.1006388108 PNAS | May 24, 2011 | vol. 108 | no. 21 | 8903–8908
SUST
AINABILITY
SCIENCE
SEECO
MMEN
TARY

tables, our sign convention is as for an economic balance of trade:net exporters are positive (surplus) and net imports are negative(deficit). Throughout the text we explicitly indicate the directionof net emission transfers and report positive values only.Our analysis is global but disaggregated into 113 regions (in-
cluding 95 individual countries), each with 57 economic sectors.We use two detailed attribution methods (20) for the years 1997,2001, and 2004, and develop a method to construct annual esti-mates from 1990 to 2008 (see Materials and Methods). All threemethods include the emissions that occur in the supply chain toproduce consumed goods and services (22) (e.g., products pro-duced in China but consumed in Europe). The detailed modelsare more accurate and cover domestic supply chains (15) (emis-sions embodied in bilateral trade, EEBT) or global supply chains(16, 17) (multiregional input-output, MRIO). We use bothmethods as they address different perspectives on allocating theemissions from international trade (20). The full-time series from1990 to 2008 (time-series with trade, TSTRD) is based on grossdomestic product (GDP), bilateral trade, and emission statisticsfrom established global datasets and is calibrated to the EEBTmethod based on the proxy years 1997, 2001, and 2004 (seeMaterials and Methods). Although the proxy years 1997, 2001, and2004 are more detailed and accurate, the TSTRD method allowsthe assessment of trends over long time periods and to more re-cent years. We focus on CO2 emissions from fossil-fuel combus-tion, cement production, and gas flaring (23) because of theabsence of detailed time-series data on land-use change and othergreenhouse gas emissions with the necessary detail.
ResultsGlobal CO2 emissions from the production of exported productshave increased from 4.3 Gt CO2 in 1990 (20% of global CO2emissions) to 7.8 Gt CO2 in 2008 (26% of global CO2 emissions)(Table 1). This increase makes CO2 emissions from the pro-duction of exported products similar in magnitude to land-usechange-related emissions (5). Moreover, from 1990 to 2008,emissions from the production of exported products grew 4.3%per year, faster than the growth in global population (1.4% peryear), CO2 emissions (2.0% per year), GDP (3.6% per year), butslower than the dollar value of international trade (12% per year)(Fig. 1). Although there has been strong growth in internationaltrade at the aggregated level, the structure of international tradehas also changed. Combined with different emission intensities indifferent regions, the changes in international trade structure andvolume indicate large regional shifts in the location of emissions
from the production of goods and services and the location ofconsumption. We analyze these regional shifts using the conceptof net emission transfers as defined earlier and discussed in theMaterials andMethods. First, we consider net emission transfers inthe context of developed (Annex B) versus developing (non-Annex B) countries, and then at the regional and country level.The net emission transfers from non-Annex B to Annex B has
grown from 0.4 Gt CO2 in 1990 to 1.6 Gt CO2 in 2008 (17% peryear average growth) (Fig. 2 and Table 1). Emission transfersfrom non-Annex B to other non-Annex B countries have grownfastest, followed closely by the emission transfers from non-AnnexB to Annex B countries (Fig. 1, Table 1, and SI Appendix, Fig. S9).For comparison, if the average emission reduction target forAnnex B countries in the Kyoto Protocol (∼5% reduction of 1990emissions) is applied to CO2 emissions only, representing ∼0.7 GtCO2 per year, then the net emission transfers from non-Annex Bto Annex B countries is 18% higher on average (1990–2008) and130% higher in 2008. Because estimated Annex B emissionreductions from 1990 to 2008 are only ∼2%, representing 0.3 GtCO2, the net emission transfers from non-Annex B to Annex Bcountries is 520% higher in 2008. Cumulatively, we find that in-ternational trade has relocated 16 Gt CO2 from Annex B to non-Annex B countries from 1990 to 2008. If historic trends continuelinearly (Fig. 2), the net emission transfers from the group of non-Annex B countries to Annex B countries will be around 2.3 GtCO2 per year in 2020, representing 16% of Annex B emissions in1990. This finding is comparable to the most optimistic 2020emission limitations offered by Annex B countries in the Copen-hagen Accord (24).For the years 1997, 2001, and 2004, we have more detailed and
robust datasets that allow comparisons with the time-series method,TSTRD. We find that the more detailed methods increase theestimated net emission transfers from non-Annex B to Annex Bcountries (Fig. 2), signifying that the TSTRD method producesconservative estimates. For the 3 y where all methods overlap,24% (TSTRD), 25% (EEBT), and 33% (MRIO) of the growth ofnon-Annex B emissions can be assigned to Annex B consumption.The results are higher for theMRIOmethod, because it considersnot only the trade activities between two individual countries, butalso the trade through multiple countries until the final product isdelivered to consumers (16, 20). Comparisons of the TSTRD andEEBT methods with the MRIO method consistently show thatincluding the global supply chain attributes more non-Annex Bemissions to Annex B countries compared with methods that donot fully consider the role of emissions-associated imports, whichare then used to produce exports (SI Appendix). This finding
Table 1. Allocation of global emissions to Annex B and non-Annex B countries separated into domestic and internationally tradedcomponents
Component 1990 (Gt CO2) 2008 (Gt CO2) Growth (%/y)
Annex BDomestic Annex B Domestic (Bdom) 11.3 10.8 −0.3Trade component Annex B to Annex B (B2B) 2.1 2.2 0.2
Annex B to non-Annex B (B2nB) 0.7 0.9 1.8Production Annex B production (Bprod = Bdom + B2B + B2nB) 14.2 13.9 −0.1Consumption Annex B consumption (Bcons = Bdom + B2B + nB2B) 14.5 15.5 0.3
Non-Annex BDomestic Non-Annex B domestic (nBdom) 6.2 11.7 4.6Trade component Non-Annex B to Annex B (nB2B) 1.1 2.6 7.0
Non-Annex B to non-Annex B (nB2nB) 0.4 2.2 21.5Production Non-Annex B production (nBprod = nBdom + nB2B + nB2nB) 7.7 16.4 5.9Consumption Non-Annex B consumption (nBcons = nBdom + B2nB + nB2nB) 7.4 14.8 5.3
Trade totals Traded emissions (B2B + B2nB + nB2B + nB2nB) 4.3 7.8 4.3Trade balance (B2nB − nB2B) −0.4 −1.6 16.9Global emissions (Bprod + nBprod = Bcons + nBcon) 21.9 30.3 2.0
Annex B components: Bdom, emission to produce and consume goods and services in Annex B countries; B2B, production in one Annex B country withconsumption in another Annex B country; B2nB, production in an Annex B country with consumption in a non-Annex B country. Likewise for non-Annex Bcountries (nBdom, nB2B, nB2nB). The full time series 1990 to 2008 and results for the detailedmethods for 1997, 2001, and 2004 are in the SI Appendix, Dataset S1.
8904 | www.pnas.org/cgi/doi/10.1073/pnas.1006388108 Peters et al.

indicates the growing importance of trade between non-Annex Bcountries in the production of goods consumed in Annex Bcountries (25).When the reported territorial emissions are adjusted for net
emission transfers, a consumption-based emission inventory isobtained (analogous to a carbon footprint for CO2 only) (20, 26)(SI Appendix, Figs. S10 and S11). For individual countries, a shiftto consumption-based emissions often changes the emissionranking of countries. For example, China is the largest emitter ofCO2 emissions with a territorial-based inventory, with the UnitedStates second, but with a consumption-based inventory theUnitedStates is first and China second (SI Appendix, Fig. S11). Most de-veloped countries increase their ranking with a consumption-based inventory (SI Appendix, Dataset S1). Globally, all territorialemission growth has taken place in the group of non-Annex Bcountries, despite variations in individual Annex B and non-AnnexB countries (5). However, the difference between Annex B con-sumption-based emissions and territorial emissions is growing overtime (Fig. 2 and SI Appendix, Fig. S10). In terms of consumption-based inventories, 11% of the growth in global CO2 emissions canbe attributed to Annex B consumption (instead of a 3% reductionfor territorial). Thus, a significant share of the growth in Annex Bconsumption since 1990 is reported in the emission statistics ofnon-Annex B countries. This share would be further increased ifa share of capital formation was allocated to exports instead ofconsidering capital as domestic consumption only (27, 28).Within the group of Annex B nations, territorial emission
reductions and changes in net emission transfers with non-AnnexB countries have varied. Fig. 3 compares the change in netemission transfers for selected countries with the estimated
change in territorial emissions from 1990 to 2008 and the KyotoProtocol reduction commitments. In all cases shown, net emis-sion transfers have grown over time, despite variations in thechange in territorial emissions. The United States has increasedemissions 17%, despite a pledge to reduce emissions by 7% (3),yet at the same time the change in emission transfers have ad-ditionally supported increased consumption in the United States.Similarly, with a 6% reduction in territorial emissions, Europe isclose to meeting its Kyoto Protocol target of an ∼8% reduction(3); however, the additional net emission transfers from non-Annex B countries are larger than these reductions. The re-mainder of the non-Annex B countries have had a substantialreduction in territorial emissions (−16%), primarily because ofthe collapse of the Russian Federation and Ukraine in the early1990s. However, even in this case, the net emission transfers withnon-Annex B countries have increased over time. Collectively,the net CO2 emission reduction of ∼2% (0.3 Gt CO2) in Annex Bcountries from 1990 to 2008 is much smaller than the additionalnet emission transfer of 1.2 Gt CO2 from non-Annex B to AnnexB countries (equivalent to subtracting the net emission transfersin 2008 from 1990 in Fig. 2).Fig. 4 shows the total emission transfers for six aggregated
regions (exports and imports shown separately in SI Appendix,Figs. S4 and S5) for both Annex B and non-Annex B countries.The net emission transfers via international trade are shown be-tween each region with all other regions (black line) and the netemission transfers between the United States, Europe, and therest of Annex B with the non-Annex B countries (dotted blackline). Consistent with other studies, we find particularly rapidgrowth in Chinese exported emissions (10, 11). Our results show
100120140160180200220240260280300320340360380400420
Population
Gross Domestic Product (GDP)
International Trade
Global fossil CO2 emissions
Emissions embodied in trade
Net emission transfers Annex B to non-Annex B
Fig. 1. The development of various global macrovariablesindexed to 1990. Source: Population (US Census Bureau), GDP,and international trade in constant prices (United NationsNational Account Estimates of Main Aggregates), fossil-fueland process emissions (Carbon Dioxide Information AnalysisCenter) (23), emissions embodied in global trade (presentstudy), and the net emission transfers between Annex B andnon-Annex B countries (present study).
-1.8
-1.6
-1.4
-1.2
-1.0
-0.8
-0.6
-0.4
-0.2
0.0
1990
1991
1992
1993
1994
1995
1996
1997
1998
1999
2000
2001
2002
2003
2004
2005
2006
2007
2008
Net
emission
transfers(GtC
O2)
Net emission transfers (TSTRD)Net emission transfers (EEBT)Net emission transfers (MRIO)Net emission transfers (TSTRD Average)5%Kyoto Reduc�on
Fig. 2. The net emission transfers between non-Annex B andAnnex B countries using the TSTRD, EEBT, and MRIO methods.The change in the net emission transfers over time are com-pared with the Kyoto Protocol emission reduction target of∼5% relative to 1990 (red line) and the average net emissiontransfer from 1990 to 2008 (black line). The EEBT and MRIOmethods give a larger net emission transfer from non-Annex Bto Annex B countries, signifying that the TSTRD method isconservative. The MRIO is larger than the EEBT method as theMRIO considers global supply chains (see text).
Peters et al. PNAS | May 24, 2011 | vol. 108 | no. 21 | 8905
SUST
AINABILITY
SCIENCE
SEECO
MMEN
TARY

that Chinese emissions accounted for 55% of the growth in globalCO2 emissions from 1990 to 2008 and the production of Chineseexports accounted for 18% of the growth in global CO2 emissions.Furthermore, the production of Chinese exports later exported toAnnex B countries accounted for 75% of the growth in Annex Bconsumption-based emissions. We also identify large growth inthe emissions from the production of exports in other non-AnnexB countries and, as with China, a considerable share of the growthis toward other non-Annex B countries. The United States hasshown rapid growth in imported emissions, largely because ofChina and other developing nations (14). Because of the collapseof the former Soviet Union, Europe had a drop in net emissiontransfers with the rest of the world in themid 1990s, despite stronggrowth from 1990 to 2008 in emission transfers with non-Annex Bcountries (as for the United States). The remainder of the AnnexB countries have had strong growth in imported products, despiteincluding net exporters such as Australia, Ukraine, and the Rus-sian Federation, with net importers, such as Japan. SI Appendix,Dataset S1 has detailed results for 95 individual countries from1990 to 2008.In terms of sector contributions, 40% of the emissions from the
production of traded products at the global level are because of
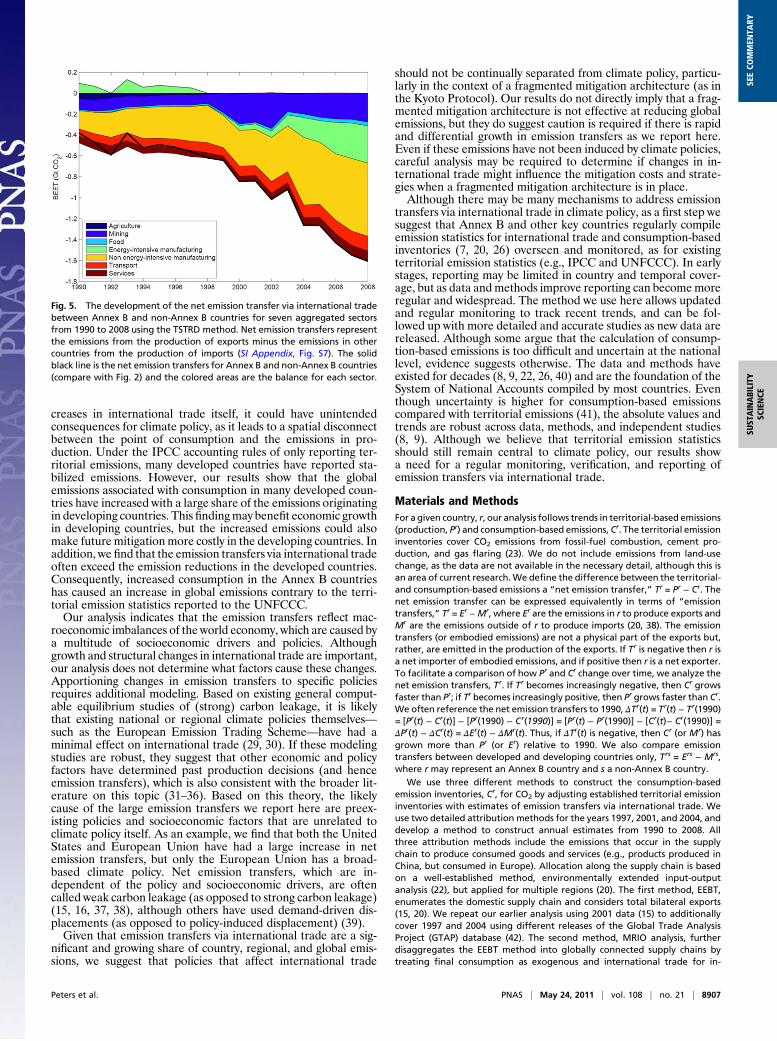
energy-intensive industries (cement, steel, pulp and paper, and soforth) and this has been stable from 1990 to 2008 (SI Appendix, Fig.S6). Non–energy-intensive manufacturing (textiles, electronics,furniture, cars, and so forth) accounts for a growing and substantialshare at 30%of global exported emissions in 2008, rising from 24%in 1990 (SI Appendix, Fig. S6). There has been a strong growth inthe export of both energy-intensive and non–energy-intensiveproducts from non-Annex B to Annex-B countries (SI Appendix,Fig. S7), accounting for most of the change in emission transfersfrom 1990 to 2008 (Fig. 5). International trade in non–energy-intensive manufactured products dominates the net emissiontransfers (accounting for 41% of the growth), despite the policyfocus on energy-intensive manufacturing. In the early 1990s,Annex B countries were small net exporters of emissions fromenergy-intensive manufacturing, but because of strong growth inimports (accounting for 35% of the growth) they are now sub-stantial net importers.
DiscussionOur analysis shows that a significant and growing share of globalemissions are from the production of internationally traded goodsand services. Although this finding may follow directly from in-
Fig. 3. The net change in territorial emissions (1990–2008)together with the change in the net emission transfer be-tween each country and non-Annex B countries (1990–2008).The red stars represent pledged emission reduction commit-ments in the Kyoto Protocol. Emission transfers between An-nex B countries have been removed, as these emissions arealready covered in the Kyoto Protocol. Europe represents theAnnex B EU27 countries plus Croatia, Iceland, Liechtenstein,Norway, and Switzerland.
Fig. 4. The development of the net emission transfer viainternational trade between Annex B and non-Annex Bcountries for six aggregated regions from 1990 to 2008using the TSTRD method. Net emission transfers repre-sent the emissions from the production of exports (SIAppendix, Fig. S4) minus the emissions in other countriesfrom the production of imports (SI Appendix, Fig. S5).The colored areas are the emission transfers for eachregion, the solid black line is the net emission transfersfor each region with the rest of the world, and thedashed black line is the net emission transfers for theAnnex B with non-Annex B countries (comparable withFig. 2).
8906 | www.pnas.org/cgi/doi/10.1073/pnas.1006388108 Peters et al.
creases in international trade itself, it could have unintendedconsequences for climate policy, as it leads to a spatial disconnectbetween the point of consumption and the emissions in pro-duction. Under the IPCC accounting rules of only reporting ter-ritorial emissions, many developed countries have reported sta-bilized emissions. However, our results show that the globalemissions associated with consumption in many developed coun-tries have increased with a large share of the emissions originatingin developing countries. This findingmay benefit economic growthin developing countries, but the increased emissions could alsomake futuremitigation more costly in the developing countries. Inaddition, we find that the emission transfers via international tradeoften exceed the emission reductions in the developed countries.Consequently, increased consumption in the Annex B countrieshas caused an increase in global emissions contrary to the terri-torial emission statistics reported to the UNFCCC.Our analysis indicates that the emission transfers reflect mac-
roeconomic imbalances of the world economy, which are caused bya multitude of socioeconomic drivers and policies. Althoughgrowth and structural changes in international trade are important,our analysis does not determine what factors cause these changes.Apportioning changes in emission transfers to specific policiesrequires additional modeling. Based on existing general comput-able equilibrium studies of (strong) carbon leakage, it is likelythat existing national or regional climate policies themselves—such as the European Emission Trading Scheme—have had aminimal effect on international trade (29, 30). If these modelingstudies are robust, they suggest that other economic and policyfactors have determined past production decisions (and henceemission transfers), which is also consistent with the broader lit-erature on this topic (31–36). Based on this theory, the likelycause of the large emission transfers we report here are preex-isting policies and socioeconomic factors that are unrelated toclimate policy itself. As an example, we find that both the UnitedStates and European Union have had a large increase in netemission transfers, but only the European Union has a broad-based climate policy. Net emission transfers, which are in-dependent of the policy and socioeconomic drivers, are oftencalled weak carbon leakage (as opposed to strong carbon leakage)(15, 16, 37, 38), although others have used demand-driven dis-placements (as opposed to policy-induced displacement) (39).Given that emission transfers via international trade are a sig-
nificant and growing share of country, regional, and global emis-sions, we suggest that policies that affect international trade
should not be continually separated from climate policy, particu-larly in the context of a fragmented mitigation architecture (as inthe Kyoto Protocol). Our results do not directly imply that a frag-mented mitigation architecture is not effective at reducing globalemissions, but they do suggest caution is required if there is rapidand differential growth in emission transfers as we report here.Even if these emissions have not been induced by climate policies,careful analysis may be required to determine if changes in in-ternational trade might influence the mitigation costs and strate-gies when a fragmented mitigation architecture is in place.Although there may be many mechanisms to address emission
transfers via international trade in climate policy, as a first step wesuggest that Annex B and other key countries regularly compileemission statistics for international trade and consumption-basedinventories (7, 20, 26) overseen and monitored, as for existingterritorial emission statistics (e.g., IPCC and UNFCCC). In earlystages, reporting may be limited in country and temporal cover-age, but as data andmethods improve reporting can becomemoreregular and widespread. The method we use here allows updatedand regular monitoring to track recent trends, and can be fol-lowed up with more detailed and accurate studies as new data arereleased. Although some argue that the calculation of consump-tion-based emissions is too difficult and uncertain at the nationallevel, evidence suggests otherwise. The data and methods haveexisted for decades (8, 9, 22, 26, 40) and are the foundation of theSystem of National Accounts compiled by most countries. Eventhough uncertainty is higher for consumption-based emissionscompared with territorial emissions (41), the absolute values andtrends are robust across data, methods, and independent studies(8, 9). Although we believe that territorial emission statisticsshould still remain central to climate policy, our results showa need for a regular monitoring, verification, and reporting ofemission transfers via international trade.
Materials and MethodsFor a given country, r, our analysis follows trends in territorial-based emissions(production, Pr) and consumption-based emissions, Cr. The territorial emissioninventories cover CO2 emissions from fossil-fuel combustion, cement pro-duction, and gas flaring (23). We do not include emissions from land-usechange, as the data are not available in the necessary detail, although this isan area of current research.We define the difference between the territorial-and consumption-based emissions a “net emission transfer,” Tr = Pr − Cr. Thenet emission transfer can be expressed equivalently in terms of “emissiontransfers,” Tr = Er −Mr, where Er are the emissions in r to produce exports andMr are the emissions outside of r to produce imports (20, 38). The emissiontransfers (or embodied emissions) are not a physical part of the exports but,rather, are emitted in the production of the exports. If Tr is negative then r isa net importer of embodied emissions, and if positive then r is a net exporter.To facilitate a comparison of how Pr and Cr change over time, we analyze thenet emission transfers, Tr. If Tr becomes increasingly negative, then Cr growsfaster than Pr; if Tr becomes increasingly positive, then Pr grows faster than Cr.We often reference the net emission transfers to 1990, ΔTr(t) = Tr(t) − Tr(1990)= [Pr(t) − Cr(t)] − [Pr(1990) − Cr(1990)] = [Pr(t) − Pr(1990)] − [Cr(t)− Cr(1990)] =ΔPr(t) − ΔCr(t) = ΔEr(t) − ΔMr(t). Thus, if ΔTr(t) is negative, then Cr (or Mr) hasgrown more than Pr (or Er) relative to 1990. We also compare emissiontransfers between developed and developing countries only, Trs = Ers − Mrs,where r may represent an Annex B country and s a non-Annex B country.
We use three different methods to construct the consumption-basedemission inventories, Cr, for CO2 by adjusting established territorial emissioninventories with estimates of emission transfers via international trade. Weuse two detailed attribution methods for the years 1997, 2001, and 2004, anddevelop a method to construct annual estimates from 1990 to 2008. Allthree attribution methods include the emissions that occur in the supplychain to produce consumed goods and services (e.g., products produced inChina, but consumed in Europe). Allocation along the supply chain is basedon a well-established method, environmentally extended input-outputanalysis (22), but applied for multiple regions (20). The first method, EEBT,enumerates the domestic supply chain and considers total bilateral exports(15, 20). We repeat our earlier analysis using 2001 data (15) to additionallycover 1997 and 2004 using different releases of the Global Trade AnalysisProject (GTAP) database (42). The second method, MRIO analysis, furtherdisaggregates the EEBT method into globally connected supply chains bytreating final consumption as exogenous and international trade for in-
Fig. 5. The development of the net emission transfer via international tradebetween Annex B and non-Annex B countries for seven aggregated sectorsfrom 1990 to 2008 using the TSTRD method. Net emission transfers representthe emissions from the production of exports minus the emissions in othercountries from the production of imports (SI Appendix, Fig. S7). The solidblack line is the net emission transfers for Annex B and non-Annex B countries(compare with Fig. 2) and the colored areas are the balance for each sector.
Peters et al. PNAS | May 24, 2011 | vol. 108 | no. 21 | 8907
SUST
AINABILITY
SCIENCE
SEECO
MMEN
TARY

termediate consumption as endogenous (16, 17, 20). The MRIO and EEBTmethods give the same global emissions, but distinct regional emissions be-cause of the different allocation of intermediate consumption (20). Wepresent the results from both approaches as they provide different per-spectives of how to allocate the emissions from international trade tocountries (SI Appendix and ref. 20). As for the EEBT method, we repeat ourearlier MRIO analysis using 2001 data (17) to additionally cover 1997 and 2004using different releases of the GTAP databases (42). We scale the GTAP CO2
data tomatch our territorial emission database (23) and further overwrite theemissions in some countries using more accurate data wherever possible (SIAppendix). Details on the particular method and data used in this article canbe found in our previous work (15, 17, 20, 43) and SI Appendix.
Because it is resource-intensive to construct detailed datasets on an annualbasis (42), in this article we develop a method for annual estimates of theemissions embodied in international trade and consumption-based emissioninventories from 1990 to 2008 using more aggregated information (time-series with trade). The TSTRD method is based on widely available GDP,bilateral trade, and emission statistics from established global datasets and iscalibrated to the simpler and more related EEBT method. We use a two-stepprocess. Our estimates start with GDP data by final expenditure from theUnited Nations Statistic Division (UNSD) National Accounts Main AggregatesDatabase and territorial emission estimates (23). We use the GDP data toconstruct a one-sector input-output table analogous to the EEBT method. Itis not possible to use the GDP data directly as it does not represent thesupply chain nor the different emission intensities in different economicsectors. We use the EEBT method in 1997, 2001, and 2004 as proxies to es-
timate the industry consumption of imports and the supply-chain emission ineach country and each sector, and apply it to the TSTRD method: 1990 to1998 (1997 EEBT estimates), 1999 to 2002 (2001 EEBT estimates), and 2003 to2008 (2004 EEBT estimates). Our results are not significantly affected byusing different base years as the proxy for the other years. The TSTRDmethod is calibrated to the EEBT method in common years 1997, 2001, and2004. In some countries there are small differences in estimates from EEBTand TSTRD because of different GDP data in GTAP and UNSD. The secondand final step of the TSTRD method is to distribute the estimated emissionsfrom the production of exports to receiving countries. We do this distribu-tion after weighting the harmonized GTAP time-series trade data (42) withsector and region emission intensities from the EEBT method: 1990 to 1998(1997 EEBT estimates), 1999 to 2002 (2001 EEBT estimates), and 2003 to 2008(2004 EEBT estimates). We performed a variety of comparisons of the EEBTand TSTRD methods and found the results to be consistent with availableevidence. Details on the method and method comparisons can be found inthe SI Appendix and SI Appendix, Dataset SI.
Our analysis has uncertainties in both the inputdata andmodel calculations(SI Appendix). The territorial emission estimates are the most certain (23) anduncertainty increases as we disaggregate the results into regions and sectors(41). Because of averaging of errors, uncertainty decreases as we again ag-gregate the results (41). Despite large potential uncertainties, there is nota strong tradition of performing uncertainty analysis in input-output analysisbecause of the relative lack of information on uncertainty distributions (44).Instead, we do a model comparison across a variety of independent studiesand find sufficient agreement to support our findings (SI Appendix).
1. Intergovernmental Panel on Climate Change (2007) Climate Change 2007: SynthesisReport. Contribution of Working Groups I, II, and III to the Fourth Assessment Reportof the Intergovernmental Panel on Climate Change (IPCC, Geneva, Switzerland).
2. United Nations Framework Convention on Climate Change (1992) United NationsFramework Convention on Climate Change. Available at http://unfccc.int/resource/docs/convkp/conveng.pdf.
3. United Nations Framework Convention on Climate Change (1997) The Kyoto Protocolto the United Nations Convention on Climate Change. Available at http://unfccc.int/resource/docs/convkp/kpeng.pdf.
4. Intergovernmental Panel on Climate Change (2006) IPCC Guidelines for NationalGreenhouse Gas Inventories, Prepared by the National Greenhouse Gas InventoriesProgramme (Institute for Global Environmental Strategies, Japan).
5. Le Quéré C, et al. (2009) Trends in the sources and sinks of carbon dioxide. Nat Geosci2:831–836.
6. Raupach MR, et al. (2007) Global and regional drivers of accelerating CO2 emissions.Proc Natl Acad Sci USA 104:10288–10293.
7. Peters GP, et al. (2009) Trade, transport, and sinks extend the carbon dioxideresponsibility of countries. Clim Change 97:379–388.
8. Wiedmann T, Lenzen M, Turner K, Barrett J (2007) Examining the globalenvironmental impact of regional consumption activities—Part 2: Review of input-output models for the assessment of environmental impacts embodied in trade. EcolEcon 61:15–26.
9. Wiedmann T (2009) A review of recent multi-region input-output models used forconsumption-based emissions and resource accounting. Ecol Econ 69:211–222.
10. Weber CL, Peters GP, Guan D, Hubacek K (2008) The contribution of Chinese exportsto climate change. Energy Policy 36:3572–3577.
11. Guan D, Peters GP, Weber CL, Hubacek K (2009) Journey to the world top emitter: Ananalysis of the driving forces of China’s recent CO2 emissions surge. Geophys Res Lett36:L04709.
12. Baiocchi G, Minx JC (2010) Understanding changes in the UK’s CO2 emissions: A globalperspective. Environ Sci Technol 44:1177–1184.
13. Wiedmann T, et al. (2010) A carbon footprint time-series of the UK—Results froma multi-region input-output model. Econ Syst Res 22:19–42.
14. Weber CL, Matthews HS (2007) Embodied environmental emissions in U.S.international trade, 1997–2004. Environ Sci Technol 41:4875–4881.
15. Peters GP, Hertwich EG (2008) CO2 embodied in international trade with implicationsfor global climate policy. Environ Sci Technol 42:1401–1407.
16. Davis SJ, Caldeira K (2010) Consumption-based accounting of CO2 emissions. Proc NatlAcad Sci USA 107:5687–5692.
17. Hertwich EG, Peters GP (2009) Carbon footprint of nations: A global, trade-linkedanalysis. Environ Sci Technol 43:6414–6420.
18. Ahmad N, Wyckoff A (2003) Carbon dioxide emissions embodied in internationaltrade of goods. (Organisation for Economic Co-operation and Development),10.1787/421482436815.
19. Nakano S, et al. (2009) The measurement of CO2 embodiments in international trade:Evidence from the harmonized input-output and bilateral trade database. (Organi-sation for Economic Co-operation and Development), 10.1787/227026518048.
20. Peters GP (2008) From production-based to consumption-based national emissioninventories. Ecol Econ 65:13–23.
21. Muradian R, O’Connor M, Martinez-Alier J (2002) Embodied pollution in trade:Estimating the “environmental load displacement” of industrialised countries. EcolEcon 41:51–67.
22. Leontief W (1970) Environmental repercussions and the economic structure: An input-
output approach. Rev Econ Stat 52:262–271.23. Boden TA, Marland G, Andres RJ (2009) Global, Regional, and National Fossil-Fuel CO2
Emissions in Trends. (Carbon Dioxide Information Analysis Center, Oak Ridge National
Laboratory, U.S. Department of Energy, Oak Ridge, TN).24. Rogelj J, et al. (2010) Copenhagen Accord pledges are paltry. Nature 464:1126–1128.25. Schweitzer F, et al. (2009) Economic networks: The new challenges. Science 325:
422–425.26. Peters GP (2010) Carbon footprints and embodied carbon at multiple scales. Current
Opinion on Environmental Sustainability 2:245–250.27. Lenzen M (2001) A generalized input-output multiplier calculus for Australia. Econ
Syst Res 13:65–92.28. Peters GP, Hertwich EG (2006) The importance of imports for household environmental
impacts. J Ind Ecol 10(3):89–109.29. Barker T, et al. (2007) Mitigation from a Cross-Sectoral Perspective. Climate Change
2007: Mitigation. Contribution of Working Group III to the Fourth Assessment Report
of the Intergovernmental Panel on Climate Change, eds Metz B, Davidson OR,
Bosch PR, Dave R, Meyer LA (Cambridge University Press, Cambridge, United Kingdom
and New York, NY).30. Carbon Trust (2010) Tackling Carbon Leakage: Sector-Specific Solutions for a World of
Unequal Carbon Prices. (Carbon Trust, London, UK).31. Levinson A (2010) Offshoring pollution: Is the United States Increasingly importing
polluting goods? Rev Environ Econ Policy 4:63–83.32. Cole MA, Elliott RJR, Shimamoto K (2005) Why the grass is not always greener: The
competing effects of environmental regulations and factor intensities on US
specialization. Ecol Econ 54:95–109.33. SQW Limited (2006) Exploring the relationship between environmental regulation and
competitiveness: Literature review. (SQW Ltd., London, UK). Available at http://www.
sqw.co.uk/file_download/7.34. Stern N (2006) Stern Review Report on the Economics of Climate Change (Cambridge
University Press, Cambridge, United Kingdom and New York, NY).35. Copeland BR, Taylor MS (2004) Trade, growth, and the environment. J Econ Lit 42:
7–71.36. Brunnermeier SB, Levinson A (2004) Examining the evidence on environmental
regulations and industry location. J Environ Dev 13:6–41.37. Rothman DS (1998) Environmental Kuznets Curves—Real progress or passing the
buck? A case for consumption-based approaches. Ecol Econ 25:177–194.38. Peters GP (2010) Managing carbon leakage. Carbon Management 1:35–37.39. Meyfroidt P, Lambin EF (2009) Forest transition in Vietnam and displacement of
deforestation abroad. Proc Natl Acad Sci USA 106:16139–16144.40. Wiedmann T (2009) Carbon footprint and input-output analysis—An introduction.
Econ Syst Res 21:175–186.41. Lenzen M, Wood R, Wiedmann T (2010) Uncertainty analysis for Multi-Region Input-
Output Models—A case study of the UK’s carbon footprint. Econ Syst Res 22:43–63.42. Narayanan B, Walmsley TL (2008) Global Trade, Assistance, and Production: The GTAP
7 Data Base (Center for Global Trade Analysis, Purdue University, Washington D.C.).43. Peters GP, Andrew R, Lennox J (2011) Constructing a multi-regional input-output
table using the GTAP database. Econ Syst Res, 10.1080/09535314.2011.563234.44. Lenzen M (2001) Errors in conventional and input-output-based life-cycle inventories.
J Ind Ecol 4(4):127–148.
8908 | www.pnas.org/cgi/doi/10.1073/pnas.1006388108 Peters et al.