GROWTH HORMONE AND GROWTH IN GOATS Redacted for privacy
114
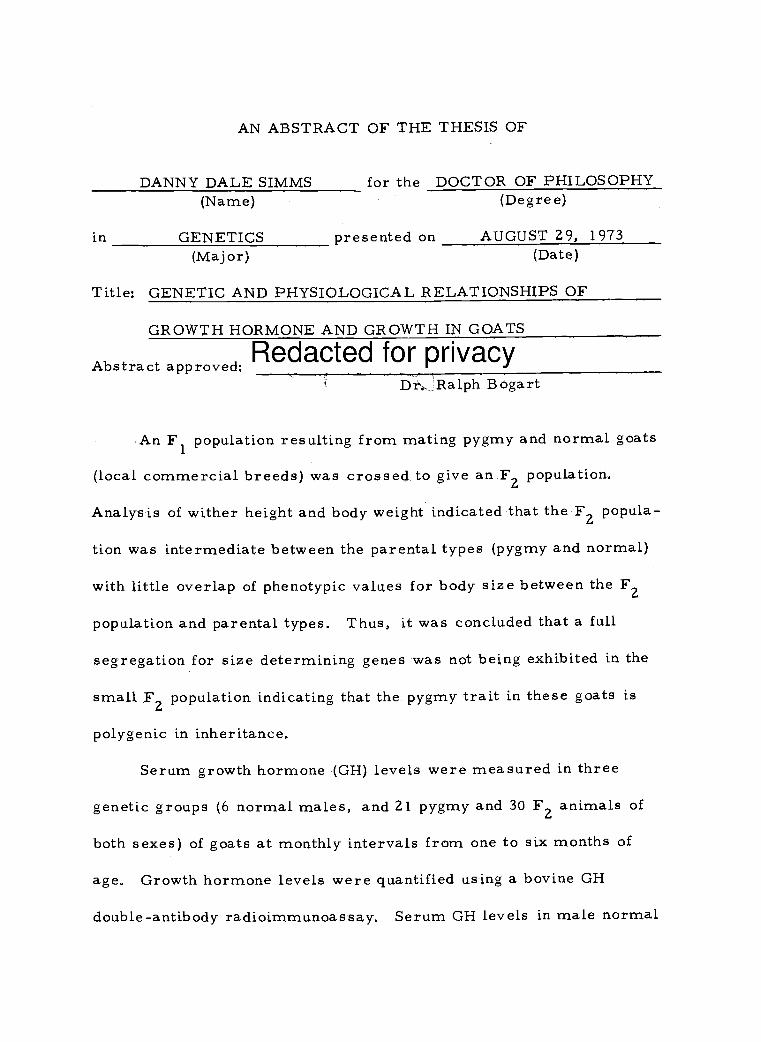
AN ABSTRACT OF THE THESIS OF DANNY DALE SIMMS for the DOCTOR OF PHILOSOPHY (Name) (Degree) in GENETICS presented on AUGUST 29, 1973 (Major) (Date) Title: GENETIC AND PHYSIOLOGICAL RELATIONSHIPS OF GROWTH HORMONE AND GROWTH IN GOATS Redacted for privacy Abstract approved: D14'. :Ralph Bogart An F 1 population resulting from mating pygmy and normal goats (local commercial breeds) was crossed to give an F2 population. Analysis of wither height and body weight indicated that the F2 popula- tion was intermediate between the parental types (pygmy and normal) with little overlap of phenotypic values for body size between the F2 population and parental types. Thus, it was concluded that a full segregation for size determining genes was not being exhibited in the small F2 population indicating that the pygmy trait in these goats is polygenic in inheritance. Serum growth hormone (GH) levels were measured in three genetic groups (6 normal males, and 21 pygmy and 30 F2 animals of both sexes) of goats at monthly intervals from one to six months of age. Growth hormone levels were quantified using a bovine GH double-antibody radioimmunoassay. Serum GH levels in male normal
Transcript of GROWTH HORMONE AND GROWTH IN GOATS Redacted for privacy
AN ABSTRACT OF THE THESIS OF
DANNY DALE SIMMS for the DOCTOR OF PHILOSOPHY(Name) (Degree)
in GENETICS presented on AUGUST 29, 1973(Major) (Date)
Title: GENETIC AND PHYSIOLOGICAL RELATIONSHIPS OF
GROWTH HORMONE AND GROWTH IN GOATS
Redacted for privacyAbstract approved:D14'. :Ralph Bogart
An F1
population resulting from mating pygmy and normal goats
(local commercial breeds) was crossed to give an F2 population.
Analysis of wither height and body weight indicated that the F2 popula-
tion was intermediate between the parental types (pygmy and normal)
with little overlap of phenotypic values for body size between the F2
population and parental types. Thus, it was concluded that a full
segregation for size determining genes was not being exhibited in the
small F2 population indicating that the pygmy trait in these goats is
polygenic in inheritance.
Serum growth hormone (GH) levels were measured in three
genetic groups (6 normal males, and 21 pygmy and 30 F2 animals of
both sexes) of goats at monthly intervals from one to six months of
age. Growth hormone levels were quantified using a bovine GH
double-antibody radioimmunoassay. Serum GH levels in male normal

goats decreased significantly (P < .005) while serum GH levels in the
male pygmy goats increased significantly (P < 005) during the six
month period. Over the entire six month period there were no sig-
nificant differences in serum GH levels between male normal and male
pygmy goats although significant differences were observed at one and
six months of age. Serum GH levels in the male F2 population were
relatively intermediate between parental types during the six month
study; however, they increased significantly (P < . 005) with increas-
ing age similar to the changes observed in the pygmy males.
Male pygmy and F2 goats had significantly higher (P < . 005)
serum GH levels than their female contemporaries while normal
females were unavailable for comparison with normal males in this
age group. Serum GH levels in pygmy females remained relatively
constant while increasing GH levels in the F2 females during the six
month period approached significance (P = . 06). Serum GH levels
were also measured in three genetic groups (6 normals, 14 pygmy
and 18 F1) of mature female goats. Serum GH levels in the adult F1
females were similar to GH levels in the adult pygmy females although
both had significantly higher (P < . 005) serum GH levels than adult
normal females.
Pituitary GH concentration in normal and pygmy male goats at
six months of age was essentially equal while total pituitary GH
content was higher in the normal goats as a result of significantly

< . 005) larger anterior pituitaries. Pituitary GH per kg of body
weight was relatively equal in normal and pygmy male goats while
pituitary GH per kg body weight in both sexes in the F2 goats was
significantly (P < . 01) lower than in the pygmy goats. No differences
between sexes within genetic groups were observed in pituitary GH
levels. Analysis of pituitary GH in adult female goats indicated that
pituitary GH concentration and content per kg body weight were
significantly higher (P < , 005) in mature female pygmy goats as
compared to mature female normal and F1
goats.
Neither serum GH levels nor measures of pituitary GH status
(pituitary GH concentration, total GH content and GH content per kg
body weight) showed consistent relationships with body size measure-
ments in any of the genetic groups in young or adult animals. Serum
GH levels were not significantly related to any measure of pituitary
GH status used in this study.
Additional experiments were designed to determine the effect of
blood collection stress on serum GH levels. Repeated blood sample
collection via jugular venipuncture failed to alter serum GH levels
while GH levels in blood samples collected by jugular cannula were
slightly higher and more variable than GH levels in blood samples
collected by jugular venipuncture. Restraining goats by tying had no
effect on serum GH levels, Serum GH in pygmy goats was observed
to fluctuate at irregular intervals as determined by collecting blood
samples by jugular cannula and without the goats' knowledge.

Genetic and Physiological Relationships ofGrowth Hormone and Growth in Goats
by
Danny Dale Simms
A THESIS
submitted to
Oregon State University
in partial fulfillment ofthe requirements for the
degree of
Doctor of Philosophy
June 1974

APPROVED:
Redacted for privacyProfes so of Animal Ge4etics
in charge of major
Redacted for privacy
Chairrnan of Genetics BRaird
Redacted for privacy
Dean of Graduate School
Date thesis is presented August 29, 1973
Typed by Mary Jo Stratton for Danny Dale Simms

ACKNOWLEDGMENTS
The author expresses sincere appreciation to his major
professor, Dr. Ralph Bogart, for his guidance with this research and
his friendship during the years of graduate study.
A very special'thanks must go to Dr. Lloyd Swanson for his
competent advice on all facets of this research and assistance with
the assay procedures.
The time and competent advice donated by Drs, Frederick L.
Hisaw, Jr. , Rod V. Frakes, Donald L. MacDonald, and Morris W.
Montgomery are gratefully acknowledged. These men and Drs.
Bogart and Swanson, serving as a critical yet cooperative committee,
were a constant source of encouragement and counsel.
The assistance of Dr. Kenneth Rowe with the statistical analysis
of the data is sincerely appreciated, Special thanks are extended to
Susan K. Martin for her assistance with the assay procedures.
The author's wife, Rachel, is commended for having patience
when it was most needed and appreciated.
This research was funded by a National Defense Education Act
Title IV Fellowship.

TABLE OF CONTENTS
INTRODUCTION
REVIEW OF LITERATURE
Page
1
4
Relationship of Growth Hormone and Dwarfism 5
Relationshio of Growth Hormoneand Growth Rate 8
Effect of Sex 13Effect of Collection Stress 14Validation of Assay 17
METHODS AND MATERIALS 19
Experimental Des ign 19Physical Measurements 20Collection and Handling of Blood Samples 20Preparation of Pituitary Extracts 20Radioimmunoassay for Growth Hormone 21
Iodination of Growth Hormone. 21Assay Procedure 24Selection of Assay Conditions 25Validation of Assay 26
Collection Technique Experiment 30Statistical Analysis 31
RESULTS AND DISCUSSION 33
Genetic Analysis 33Serum Growth Hormone Analysis 43Pituitary Growth Hormone Analysis 56Relationship of GH with Growth Indices 62Relationship of GH Indices 67Collection Stress Experiment 68
GENERAL DISCUSSION
SUMMARY AND CONCLUSIONS
BIBLIOGRAPHY
APPENDIX
80
87
91
101
LIST OF TABLES
Table Page
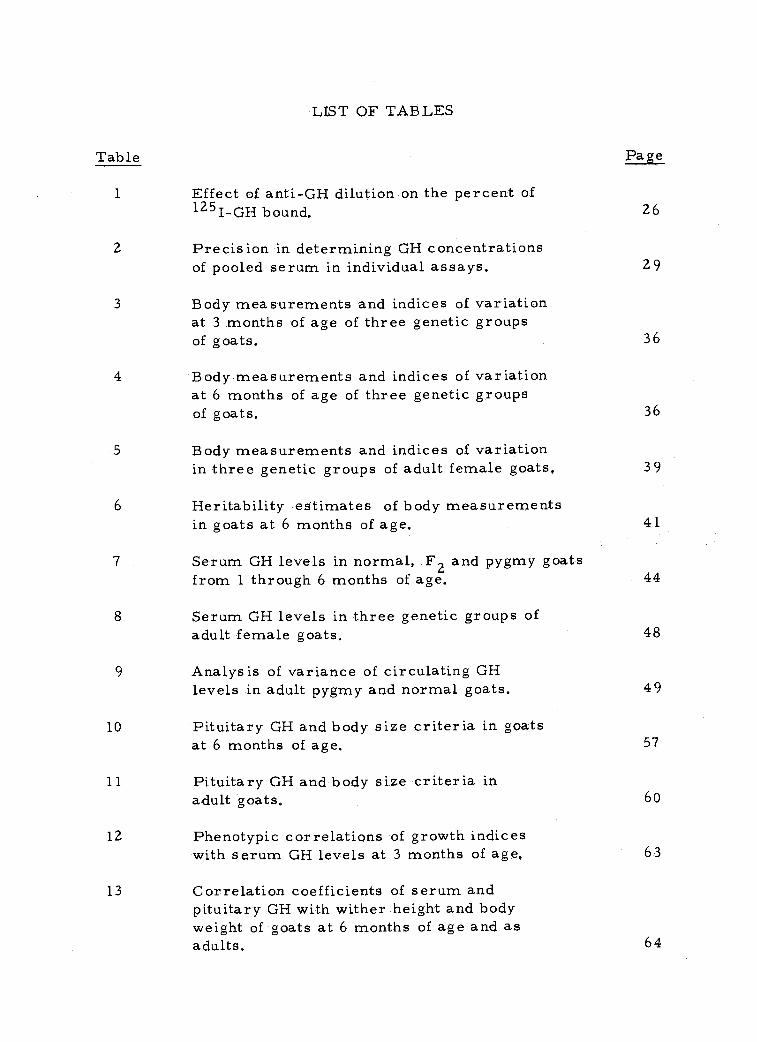
1 Effect of anti-GH dilution on the percent of1251-GH bound. 26
2 Precision in determining GH concentrationsof pooled serum in individual assays. 29
3 Body measurements and indices of variationat 3 months of age of three genetic groupsof goats. 36
4 Body measurements and indices of variationat 6 months of age of three genetic groupsof goats, 36
5 Body measurements and indices of variationin three genetic groups of adult female goats, 39
6 Heritability estimates of body measurementsin goats at 6 months of age. 41
7 Serum GH levels in normal, F2 and pygmy goatsfrom 1 through 6 months of age, 44
8 Serum GH levels in three genetic groups ofadult female goats. 48
9 Analysis of variance of circulating GHlevels in adult pygmy and normal goats. 49
10 Pituitary GH and body size criteria in goatsat 6 months of age. 57
11 Pituitary GH and body size criteria inadult goats. 60
12 Phenotypic correlations of growth indiceswith serum GH levels at 3 months of age, 63
13 Correlation coefficients of serum andpituitary GH with wither height and bodyweight of goats at 6 months of age and asadults. 64

Table Page
14 Simple correlation coefficients of serum GHlevels with body weight in male goats atmonthly intervals.
15 Correlation coefficients of serum GH levelswith pituitary GH indices of goats atdifferent ages.
16 Analysis of variance of serum GH levelsin blood samples collected by jugularvenipuncture and jugular cannula,
65
68
73

LIST OF FIGURES
Figure page
1 The elution pattern from Bio-Gel P-60 afteriodination of GH. 23
2 The elution pattern from Sephadex G-100 showingthe purification of previously iodinated GH. 23
3 Recovery of exogenous NIH-GH-B16 added to100 µl of goat serum. 28
4 Dose response curves for NIH-GH-B16 and forgoat serum and pituitary homogenates. 28
5 Growth curves of three genetic groups of goatsfrom birth to 6 months of age with leastsquares regression lines for males of eachgenetic group. 35
6 Frequency distribution of body weights of threegenetic groups of goats at 6 months of age. 40
7 Frequency distribution of wither height ofthree genetic groups of goats at 6 monthsof age. 40
8
9
Least squares regression lines of serum GHchanges with age of three genetic groups ofgoats.
Least squares regression lines of changes inserum GH levels in pygmy male and femalegoats from 1 to 6 months of age.
10 Least squares regression lines of changes inserum GH levels in F2 male and female goatsfrom 1 to 6 months of age.
11 Serum GH levels in adult female pygmy goatswith repeated blood collections by jugularvenipuncture at 20 minute intervals,
46
54
54
70

Figure Page
12 Serum GH levels in adult female pygmy goatswith repeated blood collections by jugularcannula and jugular venipuncture at 1 hourintervals.
13 Serum GH levels in adult female pygmy goatswith repeated blood collections by jugularcannula and jugular venipuncture at 1 hourintervals after removal of one animal fromthe cannulated group.
14 Mean serum GH levels in tied and untied cannu-lated adult female pygmy goats with repeatedblood collections by jugular cannulae at 5minute intervals.
15 Serum GH levels in three adult female pygmygoats with blood sample collection via jugularcannula at 5 minute intervals.
72
74
75
77

GENETIC AND PHYSIOLOGICAL RELATIONSHIPS OFGROWTH HORMONE AND GROWTH IN GOATS
INTRODUCTION
The animal breeder is constantly searching for tools to aid in
the selection of more productive farm animals. One approach con-
sists of measuring levels of physiologically active materials in the
animal and developing meaningful relationships between levels of
these materials and production. Any relationship of production with a
biological entity that is easily and economically measured could be of
tremendous economic benefit to the livestock industry.
A logical approach to finding such a meaningful relationship is
an emphasis on growth promoting substances. Of these, early
research on growth hormone (GH) indicated a positive relationship of
pituitary OH levels and growth. These findings prompted further
research on the relationships of pituitary OH levels and growth which
failed to verify the earlier results. Investigations in this area were
confined to pituitary GH levels since an assay capable of quantifying
blood levels was unavailable. Research in the field of immunology
led to the development of the radioimmunoassay technique with
sufficient sensitivity to quantify blood levels of GH.
Probably the most successful approach to research in genetics
has been that of studying the abnormal individual. The basic tenet of
this approach is that determination of the cause of the abnormal state
leads to a better understanding of how the system operates in the
normal animal. Since studies in other species using radioimmuno-
assay have shown GH deficiency to be one cause of growth retardation,
it was decided to apply the radloimmunoassay technique to the mea-R./
surement of GH levels in tyre pygmy goats lecattrd-at-thi-s---institation
with the hypothesis that the pygmy trait was possibly a result of a
GH deficiency, A radioiminunoassay for goat GH was unavailable, so
emphasis was placed on obtaining a suitable cross-reacting assay to
quantify GH in goat serum. A bovine radioimmunoassay was found to
possess the necessary requisites to quantify goat GH in serum and
pituitaries.
From its origins, this study was designed as a combination of
genetics and physiology in anticipation that one would complement the
other. Primary emphasis from a genetics standpoint was placed on
determining the mode of inheritance of the pygmy trait. Analysis of
the 1'2 generation for segregation of genes determining the pygmy trait
was the key to this portion of the study. It was hoped that the mode of
inheritance would be simple since only a small F2 generation was
available.
Emphasis in the physiology segment centered on the relation-
ship of serum and pituitary GH levels with growth, both with respect
to the pygmy trait and in more general terms. It was anticipated that

3
these indices of GH status might serve as indicators of the growth
potential of the goats in this study; thus, suggesting that they might
be of value as a tool for selection in more economically important
species,

4
REVIEW OF LITERATURE
Although miniature goats are referred to as African Pygmy
goats, they are not restricted to Africa. They have been reported,
for example, in Lapland, Israel, India, Arabia, and Equatorial
Africa. Several strains of African miniature goats, Capra hircus,
have been described. Epstein (1946) observed male African Hejaz
dwarf goats to weigh about 22 kg and females to weigh about 19 kg,
while the height of either sex did not exceed 60 cm. The West African
dwarf goat, as described by Mason (1951), average 40-50 cm in height
at the withers and 18-20 kg in weight. Further descriptions of African
miniature goats have been presented by Hilzheimer (1916), Klatt
(1917) and Staffe (1938). Male Saanen goats, one of the breeds con-
sidered as normal size in the present study, average 82 kg while
females average 60 kg (Altman and Dittmer, 1972).
The most common type of genetic control of dwarfism is simple
inheritance with one pair of alleles involved, although a few examples
of more complex modes of inheritance have been reported. For
instance, autosomal recessives have been implicated in dwarf guinea
pigs (So llas, 1914) and dwarf mice (King, 1950). However, Castle
(1940) found that one type of dwarfism in rabbits resulted from a
dominant allele. Dwarfism in beef cattle has received extensive study
and both recessive and dominant alleles have been implicated as well

5
as polygenic modes of inheritance including modifying genes (Flings,
1953; Gregory et al. , 1951, 1952, 1953; Johansson and Rendel, 1968;
Johnson et al., 1950; Pahnish et al., 1952). In most cases, human
dwarfism is due to a single autosomal recessive, although at least
one type appears to be caused by a dominant allele (Rimoin et al. ,
1968a, b),
Relationship of Growth Hormoneand Dwarfism
The growth promoting ability of growth hormone (see Introduc-
tion) is generally well recognized and the absence of GH has been
related with decreased growth. Smith and MacDowell (1930, 1931),
studying the relationship of anterior pituitary hormones and dwarfism
in mice, observed a growth response when pituitary extracts from
normal mice were administered to dwarf mice. Pituitary extracts
of these mice failed to show a protein band in electrophoretic gel
corresponding to the growth hormone band obtained from pituitary
extracts of normal mice, resulting in the conclusion that hereditary
dwarfism in these mice resulted from a growth hormone deficiency
(Lewis, Cheever and VanderLaan, 1965). Plasma of male and female
dwarf mice, analyzed by Garcia and Geschwind (1968), had undetect-
able levels of GH whereas normal female mice had plasma GH levels
ranging from 4.3 to 35 rig/m1 and normal males had plasma GH levels

6
ranging from 1. 6 to 2.2 ng/ml. Pituitary GH concentrations in the
dwarf mice were approximately 1% of the pituitary concentration in
normal mice.
Studies of the relationship of dwarfism and GH deficiency in
cattle are inconclusive which possibly is attributable to the large
number of types of dwarfism in cattle. Marlowe (1960) analyzed the
pituitary GH content of 30 dwarf calves of all the major breeds as
compared to the pituitary GH content of 30 normal calves of comparable
sex, age and breed. Pituitary GH content of the dwarf group was
lower than that of the normal group which led Marlowe to the conclu-
sion that dwarfism in cattle is the result of a GH deficiency. In
contrast to this view, serum. GH levels in snorter dwarfs, carriers
(heterozygous for the dwarf gene), and normal cattle were essentially
equal as determined by Dev and Las ley (1969).
The relationship of dwarfism and GH deficiency in humans has
received extensive study. Many types of dwarfism exist in humans
and generalizations concerning GH deficiencies as a causative factor
are difficult; however, a GH deficiency has been shown in several
types of human dwarfism. Isolated polypeptide hormone deficiencies
may be the result of the following genetic mechanisms: I) A structural
mutation, secondary to nucleotide replacement or deletiorl which
results in an altered peptide sequence, 2) a regulatory type of muta-
tion at the protein synthesis level resulting in diminished production

of a normal hormone, 3) a defect in the neurostimulatory pathway
resulting in diminished secretion of a normal hormone, and 4) aplasia
or hypoplasia of the gland producing the hormone (Rimoin et al.,
1968b).
An early study of human hypopituitary dwarfs indicated that
serum GH levels were lower than normal although the rat tibia bio-
assay was used in this study which most workers feel is not suf-
ficiently sensitive to accurately detect serum GH levels (Seagloff
et al., 1955). More recent studies, using radioimmunoassay, indi-
cate that some human dwarfs are the result of a pituitary OH defi-
ciency, while other dwarfs have normal serum GH levels and exhibit
abnormal responses to stimuli which normally provoke GH release.
For instance, arginine and insulin infusion stimulate pituitary GH
release in normal humans, but in dwarfs with normal serum GH
levels, little or no response to these stimuli is observed. This
finding has led to the use of arginine or insulin infusion in the diagno-
sis of growth retardation in humans resulting from pituitary GH
deficiency. In contrast to the lack of response to arginine and insulin
infusion in dwarfs with normal serum GH levels, the human African
Pygmy responds with greater than normal elevation in serum GH
levels to these stimuli while their basal levels are not significantly
different than normal (Rimoin et al., 1968a, b).
Growth hormone deficiency in human dwarfs has also been

8
reported in asexual ateliosis (panhypopituitary dwarfism) and in the
emotional deprivation syndrome. This is especially interesting since
it appears that emotional distress in these patients results in a GH
deficiency and simply correcting the environmental situation results
in normal GH secretion and utilization. Growth hormone replacement
therapy is used in treatment of several types of human dwarfism with
significant increases in growth, but it must be emphasized that many
human dwarfs are not the result of a GH deficiency (Gershberg et al. ,
1964; Parker and Daughaday, 1968; Powell, Brazel and Blizzard,
1967; Raben, 1962; Rimoin et al., 1968a, b).
Relationship of Growth Hormoneand Growth Rate
Early studies of pituitary GH levels in swine indicated that
pituitary GH levels were significantly related to body size and growth
rate. Baird, Nalbandov and Norton (1952) compared the pituitary GH
levels of two lines of swine after selection for high and low rate of
growth. Swine selected for high growth rate had significantly higher
pituitary GH concentration. On the basis of these results, Nalbandov
(1963) proposed that selection for faster growing animals actually
results in selection for a genetically controlled rate of secretion of
GH. A more recent study contradicts this theory since dwarf pigs
resulting from 14 generations of selection for small size showed

9
serum GH levels comparable to normal pigs of the same age. These
dwarf pigs weighed approximately 12 to 14 kg at 3 months of age
compared to 40 kg for normal pigs of the same age (Mach lin et al. ,
1968).
Predominantly negative correlations between growth rate and
serum GH levels have been obtained in several studies in swine which
also tends to contradict Nalbandov's. theory. Apparently pigs that grow
faster utilize GH faster and thus exhibit lower serum GH levels as
proposed by Siers and Hazel (1970) and Siers and Swiger (1971).
Predominantly negative correlations between serum GH levels and
average daily gain were observed in pigs treated with diethylstilbestrol
plus methyltestosterone (Bidner et al. , 1973); however, in one trial
slightly positive correlations were obtained. Feeding diethylstil-
bestrol and methyltestosterone significantly (P < .01) increased
serum GH, especially in barrows.
Both pituitary and serum GH levels in swine decrease with
increasing age. Pituitary total GH content increases with increasing
age as a function of the increase in pituitary size, but not as rapidly
as body size increases with age; consequently, the amount of GH
available to the tissues decreases as body size increases (Baird et al.,
1952). This finding led Nalbandov (1963) to propose that cessation of
growth at maturity is caused by decreased GH availability to the
tissues. Baker et al. (1956) measured the pituitary GH content of

10
fetal, immature, mature and pregnant Hampshire and Duroc swine.
Total pituitary GH content increased with increasing size and age
while pituitary GH content/kg of body weight was highest in young
animals and decreased with age to 300 days and then plateaued. Serum
GH levels decreased significantly with increasing age and weight in
pigs analyzed at 17, 52, and 93 kg body weight by Siers and Hazel
(1970). Siers and Swiger (1971) observed that serum GH levels are
similar in pigs of the same age and of similar size while pigs of the
same age and different size differ significantly in serum GH levels.
Thus, decreased serum GH levels with increased age are due pri-
marily to increased body size.
Exogenous GH resulted in increased rate of gain (non-significant),
significantly less feed consumed per day and significantly less feed
required per unit gain in swine (Turman and Andrews, 1955).
Mach lin (1972), upon injecting porcine GH into pigs during the grow-
ing period (45-95 kg), reported that high levels (0.22 and 1. 10
mg/kg/day) of GH resulted in 13 deaths out of 24 animals treated.
Lower levels of GH (0. 13 mg/kg/day) resulted in significant increases
in average daily gain and feed conversion and did not cause any
mortality.
Just as studies in swine are inconclusive concerning the rela-
tionship of growth and GH, so are studies in cattle. Armstrong and
Hansel (1956) found a positive correlation of body growth rate with

11
anterior pituitary GH concentratiqn and anterior pituitary GH relative
to body weight during the 16-week period immediately prior to
slaughter in Holstein heifers. However, in a study of GH status in
Holstein bulls from birth to one year of age, Purchas, Macmillan and
Hafs (1970) found no meaningful relationship between GH levels
(plasma or pituitary) and measures of growth. Plasma GH levels and
growth in steers and heifers of several breeds at 18 and 198 days of
age were not related, although a positive relationship was observed
at 393 days of age (Trenkle and Irwin, 1970).
While swine exhibit a significant decrease in plasma and pituitary
GH levels with increasing age, studies in cattle indicate that pituitary
GH levels decrease with increasing age while plasma GH levels are
not significantly different in young and mature animals. For instance,
pituitary GH levels in newborn cattle are higher relative to prepubertal
or adult feedlot cattle while plasma OH levels in 18-day-old calves
are not significantly different from plasma GH levels in yearling
steers and heifers (Curl et al. , 1968; Trenkle and Irwin, 1970).
Serum GH levels in Holstein bulls are higher (P < . 01) at birth than
at any other age. By one month of age, the serum GH levels plateau
and remain relatively constant while the pituitary GH concentration
rises from birth to three months of age and then declines and plateaus
after six months of age (Purchas et al. , 1970).

12
After observing similar serum GH levels in cattle at 18 and at
371 days of age, Irwin and Trenkle (1971) concluded that the reduction
in growth rate with increasing age and weight is caused by reduced
tissue responsiveness rather than by reduced GH availability to the
tissues. Thus, at the present time there are two theories for growth
stasis: either the levels of OH available to the tissues decrease with
age as proposed by Nalbandov (1963) or the tissues become less
responsive to the available GH as proposed by Irwin and Trenkle
(1971). Work in several species indicates that tissue receptivity is
probably a more valid theory. For instance, circulating GH levels in
adult humans are not significantly different from those of actively
growing children (Daughaday, 1968). In addition, an elevation in
circulating GH after the epiphyses of most long bones have closed,
which is characteristic of acromegaly, results in increased growth of
the bones of the face and hands (Hunter and Regal, 1968; Roth, 1968;
Seagloff et al., 1955). The nature of tissue receptivity to GH is not
well understood; in fact, little is known concerning the mode of
action of GH. It appears that this area of research must be explored
before definitive explanations of the relationship of GH and growth
can be formulated.
In addition to the responses noted in swine, the effects of
exogenous GH have been studied in other species. Peake, Mariz and
Daughaday (1968) transplanted GH producing pituitary tumors into the

13
post-cervical area of immature female rats which resulted in the
onset of visceromegaly and rapid weight gain compared to that of the
controls. Mach lin (1973) found that exogenous GH significantly
increased milk production and feed conversion in dairy cows.
Effect of Sex
Controversy exists with respect to sex effects on GH levels in
mice. Garcia and Geschwind (1968) reported that female mice had
higher plasma GH levels than their male littermates while Schindler,
Hutchins and Septimus (1972) found that both pituitary and plasma GH
levels were higher in male mice, Growth hormone levels reported by
these studies in mice were based on a rat GH radioimmunoassay.
Pituitary GH levels remain similar up to 8 weeks of age in male and
female rats. Beyond this age, pituitary GH levels in male rats are
consistently higher. In contrast to the higher pituitary GH levels in
male rats, plasma GH levels are lower than those in female rats
(Birge et al. , 1967; Schalch and Reichlin, 1966; Trenkle, 1970).
There is general agreement that male ruminants have higher
plasma GH levels than female ruminants, but the differences are not
always statistically significant due to variation in plasma 01-1 in
individual animals and small numbers of animals in each study.
Early studies in sheep (Wallace and Bassett, 1970), Hereford cattle
(Eaton, Klosterman and Johnson, 1968b) and Angus, Hereford,

14
Shorthorn, and Charolais cross-breeds (Trenkle and Irwin, 1970)
indicated a trend towards higher plasma GH levels in male ruminants
while Irwin and Trenkle (1971) found significantly higher plasma GH
levels in male cattle of several breeds. Significant differences in
plasma GH levels between breeds were not observed in any of the above
studies. It appears that male ruminants not only have higher (P < . 05)
plasma GH levels, but also lower (P < .01) fractional turnover rates
as noted by Trenkle (1971) in comparing Hereford bulls with Hereford
heifers,
Responses to activities or infusion of substances that provoke
GH secretion in humans are greater in females than in males. For
instance, plasma GH levels obtained within two minutes of first
waking in the morning are only slightly higher in women while plasma
GH levels after moderate exercise are significantly higher in women
(Daughaday, 1968).
Effect of Collection Stress
Early workers considered growth hormone to be principally
involved with growth, especially skeletal growth. Because growth is
a constant and continuous process, hourly or daily variation in GH
secretion was not suspected. But Parker, Utiger and Daughaday
(1962) and Roth et al. (1963a, b.) demonstrated that pituitary GH
release in human subjects could be affected by the metabolic and

15
physical condition of the subject. Glick et al, (1965) and Hunter and
Greenwood (1964) demonstrated that insulin-induced hypoglycemia,
exercise, and surgery also stimulated pituitary GH release in humans.
Thus, GH came to be known as a "stress" hormone. The term stress,
as used in the literature, denotes a wide range of physically and
psychologically stimulating activities, from simply climbing stairs to
electroconvulsive therapy.
As opposed to the elevation in GH levels resulting from stress in
man, studies in rats and mice indicate that stress decreases plasma
GH. Repeated ether anesthesia, exposure to cold (4C) for period of
1 to 2 hours, insulin-induced hypoglycemia, and forced swimming all
result in decreased plasma GH in rats (Schalch and Reich lin, 1968).
Controversy exists with respect to the affect of stress on pituitary
GH levels in rats. Krulich and McCann. (1966) found that splenectomy,
formalin injections, and ringing a b ell in the cage resulted in signifi-
cant increases in pituitary GH, while Muller et al. (1967) reported that
cold stress (4C for 1 hour) depleted pituitary GH and formalin injec-
tions had no effect on pituitary GH. Mice respond to ether stress or
blood sample collection from the opthalmic venous plexus with a prompt
decrease in plasma GH (Schindler, Hutchins and Septimus, 1972).
Interpretation of stress experiments in many cases is difficult
since stress is not easily quantified. For instance, Machlin et al.
(1968a) reported that blood sample collection stress or exercise

16
increased serum GH levels in swine; however, Weiss et al. (197)
found that physical stress did not change plasma GH levels in swine.
Neither of these papers explain in detail the exact nature of the stress
imposed or the nature of the physical exercise; this makes compari-
sons of their results difficult. Stress in the form of temperature
changes is easily quantified. Studies in swine indicate that raising or
lowering the temperatures from the comfort range (21C) in a controlled
environment with low humidity increased plasma GH levels in swine;
however, if the humidity was elevated, plasma GH did not increase
(Marple et al., 1972). Swine exhibit significantly higher plasma GH
levels in the morning compared to the afternoon, indicating a diurnal
variation (Marple and Aberle, 1972; Topel et al. , 1973),
Controversy exists with respect to the affect of stress, par-
ticularly collection stress, on serum GH levels in ruminants. Early
studies suggested that method of collection and resulting stress
stimulated GH secretion since significant increases in serum GH
levels were noted during and immediately after insertion of a jugular
catheter in cattle. Saline injections stimulated GH secretion in one
study in sheep while another study showed that the stress of handling
or jugular venipuncture failed to produce variation in serum GH levels
(Davis, 1972; Eaton, Klosterman and Johnson, 1968a; Wallace and
Bassett, 1970)0 High ambient temperatures (35C) in cattle result in
significantly lower plasma GH levels than lower temperatures (18C);

17
however, cold stress in sheep results in increased plasma GH levels
Mach lin et al. , 1968b; Mitra, Christison and Johnson, 1972),
Elevation of plasma GH levels has also been noted in primates
other than man. Hemorrhage, loud noises, pinching, and arousal
from pentobarbital anesthesia stimulate GH secretion in the rhesus
monkey while capture from the cage, intense sound, aversive con-
ditioning, and ether anesthesia elevate plasma GH levels in the
squirrel monkey (Brown, Schalch and Reichlin, 1967; Meyer and
Knobil, 1967).
As mentioned previously, stress has many connotations and this
lack of definition contributes to the problem of interpretation of stress
experiments. And the magnitude of any stress is difficult to measure
considering the psychological as well as physical aspects.
Validation of Assay
The assay used in the present study consisted of a bovine GH
double antibody radioimmunoassay. Thus, the measurement of growth
hormone in the serum and pituitaries of goats in this thesis relies on
the cross reactivity of anti-bovine GH with goat GH. Cross reactivity
of hormones from related or unrelated species is well documented in
radioimmunoassay methods. Niswender et al. (1969) iodinated ovine
LH and used anti-ovine LH in measuring LH in the rat. Birge et al.
(1967), Peake, Mariz and Daughaday (1968), Takahashi, Daughaday

18
and Kipnis (1971) and Trenkle (1970b) iodinated procine GH in the
determination of rat GH. Brown, Schalch and Reich lin (1967), using
a human GH radioimmunoassay, quantified GH in the squirrel monkey
and Garcia and Geschwind (1968) and Schindler et al, (1972) used a rat
radioimmunoassay to measure GH in the mouse.
Validation of the assay used in the present study follows the
method used by Niswender et al. (1969). Briefly, it consists of
measuring recovery of exogenous GH added to serum, checking for
cross reactivity with other anterior pituitary hormones, and obtaining
a curve parallel to the standard curve when the serum or pituitary
extract is diluted. It should be noted that all GH values reported are
in terms of bovine NIH-GH-B16 (a gift of the National Institute of
Health) since this material was used as a standard as well as for
iodination.

19
METHODS AND MATERIALS
Experimental Design
The adult pygmy goats used in this study were derived from
foundation stock of the University of Oregon Medical School (Portland,
Oregon) and Battelle-Northwest (Richland, Washington). Origin of this
strain of pygmy goats is rather vague (Metcalfe and Hoversland,
1969); the colony at Oregon State University was started in 1964 with
additional introductions occurring through 1968. Goats representative
of the commercial goats prevalent in this area (Saanen, Nubian and
French Alpine) were also acquired during the time period 1964 to
1968. Throughout this thesis, these animals will be referred to as
"normal" goats. During 1966 to 1969 pygmy males were mated with
normal females resulting in the F1
individuals which were subsequently
crossed to form the F2
generation. During this same time period,
normal and pygmy strains were maintained for comparison purposes.
Adult goats available for study consisted of 6 normal females, 18
F1
females and 14 pygmy females while young goats available for
study from birth to 6 months of age consisted of 6 normal males, 30
F2 goats and 21 pygmy goats of both sexes.
Management conditions were similar from year to year and
between breeding groups. During the spring and summer, the animals

20
were kept on pastures. During the fall and winter, they were confined
by breeding group and fed a ration consisting of alfalfa and grass hay
ad libitum with supplementary grain.
Physical Measurements
All animals were weighed at birth and at one month intervals to
six months of age. Withers height was measured at 3 and 6 months
of age. At the time of slaughter the pituitary was removed and
weighed and each pituitary placed in a vial and stored at -20G.
Collection and Handlingof Blood Samples
At monthly intervals from 1 month to 6 months of age, blood
samples (10 ml) were collected by jugular venipuncture using
Vacutainers. The goats were restrained in a small holding pen and
individuals were bled in a random sequence at each collection period,
The blood was held at 4C for 1 to 3 days before being centrifuged at
3000g for 10 minutes, The serum was poured off and stored at -20C
until analyzed for growth hormone (G-1) content.
Preparation of Pituitary Extracts
After the pituitaries were thawed, the posterior pituitary was
dissected and discarded. The anterior pituitary was weighed and then

21
homogenized in approximately 70 ml of 0. 85% saline in a Sorvall
Omnimixer (Ivan Sorvall Inc. , Newton, Connecticutt) for 2 minutes
at 16, 000 rpm. The resulting homogenate was adjusted to a concen-
tration of 1. 0 mg /ml or 0. 5 mg /ml depending upon the quantity of
tissue. These homogenates were first diluted with 0. 01M phosphate
buffered saline, pH 7.0 (PBS) and then with 1% bovine serum albumin-
0. 01M phosphate buffered saline (BSA-PBS) to a final concentration of
33-1/3 ng/ml. The final dilutions were stored at -20C until analyzed
for GH.
Radioimmunoas say forGrowth Hormone
Iodination of Growth Hormone. The iodination procedure
followed that of. Greenwood, Hunter and Glover (1963), Purified
bovine GH (NIH-GH-B16) was prepared at a concentration of 1 mg /m1
in buffer (pH 8. 5, 0. 05M phosphate, 0. 85/0 NaCI) and 5 p.1 aliquots
were distributed in 1 ml vials and stored at -20C. At the time of
iodination, a vial was thawed and 0, 5 me 125 I-Iodine (50 me /ml, New
England Nuclear, Billerica, Massachusetts) and 25 141 0. 5M phosphate
buffer, pH 7, 5, was added and mixed.
Twenty p.1 chloramine-T, freshly prepared (3 mg/ml in 0. 05M
phosphate buffer, pH 7. 5), was added to the vial and the contents
mixed by finger tapping. At precisely two minutes, the protein

22
iodination reaction was stopped by addition of 50 ill of freshly prepared
sodium metabisulfite (2. 5 mg /ml Na2S2O5 in 0. 05M phsophate buffer,
pH 7. 5) after which 25 p.1 of 2. 5% BSA-PBS was added to decrease the
loss of hormone binding to the glass vial.
One hundred pi transfer solution (1% KI, 16% sucrose) was
added and the entire contents of the vial layered beneath the buffer of
a 0. 9 X 15 cm column containing Bio-Gel P-60 (Bio-Rad Labs,
Richmond, California). Seventy p.1 of rinse solution (1% KI, 0. 01%
bromphenol blue, 8% sucrose) was used to rinse the sides of the vial
and then also layered on the column. Prior to using the column, 2 ml
2. 5% BSA-PBS was eluted to prevent the hormone from binding to the
glass column.
The column was eluted with 0. 05M buffer (0. 05M phosphate,
pH 7.5) and 15 1-ml aliquots were collected in tubes containing 1 ml
5% BSA-PBS. After vortexing each fraction, a 5 1.1.1 aliquot was removed
for counting in an auto gamma counter (Packard Instrument Co. , Inc. ,
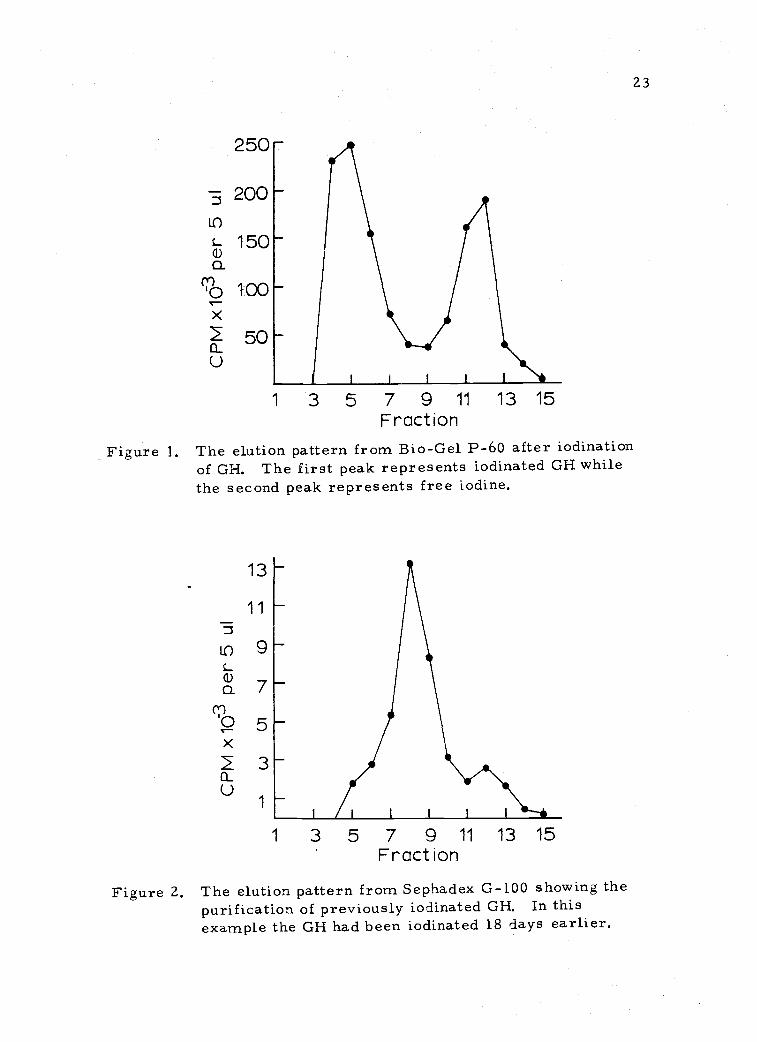
Downers Grove, Illinois). Figure 1 illustrates an example of an
elution profile from a Bio-Gel P-60 column. The fractions containing
the first peak were analyzed for their ability to bind with guinea pig
anti-bovine GH (GPABGH) and acceptable fractions were stored at 4C
for periods of up to 5 weeks. The iodinated GH preparation was
repurified on a 0. 9 X 15 cm column containing Sephadex G-100 (Sigma
Chemical Co. , St. Louis, Missouri) at weekly intervals to remove the
23
250
-s 200
a)L 150a.
(r)'0 1007.<
2 505a_
1 3 5 7 9 11 13 15Fraction
Figure 1. The elution pattern from Bio-Gel P-60 after iodinationof GH. The first peak represents iodinated GH whilethe second peak represents free iodine.
13
11
9
7
5
3
1 3 5 7 9 11 13 15Fract ion
Figure 2. The elution pattern from Sephadex G-100 showing thepurification of previously iodinated GH. In thisexample the GH had been iodinated 18 days earlier.

24
GH damaged by radiation. Sucrose (40 mg /0. 5 ml) was added to the
iodinated GH to be purified and this solution was then layered under
buffer on the column. Procedures for elution, fraction collection and
counting were similar to those used in the iodination procedure.
Figure 2 shows an elution profile after this purification procedure;
the first peak again represents the iodinated GH, while the second
peak represents the 125 I that has dissociated from the OH molecule,
The shoulder on the front of the first peak represents damaged GH
(Purchas, 1971).
Assay Procedure. The procedure used was patterned after that
used by Niswender et al. (1969). Hamilton micros yringes (Hamilton
Co. , Reno,, Nevada) were used for delivering any volume less than
1 ml.
Goat serum or pituitary samples, 1% BSA-PBS, and standard
GH solutions were added to 12 x 75 mm disposable culture tubes to a
total volume of 500 Sera, were assayed in dilution duplicate at
volumes of 100 p.1 or 200 p.1, while pituitaries were analyzed at
volumes of 300 p.1 or 500 Five hundred pa of the GH standards
(NIH-GH-B16) containing 0, 0. 1, 0. 3, O. 5, 0. 75, 1. 0, 1. 5, 2. 0, 3. 0,
or 5. 0 ng GH were assayed in triplicate in each assay, The first
antibody (guinea pig anti-bovine growth hormone) was diluted 1:400
with 0. 05M EDTA-PBS and then further diluted with 1:400 normal
guinea pig serum (also diluted with 0. 05M EDTA-PBS) to a

25
concentration that would bind about 30% of the iodinated GH. Two
hundred p.1 of this antibody was added to each tube, the contents
vortexed, covered and incubated at 4C for 24 hours.
One hundred pl of 1251 diluted to 200,000 CPM/ml with 1%
BSA-PBS, was then added to each tube. After vortexing, the tubes
were covered and incubated at 4C for 24 hours.
The lyophilized rabbit anti-guinea pig gamma globulin precipi-
tating antibody (RAGPGG) was reconstituted to its original volume
with glass distilled water and diluted with 0. 05M EDTA-PBS to a titer
which would effect maximum precipitation of the antigen-antibody
complex. Two hundred 1.1.1 of this antibody was added to each tube.
After vortexing, the tubes were covered and incubated at 4C for 72
hours. After this incubation period, 3 ml PBS was added to each tube,
The tubes were centrifuged at 1700g for 30 minutes, the supernatant
poured off, and the tubes allowed to drain on absorbent tissue. The
precipitate containing the antibody-bound 125 I-GH was quantified in an
automatic gamma counter set at 10, 000 counts or 10 minutes, which-
ever accumulated first. A least squares regression line was com-
puted for the standards and the coefficients of this regression equa-
tion were used by the computer to calculate the GH concentrations of
the sera or pituitaries.
Selection of Assay Conditions. After each iodination, fractions
within the first peak were checked for activity in a preliminary assay.

26
The purpose of these assays was to determine the immunological
activity of the iodinated GH and the proper titer of the first antibody.
This antibody was supplied by Dr. H. D. Hafs, Michigan State
University. The titer of this antibody was measured after each
iodination, while the titer of the RAGPGG was determined only when
a new batch was received. The antibody was obtained from Nutritional
Biochemicals Corp., Cleveland, Ohio. Table 1 shows an example of
the effect of dilution of GPABGH on the percent of activity bound.
Table 1. Effect of anti-GH dilution on the percent of1251-GH bound.
Dilution of GPABGH Percent Activity Bound
1:1600 48
1 :3200 39
1:6400 28
The maximum sensitivity under assay conditions is obtained
when the percent activity bound is 33-1/3% (Yalow and Berson, 1968).
Thus, the dilution of GPABGH was altered from assay to assay to
maintain this optimum level.
Validation of Assay, To determine the accuracy of the assay,
varying amounts of NIH-GH-B16 were added to 100 p.1 of serum.
Figure 3 shows the recovery of the exogenous GH by the assay.
Accuracy was poor when over 3 ng exogenous GH per tube was added,
but satisfactory at levels comparable to those found in serum.

27
Figure 3, Recovery of exogenous NIH- GH-B16added to 100 ill of goat serum.
Figure 4. Dose response curves for NIH-GH-B16and for goat serum and pituitaryhomogenates.

100
-0C 80
0
60
1511
40
0
20
II)
3
Least squaresregression line/
VP
N00L100°/0 recovery
4)x
(9/tkri. Rzr-.98
0 1 2 3 4ng NIH-GH-B16 measured
0-0NITH Bovine GH standards6-6Goat serum0-oGoat anterior pituitary
28
ng GH or ul(x100)serum or ng(x40) anterior pituitary

29
Figure 4 shows the parallelism of both serum and pituitary
dilutions with the standard curve. This parallelism strongly suggests
that the component of serum and pituitaries being measured is GH.
Yalow and Berson (1968) point out that ". . . proper behavior on
dilution is a necessary but not sufficient condition to prove immuno-
logic identity. "
Two pooled serum samples were included in each assay to check
for precision and for comparison between assays. If the GH for the
pooled sample differed significantly from values previously obtained,
the entire assay was discarded. Table 2 shows GH values obtained in
several individual assays.
Table 2. Precision in determining GH concentrations of pooledserum in individual assays.
SerumPool
Results of Individual Assays(ng GH /ml)
Mean ± SE(ng GH /ml)
Low sample 1. 6, 1. 4, 1. 4, 1. 6, 2. 0, 1. 8 1. 6 ± 0. 1
High sample 6. 3, 6. 3, 6. 3, 6. 6, 6. 3, 6. 7 6. 4 t 0. 1
Cross reactivity with bovine and ovine prolactin, ovine lutein-
izing hormone, ovine thyroid stimulating hormone and ovine follicle
stimulating hormone was tested in duplicate at levels of 0.5, 5, 50
and 500 ng /tube. Only bovine prolactin showed cross reactivity with
the guinea pig anti-GH used in this assay. But this only occurred at

30
500 ng bovine prolactin/tube which is considerably above physiological
levels. Thus, it was felt that the above hormones would not confound
the measurement of GH. Hormones used in the cross reactivity
check, for iodination, and for standards were a gift of the National
Institutes of Health.
Collection Technique Experiment
Fourteen mature pygmy female goats were selected for a series
of experiments to determine the affect of various stresses on serum
GH levels, Each animal was maintained in a separate pen with grass
hay and water ad libitum. These pens were contiguous so that
visibility between pens was possible, Indwelling jugular cannulae were
imposed in seven animals selected at random. Thirty cm of Intra-
medic Polyethylene Tubing (PE 60, Clay Adams, Parsippany, New
Jersey) was inserted into the jugular vein and the exterior portion
(45 cm) was attached at the insertion site and to the neck and shoulders
with adhesive tape. During collection, the first 0.5 ml of fluid was
discarded before a 5 ml sample of blood was taken. Approximately
2 ml of 3-1/2% sodium citrate was introduced into the cannula to
prevent clotting while the cannula was capped between collection
periods.
In experiment 1, blood was collected by jugular venipuncture
from five uncannulated animals at eight 20-minute intervals. In

31
experiment 2, blood samples were collected from the seven uncan-
nulated goats by jugular venipuncture and from the seven cannulated
goats via the cannulae at hourly intervals for six hours. Blood
samples were collected from the goats in the same order at each
time period. In the third experiment, four of the cannulated animals
were stressed by being tied with short lengths of rope. Samples were
collected at 5 minute intervals for 1 hour from both the tied and from
two untied cannulated goats. In the fourth experiment, three of the
previously uncannulated goats were cannulated and placed in metabolic
cages approximately 24 hours before the collection period. The
cannulae were extended to permit blood samples to be collected every
5 minutes for 1 hour from behind a partition. Every effort was made
to collect samples without the knowledge of the animal.
Statistical Analysis
The statistical analysis of this experiment was complicated by
missing blocks of data. For instance, only normal males were
available for study in the young goats while both sexes were available
in the pygmy and normal genetic groups. Thus, each analysis of
variance was performed on within sex or genetic group data.
Comparisons of genetic group effects from 1 to 6 months of age were
made only between male goats. Since the experimental design con-
sisted of repeated measurements, the method of Gill and Hafs (1971)
was applied throughout the analysis.

32
Regression analysis was utilized to measure time trends with
both linear and quadratic terms analyzed, although the quadratic
terms are not presented due to lack of significance. The heritability
(h2) estimates were also obtained by regression of mean value for all
offspring of a dam on the value of the dam or by regression of the
value of each offspring on the value of the dam (Kempthorne and
Tandon, 1953). Simple correlation coefficients were utilized in
measuring relationships of growth and GH indices within genetic
groups and ages.

33
RESULTS AND DISCUSSION
The composition of the genetic groups available in this study
dictated that the analysis be divided into two sections. The first
section consists of an analysis of GH status and growth measurements
of normal, F2
and pygmy goats from birth to 6 months of age. The
second section of the analysis consists of body size and GH status in
mature female normal, F1
and pygmy goats which are referred to as
adult goats. These animals ranged from 3 to 7 years in age and were
felt to have attained mature height and weight.
The lack of all genetic groups in each section of the study
complicated the analysis. Normal female goats were not available in
the first section; thus, in many, cases the statistical analyses were
performed on within genetic group data to avoid this complicating
factor. The only F1
population available for comparison with parental
types was in the adult section while the only F2 population available
for study was in the young goats. Comparison of genetic groups
between the young goats and adult goats is limited to female pygmy
goats, since all other comparisons would include sex differences.
Genetic Analysis
One of the primary aspects of this study from its conception
was to determine from an F generation the mode of inheritance of

34
the pygmy trait, Realizing that a large F, population was impossible,
it was hoped that the mode of inheritance would be relatively simple
as proposed by Blanks (1971). Body weight growth curves for the
pygmy, F2 and normal goats from birth to 6 months of age are
illustrated in Figure 5. The male normal goats are not only larger
at birth, but grow at a significantly faster (P < . 05) rate than male
pygmy goats. The male F2
goats also grow significantly faster
(P < . 05) than the male pygmy goats while the growth rate is not
significantly different between male normal and male F2
goats from
birth to 4 months of age, The reduced growth rate of the males at
4 and 5 months of age was caused by an outbreak of coccidiosis which
was especially severe among the F2 males. Since it is difficult to
determine the total effect of the disease on growth rate in the F2
males, comparisons are based on the actual data with the understand-
ing that the F2 males should be slightly larger in body size. To avoid
this complicating factor, analysis of growth rate between genetic
groups is based on growth rate to 4 months of age,
Mean height and weight measurements of the F2 generation at
3 (Table 3) and 6 months (Table 4) of age are essentially intermediate
between the pygmies and normals, although at 6 months of age they
are aligned closer to the means of the pygmy goats. The indices of
variation (standard error, standard deviation and coefficient of
variation) indicate that phenotypic variation is essentially equal within

30-
25-
20-
15
0O
10-
35
Normal males
F2 mules
2 females
Pygmy males
Birth 1
Pygmy females
2 3 4Age (months)
5
Figure 5. Growth curves of three genetic groups of goats from birthto 6 months of age with least squares regression lines formales of each genetic group.
6

Table 3. Body measurements and indices of variation at 3 months of age of threegenetic groups of goats,
Group nHeighta
(cm) sb CVc
(%)
Weighta(kg) s
b CVc(%)
Pygmy male 11 35 ± 1 4 11, 2 8± 1 2 23, 1Pygmy female 10 34 ± 1 4 10, 5 8 ± 1 2 20, 9F2 male 17 44 ± 1 3 6, 7 15 ± 1 3 16, 8F2 female 13 41 ± 1 3 7. 8 13 ± 1 2 12, 7Normal male 6 57 ± 1 3 4, 8 21 ± 2 4 20, 1
Mean ± standard errorStandard deviationcCoefficient of variation
Table 4. Body measurements and indices of variation at 6 months of age of threegenetic groups of goats,
Group nHeighta
(cm) sb CVc
(%)
Weighta(kg)
sb cvc(%)
Pygmy male 10 39 ± 1 4 10, 9 10 ± 1 2 21, 9Pygmy female 10 37 ± 1 3 8. 3 10 4- 1 2 19. 4F2 male 17 47 ± 1 3 6, 9 17 ± 1 3 17. 3F2 female 13 45 -+ 1 2 5, 2 16 ± 1 2 13, 9Normal male 6 62 ± 1 4 5, 7 28 ± 2 4 15, 7
Mean ± standard errorStandard deviationcCoefficient of variation

37
each genetic group. Normally, we would expect the F2 generation to
show more variation than the parental types due to gene segregation.
There are several possible reasons for the lack of greater
phenotypic variation in the F2 population relative to the parental types.
Firstly, the pygmy goats currently maintained at the University of
Oregon Medical School and Battelle-Northwest (Richland, Washington)
were derived from a small initial population (Metcalfe and Hovers land,
1969). As far as can be ascertained, all of the pygmy goats used in
this study originated from either of these two colonies. Thus, the
inbreeding level of the pygmy goats is probably fairly high. Inbreed-
ing generates homozygosity which leads to a reduction in vigor and
buffering ability of the genotype (England and Winters, 1953; Fuchs
and Krueger, 1975). Consequently, the large phenotypic variation
seen in the pygmy goats could partially be the result of inbreeding.
We cannot determine the level of inbreeding present in the pygmy
goats analyzed in this study because adequate records have not been
available on the pygmy goats introduced into our colony. Another
reason for the lack of greater phenotypic variation in the F2 genera-
tion may be because the F1
dams would provide a very uniform
maternal environment, thus reducing the environmental portion of
the phenotypic variation in the F2 generation.
Both the pygmy and normal goats used in this study are not
homogeneous for their respective genotypes, which means that to

38
some extent they are segregating for size determining genes. For
example, the normal goats are the result of crossing three breeds of
local goats (Saanen, Nubian, and French Alpine), all of which vary in
size, both within breed and between breeds. The result of this segre-
gation within parental types is an F1
population that is segregating for
size determining genes in contrast to the normal concept of a uniform
genetic constitution in an F1
population.
The heights, weights, and indices of variation in the adult
female animals are shown in Table 5, The mean height of the F1 goats
is intermediate between the pygmy and normal goats while the mean
weight of the F1 goats is slightly closer to that of the normal goats.
Since the F1
goats are all the result of mating pygmy males to
normal females, we would expect the F1
to be slightly closer to the
normal size due to maternal influence and any positive heterosis for
size operating in the gene system. Phenotypic variation in the F1
goats is comparable to that observed in the parental types, which is
probably the result of gene segregation in the Fl population and large
phenotypic variation in the parental types resulting from the factors
discussed above. In addition, the normal goats exhibited large
variability in milk production which would increase the phenotypic
variability for body site in the F1
generation.

39
Table 5, Body measurements and indices of variation in three geneticgroups of adult female goats.
Group nHeighta
(cm)b
sCV
c
(%)
Weighta(kg)
bs
CVc(%)
Normal
Pygmy
F1
6
14
18
70 ±2
47 ± 1
58 ± 1
4
4
4
5,8
7. 9
6. 2
51 ±426 ± 1
41 ± Z
10
5
10
19.0
18, 8
25.4
aMean - standard errorbStandard deviationcCoefficient of variation
As mentioned previously, it was hoped that the inheritance of
the pygmy trait would be relatively simple, since we had only a small
number of goats in this study. It is obvious from the frequency
distributions of body measurements (Figures 6 and 7) at 6 months of
age that we are not seeing a full segregation in the F2 generation.
Some overlap exists between the pygmy and F2 goats for height and
weight, but these physical parameters do not overlap between the F2
and normal goats. The lack of full segregation in the F2 generation
rules out a simple mode of inheritance with only two genes as pro-
posed by Blanks (1971), It appears more likely that the trait is
polygenic in inheritance. With a large number of genes segregating
for a trait, the F2 population would be expected to be intermediate in
size as it is in this case. Since a full segregation requires 4n
individuals, where n equals the number of genes, an F population of

Normal
F2
I I
: .O Oi. .. ..
OA
Pygmy 1
.. :II:s :s.I 1 i 1 i
5 10 15 20 25 30 35Weight (kg)
Figure 6. Frequency distribution of body weights of three genetic groups of goats at 6 monthsof age.
Normal,
F2
Pygmy
30
I ts . ssil s1
to
2.. sI I I I I
35 40 45 50 55 60 65Wither Height(cm)
Figure 7. Frequency distribution of wither height of three genetic groups of goats at 6 monthsof age.

41
only 30 animals limits our ability to see a full segregation when the
number of gene pairs exceeds two. It appears that at least several
pairs of genes control the pygmy, trait and there is no evidence of
genes with major control.
By regressing offspring phenotype of dam phenotype, we can
estimate the heritability of body size in these goats. Kempthorne and
Tandon (1953) outlined this procedure using two weighting schemes
for offspring-dam pairs. Either each offspring-dam pair can be
weighted equally or the mean value for all offspring can be regressed
on the dam. In most cases, weighting each offspring-dam pair equally
is more efficient, but estimates obtained by both methods are shown
in Table 6,
Table 6. Heritability estimatesa of body measurements ingoats at 6 months of age.
MethodTrait
Wither Height Weight
Dam-Offspring pairsweighted equally 0. 89 4-- O. 46 0. 28 ±- O. 38
Dam-mean ofoffspring 00 87 ± 00 55 0, 28 ± 0. 40
aHeritability ± standard error
Both estimates of heritability of wither height are relatively
high, but large standard errors of the estimates make their meaning-
fulness questionable. It does appear that wither height is more
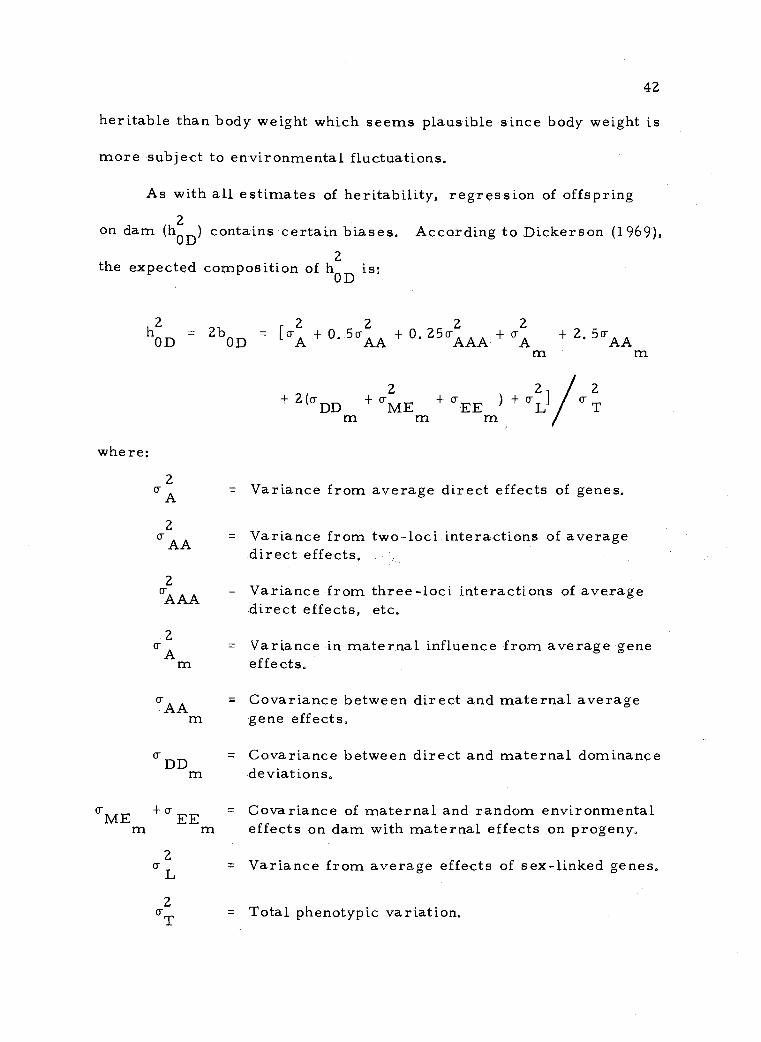
42
heritable than body weight which seems plausible since body weight is
more subject to environmental fluctuations.
As with all estimates of heritability, regression of offspring
on dam (h2D ) contains certain biases. According to Dickerson (1969),2
the expected composition of hOD
is:
h22 2
o-+ 2.5hOD = 2b = [o- + 0. o-25 + 0. 250A2
+ oAOD AAA A AA
m
where:
2o-
A
2
TAA
2
AAA
2
Cr Am
°,-AAm
+ 2 (crDD
+ o-ME + crE E
) + o-21/6Tm
= Variance from average direct effects of genes.
= Variance from two-loci interactions of averagedirect effects.
= Variance from three-loci interactions of averagedirect effects, etc.
= Variance in maternal influence from average geneeffects.
Covariance between direct and maternal averagegene effects,
o-DD = Covariance between direct and maternal dominancem deviations.
°ME + EE = Covariance of maternal and random environmentalm m effects on dam with maternal effects on progeny.
2
L= Variance from average effects of sex-linked genes,
= Total phenotypic variation.

43
Thus, heritability estimates obtained by regression of offspring
on dam are subject to major biases from epistatic interactions2 2
(o-AA + AAA) as well as interactions of maternal effects with the other
components (o-A
, o-AA ' DD
o-ME
o-EE
). The exact effectm m m m
of these biases on the heritability estimates in this study cannot be
determined. Considering the large standard errors of the h 2 esti-
mates and the inherent biases of the bOD
technique, the h2 values
obtained here can only serve as indicators of the additive genetic
variance in relation to the total variation.
Serum Growth Hormone Analysis
Previous studies in goats have shown serum GH levels of
approximately 10 ng/ml in suckling animals and 7 ng/ml in mature
animals (Stern, Baile and Mayer, 1971). Growth hormone levels
reported in sheep range from 2 -4 ng/ml (Wallace and Bassett, 1970)
to 6-8 ng/ml (Trenkle, 1971b) while GH levels reported in cattle by
Purchas et al. (1970) and Trenkle and Irwin (1970) range from 7-8
ng/ml which is slightly higher than values reported in sheep, The
serum GH levels in young goats from 1 through 6 months of age
reported in this study (Table 7) are slightly lower than those reported
previously. But levels reported on the basis of radioimmunoassay
can vary between laboratories as a function of both the standards and
anti-GH antibody used in the assay. This variation plus the fact that

Table 7. Serum GH levelsa in normal, F2, and pygmy goats from 1 through 6 months of age, (in ng 1 .
Genetic group n Age (months)1 2 3 4 5 6
Normal male 5 9. 6 I 2. 5 9. 4 ± 3.7 7 . 5 ± 3. 6 4. 2 ± O. 5 6 . 9 ± 1 . 5 1 . 6 I O. 3 6. 5 I 1. 0
Fz male 17 3. 0 ± 0.7 5. 9 ± I. 2 4. 4 ± 0.7 3. 5 ± 0. 8 6. 1 I 0. 9 7. 6 ± 0. 9 5. 1 I 0. 4
Pygmy male 1 1 3.7 I 1. 2 5 . 3 ± L 3 3 . 3 ± 1 . 3 5. 5 ± L 3 9. 5 I 1 . 8 9. 8 I 1. 3 6. 2 ± 0. 6
F2 female 13 1.5 I 0. 4 3. 2 ± 0.7 3. 6 I 1. 1 1. 9 I 0. 6 4. 6 ± 1.0 3.7 I 0. 6 3. 1 ± 0. 3
Pygmy female 10 2. 4 ± 1 . 1 1 . 4 ± 0. 3 1 . 8 ± 0. 5 2. 5 ± 00 8 2. 4 ± 0.7 20 1 ± 0. 3 2. 1 ± 0. 3
aMean - standard error

45
levels reported here are based on a cross reacting assay means that
relative values between animals and genetic groups are of primary
importance rather than comparison with values reported in the
literature. The large standard errors indicate the variability of
circulating GH levels.
One of the basic aspects of this study is a comparison of serum
GH levels in the pygmy and normal goats. Since normal females were
not available for analysis, the comparison in the young animals is
only between normal and pygmy males. Serum GH levels in normal
males are high at 1 month of age and decrease (P < .005) with
advancing age while the levels in the pygmy males rise (P < .005)
with increasing age (Table 7). This difference is illustrated in
Figure 8 in which the least squares regression lines of the changes in
serum GH levels with age in the young male goats are presented.
Analysis of serum GH levels over the entire 6-month age span
studied revealed no significant difference between serum GH levels in
normal (6.5 ± 1.0 ng/ml) and pygmy (6.2 ± 0. 6 ng/ml) male goats
(Table 7). But a highly significant (P < . 005) interaction of genetic
group with age (Appendix, Table A) merely substantiates the effect of
age on serum GH levels in the normal and pygmy goats as illustrated
in Figure 8.
Work with dairy bulls indicates that circulating GH levels are
high at birth but have decreased by 1 month of age to a level which

10
8
6
4
2
46
77
0)
GC74'\Pygmy
L males
F2 males
3 4 5
Age (months)
Figure 8. Least squares regression lines of serum GH changes withage of three genetic groups of goats.

47
remains constant throughout the first year of life (Purchas et al.,
1970). Trenkle and Irwin (1970) found a slight, but non-significant
decline in serum GH levels in beef bulls with increasing age. A sig-
nificant decrease in GH levels between suckling and weanling rumi-
nants was observed by Stern et al. (1971), which is comparable to
results observed in the normal goats of the present study, in which
all animals in our study were weaned at 3 months of age. The
decrease in serum GH with age in the normal goats appears to be
more rapid than it is in other ruminants; however, a larger sample
would be necessary to confirm_ this difference. As will be discussed
later, serum GH levels are highly variable which means that the low
serum GH levels in the normal goats could be due simply to sampling
variation. It is apparent that a continuation of this experiment beyond
6 months of age would have improved the significance of the results.
In contrast to the decreased serum GH with age in normal
goats, serum GH levels in pygmy males increased with age (Figure 8)
which contradicts previously reported data in normal ruminants.
There were no significant differences in serum GH levels between
normal and pygmy males over the 6 month period of study. However,
further analysis revealed significant differences between the serum
GH levels of the normal and pygmy goats at 1 month (P < . 05)
(9. 6 ± 2. 5 and 3.7 ± 1.2 ng /ml, respectively) and at 6 months (P <
.005) (1. 6 ± 0. 3 and 9. 8 ± 1, 3 ng/ml, respectively) of age, The least

48
squares regression line of serum GH levels on age in the F2 males
(Figure 8) shows that the F2 males are somewhat intermediate between
the parental types although the slopes of the pygmy and F2 regression
lines are not significantly different.
The most noticeable aspect of the data in Table 8 is that the
adult female F1
population, although intermediate in body size between
the adult female normal and pygmy parental types, are not inter
mediate in GH levels between parental types. It is possible that a
lower rate of GH utilization at the cellular level and/or a higher rate
of release may be factors responsible for the higher serum GH levels
in the F goats.
Table 8. Serum GH levels a in three genetic groups ofadult female goats.
Geneticgroup
Serum GHlevel
(ng /ml)
Normal 6 0. 8 0. 3b
Pygmy 14 2.5 ±0.3cF1 18 3.7 ± 0.7c
aMean ± standard errorb, cValues with different superscripts are significantly
different (P < .005)
Circulating GH levels were significantly lower (P < .005) in
the normal adult goats (0. 8 ± 0. 3 ng/ml) than in the pygmy adult goats
(2. 5 ± 0. 3 ng/m1). This result appears contradictory to the normal

49
concept of the relationship of GH and growth, since normal goats are
larger and grow faster, This difference between circulating GH
levels in adult pygmy and normal goats is even more significant when
the small within animal variation due to collection and collection x
group effects is considered (Table 9).
Table 9. Analysis of variance of circulating GH levelsin adult pygmy and normal goats.
Source df MS
Between Animals (19)Groups 1 26, 29 12, 34***Animals /Group 18 2. 13
Within Animals (20)Collection 1 0. 15 0.09Collection x Group 1 0. 55 O. 32Error 18 1.74
***P < . 005
Circulating growth hormone levels are a function of the rate of
release from the anterior pituitary, the volume of its distribution in
the body and the clearance and/or utilization rate, The clearance
rate refers to the quantity of GH removed from the cirulation per unit
time. With techniques available at the present time the clearance rate
includes the amount of GH degraded per unit time as well as the GH
utilized per unit time; thus, measurement of the GH clearance rate
means very little with respect to GH utilization. Until the utilization

50
component can be removed from the encompassing clearance rate,
the significance of measurement of turnover rates is questionable.
Yousef and coworkers (1969) injected both exogenous unlabeled and125 I-labeled GH into dairy cattle and found large variability between
animals in the half-life, distribution volume and clearance rate of
GH. The mean half-life estimated with unlabeled GH was 22.5 min
compared to 24. 4 min using labeled GH which indicates agreement
between the two methods. Estimates of GH distribution volume
ranged from 20 to 40 liters per cow indicating either inaccuracy in
the technique used to estimate the distribution volume or large
variability in this component of serum GH level. Large variability
in the components of circulating GH levels and high positive correla-
tions of rates of release with plasma GH levels were observed after
injection of exogenous GH into beef cattle (Trenkle, 1971c). Con-
sidering the factors that influence serum GH levels, there are
several possible explanations for the higher serum GH levels observed
in pygmy goats relative to the normal goats. Trenkle's results would
indicate that in the present study a higher rate of release of GH exists
in the pygmy goats relative to normal goats. Perhaps a more plausible
explanation is that serum GH levels are higher in the pygmy goat
because of a lower GH utilization rate. In other words, the high GH
levels in the pygmy goats may be a manifestation of the pygmy trait
and not a causative factor as originally hypothesized.

51
Another possibility is that the pygmy trait could be the result
of a biologically defective GH molecule since an immunological, not
biological, technique was used to quantify the GH molecule. However,
studies in other species comparing radioimmunoassay results with rat
tibia bioassay results indicate that the same molecule is being mea-
sured by both assays (Garcia and Geschwind, 1968; Purchas et aL ,
1970). Thus, previous research suggests that we are measuring the
GH molecule; however, the GH molecule in the pygmy goats might not
be as biologically active as the GH molecule in the normal goats. This
is one area of future research planned with respect to the pygmy trait.
Unfortunately, comparisons of serum GH levels in young
growing goats with mature goats is limited to young pygmy females
and mature pygmy females since other comparisons would have to be
made across both sex and age groups. Serum GH levels in pygmy
females at 6 months of age (2. 1 ± 0. 3 ng/ml) are similar to those of
their dams (2.5 ± 0.3 ng/ml). Work in humans (Daughaday, 1968)
and in cattle (Irwin and Trenkle, 1971) indicates that circulating GH
levels in adult animals are not significantly different from those of the
rapidly growing young. Thus, results of this study agree with studies
in other species which indicate that growth stasis is probably not due
to a reduction of GH available to the tissues. Considering the age
effects noted in both the normal and pygmy male goats between I and
6 months of age, it is unfortunate that the study of these animals was
not continued to maturity.

52
One of the most noticeable aspects of Table 7 is the lower
serum GH levels shown by the pygmy and F2 females when compared
to their male counterparts. Serum GH levels were significantly
higher (P < , 005) in male (6, 2 ± 0. 6 ng /ml) relative to female (2. 11--
0. 3 ng/ml) pygmy goats over the entire 6-month period (Appendix,
Table B). As illustrated in Figure 9 by least squares linear regres-
sion, the increase in serum GH levels with age in the pygmy males is
quite evident while in the pygmy females serum GH levels remained
essentially constant throughout the first 6 months of life.
Similar to the pygmy goats, serum GH levels were signifi-
cantly higher (P < . 005) in the F2 male goats (5, 1 ± 0. 4 ng/ml) when
compared to the F2 females (3. 1 -at 0.3 ng/ml) (Appendix, Table C).
However, as illustrated in Figure 10, linear regression lines of
changes in serum GH levels with age indicate that GH levels in both
sexes are increasing together. The serum GH levels in F2 males
increased significantly (P < , 005) with age while the increase in
serum GH levels in the F2 females approached significance (P . 06),
In agreement with the results of this study, higher serum GH
levels in male ruminants compared to female ruminants has been
reported by Irwin and Trenkle (1971), Trenkle (1971c), Trenkle and
Irwin (1970), and Wallace and Bassett (1970). Circulating GH levels
in male cattle are not only higher relative to female cattle, but GH
turnover rates are lower. The lower GH turnover rate in male

53
Figure 9. Least squares regression lines of changesin serum GH levels in pygmy male andfemale goats from 1 to 6 months of age.
Figure 10. Least squares regression lines of changesin serum GH levels in F2 male and femalegoats from 1 to 6 months of age.


55
relative to female cattle combined with higher serum GH levels in
male cattle results in essentially equal quantities of GH released by
the anterior pituitary and cleared or utilized in male and female
cattle during a given period of time. Thus, while plasma GH levels
are higher in male ruminants, it appears that utilization, at least as
expressed by GH available to the tissues per unit time, may be
essentially equal in both sexes.
A search of the literature failed to indicate a suitable explana-
tion for the higher serum GH levels in male ruminants. It appears
that GH levels may be influenced by sex hormones since diethylstil-
bestrol increased pituitary GH content of steers (Struempler and
Burroughs, 1959). Feeding diethylstilbestrol to cattle and sheep for
40 to 50 day periods results in increased plasma GH as reported by
Hutcheson and Preston (1971) and Trenkle (1970a). Furthermore,
serum GH levels in men and postmenopausal women were elevated by
stilbestrol (Greenwood, 1967), Estrogen treatment of male rats
lowered pituitary GH concentration while testosterone treatment of
female rats elevated pituitary GH content and concentration (Birge
et al., 1967). It is obvious that a thorough analysis of the relation-
ships of the sex hormones and GH is required before a valid hypothesis
for sex differences can be formulated.

56
Pituitary Growth Hormone Analysis
Pituitary GH concentrations of goats at 6 months of age
(Table 10) are about four times higher than those reported by Purchas
et al. (1970), although they are within the range (2 to 19 µg /mg) found
in his study of Holstein bulls from birth through 12 months of age.
The anterior pituirary GH concentrations in bulls peaked at 19 µg /mg
at 3 months of age, then declined to 3 µ,g /mg at 6 months of age, and
remained at that level through 12 months of age. Purchas also
compared the pituitary GH levels obtained by RIA with the rat tibia
bioassay and observed about two-fold higher levels with the bioassay.
This ratio was consistently maintained with all pituitary samples.
Curl et al. (1968) found considerably lower pituitary GH levels
(1 kg /mg) than reported in the present study in 6-month-old weanling
steers using the bioassay. Pituitary GH concentration in rats is
considerably higher and more variable than values reported in the
present study. For instance, Birge et al, (1967) reported pituitary
GH levels of 27 - 3.0 p.g/mg (n=8) in male rats and 26 - 3.0 µg /mg
(n=9) in female rats at 21 days of age while at maturity the pituitary
GH concentration was 86 ± 4.5 p.g/mg (n=8) in male rats and 33 ± 3.3
µg /mg (n=7) in female rats. In another study, mature male rats had
pituitary GH concentrations of 36 µg /mg while their female contem-
poraries had 12 µg /mg which is essentially the same level as reported

Table 10. Pituitary GH and body size criteriaa in goats at 6 months of age.
Genetic group
Anteriorpituitary
we ight(mg)
GH/mganteriorpituitary
(11g)
PituitaryGH
content(mg)
Bodyweight
(kg)
GH /kgbody
weight(mg)
Normal male
Pygmy male
Pygmy female
F2 maleF
2female
6
10
10
17
13
283.
114,
108.
143,
133.
3
1
3
9
4
± 22, 5b
±c, d
± 5.7d± 7, 9c
± 6, lc' d
15, 4 ± 2. 7b
12, 5 ± 1. 813' c
140 3 ± 1. 4b
90 3 1: O. 9c
±b c11.7 - 1. 2 °
30
1.
1.
1.
1.
7 ± 0, 6b
5 ± O. 3c
5 ±0, lc3 ± 0. lc
5 - 0. 2c
27 ± 1. 8b
10 ± 0.7c
9 ± 0. 6c+
17 - .7 d
16 ±O, 6d
0.
0.
0.
0.
0,
14± 05b, c
14 ± O. 02b
17 ± O. 02b
08 0. Ole
10 - O. Olc
aMean - standard errorb, c, dValues with differing superscripts are significantly different (P < . 01).

58
in the present study (Trenkle, 1970b). Within genetic group variation
in pituitary GH levels appears to be high, but comparable estimates of
variation in runinant species have not been found in the literature.
Pituitary GH concentration was similar in pygmy and normal
male goats at 6 months of age. However, pituitary GH content was
significantly higher (P < .005) in normal than in pygmy goats since
the normal goats had larger (P < .005) anterior pituitaries. When the
pituitary GH content is expressed on a per-unit body weight basis, the
pygmy and normal males have the same mean value, Pituitary GH
concentration was significantly lower (P < .01) in F2 males relative
to normal male and pygmy female goats. And both sexes in the F2
generation exhibited significantly lower (P < .01) pituitary GH/kg
body weight in comparison with either pygmy or normal goats.
It is evident that in both the F2 and pygmy goats at 6 months of
age the female goats have higher, although non-significant, pituitary
GH levels, pituitary content and pituitary GH/kg body weight than the
corresponding males (Table 10).. Pituitary GH levels are higher in
male rats and mice than in females, although there appears to be an
age influence on the differences between sexes. Up to 8 weeks of age
the pituitary GH concentration is relatively equal in male and female
rats, but beyond this age the GH concentration in the male pituitary
increases while the pituitary GH concentration in the female remains
relatively stable. Thus, by maturity the male rat shows significantly

59
higher pituitary GH levels (Birge et aL , 1967; Daughaday et al.,
1968; Schindler, Hutchins and Septimus, 1972; Trenkle, 1970b).
Similar comparisons of sex effects on pituitary GH in ruminants are
not available.
The variability of pituitary GH in adult goats (Table 11) is
comparable with that observed in the young goats (Table 10). Adult
pygmy goats have significantly higher (P < . 05) pituitary GH concen-
trations compared to adult normal goats, but total pituitary GH content
in the adults is essentially equal in all genetic groups since the higher
concentration in the pygmy goats is offset by significantly larger
(P < . 005) anterior pituitaries in the normal goats. It is of interest
that the anterior pituitary of the adult F1 goats is relatively equal in
size to the anterior pituitary of the adult normal goats which is in
agreement with Blanks (1971).
Since the adult pygmy goat has pituitary GH content similar to
the adult normal goat and is of much smaller body size, the pituitary
content per unit body weight is significantly higher (P < .005).
Analysis of pituitary GH indicates that in young goats the pituitary
concentrations of normals and pygmies are not significantly different,
while in mature animals, the pituitary GH concentrations and GH/kg
body weight are higher (P < . 05) in the pygmy goats. To determine
the significance of the pituitary resuLts, the components of pituitary
GH concentration should be considered, Pituitary concentration is
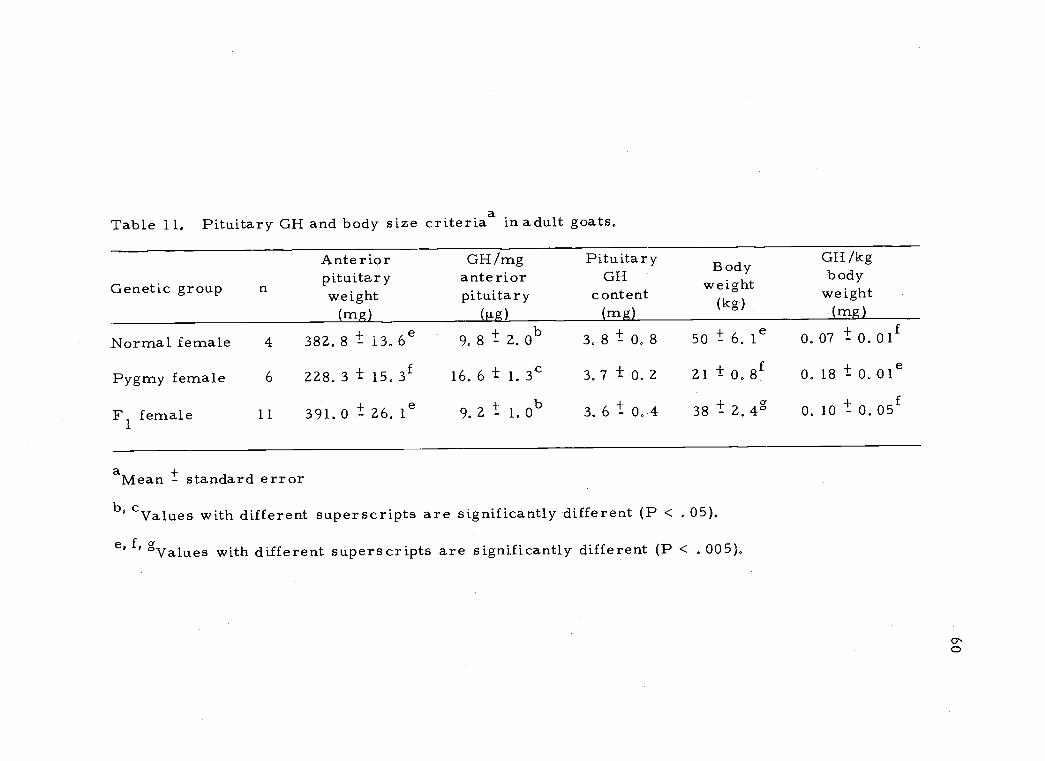
Table 11. Pituitary GH and body size criteriaa in adult goats.
Genetic group n
Anteriorpituitaryweight
(mg)
GH /mganteriorpituitary
Gig)
PituitaryGH
content(mg)
Bodyweight
(kg)
GH /kgbody
weight(mg)
Normal female
Pygmy female
F1
female
4
6
11
382. 8 ± 13. 6e
228.3 ± 15.3f
391.0 ± 26. 1e
9. 8 ± 2. 0b
16.6 ± 1.3c
9. 2 ± + 1. 0b
3. 8 I 0. 8
3.7 ± O. 2
3. 6 ± 0. 4
50 ± 6. 1 e
21 ± 0. 8f
38 -1-- 2. 4g
O. 07 ± + 0. 011
0. 18 ± 0. Ole
0. 10 ± 0. 05f
aMean - standard error
cValues with different superscripts are significantly different (P < 05).
e, f, gValues with different superscripts are significantly different (P < . 005).

61
influenced by the <GH synthetic rate by the acidophilic cells of the
anterior pituitary which serves as the input variable while the rate of
release of GH from the anterior pituitary serves as the output variable.
Little is known concerning the nature of mechanisms which control
the pituitary concentration of GH by changing these two variables. It
is currently believed that growth hormone releasing factor, synthe-
sized by the hypothalamus, controls both the synthesis and release of
growth hormone. Since GH in the anterior pituitary is not actually
available to the tissues, the biological significance of pituitary GH
concentration and content is difficult to ascertain, Until development
of the radioimmunoas say, circulating levels of GH could not be
measured with the relatively insensitive bioassay; thus, pituitary
levels were the only criteria of GH status, This shift in emphasis
from pituitary GH levels to circulating GH levels would seem desirable,
since GH in the plasma is closer to actual utilization,
A comparison of pituitary GH concentration between pygmy
female goats (14, 3 ± 1, 4 p..g GH/mg) at 6 months of age (Table 10) and
adult pygmy female goats (16. 6 ± 1. 3µg GH/mg) (Table 11) indicates
that pituitary GH levels do not appear to change with age in pygmy
goats, at least from 6 months of age to maturity. Pituitary GH
concentration has been shown to be at its highest level in cattle
during the first few months of life and by 6 months of age the pituitary
concentration has declined to a level not significantly different from
62
the level at maturity (Curl et al 1968; Purchas et al. , 1970).
Relationship of GH with Growth Indices
If we consider the relationship of serum GH levels and growth
indices across genetic groups, it is apparent that a negative relation-
ship exists, since the pygmy goats have the highest serum GH concen-
tration. Previous results have shown that serum GH status in young
and adult normal and pygmy goats differ (Tables 7 and 8), which
indicates that an analysis of the relationship of serum GH with growth
indices should be made within genetic groups.
The correlations in Table 12 indicate that the genetic groups
exhibit different relationships between serum GH levels and growth
indices at 3 months of age; a highly significant (P < . 01) positive
relationship exists between wither height and serum GH level in the
normal while the pygmy goat shows a negative relationship. Similar
trends occur in the relationship of body weight and serum GH levels
since body height and weight are positively correlated. These results
add support to the hypothesis that a defect in OH utilization may be a
causative factor in the pygmy trait. If we accept the hypothesis, we
would expect to find higher serum GH levels in the smaller animals
within the pygmy population.
In contrast to the positive relationships between serum GH and
growth indices in normal goats at 3 months of age, the correlation
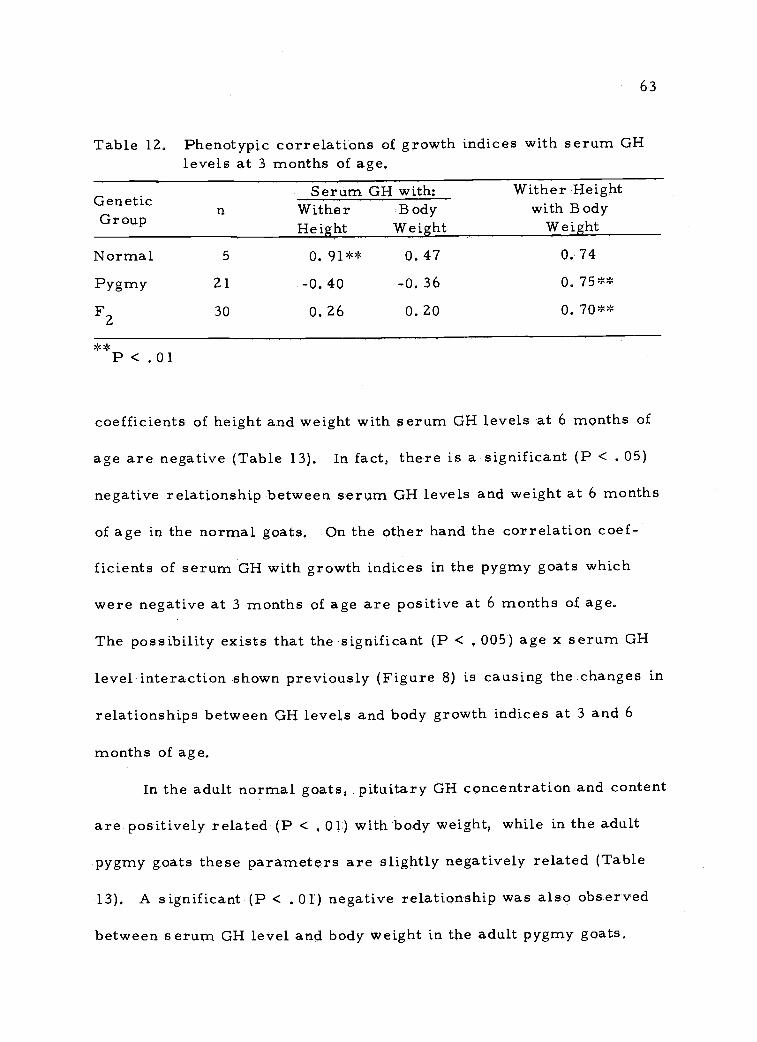
63
Table 12. Phenotypic correlations of growth indices with serum GHlevels at 3 months of age.
GeneticGroup n
Serum GH with; Wither Heightwith Body
WeightWitherHeight
BodyWeight
Normal 5 0.91** 0.47 0.74
Pygmy 21 -0.40 -0.36 0.75**
F2 30 0.26 0.20 0.70'*
**P < . 01
coefficients of height and weight with serum GH levels at 6 months of
age are negative (Table 13). In fact, there is a significant (P < . 05)
negative relationship between serum GH levels and weight at 6 months
of age in the normal goats. On the other hand the correlation coef-
ficients of serum GH with growth indices in the pygmy goats which
were negative at 3 months of age are positive at 6 months of age.
The possibility exists that the significant (P < 005) age x serum GH
level interaction shown previously (Figure 8) is causing the changes in
relationships between GH levels and body growth indices at 3 and 6
months of age.
In the adult normal goats, pituitary GH concentration and content
are positively related (P < 01) with body weight, while in the adult
pygmy goats these parameters are slightly negatively related (Table
13). A significant (P < . 01) negative relationship was also observed
between serum GH level and body weight in the adult pygmy goats.

Table 13, Correlation coefficients of serum and pituitary GH with wither height and body weight ofgoats at 6 months of age and as adults.
GroupGHa / GH/Htb Wt
Pit PitGHd/ GH/Ht Wt
Totale TotalPit Pit GH/kgfGH/ GH/ Wt /HtWt Wt
6 months of ageNormals 6 -0.28 -0. 74* -0. 38 -0.26 0. 01 -0. 15 0. 19
Pygmy 20 0.28 0. 22 0. 31 0. 30 0. 54** 0. 42 0. 17
F2 30 0.02 0.01 -0.21 -0. 12 -0. 06 0. 16 -0. 32
Adults
Normals 6 -0. 16 -0. 65 0. 10 0. 92** 0. 00 0. 88** -0. 33Pygmy 6 0. 34 -0. 84** -0. 38 -0. 13 -0. 39 0. 03 -0. 23Fl 11 0. 28 0. 20 -0. 24 -0. 53 -0. 12 -0. 08 -0. 37
aSerum GH concentrationbWither heightBody weight
dPituitary GH concentrationeTotal pituitary GH contentPituitary GH content/kg body weight
P < . 05**P < . 01
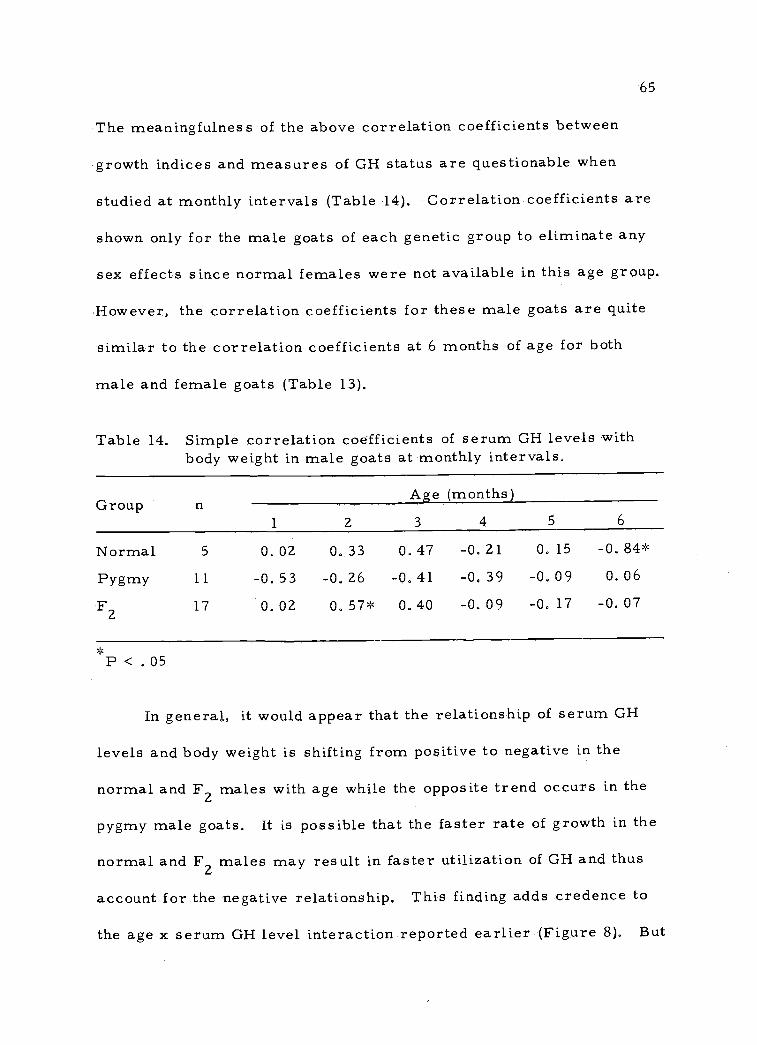
65
The meaningfulness of the above correlation coefficients between
growth indices and measures of GH status are questionable when
studied at monthly intervals (Table 14). Correlation coefficients are
shown only for the male goats of each genetic group to eliminate any
sex effects since normal females were not available in this age group.
However, the correlation coefficients for these male goats are quite
similar to the correlation coefficients at 6 months of age for both
male and female goats (Table 13).
Table 14. Simple correlation coefficients of serum GH levels withbody weight in male goats at monthly intervals.
GroupAge (months)
1 2 3 4 5 6
Normal 5 0.02 0.33 0.47 -0.21 0.15 -0.84*
Pygmy 11 -0.53 -0.26 -0.41 -0,39 -0.09 0.06
F2
17 0.02 0. 57* 0.40 -0,09 -0.17 -0.07
*P < .05
In general, it would appear that the relationship of serum GH
levels and body weight is shifting from positive to negative in the
normal and F2 males with age while the opposite trend occurs in the
pygmy male goats. It is possible that the faster rate of growth in the
normal and F2 males may result in faster utilization of GH and thus
account for the negative relationship. This finding adds credence to
the age x serum GH level interaction reported earlier (Figure 8). But

66
it also must be realized that these observations are based on single
measurements of GH and body weight at each point in time. As will
be reported in a succeeding section, serum GH levels are not static,
but are constantly fluctuating with time. Consequently, single blood
samples may not reflect the true levels within each animal and may
invalidate our present observations.
Siers and Hazel (1970) and Siers and Swiger (1971) observed
negative relationships between serum GH levels and body size in
swine at 71, 104 and 147 days of age. Consequently, these authors
hypothesized that pigs which grow faster utilize GH at a faster rate
and thus have lower circulating GH levels, Studies in ruminants by
Trenkle and Irwin (1970) and Purchas et aL (1970) indicate no
significant relationships between serum or pituitary GH indices and
measures of growth. However, these workers also may have neglected
to sample GH at frequent enough intervals.
Even correlation coefficients based on larger numbers of
samples from each animal do not indicate strong relationships between
GH status and body size. In the collection stress experiment to be
reported in a succeeding section, an average of 13 samples were
collected from each mature female pygmy goat during a 3 day period.
Correlation coefficients between the mean serum GH level of these
samples and height (r =0, 46) indicate a positive, but non-significant,
relationship while a negative, but non-significant relationship

67
(r = -0. 19) appears to exist between serum GH levels and weight. It
should be emphasized that the animals used in this study are mature
goats and thus are not growing; therefore, serum GH levels might
not be expected to be related to size.
Relationship of GH Indices
The four indices of GH status used in this study consisted of
serum GH levels, pituitary GH concentration, total pituitary GH and
pituitary GH/kg body weight. Relative to GH status the relationship
of primary interest is that of serum GH levels and pituitary GH
indices, since the anterior pituitary serves as a reservoir of GH.
Serum GH was positively related to various indices of pituitary
GH in the young normal goats while similar correlations within the
other genetic groups at the younger age (3 to 6 months) were non-
significant (Table 15). Likewise, correlations of pituitary GH indices
in the adult goats within the genetic groups are non-significant and
vary from positive to negative. An age or sex interaction between
pituitary and serum levels of GH may account for some of these
effects,
Purchas et al. (1970) also observed a non-significant relation-
ship (r=0.006) between plasma and pituitary levels of GH in dairy
bulls and concluded that a strong relationship between these two GH
indices does not appear to exist. The primary component of GH status

68
Table 15. Correlation coefficients of serum GH levels with pituitaryGH indices of goats at different ages.
Group Pituitary GHConcentration
Total PituitaryGH
Pituitary GH/kgBody Weight
Young GoatsNormal 6 0.62 0.60 0. 74*Pygmy 20 -0.03 0.12 -0.08F2 30 -0.09 -0.20 -0.17
Adult GoatsNormal 6 -0.35 -0.30 0.23Pygmy 6 -0.23 -0.46 0.12F1 11 -0.01 0.30 0.13
P < . 05
relating to pituitary GH levels consists of the secretion rate from the
anterior pituitary. Results of studies in ruminants (Trenkle, 1971c;
Yousef et al. , 1969) indicate a large variability in GH secretion rate
between animals and between times within animals. This, together
with the results observed in goats, suggests that the relationship
between pituitary and serum GH levels may be difficult to interpret.
Collection Stress Experiment
The results of the basic study to this point indicate a large
degree of variability in serum GH levels within each genetic group
and between collections in the same animal. A collection stress
experiment was designed to ascertain the nature of serum GH
variation, the effect of blood sample collection stress, and to aid in

69
the interpretation of the results of the previous experiments. The
first experiment was designed to simulate the collection conditions
used in the basic study. The results shown in Figure 11 indicate that
repeated blood sample collection by jugular venipuncture does not
elevate the circulating GH levels; in fact, GH appears to decline with
time although not significantly. Thus, the absence of significant
changes in serum GH with time negates the possibility that the collec-
tion technique used in the basic study influenced serum GH levels. It
should be emphasized that the collection technique used in this first
experiment was only comparable to the technique used in the basic
study with respect to total time of collection since only one sample
was collected from each animal at each collection period in the basic
study. Actually, it is difficult to determine whether a single sample
collection or repeated sample collections is more stressful, since the
animals might become accustomed to repeated sample collection.
Variation in circulating GH levels in experiment one was quite high as
indicated by the large standard errors. Levels within individual
animals varied from 1.0 to 7. 0 ng/ml while over all animals, serum
GH ranged from 0. 7 to 7.0 ng/ml. Mean circulating GH level was
2. 5 - 0.2 ng/ml which is the same level as that obtained in these
adult female pygmy goats 5 months previously in the basic study.
This would indicate that although serum GH levels are extremely
variable, mean levels in a large group are rather constant.

0900 1000Time of Collection
Figure 11. Serum GH levels in adult female pygmy goats with repeated blood collections by jugularvenipuncture at 20 minute intervals (mean ± SE, n = 7).
1100

71
A second experiment was designed to compare GH levels in
blood samples obtained by jugular venipuncture and jugular cannula.
The most notable result, as depicted in Figure 12, is the rapid
elevation in serum GH between the first and second collection by
jugular cannula and the large standard errors associated with samples
obtained by jugular cannula. Much of this variation and elevation of
levels is due to one animal in which serum GH increased from 2, 9
ng/ml at the first collection to 21. 7 ng /ml at the second collection.
Mean sera GH for the cannulated and venipuncture groups were
4.5 ± 0. 8 ng /m1 and 2. 2 ± 0. 1 ng /ml, respectively. During the 5 hour
collection period, within-animal levels ranged from Z. 9 to 23. 9 ng/m1
while between-animal levels ranged from 0. 9 to 23.9 ng /ml; both of
these values occurred in the cannulated group. Within-animal levels
in the venipuncture group ranged from 1.5 to 5. 9 ng/ml while the
between-animal levels varied from 1. 1 to 5. 9 ng/ml.
Analysis of the data (Table 16) indicated that differences in GH
levels observed between the two collection methods are not statisti-
cally significant, Furthermore, lack of significant period and
method x period interaction effects indicate that repeated blood
sampling failed to cause significant changes in serum GH levels
with either method of collection. As mentioned previously, the
higher levels and greater variation in the cannulated group is largely
due to one animal. A comparison of serum GH levels of the two groups

7
-E- 6
co 5c
40E 3L
2(f)
1
venipuncture
1
0900 1000 1100 1200 1300 1400Time of Collection
Figure 12. Serum GH levels in adult female pygmy goats with repeated blood collectionsby jugular cannula and jugular venipuncture at 1 hour intervals (mean ± SE,n = 7).

73
Table 16, Analysis of variance of serum GH levels in bloodsamples collected by jugular venipuncture andjugular cannula.
Source df MS
Between Animals (13) 114, 10Method 1 39. 50 2.89Animals /Method 12
Within Animals (70)Periods 5 9. 84 0, 42Method x Periods 5 17, 06 0. 72Error 60 23.55
after the removal of this animal decreased the variability although
the cannulated goats still showed slightly higher serum GH levels
with greater variability (Figure 13).
Experiment three was designed to determine the effect of
restraint as an artificially induced stress on circulating GH levels,
Four of the cannulated pygmy goats from experiment two were tied
with a short length of rope which, judging from their reaction, was
felt to constitute a stressful situation. Blood samples were collected
from these four cannulated and tied goats and from two cannulated
goats which were untied during the experiment, at 5 minute intervals
for 1 hour. As illustrated in Figure 14, serum GH levels in the untied
group declined with repeated sampling, but these data only represent
two goats, one of which had relatively high serum GH (7. 4 ng/m1) at
the initial collection period. After serum GH in this goat declined,

5
4
3
2
1
ecannula
C./enipuncture
0900 1000 1100 1200 1300 1400Time of Collection
Figure 13. Serum GH levels in adult female pygmy goats with repeated bloodcollections by jugular cannula (n = 6) and jugular venipuncture (n = 7)at 1 hour intervals after removal of one animal from the cannulatedgroup (mean ± SE).

10 20 30Time (minutes)
40 50
Figure 14. Mean serum GH levels in tied (n = 4) and untied (n = 2) cannulated adultfemale pygmy goats with repeated blood collections by jugular cannulaeat 5 minute intervals.

76
there was little change in serum GH with repeated sample collection.
If tying these goats constitutes a stress, it does not appear to have an
effect on serum OH.
The results of experiment three have some bearing on inter-
pretation of the results of experiment two concerning the elevation in
GH levels between the first and second collection periods which were
1 hour apart, Serum GH in blood samples collected over a 1 hour
period in experiment three did not increase with time as observed in
the first hour in experiment two (Figure 12). Eaton et al, (1968)
reported that collection stress in cattle resulted in a marked increase
in circulating GH levels. They based their conclusions on an eleva-
tion in GH levels from blood samples collected immediately before
and shortly after inserting a jugular catheter. In experiment two,
cannulae were inserted in the goats 24 hours prior to initiation of
sample collection; however, it is possible that the goats became
accustomed to handling and blood sample collection during the course
of these experiments. This would account for the lower (P < . 005)
GH (1. 5 ± 0.2 ng/ml) in experiment three in essentially the same group
of goats 2 days after cannulation relative to higher OH (4.5 t 0.8
ng/ml) in experiment two conducted 1 day after cannulation.
The results of experiment four (Figure 15) indicate the nature
of variability of circulating GH levels with each line representing the
GH levels within an individual goat, Blood samples analyzed in this

5
4
3
2
1
1 I I
10 20 30 40Time (minutes)
50
Figure 15. Serum GH levels in three adult female pygmy goats with blood samplecollection via jugular cannula at 5 minute intervals.

78
experiment were collected via jugular cannula, but without the goats'
knowledge. Thus, both physical and psychological stress should be
minimal. The variation in GH levels observed within 1 hour in these
three goats must be assumed to be innate variation. Similar variation
in serum GH in rams has recently been reported by Davis and Borger
(1973). Their results together with the results of experiment four
indicate that serum GH levels are oscillatory with secretory spikes
occurring at irregular intervals. These results emphasize the need
for an understanding of feedback mechanisms regulating GH secretion,
if such mechanisms exist.
The slope of the line of decreasing GH levels in the animal
showing the largest spike (Figure 15, solid circles) allows the
computation of half-life (t1 forfor the GH molecule. By calculating
the time required for one-half of the 6.5 ng/ml peak GH level to be
cleared, we obtain a half-life of 8 minutes which corresponds to a
half-life of 7 to 8 minutes for GH in sheep (Wallace and Bassett,
1970), It must be emphasized that this value is based on only one
animal, but it does give an indication of the clearance rate in these
goats.
Conclusions from these collection stress experiments can aid in
interpretation of the basic study, For instance, with the variation in
serum GH observed in experiment four (Figure 15), it would seem
logical that significant relationships between serum GH and body

79
growth indices within genetic groups may be difficult to establish.
It would appear that blood samples must be collected at frequent
intervals to establish meaningful relationships, Even then they may
be difficult to establish since large numbers of samples collected
from each goat in the stress experiments failed to reveal significant
relationships to growth measurements. Measurement of serum GH
in a particular animal at a particular time has little relationship to
growth indices because collection might be during or immediately
after a secretory spike; consequently, yielding completely different
results. Mean GH levels obtained for several animals seem to
remain fairly constant although some variation exists as evidenced by
experiment one (Figure 11). However, the method of blood collection
evidently had little influence on the serum GH levels observed.

80
GENERAL DISCUSSION
Results of this study indicate that the pygmy trait in goats is
inherited as a quantitative or polygenic trait while most studies of
dwarfism in other species have shown single gene modes of inheri-
tance. Single gene modes of inheritance are reported more commonly
in the literature since they can be confirmed easier than more complex
modes of inheritance, Considering the mode of inheritance of the
pygmy trait in these goats and the lack of reproductive problems in
crosses with normal size goats, it may be that these pygmy goats are
the result of either artificial or natural selection for reduced body
size over many generations, as opposed to a mutation at one or two
loci. However, a serach of the literature failed to disclose informa-
tion concerning the origin of the African pygmy goat,
The dwarf pig studied by Macklin et al, (1968) is of special
interest, since this dwarf pig resulted from 14 generations of selec-
tion for small body size. These pigs weighed 22-24 kg at 5 months of
age compared to an average of 70 kg for most commercial breeds at
a similar age; thus, they were smaller in relation to normal than the
pygmy goats in the present study. The fact that these dwarf pigs are
the result of 14 generations of selection indicates the large number of
genes that influence body size while the lack of a significant reduction
in serum GH level with the decrease in body size tends to emphasize

81
that GH deficiency is not the only explanation for growth retardation.
Dwarfs with GH levels comparable to their normal counterparts have
also been reported in cattle (Dev and Las ley, 1969) and humans (Parker
and Daughaday, 1968; Rimoin et al., 1968a, b), Results of the present
study indicate that the reduced size expressed by pygmy goats is not
the result of a growth hormone deficiency, at least as determined by
immunological methods. Although the pygmy trait is not due to a GH
deficiency, there does appear to be a relationship of serum GH levels
with the trait as evidenced by higher serum GH levels in the pygmy
goats. This finding is supported in part by higher than normal
responses of serum GH levels to infusion of arginine and insulin in
human African Pygmies (Rimoin et al. , 1968a, b).
Higher serum OH levels in pygmy goats compared to normal
goats is difficult to explain with the data available. It must be empha-
sized that in serum levels we are dealing with only one component of
GH status and utilization, If determinations of secretion rates and
clearance rates had been made, we would have a more complete
picture, but not necessarily the total picture. For instance, measure-
ment of clearance rate is not necessarily indicative of utilization and
it is impossible to separate these components with presently available
techniques. The higher serum GH levels in the pygmy goat are
possibly a manifestation of the pygmy trait resulting from a GH
utilization deficiency in the pygmy goats. If we assume that circulating

82
GH acts on the pituitary to reduce pituitary GH secretion, then it is
possible that GH in pygmy goats is not only defective with respect to
growth stimulation, but also with respect to this negative feedback
role. Therefore, we would expect higher serum GH levels in pygmy
goats relative to normal goats.
Higher serum GH levels in pygmy goats are also difficult to
interpret since this finding is in opposition to the normal concept of
the relationship of growth hormone and growth. For many years, it
was assumed that the function of growth hormone was limited to
stimulation of general body growth, especially skeletal growth; all
other effects noted in GH experiments were assumed to be due to
contaminating factors. This belief led to the concept that growth rate
is directly proportional to GH secreted. More recently, it has been
found that GH is active in metabolic activities and synergistic with
reproductive hormones, in addition to its growth promoting activities
(Turner and Bagnara, 1971).
Although the total role of GH in metabolism is still uncertain,
many of its functions are well known; for instance, it is active in
protein anabolism which probably accounts for many of its growth
promoting properties. Growth hormone has an anti-insulin effect in
concert with glucagon and glucocorticoids since these hormones act
to increase blood glucose levels. As Knobil (1961) points out, GH
stimulates the transfer of amino acids across cell membranes,

83
particularly into muscle cells, Growth hormone is also lipolytic in
that it acts to mobilize depot fat, Since GH also decreases fat
synthesis, it has been hypothesized that GH serves as is regulator of
body energy reserves (Russell, 1957). In this regulatory capacity,
GH acts as a homeostatic modulator to conserve energy and nitrogen.
The concept of the relationship of GH and growth is gradually
changing as evidence accumulates that GH has a far greater function
than just growth stimulation, It is quite evident that we must abandon
the hypothesis that growth rate is directly proportional to the growth
hormone secreted (Hunter, 1967), The short half-life, the metabolic
functions, the fluctuations due to stress, and the innate fluctuations
in serum levels indicate that plasma GH levels are too variable for
significant correlations to exist between GH levels and growth rate or
size at a given age, In addition, hypophysectomized rats respond
with measurable growth to only one injection of exogenous GH
(Geschwind and Li, 1955), which indicates that the amount needed for
normal growth undoubtedly is much less than the amount secreted.
Attempts in this thesis to relate serum and pituitary GH levels with
body size were unsuccessful, as would be expected considering the
previous discus s ion.
The decrease in serum GH levels with increasing age in the
normal goats during the 6 month growth study agrees with results
reported by Stern et aL (1971) where both sheep and goats showed a

84
significant decrease in serum GH levels from the suckling to weanling
period. According to these workers, serum GH decreases with a
change in metabolite concentrations in the blood due to the change in
diet between the suckling and weanling period. This explanation seems
to fit the results observed in normal goats since serum GH levels
during the 3 month suckling period are considerably higher than during
the 3 month period after weaning.
The elevation in serum GH with increasing age observed in the
pygmy males contradicts observations in normal animals of several
species. If a change in metabolite concentration does result in a
decrease in plasma levels in normal male goats, then it appears that
this change has the opposite effect in male pygmy goats. Mean serum
GH levels in two mature pygmy males were slightly lower (7. 4 ng/ml)
than in pygmy males at 6 months of age (90 8 ng/ml) which indicates
that plasma GH levels may remain high in pygmy males.
In contrast to the elevation in serum GH levels with increasing
age in pygmy males, serum GH levels remained constant during the
6 month growth study in pygmy females. A search of the literature
has failed to reveal a suitable explanation for this sex difference. In
addition to differences in sex hormones, Trenkle (1971c) reported
that GH turnover rates are more rapid in female cattle relative to
male cattle. It is evident that additional work is required concerning
the interrelationships of sex hormones, clearance rates, and utilization

85
rates of GH before definitive theories for sex effects can be formu-
lated.
While the F2 males had higher serum GH levels than F2
females, serum levels in both sexes increased slightly with increasing
age during the 6 month growth study.. The F2 animals should be a
composite of the two GH systems present in the parental types.
Results of the 6 month growth study indicate that the F2 population is
intermediate between parental types with respect to both GH levels
and growth indices and apparently the combination of the GH systems
also has affected the sex differences in changes in plasma GH levels
with increasing age.
The higher serum GH levels shown by male goats relative to
their female contemporaries appears to be more pronounced in this
study than in previous studies. While other studies in ruminants have
consistently shown higher serum GH levels in males, the differences
between sexes have rarely been significant. In comparison, the
results of this study indicate significant (P < . 005) differences between
sexes. The high degree of significance in this study could be due to
species variation or due to the large number of observations on each
animal in this study compared with only a few observations on each
animal in previous studies.
The variation in serum GH levels observed in the metabolic
cage experiment should be considered in interpretation of the basic

86
experiment. Within a 1 hour period, the Level in one goat increased
from 0. 5 to 6. 5 ng /m1 and then declined to 0. 5 ng/ml. Since this
variation in serum GH levels is apparently innate with respect to
outside influences, it must be considered as an unavoidable factor in
attempts to relate growth measurements with serum GH levels,
Considering this innate variation in serum GH levels, it is under-
standable that previous research on the relationship of serum GH and
growth indices have been inconclusive as was also the case in the
present study. To obtain an accurate picture of serum GH levels,
blood samples should be collected at frequent intervals at each point
in time,

87
SUMMARY AND CONCLUSIONS
Two groups of goats, separated on the basis of age, were
analyzed in this study. Physical traits and GH in young goats (6 normal
males, 21 pygmy and 30 F2 goats of both sexes) were analyzed from
birth to 6 months of age while similar traits were analyzed in adult
goats (6 normal, 14 pygmy and 18 F1 goats, 3 to 6 years of age).
Comparison of wither height and body weights in the F2 popula-
tion with the parental types (pygmy and normal) at the same age
indicated that a full segregation of genes controlling the pygmy trait
was not being expressed in this small F2 population. Thus, it was
concluded that the pygmy trait in these goats is polygenic in inheri-
tance. Regression of mean F2 offspring at 6 months of age on the F1
dam resulted in an estimated heritability (h2) for wither height of
0. 87 ± 0. 55 and an estimated h2 for body weight of 0. 28 ± 0.40.
Regression of each F2 offspring at 6 months of age on the F1 dam
resulted in an h2 estimate of 0.89 0. 46 for wither height and 0. 28 ±
0. 38 for body weight. The meaningfulness of these h2 estimates is
questionable considering the large standard errors and the many
confounding factors inherent in the technique of regression of offspring
on dam.
Serum GH levels were determined in blood samples collected at
1 month intervals from 1 to 6 months of age in the young goats. Serum

88
GH levels in normal male goats decreased significantly (P < , 005)
while serum GH levels in male pygmy goats increased significantly
(P < . 005) during the 6 month period. However, over the entire
6 month period, serum GH levels were not significantly different
between normal (6.5 ± 1.0 ng /ml) and pygmy (6. 2 ± 0. 6 ng/ml) male
goats. But significant differences were noted between serum GH
levels in normal and pygmy male goats at 1 month (9. 6 ± 2. 5 and
3. 7 - I. 2 ng/ml, respectively) and at 6 months of age (1. 6 ± 0. 3 and
9.8 ± 1. 3 ng/ml, respectively), Serum GH levels in male F2 goats
were intermediate between those in the parental types. Both pygmy
and F2
male goats showed significantly higher (P < .005) serum GH
levels than their female contemporaries during the 6 month period.
In contrast to the significant increase in serum GH levels in the male
pygmy goats, serum GH levels in female pygmy goats remained
relatively constant during the 6 month period, Serum GH levels in
male F2 goats increased significantly (P < . 005) during the 6 month
study while the increase in GH levels in the female F2 goats approached
significance (P = .06),
Adult female normal goats exhibited significantly lower (P <
005) serum GH levels (0. 8 ± 0. 3 ng hill) than adult female pygmy
goats (2. 5 ± 0. 3 g /ml). Serum GH levels in adult female FI goats
(3. 7 ± 0. 7 ng/ml) were significantly higher (P < .005) than levels in
the adult normals, though similar to serum GH levels in the adult

89
pygmy goats. Comparison of serum OH levels in pygmy females at
6 months of age (2. 1 t 0. 3 ng/ml) with their mature dams (2, 5 t. 0.3
ng/ml) tends to indicate that growth stasis does not result from
reduced availability of GH to the tissues, Since analysis of both the
young and adult goats indicates that pygmy goats have significantly
higher (P < .01) serum GH levels relative to normal goats, it was
postulated that growth hormone utilization at the cellular level in
pygmy goats might be defective,
Pituitary GH concentration and pituitary GH content per kg body
weight at 6 months of age were essentially equal in normal and pygmy
male goats, while the normal males had a greater (P < . 005) total
pituitary GH content due to larger (P < .005) anterior pituitaries.
Pituitary GH concentration and pituitary GH content per kg body
weight were significantly higher (P < . 05) in adult pygmy goats
compared to adult normal goats while total pituitary GH content was
essentially equal in all genetic groups.
Attempts at relating GH status, either pituitary or serum GH
levels, with body size were inconclusive since in some instances
positive relationships were observed while in other instances negative
relationships existed. It appears that definite relationships between
measures of GH status, at least the ones used in this study, and
indices of growth do not exist, Serum GH level also was not closely

90
related to pituitary GH concentration, total GH content or GH content
per kg body weight.
Since serum GH levels observed in the basic study were quite
variable, several experiments were designed to determine if blood
collection stress influenced serum GH levels in the basic study and to
determine the nature of serum GH variability. In the first experiment,
blood was collected by jugular venipuncture from five mature female
pygmy goats at eight 20-minute intervals. Results of this experiment
indicated that collection stress did not influence serum GH levels in the
basic study. In experiment two, jugular cannulae were inserted in
7 of 14 mature female pygmy goats selected at random. Blood
samples were collected from all 14 goats at 1 hour intervals in the
same sequence at each collection with sample collection in the uncan-
nulated goats via jugular venipunctu.re. Serum GH levels were
higher, although not significantly, and more variable in the cannulated
group. In the third experiment, four of the cannulated goats were
tied while two were left untied. This restraint was without effect on
serum GH levels. In the fourth experiment, blood samples were
collected via jugular cannula with the goats restrained in a metabolic
cage and unaware of sample collection. The variability observed even
under these conditions indicates that serum 01-1 levels exhibit innate
variability which tends to explain why serum GH levels are not
closely related to growth indices.

91
BIBLIOGRAPHY
Altman, P. L. and a S. Dittmer (eds. ). 1972, Biology Data Book,Vol. I. 2nd ed. Federation of American Societies for Experi-mental Biology, Bethesda, Maryland. 606 p.
Armstrong, D. T. and W. Hansel, 1956. The effect of age and planeof nutrition on growth hormone and thyrotropic hormone contentof pituitary glands of Holstein heifers. J. Anim. Sci. 15 :640-649.
Baird, D. M. , A. V. Nalbandov and H. W. Norton. 1952. Somephysiological causes of genetically different rates of growth inswine. J. Anim. Sci, 11:292-300.
Baker, B. , R. Hollandbeck, H. W. Norton and A. V. Nalbandov, 1956.Growth hormone content of swine pituitaries in relation togrowth rate and age. J. Anim, Sci. 15:407-417,
Berson, S.A. and R. S. Yalow, 1967, Radioimmunoassay of peptidehormones in plasma, New Engl. J. Med, 277:640-647,
Bidner, T. D. , R. A. Merkel, H. D. Hafs, L, V. Swanson and E. R.Miller, 1973, Serum growth hormone levels of pigs feddiethylstilbestrol plus methyltestosterone between 23 and 90kilograms. J. Anim. Sci. 36:337-342,
Birge, C. A. , G. T. Peake, I. K. Mariz and W. H. Daughaday, 1967.Radioimmunoassable growth hormone in the rat pituitary gland:Effects of age, sex and hormonal state. Endocrinology 81:195 -2040
Blanks, G.A. 1971, A morphological, physiological and geneticinvestigation of the African pygmy goat. Doctoral dissertation.Corvallis, Oregon State University. 107 numb, leaves.
Brasel, J. A. , J. Co Wright, L. Wilkins and R. M. Blizzard, 1965.An evaluation of seventy-five patients with hypopituitarismbeginning in childhood. Amer. J. Med. 38:484-498,
Brown, G. M. , D. S. Schalch and S. Reichlin. 1967. Growth hormoneresponse to stress in the squirrel monkey. Fed. Proc, 26:585.(Abstr, )

92
Castle, W. E. 1940. Mamallian Genetics, Cambridge, Mass. ,Harvard University. 169 p.
Curl, S. E. , M. A. Fennall, D. W. Zinn and R. A. Albin. 1968.Growth and development of the bovine as related to certainendocrine factors, J. Anim, ScL 27:1011-10140
Daughaday, W. H. 1968. Normal and abnormal secretion of growthhormone in man, In: R. L. Hayes, F. A. Goswitz and B. E. P.Murphy (eds. ), Radioisotopes in Medicine: In Vitro Studies,U. S. Atomic Energy Commission, p. 145-1630
Daughaday, W. H. , G. T. Peake, C. A. Birge and I. K. Mariz, 19680The influence of endocrine factors on the concentration of growthhormone in rat pituitary. In: Pecile, A. and E. E. Muller(eds. ), Growth Hormone, Excerpta Medica Foundation,Amsterdam. p, 238-2520
Davis, S. L. 1972, Plasma levels of prolactin, growth hormone andinsulin in sheep following the infusion of arginine, leucine andphenylalanine. Endocrinology 91:549-555,
Davis, S. L. and M. L. Borger. 19730 Dynamic changes in plasmalevels of prolactin, growth hormone and thyrotropin in maturevasectomized rams. Proc. Western Sec. Amer. Soc. Anim,Sci, 24:264-267,
Dev, V. G. and J. F. Lasley, 1969. Growth hormone level in theblood of dwarf and normal Hereford cattle, J. Anim. Sci,29:384-388.
Dickerson, G. E. 1969, Techniques for research in quantitativeanimal genetics, In: Techniques and Procedures in AnimalScience Research, American Society of Animal Science c/oQ Corporation, Albany, New York., p. 36 -79,
Eaton, L. W. , Jr. , E. W. Klosterman and R. R. Johnson. 1968a,Day to day variation and the effect of stress upon circulatingbovine growth hormone levels. J. Anim. Sci. 27:17850 (Abstr..)
Eaton, L. W. , Jr E. W, Klosterman and R. R. Johnson, 1968b,Serum growth hormone levels in cattle of different age, sexand breed. J. Anim. Sci. 27:1785-17860 (Abstr. )

93
Elings, P. W. 1953. Dwarfism in beef cattle, Extension Bulletin743. Oregon State University. 8 p.
England, D. C. and L. M. Winters. 1953. The effects of geneticdiversity and performance of inbred lines per se on hybrid vigorin swine. J. Anim. Sci. 12:836-847.
Epstein, H. 1946, The Hejaz dwarf goat. J. Hered. 37:345-352.
Fuchs, M. H. and W. F. Krueger. 1957. A comparison of the geneticvariance of purebred and strain-cross White Leghorns, Poul.Sci, 36:1120. (Abstr. )
Garcia, J. F. and I. I. Geschwind. 1968. Investigation of growthhormone secretion in selected mammalian species, In:Pecile, A. and E. E. Muller (eds. ), Growth Hormone. ExcerptaMedica Foundation, Amsterdam, p. 267 -291,
Gershberg, H. , S. Mari, M. Huese and H. St, Paul. 1964. Longterm treatment of hypopituitary and achondroplastic dwarfismwith human growth hormone. Metab. 13:152-160.
Geschwind, I. I. and C. H. Li. 1955. The tibia test for growthhormone. In: R. W. Smith, 0. H. Gaebler and C. N. H. Long(eds. ), Hypophyseal Growth Hormone. Nature and Actions.McGraw-Hill, New York, p. 28-58.
Gill, J. L. and H. D. Hafs. 1971. Analysis of repeated measurementsof animals, J. Anim. Sci. 33:331-3360
Glick, S. M. , J. Roth, R. S. Yalow and S. A. Berson. 1965. Theregulation of growth hormone secretion, Recent Progress inHormone Research 21:241-283.
Greenwood, F. C. , W. M. Hunter and J. S. Glover. 1963. Thepreparation of 131I-labeled human growth hormone of highspecific radioactivity. Biochem. J. 89:114-123,
Greenwood, F. C. 1967. Growth hormone, In: C. H. Gray andA. L. Bacharach (eds. ), Hormones in Blood. Vol. I. 2nd ed.Academic Press, New York.
Gregory, P. W, , W, C. Rollins, P. S. Pattengale and F. D. Carroll.1951. A phenotypic expression of homozygous dwarfism in beefcattle. J. Anim. Sci. 10:922-933.

94
Gregory, P. W. , W. C. Rollins and F. D. Carroll. 1952. Hetero-zygous expressions of the dwarf gene in beef cattle. South-western Vet. 5:345-349.
Gregory, P. W. , C. B. Roubicek, F. D. Carroll, P. O. Stratton andN. W. Hilston. 1953. Inheritance of bovine dwarfism and thedetection of heterozygotes. Hilgardia 22:407-450.
Hertelendy, F. , L. Machlin and D. M. Kipnis, 1969. Further studieson the regulation of insulin and growth hormone secretion in thesheep. Endocrinology 84 :192 -199,
Hertelendy, F, , K. Takahashi, L. J. Machlin and D. M. Kipnis, 1970.Growth hormone and insulin secretory responses to arginine inthe sheep, pig, and cow. Gen, Comp, Endocrinology 14:72-77.
Hilzheimer, M. 1916. Paarhufer (Artiodactyla), In: BrehmsTierleban. 4th ed. Saugetiere 4. Leipzig and Vienna.
Hunter, W. M. and F. C. Greenwood. 1964. Studies on the secretionof human pituitary growth hormone. British Medical J. 1 :804-807.
Hunter, W. H. J. A. R. Friend and J. A. Strong, 1966. The diurnalpattern of plasma growth hormone concentration in adults,J. Endocr. 34:139-146.
Hunter, W. H. and W. M. Rigal, 1966. The diurnal pattern of plasmagrowth hormone concentration in children and adolescents.J. Endocr, 34:147-156.
Hunter, W. M. 1967. A diminished role for growth hormone in theregulation of growth. In: G. A. Lodge and G. E. Lamming (eds. ),Growth and Development of Mammals, Plenum Press, NewYork. p. 71-91.
Hutcheson, D. P. and R. L. Preston. 1971. Stability of diethylstil-bestrol and its effect on performance in lambs. J. Anim, Sci.32: 146-151.
Irwin, R. and A. Trenkle. 1971. Influences of age, breed and sex onplasma hormones in cattle. J. Anim. Sci. 32:292-295,
Johansson, I. and J. Rendel. 1968. Genetics and Animal Breeding.W. H. Freeman and Co. , San Francisco. 489 p.

95
Johnson, L. E. , Go S. Harshfield and W. Mc Cone. 1950. Dwarfisman hereditary defect in beef cattle. J. Hered. 41 :177 -18L
Kempthorne, 0. and 0. B. Tandon. 19530 The estimation ofheritability by regression of offspring on parent. Biometrics9:90-100.
King, J. W. B. 1950. Pygmy: A dwarfing gene in the house mouse.J. Hered. 41:249-251,
Klatt, B. 1927. Entsteschung der Haustiere. Handbuch derVerebungswissenschaft 3:40-42.
Knobil, E. 1961. The pituitary growth hormone: Some physiologicalconsiderations. In: M. X, Zarrow (ed. ), Growth in LivingSystems, Basic Books, Inc , New York, p. 353-382.
Kramer, C. Y. 1956. Extension of multiple range tests to groupmeans with unequal numbers of replications. Biometrics12 :307 -310.
Krulich, L. and S. M. McCann. 1966. Influence of stress on thegrowth hormone (GH) content of the pituitary of the rat. Proc.Soc. Exp. Biol. Med. 122:612-616.
Lewis, U. J. , E. V. Cheever and Wo P. VanderLAANo 1965. Studieson the growth hormone of normal and dwarf mice. Endocrin-ology 76 :210 -215,
Lloyd, H. M. , J. D. Meares, 3. Jacobi and F. Jo Thomas, 1971.Effects of stilbestrol on growth hormone secretion andpituitary cell proliferation in the male rat. J. Endocr, 51 :473,-481.
Machlin, L. J. , M. Horins, F. Hertelendy and D. M. Kipnis. 1968.Plasma growth hormone and insulin levels in the pig.Endocrinology 82:369-376.
Machlin, L. J., Y. Takahashi, M. Horino, F. Hertelendy, R. S.Gordon and D. Kipnis, 1968. Regulation of growth hormonesecretion in non-primate species. In: Pecile, A. and E. E.Muller (eds. ), Growth Hormone. Excerpta Medica Foundation,Amsterdam, p. 292 -305,

96
Mach lin, L. J. 1972, Effect of porcine growth hormone on growthand carcass composition of the pig. J. Anim, Sci. 35:794-800.
Mach lin, L. J. 1973. Effect of growth hormone on milk productionand feed utilization in dairy cows. J. of Dairy Sci. 56:575-580.
Marlowe, T. J. 1960. A comparison of the growth hormone contentof the pituitary glands of dwarf and normal beef calves. J.Anim. Sci. 19:810-819.
Marple, D. N. and E. D. Aber le. 1972, Porcine plasma growthhormone levels: Radioimniunoas say technique and its applica-tion, J. Anim. Sci. 34:261-265,
Marple, D. N. , E. D. Aberle, J. C. Forrest, W. H. Blake andM. D. Judge, 1972, Effects of humidity and temperature onporcine plasma adrenal corticoids, ACTH and growth hormonelevels. J. Anim, Sci, 34:809-812,
Mason, I. L. 1951, Classification of West African Livestock.Commonwealth Agric. Bureau, Slough, England,
McAtee, J. W. and A. Trenkle. 1971. Effect of feeding, fasting andinfusion of energy substrates on plasma growth hormone levelsin cattle, J. Anim,, Sci. 33:612-616,
Metcalfe, J, and A. S. Hoversland. 1969. Biology of the Pygmy Goat,Portland, Oregon, University of Oregon Medical School, 108 p.
Meyer, V. and E. Knobil. 1967. Growth hormone secretion in theunanesthetized Rhesus monkey in response to noxious stimuli.Endocrinology 80:163-171.
Midgley, A. R. , Jr. , R. W. Rebar and G. D. Niswender. 1969.Radioimmunoas says employing double antibody techniques,Acta Endocrinology Supp. 142:247-256.
Mitra, R. , G. I. Christison and H. D. Johnson. 1972. Effect ofprolonged thermal exposure on growth hormone (GH) secretionin cattle. J. Anim. Sci, 34:776-779.
Muller, E. E. , A. Arimura, S. Sawano, T. Saito and A. V. Schally,1967. Growth hormone-releasing activity in the hypothalamusand plasma of rats subjected to stress. Proc. Soc. Exp. Biol.Med. 125:874-878.

97
Nalbandov, A. V. 1963. Symposium on growth: Endocrine causes ofgrowth and growth statis, Jo Anim. Sci, 22:558-560o
Niswender, G. D. , A. R. Midgley, Jr. , S. E. Monroe and L. E.Reichert, Jr. 1968. Radioimmunoassay for rat luteinizinghormone with anti-bovine LH (luteinizing hormone) serum andovine LH-I 1310 Proc. Soc. Exp. Biol. Med. 128:807-811.
Pahnish, O. F. , E, B, Stanley and C. E. Safley. 1952. A study ofhomozygous dwarfism in beef cattle. Western Sec. Proc. Am.Soc. Anim, Prod. 3:Sec. 1X:1-5.
Parker, M. L, and W. Ho Daughaday, 1968. Growth retardation:Correlation of plasma GH responses to insulin and arginine withsubsequent metabolic and skeletal responses to GH treatment.In: Pecile, A. and E. E. Muller (eds. ), Growth Hormone.Excerpta Medica Foundation, Amsterdam. p. 398-407.
Parker, M. L. , R. D. Utiger and W. H, Daughaday. 1962, Studies onhuman growth. II. The physiological disposition and metabolicfate of human growth hormone in man, J. Clin. Invest. 41:262 -268.
Peake, G. T. , I. K. Mariz and W. H. Da.ughaday. 1968. Radioimmuno-assay of growth hormone in rats bearing somatotropin producingtumors. Endocrinology 83 :714 -720,
Powell, G. F. , J. A. Brasel and R. M. Blizzard. 1967. Emotionaldeprivation and growth retardation simulating idiopathic hypo-pituitarism. New Engl. Jo Med. 276:1271-1278,
Purchas, R. W. 1970. Some relationships of growth hormone levelsto bovine growth and carcass quality. Doctoral Dissertation,East Lansing, Michigan State University.
Purchas, R. W., K. L. Macmillan and H. D. Hafs, 1970. Pituitaryand plasma growth hormone levels in bulls from birth to oneyear of age. J. Anim. Sci. 31:358-363.
Raben, M. S. 1962, Growth hormone: 2. Clinical use of humangrowth hormone. New Engl. J. Med. 266:82-86,
Rimoin, D. Lo , To Jo Merimee, D. Rabinowitz, L. L. Cavalli-Sforzaand V. A. McKusick, 1968a. Genetic aspects of isolated growthhormone deficiency. In: Pecile, A. and E. E. Muller (eds. ),

98
Growth Hormone, Excerpta Medica Foundation, Amsterdam,p. 418-432.
Rimoin, D, L, T, J. Merimee, D. Rabinowitz and V, A, McKusick,1968b. Genetic aspects of clinical endocrinology. Recent Prog,Hormone Research 24:365-438.
Roth, J. , S. M. Glick, R. S. Yalow and S. A. Berson, 1963a,Hypoglycemia: A potent stimulus to secretion of growthhormone. Science 140:987-988.
Roth, J. , S. M. Glick, R. S. Yalow and S. A. Berson, 1963b, Secre-tion of human growth hormone: Physiologic and experimentalmodification. Metab, 12:577-579,
Roth, J. , P. Gordon and R. W. Bates. 1968, Studies of growthhormone and prolactin in acromegaly. In: Pecile, A. andE. E. Muller (eds. ), Growth Hormone, Excerpta MedicaFoundation, Amsterdam, p. 124-128.
Russell, J. A. 1957, Effects of growth hormone on protein andcarbohydrate metabolism, Amer. J. Clin, Nutr, 5:404-416,
Ryan, R. J. , De W. Swanson, C. Faiman, W, E, Mayberry andA. J. Spandoni, 1970 Effects of convulsive electroshock onserum concentrations of follicle stimulating hormone, lutein-izing hormone, thyroid stimulating hormone and growth hor-mone in man. J. Clin, Endocr. 30:51-58.
Schalch, D. S. and S. Reichlin, 1966, Plasma GH concentration inthe rat determined by radioimmunoassay: Influence of sex,pregnancy, lactation, anesthesia, hypophysectomy and extra-cellular pituitary transplants. Endocrinology 79 :275 -280.
Schalch, D. S. and S. Reichlin, 1968. Stress and growth hormonerelease, In: Pecile, A. and E. E. Muller (eds. ), GrowthHormone, Excerpta Medica Foundation, Amsterdam. p. 211-225,
Schindler, W. J. , M, 0, Hutchins and E. J. Septimus, 1972, Growthhormone secretion and control in the mouse. Endocrinology91 :483 -490,
Seagloff, A. , E. L. Komrad, A. Flores, A. Seagloff and M. Hardesty,1955, The growth hormone content of human plasma.Endocrinology 57:527-530.

99
*Siers, D. G. and L. N. Hazel. 1970. Serum growth hormone levelsin swine, Growth 34:419-430,
Siers, Do G. and L.A. Swiger, 1971. Influence of live weight, ageand sex on circulating growth hormone levels in swine. J.Anim. Sci, 32:1229-1232.
Smith, P. E. and E. C. Mac Dowell. 1930. An hereditary anterior-pituitary deficiency in the mouse, Anat. Record 46:249-257,
Smith, P. E. and E. C. MacDowell, 1931, The differential effect ofhereditary mouse dwarfism on the anterior pituitary hormones.Anat. Record 50:85 -93,
Sollas, I. B. J. 1914, Note on the offspring of a dwarf-bearing strainof guinea pigs. Genetics 3:201-204,
Staffe, A, 1938. Die Haustiere der Kosi, 3, Ziege, Z. F. Zuchtung,Reiche B. 40:301-309,
Stern, J. S. , C, A. Vaile and J. Mayer. 1971. Growth hormone,insulin and glucose in suckling, weanling and mature ruminants.J. Dairy Sci, 54:10521-1059.
Struempler, A. W. and W. Burroughs. 1959. ,Stilbestrol feeding andgrowth hormone stimulation in immature ruminants. J, Anim,Sci, 18:427-436.
Takahashi, K., W. H. Daughaday and D. Kipnis, 1971. Regulation ofimmunoreactive growth hormone secretion in male rats.Endocrinology 88 :909 -917.
Topel, D. G. , G. M. Weiss, D. G. Siers and J. H. Magilton, 1973.Comparison of blood source and diurnal variation of bloodhydrocortisone, growth hormone, lactate, glucose and electro-lytes in swine. J. Anim, Sci. 36:531-534.
Trenkle, A. 1970a, Plasma levels of growth hormone, insulin andplasma protein-bound iodine in finishing cattle, J. Anim. Sci.31:389-393,
Trenkle, A. 1970b. Effect of starvation on pituitary and plasmagrowth hormone in rats, Proc. Soc, Exp, Biol, Med. 135:77-80,

100
Trenkle, A. 1970c. Solid-phase radioimmunoassay for sheep growthhormone. Proc. Soc. Exp. Biol. Med. 133:1018-1022.
Trenkle, A. 1971a. Effect of diet upon levels of plasma growthhormone in sheep. J. Anim. Sci. 32:111-114.
Trenkle, A. 1971b. Influence of blood glucose levels on growthhormone secretion in sheep. Proc. Soc. Exp. Biol. Med.136:51 -55.
Trenkle, A. 1971c. Growth hormone secretion rates in cattle.J. Anim, Sci. 32:115-118.
Trenkle, A. and R. Irwin. 1970. Correlation of plasma hormonelevels with growth and carcass characteristics of cattle,Growth 34:313-319.
Turman, E. J. and F. N. Andrews. 1955. Some effects of purifiedanterior pituitary growth hormone on swine, J. Anim, Sci.14:7-18.
Turner, C. D. and J. T. Bagnara. 1971. General Endocrinology.Philadelphia, Saunders.
Wallace, A. L. C. and J. B. Bassett. 1970. Plasma growth hormoneconcentrations in sheep measured by radioirnmunoassay.J. Endocr, 47:21-36.
Weiss, G. M. , D. G. Topel, D. G. Siers and J. H. Magi Iton. 1970.Relationship of plasma cortisol and growth hormone levels tomuscle quality characteristics in normal and stress proneswine. J. Anim, Sci. 31:1018. (Abstr. )
Yalow R. S. and S. A. Berson. 1968. General principles of radio-immunoassay. In: R. L. Hayes, F. A. Goswitz and B. E. P.Murphy (eds. ), Radioisotopes in Medicine: In Vitro Studies.U. S. Atomic Energy Commission, p. 7-39.
Yousef, M. K. , Y. Takahashi, W. D. Robertson, L. J. Machlin andH. D. Johnson. 1969. Estimation of growth hormone secretionrate in cattle, J. Anim, Sci. 29:341-344.
Yousef, M. K. and H. D. Johnson. 1966. Calorigenesis of cattle asinfluenced by growth hormone and environmental temperature.J. Anim, Sci, 25:1076-1082.

APPENDIX

101
Appendix Table A. Analysis of variance of serum GH levels in pygmyand normal males from 1 to 6 months of age.
Source df MS
Between Animals (15)Genetic group 1 2. 70 0. 08Animal/Genetic group 14 35. 33
Within Animals (80)Age /Normals 5 48. 46 2. 27
Linear regression 1 183. 90 8. 61***Residual 4 14. 60 0. 68
Age /Pygmy 5 87. 77 4. 11***Linear regression 1 320.79 15.01 * **Residual 4 29. 52 1. 38
Error 21. 37
P < . 005
Appendix Table B. Analysis of variance of serum GH levels in pygmymale and female goats from 1 through 6 monthsof age,
Source df MS
Between Animals ( 2Q)Sex 1 522, 35 32. 94 * **Animals /Sex 19 15. 86
Within Animals (105)Age /Males 5 87. 77 6. 90***
Linear regression 1 320. 79 25,20 * **Residual 4 29. 52 2. 32
Age /Female 5 1. 89 0. 15Linear regression 1 8. 86 0. 70Residual 4 0. 15 0.01
Error 95 12, 73
P < . 005

102
Appendix Table C. Analysis of variance of circulating GH levels in F2male and F2 female goats from 1 to 6 months ofage.
Source df MS
Between AnimalsSex
( 29)1 177.67 11. 21***
Animals /Sex 28 15. 84
Within Animals (150)Age /Males 5 53. 47 5. 59***
Linear regression 1 129. 20 13. 50***Res idual 4 34. 54 3, 61**
Age/Females 5 18. 46 1. 93Linear regression 1 35, 61 3, 72aRes idual 4 14. 18 1.48
Error 140 9. 57
P < , 01***
P < . 005a ,P 06


![Round schedule Notices issued by Ofcom under … · Airspan [REDACTED] EE [REDACTED] H3G [REDACTED] Telefonica [REDACTED] Vodafone [REDACTED] Bidder Eligibility events available (start](https://static.fdocuments.in/doc/165x107/5ba4d8c509d3f257608be093/round-schedule-notices-issued-by-ofcom-under-airspan-redacted-ee-redacted.jpg)


![Round results Notices issued by Ofcom under Wireless ... · Airspan [REDACTED] 34 34 EE [REDACTED] 16 16 H3G [REDACTED] 46 46 Telefonica [REDACTED] 37 37 Vodafone [REDACTED] 40 40](https://static.fdocuments.in/doc/165x107/5ba4d8c509d3f257608be079/round-results-notices-issued-by-ofcom-under-wireless-airspan-redacted.jpg)


![From: [REDACTED] Sent: 05 July 2013 11:04 To: [REDACTED ...€¦ · From: [REDACTED] Sent: 05 July 2013 11:04 . To: [REDACTED] Cc: [REDACTED] Subject: FW: Ekwendeni Hospital Aids](https://static.fdocuments.in/doc/165x107/601c89910d63e778dd12db97/from-redacted-sent-05-july-2013-1104-to-redacted-from-redacted-sent.jpg)