Growth Failure of Resource-rich Economies - SMU
34
1 Growth Failure of Resource-rich Economies: Role of Government Activities 1 Minoo Farhadi, Md. Rabiul Islam and Solmaz Moslehi Monash University 22 October 2013 Abstract Considering various channels through which government activities can affect economic performance is essential in resource-rich economies. Governments typically receive revenues from natural resources in these economies and are often characterized by large interference in private sector, weak law enforcement, high inefficiency and low level of political freedom. To find the relationship between resource rent, government quality and economic growth, this study provides an empirical investigation by applying system GMM technique in a panel of 99 countries for the period 1970-2010. This paper considers five dimensions of government quality including government intervention in market, government efficiency, provision of public good, size of public sector and political rights to examine, in a unified specification, how the impact of natural resources on productivity growth depends on the quality of government in the economy. Interaction effects between resource rents and five different channels suggest that negative effect of resource rents on growth is lower in countries with better quality of government. Key words: O13, O40, O57 JEL classifications: natural resources, government quality, productivity growth 1 We would like to thank Pedro Gomis Porqueras , Paul Raschky and Sisira Jayasuriya for their comments
Transcript of Growth Failure of Resource-rich Economies - SMU

1
Growth Failure of Resource-rich Economies:
Role of Government Activities 1
Minoo Farhadi, Md. Rabiul Islam and Solmaz Moslehi
Monash University
22 October 2013
Abstract
Considering various channels through which government activities can affect economic performance is
essential in resource-rich economies. Governments typically receive revenues from natural resources in these
economies and are often characterized by large interference in private sector, weak law enforcement, high
inefficiency and low level of political freedom. To find the relationship between resource rent, government
quality and economic growth, this study provides an empirical investigation by applying system GMM
technique in a panel of 99 countries for the period 1970-2010. This paper considers five dimensions of
government quality including government intervention in market, government efficiency, provision of public
good, size of public sector and political rights to examine, in a unified specification, how the impact of natural
resources on productivity growth depends on the quality of government in the economy. Interaction effects
between resource rents and five different channels suggest that negative effect of resource rents on growth is
lower in countries with better quality of government.
Key words: O13, O40, O57
JEL classifications: natural resources, government quality, productivity growth
1 We would like to thank Pedro Gomis Porqueras , Paul Raschky and Sisira Jayasuriya for their comments

2
1. Introduction
The idea that the abundance of natural resource in many countries is more detrimental rather than
beneficial has attracted some attention in the recent literature. Since the pioneering contribution of
Sachs and Warner (1995), many studies attempt to shed light on the widely accepted paradox, called
“natural resource curse”, that highlights the fact that on average resource-rich countries experience
less economic growth and worse development outcomes compared to non-resource-rich countries2.
There are different explanations on how natural resource abundance leads to reduction in growth rate
through various transmission mechanisms 3. Among them, the low quality of institution is identified
as one of the critical aspects that explain the growth failure of resource-rich economies4.
The purpose of this paper is to explore the role that institutions, specifically those in the
public sector or government, play in the growth process of the countries with natural resources. In
other words, it is of interest in this paper to study how different types of government activity affect
growth of these countries. Moreover, how much of resource-curse depends on quality or
performance of a government. And finally, this paper examines whether a good government reduces
the negative effect of natural resource on economic growth.
To address the above questions, first it is crucial to specify what defines a “good-
government”. So far, there is no standard definition of “good government” and this concept has been
interpreted in various terms5. A “good-government” can work to improve economic growth, decrease
inequality, secure individuals’ rights, maximize social welfare in the society, promote individuals’
happiness and etc. This paper considers a narrow interpretation of a “good-government” by looking
at the role of government in promoting economic growth.
Next, it is crucial to specify how to quantify government activities. Empirical studies that look
at the impact of government on economic growth mostly just consider government spending (or
consumption) and/or taxation as a proxy for government activities6. Although government size is a
good proxy of government activities in developed countries, it cannot inform us about how well a
government is functioning in the developing countries. This is especially so in the resource-rich
2 See Frankel (2010) for comprehensive survey of literature review on natural resource curse.
3 See Van der Ploeg (2011) who discusses different channels that we might observe “resource curse".
4 See Mehlum et al. (2006) and Boschini et al (2007).
5 Among various interpretations, the World Bank (1994) defines a good-government as the “manner in which power is
exercised in the management of a country’s economic and social resources”, while based on United Nations
Development Programme (1996) the primary duty of a good government in a society should be reduction in poverty by
providing effective and accountable public services, and promotes the rule of law. 6 See Bergh and Henrekson (2011) and Romp and De Haan (2007) who review the extensive literature on government
size and economic growth. Also another strand of literature goes one step beyond and disaggregates government
spending into different components (productive vs. non-productive expenditure), e.g. Bleaney et al.(2001).

3
economies because public sectors in these economies receive revenues from natural resources and
hence are financially capable of intervening in different markets through regulations. A high degree
of government intervention can affect economic activities in several ways such as influencing
relative prices, regulating factors and goods’ markets, producing different commercial goods and
services through state-owned enterprises. Moreover, in a resource-rich economy a government
dampens economic performance by being inefficient, ineffective and authoritarian.
Thus, to comprehensively study the role of government activity in promoting growth in
economies with natural resource, it is essential to take into account not only the government size but
also other aspects of government activities. In order to do, we follow the classification introduced in
the seminal work of La porta, Lopez-de-Silanes, Shleifer and Vishny (1999) where five dimensions
of good government, including interference with the private sector, efficiency, output of public
goods, size of public sector and political freedom are introduced.
This paper makes the following contributions to the empirical literature. First, this paper takes
the aforementioned classification of the quality of government introduced by La porta et al. (1999)
and tests the relationship between different aspects of government activities and economic growth in
a unified specification. Some of these aspects previously have been neglected in the growth literature
on the curse of natural resource. Among five dimensions, government efficiency (Brueckner , 2010;
Kolstad and Søreide, 2009) and political freedom (Collier and Hoeffler, 2009; and Al-Ubaydli, 2012)
receive more attention in the natural resource literature. Furthermore, studies that investigate the
relationship between interference of government in the private sector and growth in resource-rich
economies only look at the role of government to promote growth by protecting property rights and
enforcing contracts (see among others, Mehlum et al., (2006). To the best of our knowledge, the
links between growth and other types of government interventions in market activities (e.g.
government regulation of business, credit, money and labour market) have not received much
attention in the literature. Little research, if any, have considered the link between government size
and growth in economies with natural resources (see Atkinson and Hamilton, 2003). Few, if any,
studies have paid attention to the link between growth and provision of infrastructure in these
economies
Second, this paper takes into account the interaction effect between different aspects of quality
of government and natural resource rents. More specifically, we test the hypothesis that resource
rent, alone, cannot be a proper determinant of economic growth. Other aspects of government
activities may temper how the rents from natural resources affect growth. In order to test our main
hypothesis we consider the interaction effect between resource rents and five aspects of quality of
government. This interaction term has been taken into account in other studies that look at institution

4
and growth, among others see Boschini and et al. (2007). However, few studies look at different
aspects of government activities (e.g. Bulte and Damania, 2008; Collier and Hoeffler, 2009;
Brückner, 2010; and Bjorvatn et al, 2012 only consider one or two aspect(s) with interaction terms).
Third, this paper applies system GMM technique to estimate empirical models for a panel of 99
countries over the period 1970-20107. The interaction terms of natural resource rents with different
aspects of government quality have positive sign, which highlight that the negative effect of natural
resource on growth is less in countries with well-functioned and more efficient governments. These
results might be driven by a high quality of government in developed countries in the sample, some
of which are resource-rich (e.g. Australia and Norway)8. Hence, we restrict the sample to the panel of
63 developing countries over the period 1970-2010 and find empirical support for our results in the
smaller sample. Moreover, to assess the impact of different types of natural resource rents we
disaggregate the natural resource rents data into three groups: oil, oil and gas, and the combination of
oil, gas and mineral. The aim of using different subgroups is to further examine the individual impact
of each type of natural resource rent on the economic growth across sample countries.9
The rest of the paper is organized as follows. Section 2 presents various channels whereby
government activities affect economic performance and also the literature review associated with
that. Section 3 and 4 discuss the empirical framework, methodology and data respectively. Section 5
tests the link between alternative channels of government activities and TFP growth by using panel
regressions. Different aspects of government activities and different types of natural resources and
their interactions are considered for a sample of total countries (99 countries) and a sample of
developing countries (63 countries) in the period 1970-2010. Section 6 reports the robustness of
results with respect to inclusion of control variables, allowing for external instruments and
alternative measure of resource rents and TFP growth. Section 7 concludes.
2. Different Dimensions of Quality of Government and Economic Growth
La Porta et al. (1999) introduces five different aspects for quality of government: interference in
private sector, government efficiency, provision of public goods, government size and political
freedom. This section reviews the literature associated with each aspect and discusses how
7 Indeed, to examine the growth impact of various government activities in natural resource countries using a more
sophisticated econometric analysis that account for the presence of endogenous variables seems inevitable. 8 Because developed countries, mostly have a lower level of government intervention in market, higher level of law
enforcement, more efficient government and higher level of political right than developing countries. 9 According to Brunnschweiler (2008) various measures of resource rents can deliver different estimation results.

5
government performance can affect economic growth through each channel in economies with
natural resources.
2.1. Interference in Private Sector
Governments may intervene in market activities to correct market failures and to achieve social
efficiency and equity. A good government provides a productive environment for the operation of
market economy by introducing a secure property rights, enforcement of contracts, market oriented
policies, less restricted regulations and stable monetary regimes. But the over-regulations of
government (excessive application of rules and regulations) distort incentives, market activities and
competitions, which can have significant counterproductive outcomes. In resource-rich economies,
governments typically receive revenues from natural resources that allow them to implements
unproductive policies and excessive regulations. The scope of government interventions in economic
activities in these countries is substantial and includes various dimensions. In what follows we
briefly discuss the role of property rights and government regulations in business, credit and money
market, and state-owned enterprises, respectively.
Secure property rights and a good legal structure are recognized as important preconditions for
a successful economy. They provide incentives for individuals to undertake entrepreneurial activities
and enforce contract to reduce transaction costs. Furthermore, secure property rights are likely to
decrease distortion in the allocations of resources such that more resources are devoted to long-term
investments and savings rather than immediate consumption. Resource-abundance countries are
often characterized by a weak level of property rights and legal structure10
. For example, the average
of this index for resource-rich economies in our sample is 4.7 in 2000s which is less than the average
of all countries, 5.8, indicating that governments in these economies fail to provide secure property
rights and strong rule of law. We classify countries with an average ratio of total rents (oil, gas and
mineral) to GDP between 1970-2010 above 10 precent to be in the resource-rich group, as in
Mehlum, Moene and Torvik (2006). This is close to the mean of natural resource rents (8.5) for the
whole sample period between 1970 and 2010.
Government over-regulation increases transaction costs and distorts competition, which
decreases productivity and efficiency. The windfall income from natural resources allows
governments in resource-rich economies to intervene in various markets and private sectors’
activities. To protect certain producers and industries, a government in a resource-rich economy
10
Legal system and property right, as a proxy for institutions has received some attentions in the natural resource curse
literature. As an example, Mehlum, Moene and Torvik (2006) by using institution quality index, which includes rule of
law, show that improvement in rule of law reduces the negative effect of natural resources on growth.

6
imposes restrictions on markets, such as raising barriers to entry into some industries. It is more
costly (in terms of time and resources) for local and private businesses in resource-rich than
resource-poor economies to start and run operations since credits and licenses are more difficult to
obtained. On average, the procedures (number), time (days) and cost (% of income per capita)
involved in starting a new business in resource-rich economies, are 8.83, 35.7 and 51.5, respectively.
While the average number of procedures, number of days and cost for the sample of all countries, are
7.7, 24.73 and 26.8 respectively.11
Credit markets are highly regulated in resource-rich economies and governments are the main
owner of banks in the majority of these economies12
. Government over-regulations of credit markets
affect individuals’ borrowing and lending decisions and consequently limit entrepreneurial activities.
It is worth noting that monetary policies may also affect credit markets as monetary disturbances
and unexpected inflation change the value of money and thereby threaten entrepreneurial activities.
A high dependency on natural resources causes that monetary policies cannot be independent of
fiscal policies and therefore a monetary authority does not have the appropriate instruments to
control liquidity growth and inflation in a resource-rich country13
.
So far, we discussed how government regulations indirectly affect growth and production.
Government can also influence economic growth directly through the activities of state-owned
enterprises (SOEs). When there is a market failure SOEs have a legitimate role to play.
Nevertheless, on average, the performance and efficiency of state-owned firms are lower than their
private counterparts14
. A prevalent idea in resource-rich countries is that the natural resources are
national properties and thus SOEs are able to manage them in a more efficient way. However, some
empirical studies find that the production efficiency and profitability of national oil companies is
significantly lower than the private ones (Al-Obaidan and Scully, 1992; Victor, 2007 and Eller et al.
2011)15
. One of the reasons, as discussed by Wolf (2009), can be that SOEs in resource-rich
11
We calculate these averages from World Bank Doing Business dataset (2012). 12
Beck (2011) discusses the structure of financial system in economies that rely on natural resource exports and compare
them with other economies. 13
In resource-rich economies, monetary policy is subordinated to fiscal financing requirements through two separate
channels; first, a government uses pure seigniorage that is a central bank finances government deficit by increasing
inflation. Second, a government in a resource-rich economy finances government expenditure by the revenue from
natural resources, which is in terms of foreign-exchange and hence increases high-power money. See Da Costa and
Olivo (2008) who study how fiscal dominance weakens a monetary policy formulation and implementation in oil
exporting countries. 14
Shirley and Walsh (2000) investigate the relationship between ownership and economic performance by reviewing all
empirical studies during 1971-2000 across different nations. They found that out of 52 empirical studies, only 5 of them
show the preference of public ownership to the private one. 15
As an example, Eller and et al (2011) compare the efficiency of public and private oil companies and find that private
firms are more likely to cluster near the frontier while public ones are tend to be clustered far from the frontier.

7
economies are more likely to follow their political goals rather than solve issues related to market
failures.
The Economic Freedom Index, EFI, by Fraser Institute is recently used in the empirical
studies to quantify the degree of government intervenes in different types of market activities; see
survey by Berggren (2003). This index includes a number of separable dimensions.16
Despite the
attention devoted to examining the relationship between total EFI and growth (e.g. De Haan and
Sturm, 2000; Heckelman, 2000; Carlson and Lundström, 2002; Dawson, 2003; Justesen, 2008)17
, this
relationship in resource-rich economies has not received much attention in the literature. To fill this
gap, this paper looks at the impact of total Economic Freedom Index and its components on growth
in resource-rich economies.
2.2. Government Accountability and Efficiency
The association between resource rents and corruption, as a proxy for government efficiency, and
through corruption on economic growth has received a great deal of attention in the literature (Leite
and Weidmann, 1999; Sala-i-Martin and Subramanian, 2003; Isham et. al, 2004; and Kolstad and
Søreide, 2009)18
. As shown in Méon and Sekkat (2005), among others, the magnitude of the impact
of corruption on growth depends on the quality of government institutions. Good political institutions
promote an accountability of politicians (Robinson et al, 2006), while weak governance rises the
harmful impact of corruption on economic growth. Governments are less dependent on tax revenues
in resource-rich economies and therefore citizens have less incentive to monitor and control
government activities as they pay less tax. This consequently leads to less responsibility,
accountability and efficiency of governments. Devarjan et al (2010) find a negative relationship
between oil-dependency and the responsibility of government and show that a broad taxation can
improve the accountability of government while natural resource dependency lowers it. The lack of
state-citizen relationship decreases society’s expectation from a government in a resource-rich
economy and makes room for a government to abuse the public gain for its private goals (Ross,
1999).
16
Legal system and property rights, sound of money, freedom to trade internationally and regulation and government size
are five components of EFI; see subsection 4.2 for details. Following Gwartney, Lawson and Hall (2012, p.11) the
central components of economic freedom are “personal choice, voluntary exchange coordinated by markets, freedom to
enter and compete in markets, and protection of persons and property”. 17
Among them Carlsson and Lundström (2002 and Justesen (2008) further investigate the growth effects of various
components of the EFI. 18
Note that the final impact of corruption on rate of growth is still uncertain and ambiguous. Johnson et al (2011) explain
some reasons on why it is difficult to find empirical support for this relationship.

8
This weak accountability of government to citizen increases corruption in different forms like rent-
seeking activities19
.
2.3. Provision of the Public Goods
A government can enhance economic growth by providing public goods such as infrastructure,
which raises the social welfare by increasing in productivity and efficiency of market activities.
Infrastructure can be divided into two categories: social (soft) infrastructure and economic (hard)
infrastructure20
. Although considerable attention has been devoted to the growth impact of
infrastructure spending in developed economies, empirical studies of countries with natural resources
have mainly investigated the effect of “social infrastructures” (e.g. human capital) on economic
growth; not much attention has been devoted to investigate the role of “economic infrastructure”.
Comparing the average of infrastructure investment in rich and poor resource countries highlights
two important facts. First, there is a substantial gap between the amount being spent on infrastructure
in non-resource and resource-rich developing countries (see IMF report, 2012). Second, on average
the quality and efficiency of infrastructure is lower in resource-rich economies. Based on the Public
Investment Management Index (PIMI), natural resource countries have a significantly lower level of
PIMI scores compared to other countries since huge windfall revenues encourage investments in
non-productive rather than productive activities such an infrastructure and education (see Dabla-
Norris et al., 2011).
2.4. Government Size
Although many theoretical and empirical studies have examined the growth impact of government
size, but existing empirical literature cannot provide clear-cut evidence on the net effect of
government expenditure on the economic growth. While some scholars find a positive relation (e.g.
Easterly and Rebelo, 1993) others obtain a negative or not significant link (e.g. Landau, 1986; Evans
and Karras, 1994). In the case of natural resource economy, however, this nexus relation despite its
essential role has not received much attention, see Atkinson and Hamilton (2003).
19
In these types of activities individuals and groups tend to have more lobbies to benefit from resource rents. The
important point here is not the amount of rents they have used but the time, skill, talent and energy which they spend on
unproductive activities in order to obtain more shares of rents (Baland and Francois, 2000; Torvik, 2002).
20 Provision of electricity, water supply, telecommunications, roads, highways, railroads and airports can be called
“Economic infrastructure” while provision of health, education and promoting cultural standards of the population are
titled as “Social infrastructure” (Fourie, 2006).

9
It is worth noting that not only the contribution of public expenditure on economic growth is
important, but also the efficiency associated with these spending should be taken into account21
.
Arezki et al. (2011) argue that in resource-rich economies the problem is not low public investment
rather it is inefficiencies in government investments. The low efficiency of public investment may be
due to various shocks related to natural resource revenues, such as changes in price of recourses.
They provide some evidence that following commodity price booms in resource-rich economies
governments usually undertake undesirable and unproductive investment projects and hence prolong
the duration of existing inefficient policies. This implies the procyclical nature of fiscal policies in
these economy which hinders the economic growth by distorting the allocation of resources in non-
effective way (among other, see Landau, 1985, and Peden and Bradley, 1989).
2.5. Political Freedom
A number of scholars observe a negative impact of natural resource revenues on the level of
democracy and examine the hypothesis that democracy is more absent in countries with natural
resource revenues (Mahdavy, 1970; Ross, 2001). According to Ross (2001), there are three
mechanisms through which having oil reserves can lead to authoritarianism. First is a reinter effect in
which government tries to hinder democracy by imposing less tax and spending more in order to
reduce citizen demand for government accountability. Second is a repression effect where the
governments are more likely to pay attention to their internal security powers to be able to resist
external democratic forces. The last one is called a modernization effect where the democratic
changes, usually associated with economic growth, were absent from growth led by oil exports.
3. Empirical Framework
The proposed effects of resource rents and government performance on productivity growth are
tested using the following unbalanced panel regression model:
ittitititititiit XQGRRQGRRTFP 1,1,1,31,21,10ln (1)
where, ΔlnTFP is total factor productivity (TFP) growth measured by the first difference of the
logarithm of TFP; RR is the ratio of resource rent to GDP, where three alternative resource rent
measures are used, e.g. oil rent, oil and gas rent, and the sum of oil, gas and mineral rents as total
21
According to Grossman et al (1999), the inefficient provision of public goods and services negatively affect growth of
economies.

10
rent; QG indicates alternative proxies for government quality prescribed by La Porta et al. (1999),
viz., economic freedom (EF) for interventionism, corruption (COR) for public sector efficiency, per
capita stock of paved road (PRD) for public good provision, ratio of general government final
consumption expenditure to GDP (GCN) for government size, and political right (PR) for political
freedom; X stands for the vector of control variables including distance to technology frontier,
investment ratio, openness, urbanization and landlockedness; π is unobserved country specific fixed
effects, is time dummy, and εit is the random error term. The subscript ‘i’ denotes a particular
country, whereas, subscript ‘ t ’ indicates a particular time period. We first estimate our baseline
model and then include control variables to check the robustness of our estimated results. Since the
effects of resource rent and government performance on productivity growth are not likely to be
instantaneous, we use lagged value of explanatory variables to estimate current TFP growth. The
nature of the panel is unbalanced because data are not available for all the sample countries over the
entire sample periods.
The regression model in equation 1 is estimated using data over the period 1970-2010 for a
panel of 99 countries: 36 high income countries and 63 low and middle income developing countries.
The countries included in the sample are listed in the appendix Table A1. In order to filter out the
business cycle effects, TFP growth is measured in 5-year differences and the explanatory variables
are measured in 5-year lags22
.
4. Methodology and Data
4.1. Methodology
The empirical estimates of equation (1) are based on the system GMM estimator that has been
widely used to deal with unobserved heterogeneity and endogeneity biases in the estimation. In the
presence of heteroskedasticity the system GMM estimator is more efficient than the simple IV
estimator (Baum et al., 2003). Furthermore, Bond et al. (2001) show that the system GMM estimator
is the preferred approach for the estimation of empirical growth models due to its superior ability in
exploiting stationarity restrictions. The standard set up of a dynamic panel model takes the following
form:
ittitititiit Xyyy 1,1,1, )1( (2)
22 The sample includes as many countries as possible that have resource rent data spanning at least 20 years and for
which at least ten annual observations are available.

11
where, y is the logarithm of total factor productivity (TFP), yit – yi,t-1 is TFP growth, X is a set of
potentially endogenous explanatory variables which may include resource rent, government quality
and control variables, πi are time invariant country specific effects, t are time dummies, and εit is
white noise. This model can be re-parameterized as follows:
ittititiit Xyy 1,1, (3)
There is a clear simultaneity problem in model (3) as the lagged dependent variable (yi,t-1) is
correlated with the time-invariant country specific fixed effects (πi) and therefore, within group or
fixed effects estimators become inconsistent even if εit is not serially correlated. In order to eliminate
country level fixed effects, we can take the first difference of equation (3) to obtain:
itttitiit Xyy 1,1, (4)
where, Δ is the first difference operator. In order to deal with the endogeneity of the regressors and
the correlation between transformed lagged dependent variable (Δ yi,t-1) and transformed error term
(Δ εit) in equation (4), one should apply instrumental variable estimator.
The relationship between resource rent, government quality and growth are more likely to be
affected by endogeneity and reverse causality and therefore, difference generalized method of
moments (GMM) estimator could be used to mitigate those problems, where the endogenous
explanatory variables are instrumented with their suitable lags so that the instruments are not
correlated with the error term (Arellano and Bond, 1991). However, Arellano and Bover (1995) and
Blundell and Bond (1998) argue that the lagged level of the endogenous variables may be poor
instruments for the first differenced variables. They propose the popular system GMM estimator that
combines the regressions in differences and in levels in a system of equations using the lagged
differences instruments for the level series, and the lagged levels of instruments for the differenced
series.
In Monte Carlo simulations, Blundell and Bond (1998) observe that the system GMM
estimator produces efficiency gain when the number of time series observation is relatively small.
Furthermore, Beck et al. (2000) argue that a system GMM estimator is efficient in exploiting time
series variations of data, by accounting for unobserved country specific effects, and allowing for the
inclusion of the lagged dependent variables as regressors, thereby better controlling for the
endogeneity of the all explanatory variables. However, too many instruments relative to the number
of country-level observations may lead to the overfitting of the endogenous variables and weaken the
test for overidentifying restrictions (Roodman, 2009). In order to mitigate instrument proliferation,
we have used one or two lags of the explanatory variables as instruments and collapsed the
instruments through additions into smaller sets. We also report the number of instruments used in

12
our system GMM estimation. Furthermore, we have used Windmeijer (2005) finite-
sample correction for the variance of linear efficient two step system GMM estimator.
Arellano and Bover (1995) and Blundell and Bond (1998) suggest several specification tests
that must be satisfied while using system GMM estimators. The validity of the instruments can be
examined with the Hansen test of the over-identifying restrictions, and direct tests of serial
correlation in the residuals or error terms. The key identifying assumption in the Hansen test is that
the instruments used in the model are not correlated with the residuals. The AR(1) test checks the
first-order serial correlation between error and the level equation. The AR(2) test examines the
second-order serial correlation between error and the first-differenced equation. The null hypotheses
in the serial correlation tests are that the level regression shows no first order serial correlation, as
well as that the first-differenced regression exhibits no second-order serial correlation.
4.2. Data
The data used to estimate equation (1) are constructed as follows. TFP is recovered from the
aggregate production function, Y = AKαL
1-α, where, Y is the real GDP, K is the real physical capital
stock, and L is the total labour force. Therefore, TFP is measured by A = TFP = y/kα, where y is the
output-worker ratio (Y/L) and k is the capital-worker ratio (K/L). Capital’s income share α is set to
0.30 following Gollin (2002). K is constructed using the perpetual inventory method, Kit = Iit+ (1-δ)
Kit-1 where, I is the real investment, is the depreciation rate which is assumed to be 5% following
Bosworth and Collins (2003). The initial capital stock is estimated using the Solow model steady-
state value of I0/ (δ+g), where I0 is the initial real investment, and g is the growth rate in real
investment over the period 1970-2010. These data are obtained from the Penn World Table PWT 7.1.
The ratios of oil, natural gas and mineral rents to GDP are used as alternative proxies for
natural resource rents. Oil rents are the difference between the value of crude oil production at world
prices and total costs of production. Natural gas rents are the difference between the value of natural
gas production at world prices and total costs of production. Mineral rents are the difference between
the value of production for a stock of minerals at world prices and their total costs of production.
Minerals included in the calculation are tin, gold, lead, zinc, iron, copper, nickel, silver, bauxite, and
phosphate. The data are taken from the World Development Indicators and the estimates are based
on sources and methods described in World Bank (2011).
The economic Freedom Index from the Fraser Institute is used to measure government
intervention. This is an 11-point ordinal scale, ranging from 0 to 10, where a higher value indicates
greater economic freedom. This freedom index consists of five broad areas: size of government,

13
property rights and legal structure, sound money, international trade and trade policies and regulation
of business, labour and credit markets (Gwartney et al., 2012). The international Country Risk
Guide’s (ICRG) corruption index is used to measure public sector efficiency. The index ranges from
0 to 6 where higher value indicates less corruption. Public good provision is proxied by per capita
stock of paved road or bitumen-surfaced roads. Government size is measured by the ratio of general
government final consumption expenditure to GDP. Finally, Freedom House’s political rights index
is used as a proxy for political freedom. The index ranges from 1 to 7 where a higher value indicates
less political freedom. The complete definition of variables used in this study is reported in Appendix
Table A2.
Table 1: Descriptive Statistics (1970-2010)
TFPG RRO RROG RROGM EF COR PRD GCN PLR
Total sample (92 countries)
Mean 0.49 6.88 7.94 8.72 5.90 3.29 3.80 15.64 3.67
Std. Dev. 1.76 14.40 15.66 15.63 1.19 1.41 5.07 6.23 2.22
Minimum -14.42 0.00 0.00 0.00 2.30 0.00 0.01 3.14 1.00
Maximum 8.17 80.24 85.50 85.50 9.08 6.00 27.23 43.48 7.00
Observations 760 741 740 740 791 792 792 727 790
Developing Countries (63)
Mean 0.34 6.65 7.53 8.71 5.46 2.70 1.31 14.03 4.38
Std. Dev. 1.95 13.03 13.85 13.83 1.00 1.05 1.89 5.83 1.94
Minimum -14.42 0.00 0.00 0.00 2.30 0.00 0.05 3.14 1.00
Maximum 8.17 72.49 72.49 72.49 7.87 6.00 19.14 43.48 7.00
Observations 488 462 461 461 503 504 504 459 502 Notes: TFPG = total factor productivity (TFP) growth, RRO = the ratio of oil rent to GDP, RROG = the ratio of oil & gas rents to
GDP, RROGM = the ratio of oil, gas & mineral rents to GDP, EF = Fraser Institute’s economic freedom of the world summary index
(higher value means greater economic freedom), COR = International Country Risk Guide’s (ICRG) corruption index (higher value
indicates less corruption), PRD = per capita stock of paved road, GCN = ratio of general government final consumption expenditure to
GDP, and PLR = Freedom House’s political rights index (higher value implies less political freedom). Productivity growth,
government expenditure and rent variables are expressed in percentage. All the data are measured in five-year intervals. The growth
rates are annualized.
Table 1 presents the descriptive statistics for the variables used in this study. The upper panel
shows the summary statistics for the entire sample whereas the lower panel provides statistics for
only developing countries. As would be expected, the mean values of resource rent in developing
countries are similar to the world average; however, the mean values of alternative measures of
government quality are significantly lower than the world average. For example, the average stock of
per capita road for total sample is 3.80 kilometres, whereas for developing countries it is only around
1.31 kilometres per thousand populations.

14
Table 2: Correlation Matrix for Total Sample (1970-2010)
TFPG RRO RROG RROGM EF COR PRD GCN PLR
TFPG 1.00
RRO -0.10**
1.00
RROG -0.07**
0.97**
1.00
RROGM -0.09**
0.96**
0.98**
1.00
EF 0.18**
-0.11**
-0.08**
-0.11**
1.00
COR 0.10**
-0.23**
-0.24**
-0.26**
0.38**
1.00
PRD 0.07 -0.14**
-0.14**
-0.16**
0.41**
0.57**
1.00
GCN -0.07 0.06 0.05 0.05 0.06 0.34**
0.31**
1.00
PLR -0.11**
0.33**
0.33**
0.33**
-0.38**
-0.48**
-0.52**
-0.15**
1.00 Notes: ** indicates 5% level of significance. See also notes to Table 1.
Table 2 shows the pair-wise correlation matrix for the variables reported in this study. This
correlation matrix examines the pattern of relationships between the variables under consideration.
Productivity growth is found to be negatively and significantly (at 5% level) correlated with
alternative measures of resource rent, e.g. the share of oil or oil & gas or oil, gas & mineral rents in
GDP. These findings are consistent with the natural resource curse hypothesis implying that
countries with abundant natural resources experience lower rates of economic growth than countries
with few natural resources. Higher economic and political freedom and lower corruption are
correlated with higher economic growth. Infrastructure and government consumption expenditure do
not show any significant correlation with growth. Correlation analysis demonstrates that there is no
evidence of a high correlations (0.80 or above) between resource rent and government performance
variables and thus the empirical estimates are less likely to be affected by multicollinearity problem.
5. Empirical Results
The aforementioned facts, discussed in details in Section 2, highlight that economies with natural
resources are often characterized by a large intervention in market activities through regulations,
weak law enforcement, inefficient public sector and a low level of political right. This means that to
study the impact of natural resources on economic growth we should take into account not only the
effect of the overall size of government budget relative to GDP, but also other aspects of government
activities. This section reports the results for five different channels through which governments
affect economic growth. The main hypothesis emphasizes on the growth impact of the interaction
term between natural resource rents and five different aspects of quality of government. We use three
different measures of natural resource rents: oil, gas and mineral rents. This shows us whether
different types of natural resource rents have different impacts on economic growth. We also
consider two samples: a panel of 99 countries includes all countries that has available data; a panel of
63 countries that just includes low and middle income countries. This lets us to study whether the

15
sign of interaction term between natural resource rents and quality of government changes in a
smaller sample.
5.1. Interference in Private Sector (Channel-1)
Table 3 reports the estimation results of equation (1) for total and developing sample countries using
three alternative resource rent measures, e.g. oil rent, oil & gas rents, and oil, gas and mineral rents
as total rent. Specifically, it examines the effects of natural resources and government intervention on
productivity growth. The coefficients of resource rent appear to be significantly negative in the
regressions for both samples. The negative effects of resource rent on TFP growth is consistent with
the ‘resource curse’ hypothesis implying that countries with abundant oil, mineral or other natural
resources tend to grow more slowly than resource poor countries (Sachs and Warner, 1995, 2001;
Auty, 2001; Kaldor et al., 2007; Frankel, 2012).
A higher score of the economic freedom index represents a lower government intervention.
Economic freedom is found to have consistent positive though weakly significant effects on growth,
indicating that the lower the government intervention the higher is the productivity growth. The
results are consistent with the findings of Cole (2003), Powell (2002) and Gwartney (2009) who
argue that higher economic freedom provides better protection of private property and lower
government interference. Therefore countries with greater economic freedom have higher economic
growth compared to their counterparts with less economic freedom.
The interaction between resource rent and economic freedom are found to be very important
for growth for all the countries as well as developing countries. This interaction effect estimates how
the effect of natural resources on productivity growth depends on the government intervention in the
economy. The estimated coefficients of the interaction between resource rent and economic freedom
are positive and statistically significant; suggesting that resource-rich economies with less
government interference may experience significantly higher productivity growth23
.
The primary advantage of the economic freedom index is that it provides a concise and summary
measure of government restrictions on free-market activity; however, the index is not without critics
(Garrett and Rhine, 2011).
23 It should be noted that although there is too much government interference in resource-abundance economies, but on
average governments in these countries adopt market-oriented reforms less than other countries. Amin and Djankov
(2009) find robust empirical evidence for the negative relationship between natural resource abundance and market-
oriented reforms. Less implementation of market-oriented reforms in resource-rich economies is mainly due to the fact
that governments have windfall income from natural resources. Moreover, as discussed by Acemoglu and Robinson
(2006) the implementation of market-oriented reform depends on the possibility of political replacement of incumbent
government. In most of resource-rich economies the probability that the incumbent government is replaced is low.

16
One criticism is that the index is less precise in measuring economic freedom than many of
the component variables used to create the index, thus generating bias in empirical models (Hanson,
2003). Economic freedom is a multi-dimensional phenomenon and therefore, different areas of
economic freedom may have different impacts on economic growth (Carlsson and Lundström, 2002
and Justesen, 2008).
Table 3: Economic Freedom, Resource Rent and TFP Growth
(Channel-1: Government Intervention)
Total Sample (99 countries) Developing Sample (63 countries)
Oil Rent Oil &
Gas Rent
Oil, Gas &
Mineral Rents
Oil Rent Oil &
Gas Rent
Oil, Gas &
Mineral Rents
RRi, t-1 -1.64* -1.31
* -1.95
** -0.76
* -0.60 -1.26
**
(-1.88) (-1.74) (-2.42) (-1.78) (-1.46) (-2.22)
EFi, t-1 0.04 0.05* 0.03 0.04
* 0.05
** 0.03
(1.53) (1.67) (1.12) (1.86) (2.15) (1.47)
EFi, t-1×RRi, t-1 0.33**
0.27**
0.36***
0.14* 0.12 0.24
**
(2.38) (2.37) (2.96) (1.76) (1.61) (2.38)
Observations 721 720 720 457 456 456
Hansen-test (p-val) 0.83 0.91 0.72 0.84 0.87 0.84
AR(2)-test (p-val) 0.43 0.44 0.34 0.48 0.52 0.64
Notes: Dependent variable is total factor productivity (TFP) growth in every five year interval from 1970-2010. ‘RRi,t-1’ indicates 5-
year lagged ratio of resource rent to GDP. ‘EFi,t-1’ indicates 5-year lagged economic freedom of the world summary index that ranges
from 0-10 where 0 corresponds to ‘less economic freedom’ and 10 to ‘more economic freedom’. All explanatory variables are treated
as potentially endogenous in system GMM estimator. The number of instruments used in the system GMM estimation is 16. The
instrument count is based on the number of ‘collapsed’ instruments, using the xrabond2 specification from Roodman (2009). All
regressions employ orthogonal deviations. Coefficients are based on the two-step system GMM estimation, using the Windmeijer
correction. The Hansen test checks the validity of the instruments where the null hypothesis is that the instruments are not correlated
with the residuals. The null hypothesis of the AR(2) test is that the error terms in the 1st-differenced regression exhibit no 2nd order
serial correlation. All regressions satisfy the F-test for the joint significance of the coefficients and the AR(1) test for 1st order serial
correlation but the results are not reported here to conserve space. Log level of initial total factor productivity, a constant term,
country, and time dummies are included but not reported for brevity. 2nd lag of the explanatory variables are taken as instruments for
the differenced equation whereas 1st differences of the explanatory variables are taken as instruments for the level equation. The
numbers in parentheses are t-statistics and are based on robust standard errors. *, ** and *** denote 10%, 5% and 1% significance
levels, respectively. See also notes to Table 3.
According to Gwartney et al. (2012) economic freedom consists of five broad areas: size of
government, property rights and legal structure, sound money, international trade and trade policies
and regulation of business, labour and credit markets. A single freedom measure may not reflect the
complex economic environment and a highly aggregated index makes it difficult to draw policy
conclusions (Carlsson and Lundström, 2002). Therefore, to mitigate empirical bias and to formulate
appropriate policy, one should estimate regression models using freedom index for each area in
addition to the overall index. A disadvantage with decomposing a summary index is the potential
problem with multicollinearity between the variables constructing the index (Carlsson And
Lundström, 2002). Table A3 to A7 report estimated effects of resource rent and individual
component of economic freedom index on economic growth. Estimated results demonstrate that
natural resources could increase productivity growth in countries with greater freedom in legal

17
system & property rights, international trade and minimal regulation. These results are in the line of
the findings of Justesen (2008) who observes that less regulation of business, labour and credit
markets promotes growth and therefore, less regulation may reduce the negative impact of natural
resource on growth. However, the size of government and access to sound money do not have any
significant effects on growth. In other words, not all components of economic freedom affect growth
equally (Compton et al., 2011). On average, higher economic freedom improves economic growth in
resource-rich countries.
5.2. Government Efficiency (Channel 2)
Resource-rich countries have a tendency to be corrupt because resource windfall encourages their
governments to engage in non-productive activities such as rent seeking (Collier and Hoeffler, 2009;
Bhattacharyya and Holder, 2010; Bruckner, 2010; Arezki and Bruckner, 2011; Haber and Menaldo,
2011). Turning to the impact of public sector efficiency in the context of resource abundance, the
positive and significant coefficients of the interaction between resource rent and corruption in Table
4 indicates that on average, resource-rich economies with relatively low levels of corruption have
experienced higher productivity growth. This result is consistent with the findings of Mehlum et al.
(2006) who argue that the negative impact of natural resource abundance can be reduced or avoided
in the presence of good rule of law institutions that mitigate corruption.
Table 4: Corruption, Resource Rent and TFP Growth
(Channel-2: Public Sector Efficiency)
Total Sample (99 countries) Developing Sample (63 countries)
Oil Rent Oil &
Gas Rent
Oil, Gas &
Mineral Rents
Oil Rent Oil &
Gas Rent
Oil, Gas &
Mineral Rents
RRi, t-1 -1.30**
-1.88**
-1.80**
-0.52* -0.54
* -0.84
*
(-2.29) (-2.23) (-2.46) (-1.93) (-1.79) (-1.98)
CORi, t-1 -0.05 -0.08 -0.08 0.01 0.01 0.02
(-1.16) (-1.27) (-1.31) (0.15) (0.08) (0.75)
CORi, t-1×RRi, t-1 0.32**
0.33**
0.30**
0.42**
0.43* 0.67
**
(2.05) (2.06) (2.11) (2.13) (1.98) (2.26)
Observations 722 721 721 458 457 457
Hansen-test (p-val) 0.19 0.27 0.43 0.75 0.78 0.23
AR(2)-test (p-val) 0.66 0.80 0.96 0.31 0.33 0.21 Notes: ‘CORi,t-1’ indicates 5-year lagged International Country Risk Guide’s (ICRG) corruption index that ranges from 0 to
6 where 0 corresponds to ‘more corruption’ and 6 to ‘less corruption’. See also notes to Table 3.
5.3. Provision of the Public Goods (Channel-3)
Cross-country empirical estimates indicate that the contribution of infrastructure services to
economic growth is indeed substantial and in general exceed the cost of providing these services

18
(Canning and pedroni., 1994; Esfahani and Ramirez, 2003). We explore whether the provision of
hard infrastructure helps alleviate the resource curse by interacting public infrastructure and resource
rents. The positive and significant coefficients of the interaction between public infrastructure and
resource rents in Table 5 indicates that higher per capita stock of paved road makes a greater
contribution to productivity growth in natural resource countries.
Table 5: Infrastructure, Resource Rent and TFP Growth
(Channel-3: Public Good Provision)
Total Sample (99 countries) Developing Sample (63 countries)
Oil Rent Oil &
Gas Rent
Oil, Gas &
Mineral Rents
Oil Rent Oil &
Gas Rent
Oil, Gas &
Mineral Rents
RRi, t-1 -0.29**
-0.21**
-0.21* -0.32
** -0.28
** -0.26
**
(-2.40) (-2.01) (-1.98) (-2.51) (-2.36) (-2.53)
lnPRDi, t-1 -0.02 -0.02 -0.02 0.01 0.01 0.01
(-1.04) (-1.19) (-1.37) (0.14) (0.07) (0.02)
lnPRDi, t-1×RRi, t-1 0.19**
0.19***
0.20***
0.29* 0.26
** 0.26
**
(2.27) (2.67) (2.79) (2.00) (2.18) (2.00)
Observations 722 721 721 458 457 457
Hansen-test (p-val) 0.40 0.52 0.37 0.84 0.88 0.59
AR(2)-test (p-val) 0.95 0.94 0.91 0.39 0.43 0.48 Notes: ‘PRDi,t-1’ indicates 5-year lagged per capita stock of paved road or bitumen-surfaced roads that exclude stone,
gravel, water-bound gravel, oil-bound gravel and earth roads. ‘ln’ indicates natural logarithm. See also notes to Table 3.
5.4. Government Size (Channel-4)
Government size may have an adverse impact on economic growth and therefore, countries with big
government can use economic openness and sound economic policies to mitigate negative effects of
big government (Bergh and Karlsson, 2010). Romero-Avila and Strauch (2008) find a negative
relationship between growth and both public consumption and total government revenue.
Government consumption has a significant and negative effect on growth productivity in both
samples when total rents from oil, gas and mineral are considered. Turning to the impact of
government consumption in the context of resource abundance, the positive and significant
coefficients of the interaction between resource rent and government consumption in Table 6
indicate that resource-rich economies spending less for government consumption enjoy higher
productivity growth than their counterparts with higher consumption in government sector. This
result is consistent with Atkinson and Hamilton (2003) who argue that resource abundant countries
with higher government consumption, on average, experience lower economic growth.

19
Table 6: Government Consumption, Resource Rent and TFP Growth
(Channel-4: Government Size)
Total Sample (99 countries) Developing Sample (63 countries)
Oil Rent Oil &
Gas Rent
Oil, Gas &
Mineral Rents
Oil Rent Oil &
Gas Rent
Oil, Gas &
Mineral Rents
RRi, t-1 -2.86**
-2.61**
-2.85**
-3.14**
-3.29***
-3.23**
(-2.32) (-2.31) (-2.43) (-2.53) (-2.66) (-2.19)
lnGCNi, t-1 -0.19 -0.18 -0.21* -0.14 -0.14 -0.18
*
(-1.65) (-1.50) (-1.69) (-1.44) (-1.36) (-1.70)
lnGCNi, t-1×RRi, t-1 1.10**
1.00**
1.08**
1.16**
1.23**
1.20**
(2.54) (2.46) (2.58) (2.36) (2.51) (2.06)
Observations 709 708 708 450 449 449
Hansen-test (p-val) 0.43 0.51 0.34 0.29 0.21 0.15
AR(2)-test (p-val) 0.52 0.57 0.53 0.81 0.87 0.84 Notes: ‘GCNi,t-1’ indicates 5-year lagged ratio of general government final consumption expenditure to GDP. See also notes
to Table 3.
5.5. Political Freedom (Channel-5)
Weak political institutions help divert production factors away from constructive uses to destructive
rent-seeking activities in the natural resource sector that reduce welfare in the economy (Trovik
2002; Olsson, 2007). The negative coefficient on political rights implies that an increase in political
freedom (lower value of political right index) has a positive and significant effect on productivity
growth in both samples and for different measures of resource rents.
Table 7: Political Rights, Resource Rent and TFP Growth
(Channel-5: Political Freedom)
Total Sample (99 countries) Developing Sample (63 countries)
Oil Rent Oil &
Gas Rent
Oil, Gas &
Mineral Rents
Oil Rent Oil &
Gas Rent
Oil, Gas &
Mineral Rents
RRi, t-1 -2.36***
-1.82**
-1.66* -0.81
** -0.78
* -1.19
*
(-3.51) (-2.23) (-1.88) (-2.53) (-1.97) (-1.93)
PLRi, t-1 -0.05***
-0.06***
-0.06***
-0.02* -0.02
** -0.08
**
(-2.63) (-2.82) (-2.91) (-1.91) (-2.11) (-2.42)
PLRi, t-1×RRi, t-1 0.53***
0.45***
0.42**
0.15***
0.15**
0.27**
(3.41) (2.80) (2.50) (2.83) (2.28) (2.09)
Observations 721 720 720 457 456 456
Hansen-test (p-val) 0.25 0.41 0.39 0.50 0.59 0.76
AR(2)-test (p-val) 0.20 0.32 0.50 0.72 0.75 0.47 Notes: ‘PLRi,t-1’ indicates 5-year lagged political rights index that ranges from 1 to 7 where 1 corresponds to ‘more political
freedom’ and 7 to ‘less political freedom’. See also notes to Table 3.
The positive and significant coefficients of the interaction between resource rent and political rights
in Table 7 indicate that resource-rich economies having greater political rights experience higher
productivity growth. This result is consistent with the findings of Al-Ubaydli (2012) who argues that

20
natural resources have an adverse impact on economic performance of authoritarian regimes but this
is not the case for democratic countries.
5.6. Marginal Effects of Resources on Growth
So far, the effects of natural resource and government intervention on productivity growth for five
different channels have been examined, but the estimated magnitudes reported in above tables are
not comparable. In order to examine the impact of total resource rent (oil, gas and mineral rents) on
different levels of government institutions, we have calculated the marginal effects of a standard
deviation change of total resource rent at different institutional levels of the government. The
estimated coefficients from Tables 3-7 for both samples of total 99 countries and 63 developing
countries is used to calculate the marginal effects following the below specification:
1,1,31 )ˆˆ( titiit stdRRQGTFPGrowth
(5)
where, QG is the different level of government institutional quality, and stdRR is a standard
deviation change in the total resource rent.
Table 8: Marginal Effects of Resources on Growth
(Total resources for different levels of government quality) Government
Institution
Channel-1 (Economic
Freedom)
Channel-2
(Corruption) Channel-3
(Public Good) Channel-4
(Govt. Size) Channel-5
(Political Freedom)
Total-99 Dev-63 Total-99 Dev-63 Total-99 Dev-63 Total-99 Dev-63 Total-99 Dev-63
Worst -0.175 -0.098 -0.281 -0.116 -0.169 -0.141 0.191 0.179 0.200 0.097
Average 0.027 0.007 -0.127 0.134 -0.019 -0.046 0.006 -0.021 -0.018 -0.001
Av.+ 1 std. 0.094 0.040 -0.061 0.231 0.025 -0.009 0.073 0.044 0.127 0.071
Best 0.206 0.087 0.001 0.440 0.070 0.070 -0.252 -0.257 -0.194 -0.127 Notes: Av. + 1 std. indicate average plus one standard deviation government institutions. As per definition of the institutional
variables, the highest (lowest) value is considered as the best (worst) government institution for Channel 1, 2 & 3, whereas, the lowest
(highest) value is considered as the best (worst) government institution for Channel 4 & 5. Since the measurement scale of the
government institutions in channel 4 & 5 is reverse (the lowest score indicates the highest quality of institutions), the positive
(negative) coefficients in the last four columns indicate negative (positive) resource effects on growth.
Table 8 reports the growth impact from a one standard deviation increase in total resource rent,
evaluated at four different levels of the quality of government institutions ranging from the worst to
the best quality. For example, using the fourth column’s (oil, gas and mineral rents for total sample)
coefficients in Table 3 and the mean level of economic freedom (5.904) gives: (-1.95+0.36 × 5.904)
× 0.156 = 0.027 as shown in the 3rd
row (average) of the 1st column of channel-1 in Table 8. The
interpretation is that, other things remain unchanged; a country with average level of economic
freedom would increase its annual growth rate by 0.027 per cent if it were to increase its oil, gas and
mineral rents by one standard deviation. Similarly, reading the Table 8 top-down, the calculations in
the 1st column of channel 2 for total sample suggest that a one standard deviation increase in total

21
resource rent is consistently negative but less so as public efficiency improves (i.e. corruption
decreases) and becomes positive at the highest level of efficiency (i.e. lowest level of corruption).
For other 3 channels of government institutions (Channels 3-5) the pattern remains very similar in
both total and developing countries; the effects of total resource rent becomes more positive as
governmental institutional quality improves. These results are consistent with the findings of
Boschini et al. (2007) who argue that the effects of natural resources on economic development
improve with institutional quality.
6. Robustness Tests
A series of sensitivity checks are undertaken in this section to ensure the robustness of the results
reported in the previous section we include additional control variables, allow for external
instruments, and use an alternative measure of resource rent and TFP. The estimated results are not
reported here to conserve space but they are provided in the Appendix. Since our results are not
sensitive to the way resource rent is measured, it is computed as the ratio of total resource rent (oil,
gas and mineral rents) to GDP. Unless otherwise stated, the estimates are based on a system GMM
estimator and the variables are measured in 5-year intervals.
6.1. Inclusion of Control Variables
As discussed above, productivity growth is likely to be influenced by factors other than resource rent
and government quality. Therefore, as a robustness check this study will consider several control
variables, such as share of investment in GDP, openness, urbanization and landlockedness. The ratio
of investment to GDP is included in the regression as it is found by Levine and Renelt (1992) to be
the most robust determinant of growth among a large set of growth variables. The investment ratio
can influence growth through the production function or through productivity externalities. Trade
openness has often been stressed as being an important factor for development and growth, where
trade openness is defined as import penetration and foreign direct invest among other factors
(Radelet et al., 2001). Urbanization promotes agglomeration externalities such as localized
information and knowledge spillovers, thereby promoting economic growth (Gallup et al., 1999;
Allen, 2003). Landlocked countries have lack of access to the sea and hence they are relatively
poorer than the coastal countries (Gallup et al., 1999).
[Table A8 Here]

22
The estimated results reported in Table A8 are fairly consistent with the results reported in Table 3-7.
On average, resource-rich economies can experience higher economic growth only with higher
government quality. Considering the control variables the coefficients of investment and
urbanization are found to be positive and significant. Again, the positive but statistically insignificant
coefficient of openness is not particular to resource rich economies. Almost all empirical attempts to
find a significant, positive relationship between economy-wide productivity and trade openness have
failed (see for an overview, Madsen, 2009). The coefficient of landlockedness has expected negative
sign, but its impact on growth appears to be insignificant. The results are consistent in both the
samples of total and developing countries. The coefficients of control variables are not reported to
conserve space; however, the results will be available on request.
6.2. Allowing for External Instruments
The relationship between resource rent, government quality, and productivity growth is likely to be
affected by endogeneity and reverse causality. Higher expected growth may facilitate more
investment in government sector. Although system GMM estimator may capture unobserved
heterogeneity and possible endogeneity in the model, there could still be endogeneity as well as
omitted variable bias and thus a robustness check is warranted.
System GMM estimator is primarily designed for internal instruments (lagged differences
and lagged levels of the explanatory variables), but it does allow external instruments to deal with
the endogeneity problem (Roodman, 2009). La Porta et al. (1999) provide a number of exogenous
determinants of government performance, such as, legal origin, latitude, ethno-linguistic
fractionalization, and religion which are used as external instrument in this study. Table A9 reports
the results after considering both internal and external instruments for natural resource and
government performance. The results are qualitatively similar to those obtained in Table 3-7. Overall
the empirical findings support that natural resources improve productivity growth in countries with
better quality of government.
[Table A9 Here]
6.4. Allowing for Alternative Measures of Resource Rent
As discussed by Brunnschweiler (2008), different measures of resource rents can deliver
different estimation results. Hence, it is important to check the robustness of results with alternative
measures of resource rents. Resource rent has thus far been measured as the ratio of oil, oil and gas,

23
or oil, gas and mineral rents to GDP. We also run the regressions using per capita resource rent as
explanatory variables. Total per capita rent has negative and significant effect on growth, except in
one channel in the total sample, and interaction terms between different aspects of quality of
government and resource rents are positive and statistically significant. The regression results
reported in Table A10 are largely in line with those obtained in Table 3-7 implying that better
government quality enhances productivity growth in resource-rich economies.
[Table A10 Here]
6.5. Alternative Measure of TFP
To check the robustness of the results to measurement of TFP, output per worker is used as proxy for
TFP since Y/ (KαL
1-α) and labour productivity is growing at the same rate along the balanced growth
path. The principal results, which are reported in Table A11, are similar to the results reported in
table 3-7. The coefficients of the interaction between resource rent and government performance are
consistently significantly positive suggesting that on average resource-rich economies with relatively
better government performance have experienced higher economic growth.
[Table A11 Here]
7. Conclusion
This paper contributes to the natural resource-curse literature by paying careful attention to different
aspects of government activity and testing the relationship between each of them and economic
growth in a unified specification for the panel of 99 countries over the period 1970-2010. Previous
literature that studies the link between government and economic growth, mainly look at the effects
of government expenditure or taxation on growth. Some other studies, particularly within the natural
resource-curse literature, also look at the other aspects such as efficiency of government (e.g.
corruption) and political freedom (e.g. democracy). There is a lack of research on the effect of other
government activities (such as government intervention in the market, government interference with
private sector and public good provision) on economic growth. This paper fills this gap in the
literature.
The main findings of this study are in line with the emerging consensus in the resource curse
and economic growth literature: the quality of the institution determines how natural resources affect
economic growth. We find that different measures of natural resource rents such as, oil, oil and gas,
and oil, gas and mineral, have negative and significant effect on productivity growth in both samples
of total 99 countries and 63 developing countries. The interaction effects between natural resource

24
rents and different aspects of government quality are positive, which implies that a good government
reduces the negative effect of natural resource rent on growth. Hence, resource-rich countries that
have experienced a ‘curse’ appear to be those countries that may have low quality of government
such as large intervention in market activities, an inefficient public sector, a high level of
government size, a low level of public goods provision or a low level of political freedom. To be
more precise about the intervention in market activities, the results of this paper further suggest that
resource-rich economies can enjoy higher productivity growth by having lower interference in
private sector through regulations, better law enforcement and greater freedom in legal system and
international trade. Finally, the marginal effects of a standard deviation change at different levels of
government quality are calculated for five different channels of quality of government. Results show
that the impact of natural resources on economic growth improves as quality of government
improves.
The policy advice of the findings of paper is clear. Economic and/or political reforms that
improve any aspects of quality of government in a resource-rich economy reduce the likelihood that
the resource curse occurs. Of course, this is not an easy task as empirical studies suggest that there is
a negative relationship between natural resource abundance and the implementation of market-
oriented and political reforms; see Amin and Djankov (2009) and Acemoglu and Robinson (2006).
This consideration is left for future research.

25
References:
Acemoglu, D. and J. A. Robinson (2006). "Economic backwardness in political perspective." American Political Science
Review 100(1): 115-131.
Al-Obaidan, A. M. and G. W. Scully (1992). "Efficiency differences between private and state-owned enterprises in the
international petroleum industry." Applied Economics 24(2): 237-246.
Al-Ubaydli, O. (2012). "Natural resources and the tradeoff between authoritarianism and development." Journal of
Economic Behavior & Organization 81(1): 137-152.
Amin, M. and S. Djankov (2009). Natural resources and reforms. mimeograph.
Arellano, M. and O. Bover (1995). "Another look at the instrumental variable estimation of error-components models."
Journal of Econometrics 68(1): 29-51.
Arellano, M. and S. Bond (1991). "Some tests of specification for panel data: Monte Carlo evidence and an application to
employment equations." The Review of Economic Studies 58(2): 277-297.
Arezki, R. and M. Brückner (2011). "Oil rents, corruption, and state stability: Evidence from panel data regressions."
European Economic Review 55(7): 955-963.
Arezki, R., T. Gylfason, and Sy, A. N. (2011). Beyond the Curse: Policies to Harness the Power of Natural Resources.
International Monetary Fund, Washington, DC.
Atkinson, G. and K. Hamilton (2003). "Savings, growth and the resource curse hypothesis." World Development 31(11):
1793-1807.
Auty, R. M. (2001). Resource Abundance and Economic Development. Oxford University Press.
Baland, J.-M. and P. Francois (2000). "Rent-seeking and resource booms." Journal of Development Economics 61(2):
527-542.
Beck, T. (2011). Finance and Oil: Is there a resource curse in financial development? European Banking Center
Discussion Paper, No. 2011-004.
Beck, T., R. Levine, and Loayza, N. (2000). "Finance and the Sources of Growth." Journal of Financial Economics 58(1):
261-300.
Berggren, N. (2003). "The benefits of economic freedom: a survey." Independent Review 8(2): 193-212.
Bergh, A. and M. Henrekson (2011). "Government size and growth: A survey and interpretation of the evidence."
Journal of Economic Surveys 25(5): 872-897.
Bergh, A. and M. Karlsson (2010). "Government size and growth: Accounting for economic freedom and globalization."
Public Choice 142(1-2): 195-213.
Bhattacharyya, S. and R. Hodler (2010). "Natural resources, democracy and corruption." European Economic Review
54(4): 608-621.
Bjorvatn, K., M. R. Farzanegan, and Schneider, F. (2012). "Resource curse and power balance: Evidence from oil-rich
countries." World Development 40(7): 1308-1316.
Bleaney, M., N. Gemmell, and Kneller, R. (2001). "Testing the endogenous growth model: public expenditure, taxation,
and growth over the long run." Canadian Journal of Economics/Revue canadienne d'économique 34(1): 36-57.
Blundell, R. and S. Bond (1998). "Initial conditions and moment restrictions in dynamic panel data models." Journal of
Econometrics 87(1): 115-143.
26
Bond, S. R., A. Hoeffler, and Temple, J. (2001). GMM Estimation of Empirical Growth Models. Working Paper.
Boschini, A. D., J. Pettersson, and Roine, J. (2007). "Resource curse or not: A question of appropriability." The
Scandinavian Journal of Economics 109(3): 593-617.
Bosworth, B. and S. M. Collins (2003). "The empirics of growth: An update." Brookings Papers on Economic Activity
2003(2): 113-206.
Brueckner, M. (2010). "Natural resource dependence, non-tradables, and economic growth." Journal of Comparative
Economics 38(4): 461-471.
Brunnschweiler, C. N. (2008). "Cursing the blessings? Natural resource abundance, institutions, and economic growth."
World Development 36(3): 399-419.
Bulte, E. and R. Damania (2008). "Resources for sale: corruption, democracy and the natural resource curse." The BE
Journal of Economic Analysis & Policy 8(1).
Canning, D. (1999). Infrastructure's Contribution to Aggregate Output. World Bank Publications, No.2246.
Canning, D. and P. Pedroni (1999). "Infrastructure and long run economic growth." Consulting Assistance on Economic
ReformDiscussion Paper, No.57.
Carlsson, F. and S. Lundström (2002). "Economic freedom and growth: Decomposing the effects." Public Choice 112(3-
4): 335-344.
Cole, J. H. (2003). "Contribution of Economic Freedom to World Economic Growth, 1980-99." Cato J. 23: 189.
Collier, P. and A. Hoeffler (2009). "Testing the neocon agenda: democracy in resource-rich societies." European
Economic Review 53(3): 293-308.
Compton, R. A., D. C. Giedeman, and Hoover, G. A. (2011). "Panel evidence on economic freedom and growth in the
United States." European Journal of Political Economy 27(3): 423-435.
Da Costa, M. and V. Olivo (2008). Constraints on the Design and Implementation of Monetary Policy in Oil Economies:
The Case of Venezuela. IMF Working Papers, No. 1-47.
Da Cunha Leite, C., & Weidmann, J. (2001). Does mother nature corrupt? Natural resources, corruption, and economic
growth. Natural Resources, Corruption, and Economic Growth (June 1999). IMF Working Paper, No. 99/85.
Dabla-Norris, E., J. Brumby, Kyobe, A., Mills, Z., and Papageorgiou, C. (2012). "Investing in public investment: an
index of public investment efficiency." Journal of Economic Growth 17(3): 235-266.
Dawson, J. W. (2003). "Causality in the freedom–growth relationship." European Journal of Political Economy 19(3):
479-495.
De Haan, J. and J. E. Sturm (2000). "On the relationship between economic freedom and economic growth." European
Journal of Political Economy 16(2): 215-241.
Easterly, W. and S. Rebelo (1993). "Fiscal policy and economic growth." Journal of Monetary Economics 32(3): 417-
458.
Eller, S. L., P. R. Hartley, and Medlock III, K. B. (2011). "Empirical evidence on the operational efficiency of National
Oil Companies." Empirical Economics 40(3): 623-643.
Esfahani, H. S. and . a. T. Ram rez (200 ). "Institutions, infrastructure, and economic growth." Journal of
Development Economics 70(2): 443-477.
Evans, P. and G. Karras (1994). "Is government capital productive? Evidence from a panel of seven countries." Journal
of Macroeconomics 16(2): 271-279.

27
Fourie, J. (2006). "Economic infrastructure: a review of definitions, theory and empirics." South African Journal of
Economics 74(3): 530-556.
Frankel, J. A. (2010). The natural resource curse: a survey. NBER Working Paper, No. 15836.
Gallup, J. L., J. D. Sachs, and Mellinger, A. D (1999). "Geography and economic development." International Regional
Science Review 22(2): 179-232.
Garrett, T. A. and R. Rhine (2010). "Economic freedom and employment growth in US states." Federal Reserve Bank of
St. Louis Working Paper,93(1):1-18.
Gollin, D. (2002). "Getting income shares right." Journal of Political Economy 110(2): 458-474.
Grossman, P. J., P. Mavros, and Wassmer, R. W. (1999). "Public sector technical inefficiency in large US cities." Journal
of Urban Economics 46(2): 278-299.
Gwartney, J. (2009). "2008 presidential address: institutions, economic freedom, and cross-country differences in
performance." Southern Economic Journal 75(4): 937-956.
Gwartney, J., R. Lawson, et al. (2012). Economic Freedom of the World 2012 Annual Report. Vancouver, British
Columbia: Fraser Institute.
Haber, S. and V. Menaldo (2011). "Do natural resources fuel authoritarianism? A reappraisal of the resource curse."
American Political Science Review 105(1): 1-26.
Hanson, J. R. (2003). "Proxies in the new political economy: Caveat emptor." Economic Inquiry 41(4): 639-646.
Heckelman, J. C. (2000). "Economic freedom and economic growth: a short-run causal investigation." Journal of Applied
Economics 3(1): 71-91.
Isham, J., M. Woolcock, Pritchett, L., and Busby, G. (2005). "The varieties of resource experience: natural resource
export structures and the political economy of economic growth." The World Bank Economic Review 19(2): 141-174.
Johnson, N. D., C. L. LaFountain, and Yamarik, S. (2011). "Corruption is bad for growth (even in the United States)."
Public Choice 147(3-4): 377-393.
Justesen, M. K. (2008). "The effect of economic freedom on growth revisited: New evidence on causality from a panel of
countries 1970–1999." European Journal of Political Economy 24(3): 642-660.
Kolstad, I. and T. Søreide (2009). "Corruption in natural resource management: Implications for policy makers."
Resources policy 34(4): 214-226.
La Porta, R., F. Lopez-de-Silanes, Shleifer, A., and Vishny, R. (1999). "The quality of government." Journal of Law,
Economics, and Organization 15(1): 222-279.
Landau, D. (1986). "Government and economic growth in the less developed countries: an empirical study for 1960-
1980." Economic Development and Cultural Change 35(1): 35-75.
Landau, D. L. (1985). "Government expenditure and economic growth in the developed countries: 1952–76." Public
Choice 47(3): 459-477.
Levine, R. and D. Renelt (1992). "A sensitivity analysis of cross-country growth regressions." The American Economic
Review: 942-963.
Levine, R. and D. Renelt (1992). "A sensitivity analysis of cross-country growth regressions." The American Economic
Review: 942-963.
Madsen, J. B. (2009). "Trade barriers, openness, and economic growth." Southern Economic Journal 76(2): 397-418.

28
Mahdavy, H. (1970). "The patterns and problems of economic development in rentier states: The case of Iran." 1970:
428-467.
Mehlum, H., K. Moene, and Torvik, R. (2006). "Institutions and the Resource Curse." The Economic Journal 116(508):
1-20.
Olsson, O. (2007). "Conflict diamonds." Journal of Development Economics 82(2): 267-286.
Peden, E. A. and M. D. Bradley (1989). "Government size, productivity, and economic growth: The post-war
experience." Public Choice 61(3): 229-245.
Powell, B. (2002). "Economic freedom and growth: the case of the Celtic tiger." Cato Journal. 22: 431
Robinson, J. A., R. Torvik, and Verdier, T. (2006). "Political foundations of the resource curse." Journal of Development
Economics 79(2): 447-468.
Romero-Avila, D. and R. Strauch (2008). "Public finances and long-term growth in Europe: Evidence from a panel data
analysis." European Journal of Political Economy 24(1): 172-191.
Romp, W. and J. De Haan (2007). "Public capital and economic growth: A critical survey." Perspektiven der
Wirtschaftspolitik 8(S1): 6-52.
Roodman, D. (2009). "How to do xtabond2: An introduction to difference and system GMM in Stata." Stata Journal 9(1):
86-136.
Ross, M. L. (2001). "Does oil hinder democracy?" World politics 53(3): 325-361.
Sachs, J. D. and A. M. Warner (1995). Natural resource abundance and economic growth. NBER Working Paper, No.
5398.
Sachs, J. D. and A. M. Warner (2001). "The curse of natural resources." European Economic Review 45(4): 827-838.
Sala-i-Martin, X. and A. Subramanian (2003). Addressing the natural resource curse: An illustration from Nigeria, NBER
Working Paper, No. 9804.
Shirley, M. and P. Walsh (2001). Public vs. private ownership: the current state of the debate. World Bank Policy
Research Working Paper, No.2420.
Torvik, R. (2002). "Natural resources, rent seeking and welfare." Journal of Development Economics 67(2): 455-470.
United Nations Development Programme. (1996). Human Development Report 1996. Oxford University Press: Oxford
and New York .
Van der Ploeg, F. (2011). "Natural resources: Curse or blessing?" Journal of Economic Literature 49(2): 366-420.
Victor, N. (2007). "On measuring the performance of national oil companies (NOCs)." Program on Energy and
Sustainable Development: 1-41.
Windmeijer, F. (2005). "A finite sample correction for the variance of linear efficient two-step GMM estimators."
Journal of Econometrics 126(1): 25-51.
Wolf, C. (2009). "Does ownership matter? The performance and efficiency of State Oil vs. Private Oil (1987–2006)."
Energy Policy 37(7): 2642-2652.
World Bank (1994). Governance: The World Bank Experience. Washington, DC
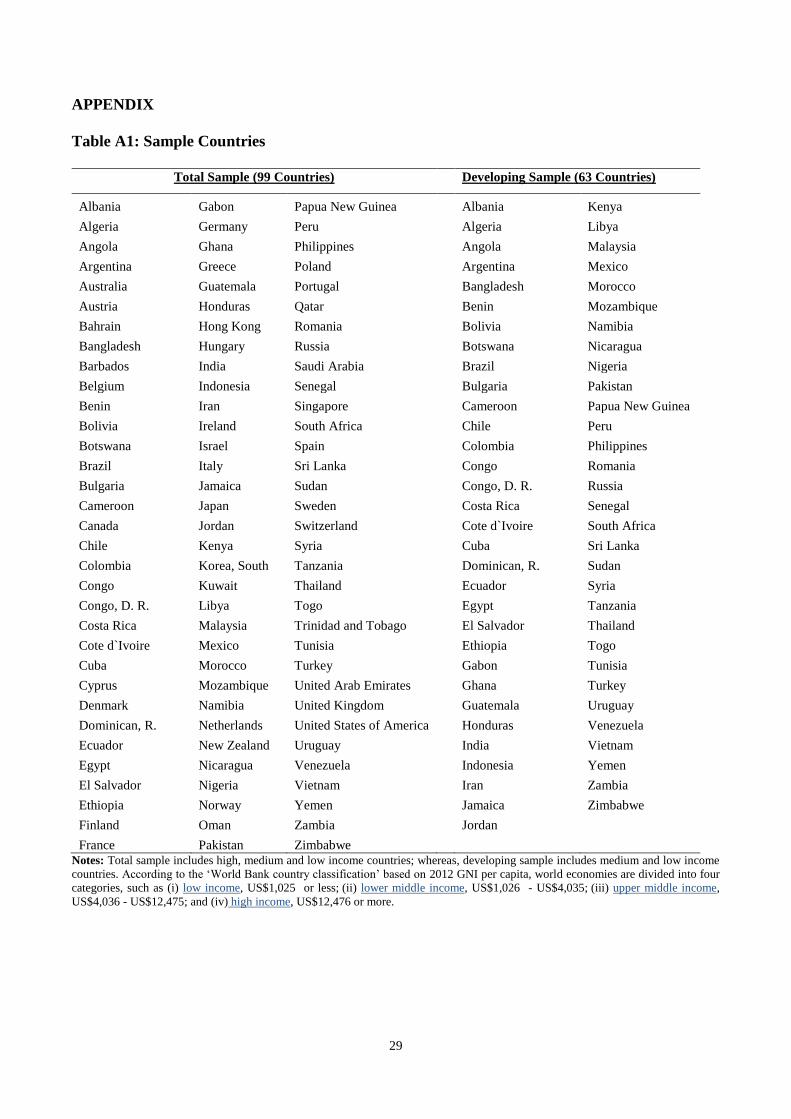
29
APPENDIX
Table A1: Sample Countries
Total Sample (99 Countries)
Developing Sample (63 Countries)
Albania Gabon Papua New Guinea Albania Kenya
Algeria Germany Peru Algeria Libya
Angola Ghana Philippines Angola Malaysia
Argentina Greece Poland Argentina Mexico
Australia Guatemala Portugal Bangladesh Morocco
Austria Honduras Qatar Benin Mozambique
Bahrain Hong Kong Romania Bolivia Namibia
Bangladesh Hungary Russia Botswana Nicaragua
Barbados India Saudi Arabia Brazil Nigeria
Belgium Indonesia Senegal Bulgaria Pakistan
Benin Iran Singapore Cameroon Papua New Guinea
Bolivia Ireland South Africa Chile Peru
Botswana Israel Spain Colombia Philippines
Brazil Italy Sri Lanka Congo Romania
Bulgaria Jamaica Sudan Congo, D. R. Russia
Cameroon Japan Sweden Costa Rica Senegal
Canada Jordan Switzerland Cote d`Ivoire South Africa
Chile Kenya Syria Cuba Sri Lanka
Colombia Korea, South Tanzania Dominican, R. Sudan
Congo Kuwait Thailand Ecuador Syria
Congo, D. R. Libya Togo Egypt Tanzania
Costa Rica Malaysia Trinidad and Tobago El Salvador Thailand
Cote d`Ivoire Mexico Tunisia Ethiopia Togo
Cuba Morocco Turkey Gabon Tunisia
Cyprus Mozambique United Arab Emirates Ghana Turkey
Denmark Namibia United Kingdom Guatemala Uruguay
Dominican, R. Netherlands United States of America Honduras Venezuela
Ecuador New Zealand Uruguay India Vietnam
Egypt Nicaragua Venezuela Indonesia Yemen
El Salvador Nigeria Vietnam Iran Zambia
Ethiopia Norway Yemen Jamaica Zimbabwe
Finland Oman Zambia Jordan
France Pakistan Zimbabwe Notes: Total sample includes high, medium and low income countries; whereas, developing sample includes medium and low income
countries. According to the ‘World Bank country classification’ based on 2012 GNI per capita, world economies are divided into four
categories, such as (i) low income, US$1,025 or less; (ii) lower middle income, US$1,026 - US$4,035; (iii) upper middle income,
US$4,036 - US$12,475; and (iv) high income, US$12,476 or more.

30
Table A2: Data Appendix
ΔlnTFP : ‘TFP growth rate’ over the sample period 1970-2010 has been calculated using data from the 7.1 version of
the Penn World Table (see http://pwt.econ.upenn.edu/php_site/pwt_index.php).
RR: ‘the ratio of resource rent to GDP’, where three alternative resource rent measures are used, e.g. oil rent (RRO), oil
and gas rent (RROG), and the sum of oil, gas and mineral rents as total rent (RROGM). The data are collected from 2012
World Development Indicators online database (see
http://databank.worldbank.org/ddp/home.do?Step=12&id=4&CNO=2).
QG: Five alternative channels of ‘quality of government’ proposed by La Porta et al. (1999) are used: (a) Channel-1 :
interventionism is proxied by Fraser Institute’s economic freedom of the world summary index (EF) that ranges from 0-
10 where 0 corresponds to ‘less economic freedom’ and 10 to ‘more economic freedom’, compiled from Fraser Institute
database (see http://www.freetheworld.com/). EF has five different components: (i) Government size index (GS) that
ranges from 0-10 where 0 corresponds to ‘large general government consumption’, ‘large transfer sector’, ‘many
government enterprises’, and ‘high marginal tax rates and low income thresholds’, and 10 to ‘small general government
consumption’, ‘small transfer sector’, ‘few government enterprises’, and ‘low marginal tax rates and high income
thresholds’, (ii) Legal structure and security of property rights index (LEG) that ranges from 0-10 where 0 corresponds to
‘no judicial independence’, ‘no trusted legal framework exists’, ‘no protection of intellectual property’, ‘military
interference in rule of law’, and ‘no integrity of the legal system’ and 10 corresponds to ‘high judicial independence’,
‘trusted legal framework exists’, ‘protection of intellectual property’, ‘no military interference in rule of law’, and
‘integrity of the legal system’, (iii) Access to sound money index (SM) that ranges from 0-10 where 0 corresponds to
‘high annual money growth’, ‘high variation in the annual rate of inflation’, ‘high inflation rate’, and ‘restricted foreign
currency bank accounts’ and 10 corresponds to ‘low annual money growth’, ‘low or no variation in the annual rate of
inflation’, ‘low inflation rate’, and ‘foreign currency bank accounts are permissible without restrictions’, (iv) Freedom to
trade internationally index (INT) that ranges from 0-10 where 0 corresponds to ‘increasing tax rate on international
trade’, ‘slow import or export process’, ‘small trade sectors relative to the population and geographic size’, ‘exchange
rate controls are present and a black-market exists’, and ‘restrictions on the freedom of citizens to engage in capital
market exchange with foreigners’ and 10 corresponds to ‘no specific taxes on international trade’, ‘swift import or export
process’, ‘large trade sectors relative to the population and geographic size’, ‘no black-market exchange rate’, and ‘no
restrictions on the freedom of citizens to engage in capital market exchange with foreigners’, and (v) Regulation of
credit, labour and business index (REG) that ranges from 0-10 where 0 corresponds to ‘low percentage of deposits held
in privately owned banks’, ‘high foreign bank license denial rate’, ‘private sector’s share of credit is close to the base-
year-minimum’, ‘deposit and lending rates is fixed by the government and real rates is persistently negative’, ‘high
impact of minimum wage’, ‘widespread use of price controls throughout various sectors of the economy’, and ‘starting a
new business is generally complicated’ and 10 corresponds to ‘high percentage of deposits held in privately owned
banks’, ‘low foreign bank license denial rate’, ‘private sector’s share of credit is close to the base-year-maximum’,
‘interest rates is determined primarily by market forces and the real rates is positive’, ‘low impact of minimum wage’,
‘no price controls or marketing boards’, and ‘starting a new business is generally easy’; (b) Channel-2: public sector
efficiency is proxied by International Country Risk Guide’s (ICRG) corruption index (COR) that ranges from 0 to 6
where 0 corresponds to ‘more corruption’ and 6 to ‘less corruption’, compiled from the political risk service (PRS) group
(see http://www.prsgroup.com/icrg.aspx). Although it considers financial corruption in the form of demands for special
payments and bribes connected with import and export licenses, exchange controls, tax assessments, police protection, or
loans, this corruption index is more concerned with actual or potential corruption in the form of excessive patronage,
nepotism, job reservations, 'favor-for-favors', secret party funding, and suspiciously close ties between politics and
business, (c) Channel-3: public good provision is proxied by per capita stock of paved road (PRD) or bitumen-surfaced
roads that exclude stone, gravel, water-bound gravel, oil-bound gravel and earth roads, collected from infrastructure
database of Harvard University (see http://www.hsph.harvard.edu/david-canning/data-sets/); (d) Channel-4: government
size is proxied by the ratio of general government final consumption expenditure to GDP (GCN), collected from 2012
World Development Indicators online database (see
http://databank.worldbank.org/ddp/home.do?Step=12&id=4&CNO=2); (d) Channel-5: political freedom is proxied by
Freedom House’s political rights index (PLR) that ranges from 1 to 7 where 1 corresponds to ‘more political freedom’
and 7 to ‘less political freedom, extracted from Freedom House database (see http://www.freedomhouse.org/).

31
Table A3: Government Size, Resource Rent and TFP Growth
(Channel-1: Government Intervention)
Total Sample (99 countries) Developing Sample (63 countries)
Oil Rent Oil &
Gas Rent
Oil, Gas &
Mineral Rents
Oil Rent Oil &
Gas Rent
Oil, Gas &
Mineral Rents
RRi, t-1 -0.78 -0.86* -1.13
** -0.23 -0.22 -0.48
(-1.45) (-1.81) (-2.02) (-0.44) (-0.43) (-0.70)
GSi, t-1 -0.01 -0.01 -0.01 0.01 0.01 -0.01
(-0.69) (-0.11) (-0.51) (0.24) (0.38) (-0.09)
GSi, t-1×RRi, t-1 0.18* 0.17
* 0.22
** 0.02 0.02 0.07
(1.80) (1.90) (2.09) (0.23) (0.26) (0.60)
Observations 719 718 718 456 455 455
Hansen-test (p-val) 0.77 0.42 0.59 0.92 0.88 0.79
AR(2)-test (p-val) 0.63 0.52 0.50 0.46 0.53 0.53 Notes: ‘GSi,t-1’ indicates 5-year lagged government size index that ranges from 0-10 where 0 and 10 indicate highest and lowest
government expenditure, respectively. See also notes to Table 3.
Table A4: Legal System & Property Rights, Resource Rent and TFP Growth
(Channel-1: Government Intervention)
Total Sample (99 countries) Developing Sample (63 countries)
Oil Rent Oil &
Gas Rent
Oil, Gas &
Mineral Rents
Oil Rent Oil &
Gas Rent
Oil, Gas &
Mineral Rents
RRi, t-1 -1.26* -1.29
* -1.32 -0.92
** -0.89
** -1.25
***
(-1.72) (-1.74) (-1.36) (-2.09) (-2.12) (-2.95)
LEGi, t-1 0.04* 0.05
* 0.05
** -0.01 -0.01 -0.02
(1.89) (1.71) (2.07) (-0.35) (-0.01) (-0.97)
LEGi, t-1×RRi, t-1 0.28**
0.28**
0.30* 0.21
* 0.19
* 0.31
***
(1.99) (2.01) (1.70) (1.85) (1.89) (3.10)
Observations 721 720 720 457 456 456
Hansen-test (p-val) 0.31 0.37 0.33 0.77 0.51 0.73
AR(2)-test (p-val) 0.25 0.23 0.22 0.53 0.58 0.70 Notes: ‘LEGi,t-1’ indicates 5-year lagged legal structure and security of property rights index that ranges from 0-10 where 0 and 10
correspond to lowest and highest legal and security system, respectively. See also notes to Table 3.
Table A5: Access to Sound Money, Resource Rent and TFP Growth
(Channel-1: Government Intervention)
Total Sample (99 countries) Developing Sample (63 countries)
Oil Rent Oil &
Gas Rent
Oil, Gas &
Mineral Rents
Oil Rent Oil &
Gas Rent
Oil, Gas &
Mineral Rents
RRi, t-1 -0.60 -0.51 -1.03 -0.15 -0.05 -0.64
(-0.67) (-0.65) (-1.13) (-0.33) (-0.13) (-1.10)
SMi, t-1 0.01 0.01 -0.01 0.02 0.02 0.01
(0.79) (1.21) (-0.21) (1.46) (1.61) (0.51)
SMi, t-1×RRi, t-1 0.15 0.12 0.19 0.01 0.01 0.09
(1.31) (1.22) (1.65) (0.13) (0.06) (1.00)
Observations 722 721 721 458 457 457
Hansen-test (p-val) 0.40 0.51 0.30 0.61 0.63 0.43
AR(2)-test (p-val) 0.86 0.90 0.75 0.38 0.42 0.44 Notes: ‘SMi,t-1’ indicates 5-year lagged access to sound money index that ranges from 0-10 where 0 and 10 correspond to highest and
lowest financial access, respectively. See also notes to Table 3.

32
Table A6: Freedom to International Trade, Resource Rent and TFP Growth
(Channel-1: Government Intervention)
Total Sample (99 countries) Developing Sample (63 countries)
Oil Rent Oil &
Gas Rent
Oil, Gas &
Mineral Rents
Oil Rent Oil &
Gas Rent
Oil, Gas &
Mineral Rents
RRi, t-1 -1.12* -0.97
* -1.08
* -1.18
* -1.28
* -1.09
*
(-1.76) (-1.82) (-1.71) (-1.84) (-1.99) (-1.81)
INTi, t-1 0.02 0.02 0.02 -0.01 0.01 0.01
(1.38) (1.63) (1.45) (-0.07) (0.58) (0.26)
INTi, t-1×RRi, t-1 0.18* 0.15
* 0.18
* 0.19
* 0.21
* 0.18
*
(1.73) (1.87) (1.86) (1.83) (1.99) (1.83)
Observations 716 715 715 453 452 452
Hansen-test (p-val) 0.78 0.72 0.73 0.84 0.64 0.70
AR(2)-test (p-val) 0.94 0.87 0.81 0.37 0.40 0.44 Notes: ‘INTi,t-1’ indicates 5-year lagged freedom to trade internationally index that ranges from 0-10 where 0 and 10 correspond to
lowest and highest openness, respectively. See also notes to Table 3.
Table A7: Regulation, Resource Rent and TFP Growth
(Channel-1: Government Intervention)
Total Sample (99 countries) Developing Sample (63 countries)
Oil Rent Oil &
Gas Rent
Oil, Gas &
Mineral Rents
Oil Rent Oil &
Gas Rent
Oil, Gas &
Mineral Rents
RRi, t-1 -0.87* -0.79 -1.14
** -0.34 -0.33 -0.32
*
(-1.67) (-1.61) (-2.01) (-1.46) (-1.51) (-1.68)
REGi, t-1 0.04 0.04 0.04 0.03***
0.02***
0.03***
(1.20) (1.07) (1.03) (4.43) (3.56) (3.77)
REGi, t-1× RRi, t-1 0.17* 0.17
* 0.23
** 0.10
** 0.11
** 0.10
**
(1.85) (1.93) (2.23) (2.24) (2.56) (2.48)
Observations 720 719 719 457 456 456
Hansen-test (p-val) 0.41 0.47 0.55 0.54 0.43 0.26
AR(2)-test (p-val) 0.61 0.60 0.54 0.65 0.74 0.39 Notes: ‘REGi,t-1’ indicates 5-year lagged regulation of credit, labor and business index that ranges from 0-10 where 0 and 10
correspond to highest and lowest regulation, respectively. See also notes to Table
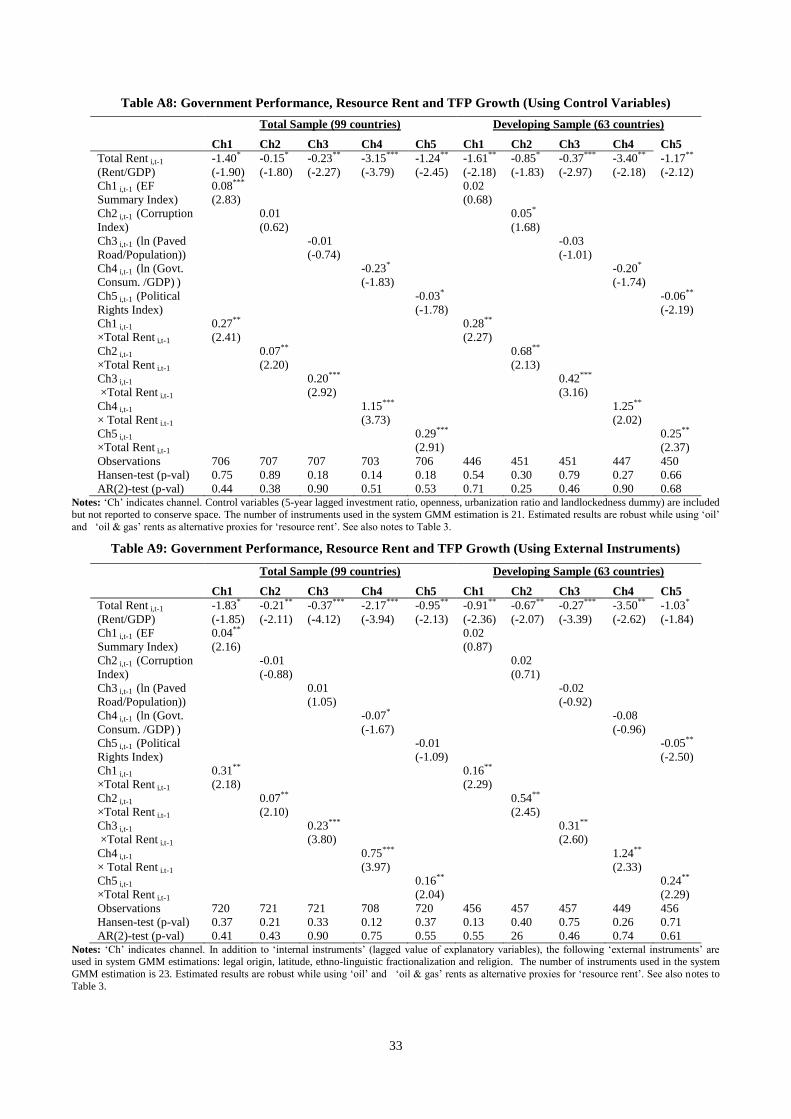
33
Table A8: Government Performance, Resource Rent and TFP Growth (Using Control Variables)
Total Sample (99 countries) Developing Sample (63 countries)
Ch1 Ch2 Ch3 Ch4 Ch5 Ch1 Ch2 Ch3 Ch4 Ch5
Total Rent i,t-1
(Rent/GDP)
-1.40* -0.15* -0.23** -3.15*** -1.24** -1.61** -0.85* -0.37*** -3.40** -1.17**
(-1.90) (-1.80) (-2.27) (-3.79) (-2.45) (-2.18) (-1.83) (-2.97) (-2.18) (-2.12)
Ch1 i,t-1 (EF
Summary Index)
0.08*** 0.02
(2.83) (0.68)
Ch2 i,t-1 (Corruption
Index)
0.01 0.05*
(0.62) (1.68)
Ch3 i,t-1 (ln (Paved
Road/Population))
-0.01 -0.03
(-0.74) (-1.01)
Ch4 i,t-1 (ln (Govt.
Consum. /GDP) )
-0.23* -0.20*
(-1.83) (-1.74)
Ch5 i,t-1 (Political
Rights Index)
-0.03* -0.06**
(-1.78) (-2.19)
Ch1 i,t-1
×Total Rent i,t-1
0.27** 0.28**
(2.41) (2.27)
Ch2 i,t-1
×Total Rent i,t-1
0.07** 0.68**
(2.20) (2.13)
Ch3 i,t-1
×Total Rent i,t-1
0.20*** 0.42***
(2.92) (3.16)
Ch4 i,t-1
× Total Rent i,t-1
1.15*** 1.25**
(3.73) (2.02)
Ch5 i,t-1
×Total Rent i,t-1
0.29*** 0.25**
(2.91) (2.37)
Observations 706 707 707 703 706 446 451 451 447 450
Hansen-test (p-val) 0.75 0.89 0.18 0.14 0.18 0.54 0.30 0.79 0.27 0.66
AR(2)-test (p-val) 0.44 0.38 0.90 0.51 0.53 0.71 0.25 0.46 0.90 0.68 Notes: ‘Ch’ indicates channel. Control variables (5-year lagged investment ratio, openness, urbanization ratio and landlockedness dummy) are included
but not reported to conserve space. The number of instruments used in the system GMM estimation is 21. Estimated results are robust while using ‘oil’
and ‘oil & gas’ rents as alternative proxies for ‘resource rent’. See also notes to Table .
Table A9: Government Performance, Resource Rent and TFP Growth (Using External Instruments)
Total Sample (99 countries) Developing Sample (63 countries)
Ch1 Ch2 Ch3 Ch4 Ch5 Ch1 Ch2 Ch3 Ch4 Ch5
Total Rent i,t-1
(Rent/GDP)
-1.83* -0.21** -0.37*** -2.17*** -0.95** -0.91** -0.67** -0.27*** -3.50** -1.03*
(-1.85) (-2.11) (-4.12) (-3.94) (-2.13) (-2.36) (-2.07) (-3.39) (-2.62) (-1.84)
Ch1 i,t-1 (EF
Summary Index)
0.04** 0.02
(2.16) (0.87)
Ch2 i,t-1 (Corruption
Index)
-0.01 0.02
(-0.88) (0.71)
Ch3 i,t-1 (ln (Paved
Road/Population))
0.01 -0.02
(1.05) (-0.92)
Ch4 i,t-1 (ln (Govt.
Consum. /GDP) )
-0.07* -0.08
(-1.67) (-0.96)
Ch5 i,t-1 (Political
Rights Index)
-0.01 -0.05**
(-1.09) (-2.50)
Ch1 i,t-1
×Total Rent i,t-1
0.31** 0.16**
(2.18) (2.29)
Ch2 i,t-1
×Total Rent i,t-1
0.07** 0.54**
(2.10) (2.45)
Ch3 i,t-1
×Total Rent i,t-1
0.23*** 0.31**
(3.80) (2.60)
Ch4 i,t-1
× Total Rent i,t-1
0.75*** 1.24**
(3.97) (2.33)
Ch5 i,t-1
×Total Rent i,t-1
0.16** 0.24**
(2.04) (2.29)
Observations 720 721 721 708 720 456 457 457 449 456
Hansen-test (p-val) 0.37 0.21 0.33 0.12 0.37 0.13 0.40 0.75 0.26 0.71
AR(2)-test (p-val) 0.41 0.43 0.90 0.75 0.55 0.55 26 0.46 0.74 0.61 Notes: ‘Ch’ indicates channel. In addition to ‘internal instruments’ (lagged value of explanatory variables), the following ‘external instruments’ are used in system GMM estimations: legal origin, latitude, ethno-linguistic fractionalization and religion. The number of instruments used in the system
GMM estimation is 23. Estimated results are robust while using ‘oil’ and ‘oil & gas’ rents as alternative proxies for ‘resource rent’. See also notes to
Table 3.

34
Table A10: Government Performance, Resource Rent and TFP Growth (Using per capita resource rents as
explanatory variables)
Total Sample (99 countries) Developing Sample (63 countries)
Ch1 Ch2 Ch3 Ch4 Ch5 Ch1 Ch2 Ch3 Ch4 Ch5
Total Rent Per
Capita i,t-1
-1.32* -0.29 -0.60* -1.23** -0.38* -1.90* -2.23* -0.61*** -3.39* -1.99*
(-1.80) (-1.47) (-1.84) (-2.03) (-1.90) (-1.89) (-1.66) (-3.04) (-1.89) (-1.85)
Ch1 i,t-1 (EF
Summary Index)
0.03** 0.05***
(2.39) (2.77)
Ch2 i,t-1 (Corruption
Index)
-0.01 -0.01
(-0.23) (-0.12)
Ch3 i,t-1 (ln (Paved
Road/Population))
0.10 -0.03
(1.41) (-0.76)
Ch4 i,t-1 (ln (Govt.
Consum. /GDP) )
-0.13 -0.20
(-1.10) (-1.64)
Ch5 i,t-1 (Political
Rights Index)
-0.05** -0.07**
(-2.11) (-2.18)
Ch1 i,t-1 × Total Rent
Per Capita i,t-1
0.20* 0.32**
(1.89) (2.19)
Ch2 i,t-1× Total Rent
Per Capita i,t-1
0.15** 1.51*
(2.15) (1.93)
Ch3 i,t-1 × Total Rent
Per Capita i,t-1
0.16* 0.22**
(1.78) (2.19)
Ch4 i,t-1 × Total Rent
Per Capita i,t-1
1.39*
0.41** (1.72)
Ch5 i,t-1 × Total Rent
Per Capita i,t-1
(2.12) 0.09** 0.34*
(2.37) (1.95)
Observations 720 721 721 708 720 456 457 457 449 456
Hansen-test (p-val) 0.18 0.32 0.20 0.55 0.15 0.17 0.82 0.32 025 0.45
AR(2)-test (p-val) 0.49 0.82 0.27 0.70 0.87 0.51 0.19 0.45 0.86 0.92 Notes: The number of instruments used in the system GMM estimation is 16. Estimated results are robust while using per capita ‘oil’ and ‘oil & gas’
rents as alternative proxies for ‘per capita resource rent’. See also notes to Table .
Table A11: Government Performance, Resource Rent and Growth (Using output per labor growth as dependent
variable)
Total Sample (99 countries) Developing Sample (63 countries)
Ch1 Ch2 Ch3 Ch4 Ch5 Ch1 Ch2 Ch3 Ch4 Ch5
Total Rent i,t-1
(Rent/GDP)
-1.88** -0.28 -0.18 -3.47** -2.22*** -1.38* -0.49 -0.24* -4.48*** -0.93*
(-1.99) (-1.12) (-0.69) (-2.58) (-2.81) (-1.85) (-1.14) (-1.86) (-2.85) (-1.96)
Ch1 i,t-1 (EF
Summary Index)
0.06** 0.05**
(2.13) (2.21)
Ch2 i,t-1 (Corruption
Index)
-0.05 0.07
(-1.02) (1.46)
Ch3 i,t-1 (ln (Paved
Road/Population))
0.03 0.01
(1.37) (0.24)
Ch4 i,t-1 (ln (Govt.
Consum. /GDP) )
-0.34*** -0.29**
(-2.63) (-2.50)
Ch5 i,t-1 (Political
Rights Index)
-0.08*** -0.06**
(-3.39) (-2.03)
Ch1 i,t-1
×Total Rent i,t-1
0.38** 0.26*
(2.60) (1.97)
Ch2 i,t-1
×Total Rent i,t-1
0.15* 0.50*
(1.67) (1.70)
Ch3 i,t-1
×Total Rent i,t-1
0.18** 0.23*
(2.12) (1.82)
Ch4 i,t-1
× Total Rent i,t-1
1.35*** 1.69***
(2.86) (2.71)
Ch5 i,t-1
×Total Rent i,t-1
0.52*** 0.22**
(3.28) (2.05)
Observations 724 725 725 712 724 460 461 461 453 460
Hansen-test (p-val) 0.80 0.64 0.45 0.47 0.58 0.69 0.39 0.78 012 0.37
AR(2)-test (p-val) 0.33 0.28 0.84 0.40 0.61 0.55 0.23 0.55 0.85 0.43 Notes: Dependent variable is the growth rate of output per labor. The number of instruments used in the system GMM estimation is 16. Estimated results are robust while using ‘oil’ and ‘oil & gas’ rents as alternative proxies for ‘resource rent’. See also notes to Table 3.