1. 2 Flotation Matrix 100™ Driving Measurable Quality & Performance Improvements.
Upload
frost-sullivanCategory
view
474download
0
Growth Excellence Matrix
Driving Top-line Performance to the Upper Right
Presented by:
Ryan Sherring: Regional Head of Africa
Richard Lee Nash: Project Manager
Growth Implementation Solutions
14th May 2013
© 2012 Frost & Sullivan. All rights reserved. This document contains highly confidential information and is the sole property of
Frost & Sullivan. No part of it may be circulated, quoted, copied or otherwise reproduced without the written approval of Frost & Sullivan.

Today’s Presenters
Ryan brings a wealth of experience in
designing and implementing corporate growth
strategies across the African continent.
Particular expertise in:
• Strategy Design & Implementation
• Business Optimisation
• Business Transformation
Ryan has over 7 years of consulting experience
with a strong education
• MBA
• BCom: Finance & Economics
Ryan Sherring
Head of Africa
Growth Implementation
Solutions
Frost & Sullivan
Richard Lee Nash
Project Manager
Growth Implementation
Solutions
Frost & Sullivan
Richard brings experience across multiple industry
segments, organizational structures, cultures and
regions. Particular expertise in:
• Growth initiative identification and prioritization
• Strategy Development and Implementation
• Business Transformation
• Innovation and Sustainability
Richard has over 7 years of consulting experience
with a education including:
• BCom honours (Financial Analysis & Portfolio
Management)
• BCom: Finance, Economics & Statistics

Focus Points
Introduction
Executive Management’s Key Challenges
Growth Excellence Matrix
Overview
Purpose & Benefits
Key Metrics
Methodology
Example Outputs
Questions
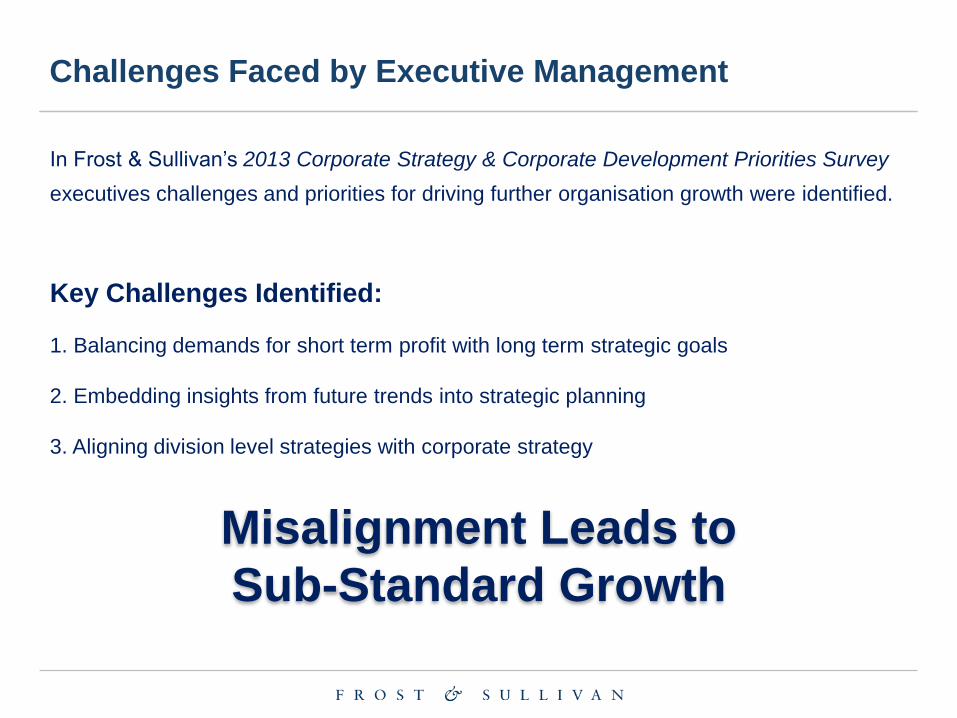
Challenges Faced by Executive Management
In Frost & Sullivan’s 2013 Corporate Strategy & Corporate Development Priorities Survey
executives challenges and priorities for driving further organisation growth were identified.
Key Challenges Identified:
1. Balancing demands for short term profit with long term strategic goals
2. Embedding insights from future trends into strategic planning
3. Aligning division level strategies with corporate strategy
Misalignment Leads to
Sub-Standard Growth
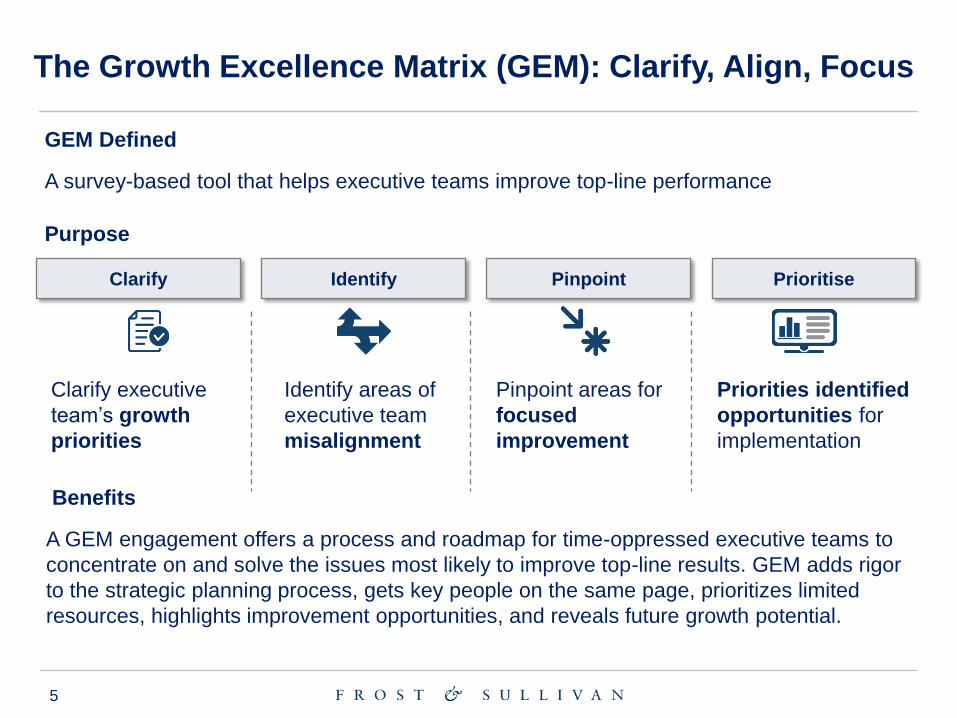
The Growth Excellence Matrix (GEM): Clarify, Align, Focus
Priorities identified
opportunities for
implementation
GEM Defined
A survey-based tool that helps executive teams improve top-line performance
Benefits
A GEM engagement offers a process and roadmap for time-oppressed executive teams to
concentrate on and solve the issues most likely to improve top-line results. GEM adds rigor
to the strategic planning process, gets key people on the same page, prioritizes limited
resources, highlights improvement opportunities, and reveals future growth potential.
Purpose
Clarify executive
team’s growth
priorities
Identify areas of
executive team
misalignment
Pinpoint areas for
focused
improvement
Clarify Identify Pinpoint Prioritise
5
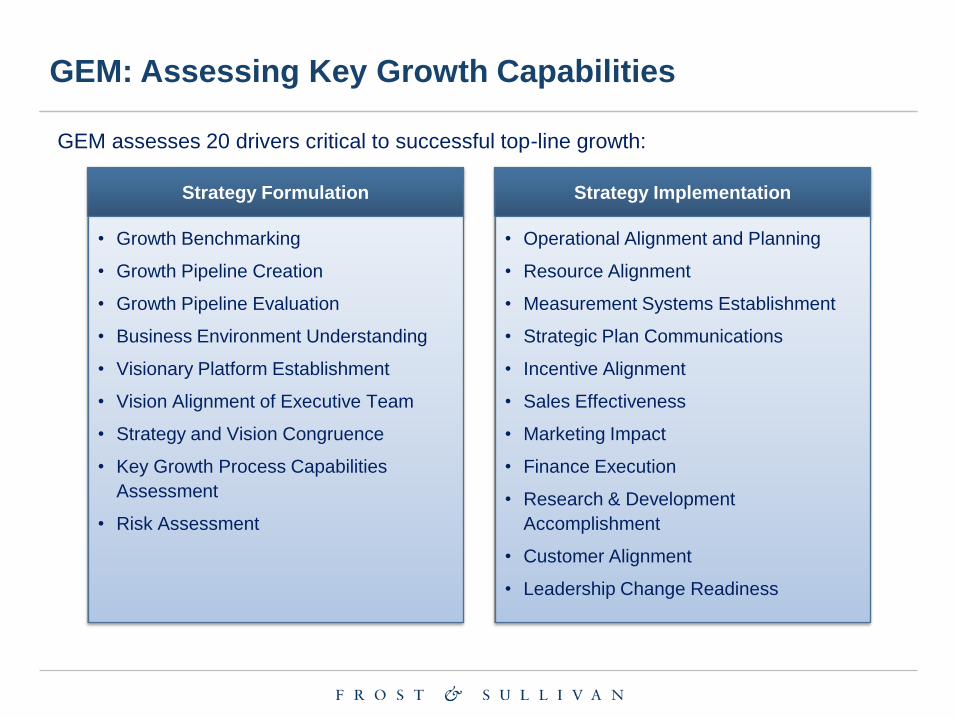
GEM: Assessing Key Growth Capabilities
GEM assesses 20 drivers critical to successful top-line growth:
Strategy Formulation
• Growth Benchmarking
• Growth Pipeline Creation
• Growth Pipeline Evaluation
• Business Environment Understanding
• Visionary Platform Establishment
• Vision Alignment of Executive Team
• Strategy and Vision Congruence
• Key Growth Process Capabilities
Assessment
• Risk Assessment
Strategy Implementation
• Operational Alignment and Planning
• Resource Alignment
• Measurement Systems Establishment
• Strategic Plan Communications
• Incentive Alignment
• Sales Effectiveness
• Marketing Impact
• Finance Execution
• Research & Development
Accomplishment
• Customer Alignment
• Leadership Change Readiness
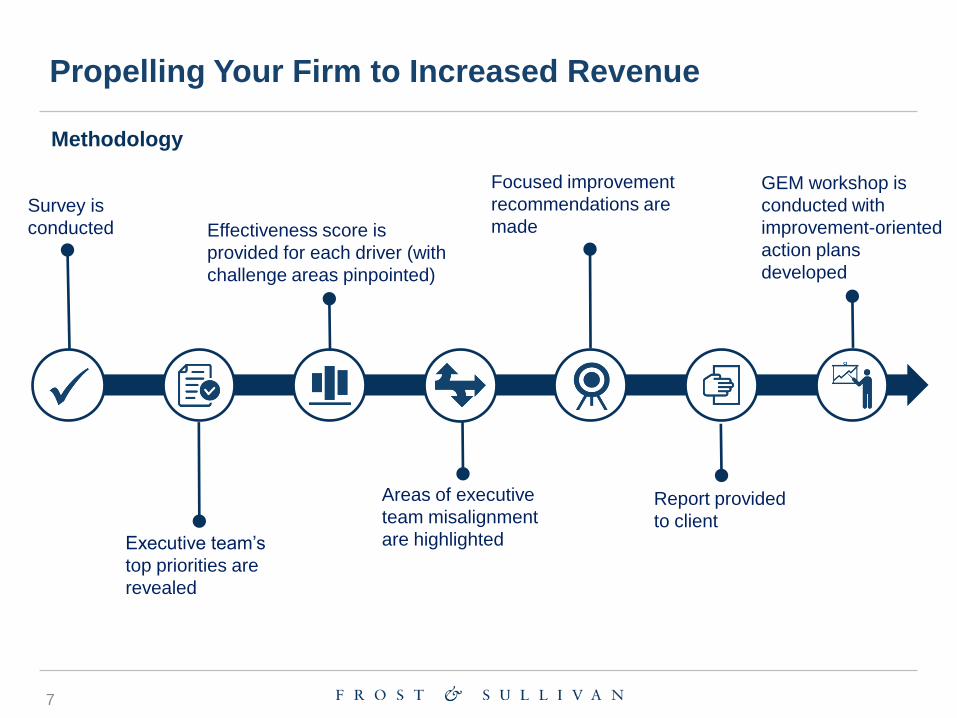
Propelling Your Firm to Increased Revenue
Survey is
conducted
Executive team’s
top priorities are
revealed
Methodology
Effectiveness score is
provided for each driver (with
challenge areas pinpointed)
Areas of executive
team misalignment
are highlighted
Focused improvement
recommendations are
made
Report provided
to client
GEM workshop is
conducted with
improvement-oriented
action plans
developed
7

Importance of Growth Strategy Formulation Drivers to
Company Leaders
Source: Frost & Sullivan
The table below depicts the relative value your executive team places on proven growth strategies. Your team values
identifying and evaluating new growth opportunities above other approaches.
Strategy Drivers by Rank of Importance Percentage
1. Growth Pipeline Creation 67%
2. Key Growth Process Capabilities 56%
3. Growth Benchmarking 53%
4. Growth Pipeline Evaluation 49%
5. Business Environment Evaluation 46%
6. Visionary Platform Establishment 44%
7. Strategy and Vision Congruence 38%
8. Risk Assessment 35%
9. Vision Alignment of Executive Team 32%
8
EXAMPLE

Growth Strategy Formulation Effectiveness
Each of the growth strategy formulation drivers depicted below is defined through five individual activities that a company
should perform. The aggregated score of those five activities gives an individual index score per growth driver. The
findings indicate a need to formalize the process for creating growth ideas; similarly, the firm might benefit from a broader
use of growth levers.
Strategy and Vision Congruence
Growth Benchmarking
Risk Assessment
Vision Alignment of Executive Team
Visionary Platform Establishment
Business Environment Understanding
Growth Pipeline Evaluation
Key Growth Process Capabilities Assessment
Growth Pipeline Creation
Growth Strategy Formulation Effectiveness
9
EXAMPLE
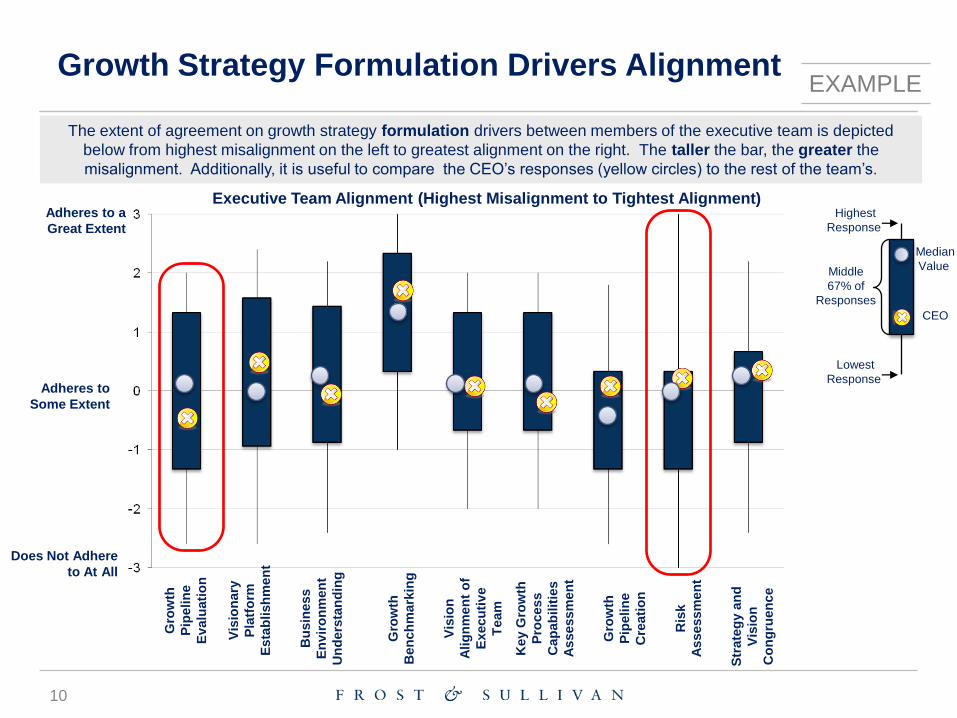
Growth Strategy Formulation Drivers Alignment
The extent of agreement on growth strategy formulation drivers between members of the executive team is depicted
below from highest misalignment on the left to greatest alignment on the right. The taller the bar, the greater the
misalignment. Additionally, it is useful to compare the CEO’s responses (yellow circles) to the rest of the team’s.
Adheres to a
Great Extent
Does Not Adhere
to At All
Adheres to
Some ExtentG
row
th
Ben
ch
mark
ing
Gro
wth
Pip
elin
e
Cre
ati
on
Gro
wth
Pip
elin
e
Ev
alu
ati
on
Bu
sin
ess
En
vir
on
men
t
Un
ders
tan
din
g
Vis
ion
ary
Pla
tfo
rm
Esta
blish
men
t
Vis
ion
Alig
nm
en
t o
f
Execu
tiv
e
Team
Str
ate
gy a
nd
Vis
ion
Co
ng
ruen
ce
Key G
row
th
Pro
cess
Cap
ab
ilit
ies
Assessm
en
t
Ris
k
Assessm
en
t
Executive Team Alignment (Highest Misalignment to Tightest Alignment)
Median
Value
CEO
Lowest
Response
Highest
Response
Middle
67% of
Responses
10
EXAMPLE
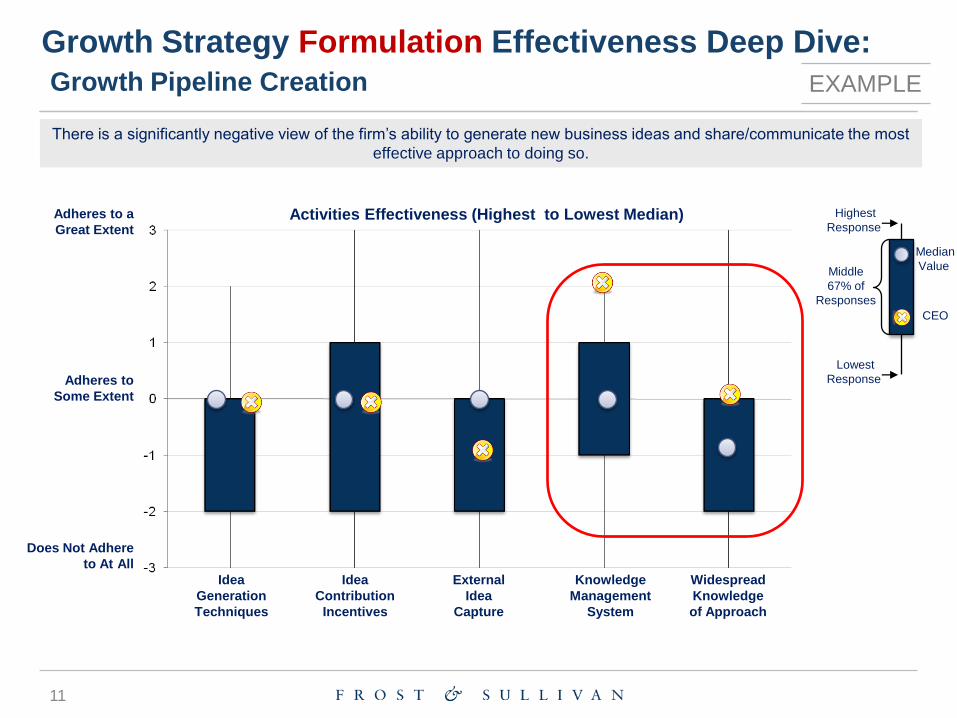
Growth Strategy Formulation Effectiveness Deep Dive:
Growth Pipeline Creation
There is a significantly negative view of the firm’s ability to generate new business ideas and share/communicate the most
effective approach to doing so.
Idea
Generation
Techniques
Idea
Contribution
Incentives
External
Idea
Capture
Knowledge
Management
System
Widespread
Knowledge
of Approach
Activities Effectiveness (Highest to Lowest Median)Adheres to a
Great Extent
Does Not Adhere
to At All
Adheres to
Some Extent
Median
Value
CEO
Lowest
Response
Highest
Response
Middle
67% of
Responses
11
EXAMPLE
Key Take-Aways
– The 20 key drivers can be used to examine your company’s strategy
formulation and implementation processes and capabilities
– Understanding your companies growth drivers is essential to drive revenue
growth
– The Growth Excellence Matrix structures executive inputs to generate
insights into the strength, weaknesses across 20 key growth capability
metrics to pinpoint areas for improvement
– The Growth Excellence Matrix compliments your strategic planning by identify
gaps in strategy, implementation capabilities, and executive alignment
– The strategic roadmap developed will significantly improve your company’s
growth capabilities across the key driver to significantly improve revenue
growth

Next Steps
Develop Your Visionary and Innovative Skills
Growth Partnership Service
Share your growth thought leadership and ideas or
join our GIL Global Community
Join our GIL Community Newsletter
Keep abreast of innovative growth opportunities

Your Feedback is Important to Us
Growth Forecasts?
Competitive Structure?
Emerging Trends?
Strategic Recommendations?
Other?
Please inform us by “Rating” this presentation.
What would you like to see from Frost & Sullivan?

https://twitter.com/frostsullivansa
Follow Frost & Sullivan
http://www.facebook.com/FrostandSullivan
http://www.linkedin.com/companies/4506
http://www.slideshare.net/FrostandSullivan
Ryan Sherring
Head of Africa
Growth Implementation Solutions
Frost & Sullivan
T: +27 (0)21 680 3564
Cape TownMaitland II building
River Park
Liesbeek Parkway
Cape Town
South Africa
Tel: +27 (0)21 680 3260
Fax: +27 (0)21 680 3296
For Additional Information


![Principal ideals in matrix rings - NIST · Let B be the nt X t matrix Let V be a unit matrix of R nt such that VB = T is upper triangular. Thus VB=T=[~] , where H is an n X n upper](https://static.fdocuments.in/doc/165x107/5ebb9c7ec8cb3f363c719c5b/principal-ideals-in-matrix-rings-nist-let-b-be-the-nt-x-t-matrix-let-v-be-a-unit.jpg)