Growth cones as soft and weak force generators
6
Growth cones as soft and weak force generators Timo Betz a,b,1 , Daniel Koch a , Yun-Bi Lu a,c , Kristian Franze a,c , and Josef A. Käs a a Division of Soft Matter Physics, Department of Physics, Universität Leipzig, Linnéstrasse 5, 04103 Leipzig, Germany; b Laboratoire Physico-chimie Curie (Unité mixte de recherche 168), 11, rue Pierre et Marie Curie, 75231 Paris Cedex 05, France; and c Paul-Flechsig-Institute for Brain Research, Department of Neurophysiology, University of Leipzig, Jahnallee 59, 04109 Leipzig, Germany Edited by Thomas D. Pollard, Yale University, New Haven, CT, and approved June 30, 2011 (received for review May 12, 2011) Many biochemical processes in the growth cone finally target its biomechanical properties, such as stiffness and force generation, and thus permit and control growth cone movement. Despite the immense progress in our understanding of biochemical processes regulating neuronal growth, growth cone biomechanics remains poorly understood. Here, we combine different experimental approaches to measure the structural and mechanical properties of a growth cone and to simultaneously determine its actin dy- namics and traction force generation. Using fundamental physical relations, we exploited these measurements to determine the internal forces generated by the actin cytoskeleton in the lamelli- podium. We found that, at timescales longer than the viscoelastic relaxation time of τ ¼ 8.5 0.5 sec, growth cones show liquid-like characteristics, whereas at shorter time scales they behaved elas- tically with a surprisingly low elastic modulus of E ¼ 106 21 Pa. Considering the growth cone’ s mechanical properties and retro- grade actin flow, we determined the internal stress to be on the order of 30 pN per μm 2 . Traction force measurements confirmed these values. Hence, our results indicate that growth cones are particularly soft and weak structures that may be very sensitive to the mechanical properties of their environment. motility ∣ neuron ∣ elasticity ∣ mechanics ∣ scanning force microscopy N euronal growth is a fundamental event during ontogenetic development and nerve regeneration. The mechanical forces required for neuronal pathfinding and translocation are gener- ated in the growth cone, a motile extension at the neurite tip (1). As in other motile structures, growth cone movement involves actin polymerization and myosin motor mediated contraction of the actin network in the lamellipodium, a flat structure intern- ally made up by a cross-linked actin network (2). The movement of the leading edge is determined by the difference between out- ward pushing actin polymerization and the continuous centripetal flow of actin, called the retrograde flow (3) (Fig. S1). Local mea- surements of the retrograde flow (3, 4) and traction forces of filopodia (5, 6) have been reported on various substrate stiffness. These observations and the detailed analysis of neuron branching on substrates of varying stiffness (7) highlight the importance of the mechanical environment for neuronal growth. Furthermore, the constant neurite tension that is maintained by molecular motors in the neurite cytoskeleton has been extensively studied (8–10). However, neither the internal forces, which are the forces generated and acting within the growth cone, nor the growth cone’s lamellipodial traction forces have yet been quantified. To understand the mechanics of neuronal growth, knowledge of the relation between the growth cone’s viscoelastic material proper- ties, the internally generated forces and the traction forces trans- mitted to the substrate is of fundamental importance. A recent study used speckle microscopy and a simple spring model to convert data from retrograde flow in epithelial cells into qualitative internal stresses (11). Whereas this model allowed a qualitative derivation of the internal stress, it only modeled the elastic contribution, thus neglecting the viscous dissipation that is dominant at longer timescales. Furthermore, as the material properties of the cell were not determined, this approach did not allow a quantitative force calculation. On the other hand, the- oretical work has been published that uses mean field theory models to describe the viscous regime of lamellipodial actin flows by expanding liquid crystal physics to active systems (12). Here we extend these purely elastic (11) and viscous (12) analyses by considering the inherent viscoelastic nature of a cell from a mechanical point of view. The main scope of this study is to provide a measurement of the internal and external stress generated by the actin cytoskele- ton of a moving growth cone. It should be noted that stress and force give similar information, because stress is defined by a force per area. As all the following measurements are based on image analysis, the fundamental property measured is stress. We first establish the characteristic mean viscoelastic material properties of a growth cone and then combine these with the material flow fields as determined by speckle microscopy to determine the stress required for the observed flow. Finally, we exploit traction force microscopy to obtain a complete picture of the intra- and extracellular stresses that eventually result in neuronal growth cone motility. Deducing Forces From Deformation Common experience tells us that objects can be deformed upon application of a force. In the example of a simple spring, there is a linear relation between force and deformation, summarized in Hooke’s law for an elastic spring: F ¼ k × x, where F is the force that is required to deform a spring with spring constant k by a distance x. Hence, knowing the spring constant and the deforma- tion, it is straight forward to deduce the force responsible for the observed deformation. Another well known deformation is the flow of a liquid, where the viscous forces are independent of the actual deformation magnitude, but depend on the deforma- tion rate or flow velocity. Living cells, however, are neither ideally elastic nor ideally fluid objects, but show both characteristics simultaneously. This needs to be taken into account for any quan- titative description. Typically, living cells show viscous character- istics at long time scales, whereas they are rather elastic at short times. These viscoelastic material properties are described by the time dependent viscoelastic relaxation modulus E(t). In the case of a three dimensional cell, in general, the viscoelastic modulus is a fourth-order tensor. However, this complexity can be drastically reduced by applying the approximation that the elastic properties are in first order homogeneous and isotropic. These two general assumptions allow to describe a viscoelastic material by two fundamental properties, namely the time dependent relaxation modulus E(t) and the Poisson’s ratio ν. We directly measure these two material properties of a growth cone using a modified scanning force microscopy (SFM) technique (13, 14) Once the material properties are known, it is straight forward to determine the relation between deformation u ij and stress tensor σ ij Author contributions: T.B. and J.A.K. designed research; T.B., D.K., Y.-B.L., and K.F. performed research; K.F. contributed new reagents/analytic tools; T.B., D.K., and Y.-B.L. analyzed data; and T.B. and J.A.K. wrote the paper. The authors declare no conflict of interest. This article is a PNAS Direct Submission. 1 To whom correspondence should be addressed. E-mail: [email protected]. This article contains supporting information online at www.pnas.org/lookup/suppl/ doi:10.1073/pnas.1106145108/-/DCSupplemental. www.pnas.org/cgi/doi/10.1073/pnas.1106145108 PNAS Early Edition ∣ 1 of 6 BIOPHYSICS AND COMPUTATIONAL BIOLOGY PHYSICS
Transcript of Growth cones as soft and weak force generators
Growth cones as soft and weak force generatorsTimo Betza,b,1, Daniel Kocha, Yun-Bi Lua,c, Kristian Franzea,c, and Josef A. Käsa
aDivision of Soft Matter Physics, Department of Physics, Universität Leipzig, Linnéstrasse 5, 04103 Leipzig, Germany; bLaboratoire Physico-chimie Curie(Unité mixte de recherche 168), 11, rue Pierre et Marie Curie, 75231 Paris Cedex 05, France; and cPaul-Flechsig-Institute for Brain Research, Departmentof Neurophysiology, University of Leipzig, Jahnallee 59, 04109 Leipzig, Germany
Edited by Thomas D. Pollard, Yale University, New Haven, CT, and approved June 30, 2011 (received for review May 12, 2011)
Many biochemical processes in the growth cone finally target itsbiomechanical properties, such as stiffness and force generation,and thus permit and control growth cone movement. Despite theimmense progress in our understanding of biochemical processesregulating neuronal growth, growth cone biomechanics remainspoorly understood. Here, we combine different experimentalapproaches to measure the structural and mechanical propertiesof a growth cone and to simultaneously determine its actin dy-namics and traction force generation. Using fundamental physicalrelations, we exploited these measurements to determine theinternal forces generated by the actin cytoskeleton in the lamelli-podium. We found that, at timescales longer than the viscoelasticrelaxation time of τ ¼ 8.5� 0.5 sec, growth cones show liquid-likecharacteristics, whereas at shorter time scales they behaved elas-tically with a surprisingly low elastic modulus of E ¼ 106� 21 Pa.Considering the growth cone’s mechanical properties and retro-grade actin flow, we determined the internal stress to be on theorder of 30 pN per μm2. Traction force measurements confirmedthese values. Hence, our results indicate that growth cones areparticularly soft and weak structures that may be very sensitiveto the mechanical properties of their environment.
motility ∣ neuron ∣ elasticity ∣ mechanics ∣ scanning force microscopy
Neuronal growth is a fundamental event during ontogeneticdevelopment and nerve regeneration. The mechanical forces
required for neuronal pathfinding and translocation are gener-ated in the growth cone, a motile extension at the neurite tip (1).As in other motile structures, growth cone movement involvesactin polymerization and myosin motor mediated contractionof the actin network in the lamellipodium, a flat structure intern-ally made up by a cross-linked actin network (2). The movementof the leading edge is determined by the difference between out-ward pushing actin polymerization and the continuous centripetalflow of actin, called the retrograde flow (3) (Fig. S1). Local mea-surements of the retrograde flow (3, 4) and traction forces offilopodia (5, 6) have been reported on various substrate stiffness.These observations and the detailed analysis of neuron branchingon substrates of varying stiffness (7) highlight the importance ofthe mechanical environment for neuronal growth. Furthermore,the constant neurite tension that is maintained by molecularmotors in the neurite cytoskeleton has been extensively studied(8–10). However, neither the internal forces, which are the forcesgenerated and acting within the growth cone, nor the growthcone’s lamellipodial traction forces have yet been quantified. Tounderstand the mechanics of neuronal growth, knowledge of therelation between the growth cone’s viscoelastic material proper-ties, the internally generated forces and the traction forces trans-mitted to the substrate is of fundamental importance.
A recent study used speckle microscopy and a simple springmodel to convert data from retrograde flow in epithelial cells intoqualitative internal stresses (11). Whereas this model allowed aqualitative derivation of the internal stress, it only modeled theelastic contribution, thus neglecting the viscous dissipation that isdominant at longer timescales. Furthermore, as the materialproperties of the cell were not determined, this approach didnot allow a quantitative force calculation. On the other hand, the-oretical work has been published that uses mean field theory
models to describe the viscous regime of lamellipodial actin flowsby expanding liquid crystal physics to active systems (12). Herewe extend these purely elastic (11) and viscous (12) analysesby considering the inherent viscoelastic nature of a cell from amechanical point of view.
The main scope of this study is to provide a measurement ofthe internal and external stress generated by the actin cytoskele-ton of a moving growth cone. It should be noted that stress andforce give similar information, because stress is defined by a forceper area. As all the following measurements are based on imageanalysis, the fundamental property measured is stress. We firstestablish the characteristic mean viscoelastic material propertiesof a growth cone and then combine these with the material flowfields as determined by speckle microscopy to determine thestress required for the observed flow. Finally, we exploit tractionforce microscopy to obtain a complete picture of the intra- andextracellular stresses that eventually result in neuronal growthcone motility.
Deducing Forces From DeformationCommon experience tells us that objects can be deformed uponapplication of a force. In the example of a simple spring, there is alinear relation between force and deformation, summarized inHooke’s law for an elastic spring: F ¼ k × x, where F is the forcethat is required to deform a spring with spring constant k by adistance x. Hence, knowing the spring constant and the deforma-tion, it is straight forward to deduce the force responsible for theobserved deformation. Another well known deformation is theflow of a liquid, where the viscous forces are independent ofthe actual deformation magnitude, but depend on the deforma-tion rate or flow velocity. Living cells, however, are neither ideallyelastic nor ideally fluid objects, but show both characteristicssimultaneously. This needs to be taken into account for any quan-titative description. Typically, living cells show viscous character-istics at long time scales, whereas they are rather elastic at shorttimes. These viscoelastic material properties are described by thetime dependent viscoelastic relaxation modulus E(t). In the caseof a three dimensional cell, in general, the viscoelastic modulus isa fourth-order tensor. However, this complexity can be drasticallyreduced by applying the approximation that the elastic propertiesare in first order homogeneous and isotropic. These two generalassumptions allow to describe a viscoelastic material by twofundamental properties, namely the time dependent relaxationmodulus E(t) and the Poisson’s ratio ν. We directly measure thesetwo material properties of a growth cone using a modifiedscanning force microscopy (SFM) technique (13, 14) Once thematerial properties are known, it is straight forward to determinethe relation between deformation uij and stress tensor σij
Author contributions: T.B. and J.A.K. designed research; T.B., D.K., Y.-B.L., and K.F.performed research; K.F. contributed new reagents/analytic tools; T.B., D.K., and Y.-B.L.analyzed data; and T.B. and J.A.K. wrote the paper.
The authors declare no conflict of interest.
This article is a PNAS Direct Submission.1To whom correspondence should be addressed. E-mail: [email protected].
This article contains supporting information online at www.pnas.org/lookup/suppl/doi:10.1073/pnas.1106145108/-/DCSupplemental.
www.pnas.org/cgi/doi/10.1073/pnas.1106145108 PNAS Early Edition ∣ 1 of 6
BIOPH
YSICSAND
COMPU
TATIONALBIOLO
GY
PHYS
ICS

(σ ¼ Force∕Area) that reads (see Appendix and SI Text for adetailed derivation):
σijðtÞ ¼Z
t
−∞
Eðt − τÞ1þ ν
�duijdτ
þ ν
1 − 2ν
dukkdτ
δij
�dτ: [1]
This equation describes how the stress at a given time dependson the material properties (E(t) and ν) and the deformationvelocity (du∕dt). The integral over the time passed ensures thatthe history of the deformation is taken into account. This historydependence presents the difference between a purely elasticversus a viscoelastic deformation because a viscoelastic materialsuch as a cell has a memory effect represented by the timedependence of E(t).
Results and DiscussionViscoelastic Properties of the Growth Cone. We determined theviscoelastic material properties of neuronal growth cones usingSFM-based microrheology (13, 14), which measures the fre-quency dependent elastic storage modulus E0ðf Þ and viscous lossmodulus E00ðf Þ. We measured E0ðf Þ and E00ðf Þ for five differentfrequencies in the range of 0.3–30 Hz (Fig. 1). To extract the timedependent relaxation modulus E(t), we fitted E0ðf Þ and E00ðf Þ toan extended Kelvin–Voigt model (Fig. 1, SI Text, and Fig. S2),which has been previously shown to approximate cellular defor-mations in the measured frequency range (15). Whereas the fitquality shows that this model provides an adequate approxima-tion, it is also evident that a complete description requires morerefined models, which are out of scope of the presented work.Furthermore, it should be noted that the technique used cannotwell resolve small spatial variations of the mechanical propertiesas the size of the probe limits the spatial resolution to approxi-mately 2 μm. Thus the measured values directly represent average
viscoelastic properties for the whole growth cone. The goodreproducibility of the data with an average relative error of21% (n ¼ 64, 11 growth cones) in the 10 measurement points(two points for five frequencies) shows that the applied measure-ment indeed gives a reasonable approximation of the materialproperties. Hence, the small error justifies the approximationof spatial and temporal homogeneity as applied in the mathema-tical description.
The fit of E0ðf Þ and E00ðf Þ presented in Fig. 1 depends on threeindependent fit parameters for the growth cone: the Young’smodulus E ¼ 106� 21 Pa, the steady state viscosity η ¼ 905�26 Pa s and the relaxation time τR ¼ 8.5� 0.5 s. The Poissonratio ν ¼ 0.47� 0.05 (mean� SEM; n ¼ 64) was directly deter-mined from the SFM measurements, as previously described(13, 14). It should be stressed that the Young’s modulus E andthe relaxation modulus EðtÞ are different quantities. Whereasthe Young’s modulus E is a constant that describes the purelyelastic stiffness of the material represented by the plateau (Fig. 1),the relaxation modulus EðtÞ is a function that includes the timedependence of the viscous deformation of the growth cone. Ourdata is consistent with previously published values for centralnervous system (CNS) cells (14) and CNS tissue (16, 17). Inter-estingly, the measured elastic plateau at E ¼ 106� 21 Pa issurprisingly soft as compared to other motile cell types such asfibroblasts or fish keratocytes, which typically show elastic moduliin the range of kilopascal (18, 19). The measured Young’s mod-ulus presents a natural limit for the load (i.e., maximal stresses)that can be transmitted to the underlying substrate. Such a max-imal load may be imposed by the tension within the distal neuritethat has to be balanced by the growth cone. Based on the mea-sured Young’s modulus, we estimated a maximal neurite tensionof 8 nN (Young’s modulus times area: Fmax ≈ E × r2gc × π ≈ 8 nN)that a typical growth cone can sustain (radius: rgc ≈ 5 μm). Thisupper limit is consistent with measurements, as it is well abovepreviously reported maximum neurite tensions of about 2 nN(20, 21). The measured Young’s modulus further indicates thatthe maximal traction forces generated in a growth cone shouldbe significantly smaller than those found in stiffer cell types suchas fibroblasts or fish keratocytes (22, 23).
Internal Stress of the Actin Cytoskeleton. To quantify the internalstress ~σðx;yÞ within the growth cone, the viscoelastic materialproperties, and the deformation rate of the actin cytoskeleton(i.e., the retrograde flow fields ~uðx;yÞ; see Fig. S1) need to bedetermined. It should be noted that the calculation assumes thatthe 2D retrograde flow detection captures all the information,and that flows in the out of plain direction are not relevant inthe lamellipodium. The calculation can be separated into foursteps (further explained in SI Text). First, the retrograde flow iscalculated. Subsequently, the stress required to explain the defor-mation between subsequent images is calculated. In a third step,the deformation history is included in the calculation. This stepmakes use of the fact that stress from the previous deformationhas not yet been fully dissipated. Finally, the forces are calculatedbased on the local gradient of the stress tensor. In more detail, thesteps are:
1. Quantification of retrograde flow. To extract the lamellipodialactin dynamics, we used a feature tracking algorithm inspiredby speckle microscopy (24, 25). Fluorescence microscopytime-series of growth cones from GFP-actin transfectedNG108-15 cells were recorded with a time resolution of 3–5 s(see Movie S1). In contrast to most previous measurements ofneuronal retrograde flow (3, 26), our technique measures theflow fields of filamentous actin (F-actin) within the wholegrowth cone (25) (Fig. S1 and Movie S2). We find a meanretrograde flow velocity for NG108-15 growth cones of 1.46�0.60 μm∕min (mean� SEM; n ¼ 19). The measured retro-
Fig. 1. Rheological measurements of the frequency dependent Young’smodulus of growth cones. Filled circles represent the storage modulus,whereas open circles give the loss modulus. The lines represent the fit accord-ing to the extended Voigt model as described in SI Text. It should be notedthat for the low frequency measurements (below 1 Hz) the data is lessreliable as the active retrograde flow can not be neglected in the longtime regime, whereas the fit model does not consider such activity. At lowfrequencies the loss modulus becomes more important than the storagemodulus, thus marking a viscous regime, whereas at higher frequencies,the growth cone behaves more like an elastic object. According to the model,it is possible to identify a plateau for the storage modulus, which gives asteady state Young’s modulus of E ¼ 106� 21 Pa. The sketch and the insetillustrate the measurement method. A bead, glued to the cantilever of aSFM, penetrates the lamellipodium with an oscillating force (Inset, red),whereas the resulting deformation (Inset, black) is measured. The amplitudeand the phase difference between force and deformation determine theviscoelastic properties at the oscillation frequency.
2 of 6 ∣ www.pnas.org/cgi/doi/10.1073/pnas.1106145108 Betz et al.
grade flow shows a centripetal alignment and a strongdecrease of retrograde flow toward the transition zonebetween the actin filled lamellipodium and the microtubuledominated central region. This confirms the well describedproperties of retrograde flow as reported in the literature(3, 26), and raises the question of the origin, distributionand dynamics of the forces that drive the observed flow.
2. Calculation of the stress field between successive images. Thisstep does only consider the deformation between two succes-sive images. We assume that the flow is constant during a timeinterval, which simplifies the integral of Eq. 1 (details inAppendix and SI Text). Hence, this step does only extractthe stress that is required to explain the deformation betweentwo successive images, and it does not yet take into accountthe accumulation of stress due to the history of the system.
3. Accumulation of stress and relaxation by the deformation history.To obtain the full stress at a given moment, we add up all thestresses of the previous deformations to the current stress cal-culated in step 2. Stress relaxes over time following an expo-nential decay with time constant τR ¼ 8.5� 0.5 s that leads toa relaxation below 1% after 40 s. To include the entire stresshistory, we sum all the partially relaxed stresses from previousdeformations. When the stress measured at previous timepoints is dissipated to less than 1% of its initial value, wedo not further consider it. This strategy includes both, theactual measured deformation, and the stress history accordingto the viscoelastic material properties. It should be noted thatthe transport of stress according to the measured deformationis also taken into account. This is important, because localstresses are created in the actin network of the lamellipodium,and are thus transported with the retrograde flow.
4. Final calculation of the internal forces. Here, we use the stresstensor field calculated in the previous step to gain the internalforce field. This is done by applying the local equilibrium con-dition Eq. 6, where we calculate the local gradient of the stresstensor, which has to be balanced by an internal stress. This isequivalent to Newton’s laws. This calculation yields the inter-nal force for each pixel, so it is again in units of stress.
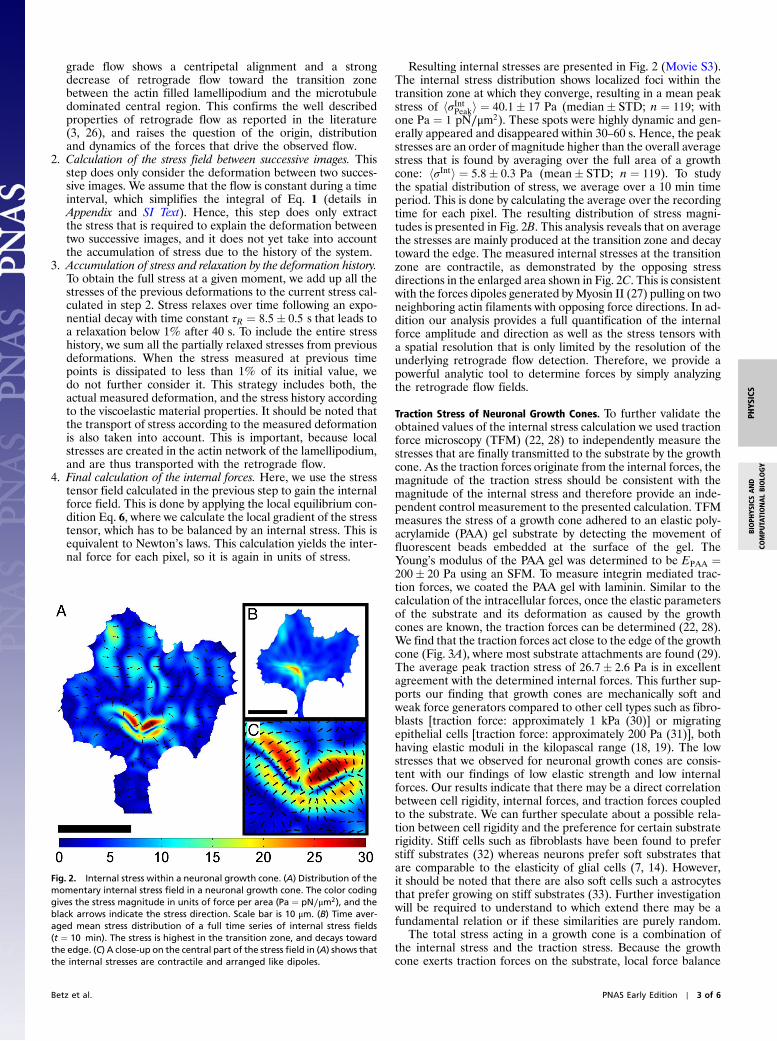
Resulting internal stresses are presented in Fig. 2 (Movie S3).The internal stress distribution shows localized foci within thetransition zone at which they converge, resulting in a mean peakstress of hσIntPeaki ¼ 40.1� 17 Pa (median� STD; n ¼ 119; withone Pa ¼ 1 pN∕μm2). These spots were highly dynamic and gen-erally appeared and disappeared within 30–60 s. Hence, the peakstresses are an order of magnitude higher than the overall averagestress that is found by averaging over the full area of a growthcone: hσInti ¼ 5.8� 0.3 Pa (mean� STD; n ¼ 119). To studythe spatial distribution of stress, we average over a 10 min timeperiod. This is done by calculating the average over the recordingtime for each pixel. The resulting distribution of stress magni-tudes is presented in Fig. 2B. This analysis reveals that on averagethe stresses are mainly produced at the transition zone and decaytoward the edge. The measured internal stresses at the transitionzone are contractile, as demonstrated by the opposing stressdirections in the enlarged area shown in Fig. 2C. This is consistentwith the forces dipoles generated by Myosin II (27) pulling on twoneighboring actin filaments with opposing force directions. In ad-dition our analysis provides a full quantification of the internalforce amplitude and direction as well as the stress tensors witha spatial resolution that is only limited by the resolution of theunderlying retrograde flow detection. Therefore, we provide apowerful analytic tool to determine forces by simply analyzingthe retrograde flow fields.
Traction Stress of Neuronal Growth Cones. To further validate theobtained values of the internal stress calculation we used tractionforce microscopy (TFM) (22, 28) to independently measure thestresses that are finally transmitted to the substrate by the growthcone. As the traction forces originate from the internal forces, themagnitude of the traction stress should be consistent with themagnitude of the internal stress and therefore provide an inde-pendent control measurement to the presented calculation. TFMmeasures the stress of a growth cone adhered to an elastic poly-acrylamide (PAA) gel substrate by detecting the movement offluorescent beads embedded at the surface of the gel. TheYoung’s modulus of the PAA gel was determined to be EPAA ¼200� 20 Pa using an SFM. To measure integrin mediated trac-tion forces, we coated the PAA gel with laminin. Similar to thecalculation of the intracellular forces, once the elastic parametersof the substrate and its deformation as caused by the growthcones are known, the traction forces can be determined (22, 28).We find that the traction forces act close to the edge of the growthcone (Fig. 3A), where most substrate attachments are found (29).The average peak traction stress of 26.7� 2.6 Pa is in excellentagreement with the determined internal forces. This further sup-ports our finding that growth cones are mechanically soft andweak force generators compared to other cell types such as fibro-blasts [traction force: approximately 1 kPa (30)] or migratingepithelial cells [traction force: approximately 200 Pa (31)], bothhaving elastic moduli in the kilopascal range (18, 19). The lowstresses that we observed for neuronal growth cones are consis-tent with our findings of low elastic strength and low internalforces. Our results indicate that there may be a direct correlationbetween cell rigidity, internal forces, and traction forces coupledto the substrate. We can further speculate about a possible rela-tion between cell rigidity and the preference for certain substraterigidity. Stiff cells such as fibroblasts have been found to preferstiff substrates (32) whereas neurons prefer soft substrates thatare comparable to the elasticity of glial cells (7, 14). However,it should be noted that there are also soft cells such a astrocytesthat prefer growing on stiff substrates (33). Further investigationwill be required to understand to which extend there may be afundamental relation or if these similarities are purely random.
The total stress acting in a growth cone is a combination ofthe internal stress and the traction stress. Because the growthcone exerts traction forces on the substrate, local force balance
Fig. 2. Internal stress within a neuronal growth cone. (A) Distribution of themomentary internal stress field in a neuronal growth cone. The color codinggives the stress magnitude in units of force per area (Pa ¼ pN∕μm2), and theblack arrows indicate the stress direction. Scale bar is 10 μm. (B) Time aver-aged mean stress distribution of a full time series of internal stress fields(t ¼ 10 min). The stress is highest in the transition zone, and decays towardthe edge. (C) A close-up on the central part of the stress field in (A) shows thatthe internal stresses are contractile and arranged like dipoles.
Betz et al. PNAS Early Edition ∣ 3 of 6
BIOPH
YSICSAND
COMPU
TATIONALBIOLO
GY
PHYS
ICS

requires that the growth cone feels exactly the opposite forcesfrom the substrate. As we are interested in the stress acting onthe actin network in the lamellipodium, the traction stress feltby the growth cone is the opposite stress as measured using TFM.Consequentially, to gain the full stress fields of a growth cone, thetraction stress vectors have to be subtracted from the internalstress vectors to yield the total stress acting inside: σTotalð ~xÞ ¼σInternalð ~xÞ − σTractionð ~xÞ. The total stress field arising from ourmodel for the stress generation mechanism is shown in Fig. 3C(see also Movies S4 and S5). The measured traction forces canalso be used to directly determine the neurite pulling force, orneurite tension. As a matter of fact, the sum of the traction stressover the growth cone area does not fully match up, as it should fora stationary object. The reason for this mismatch is that we needto consider the neurite pulling force, which is equivalent to theneurite tension (5, 34). Consequently, the sum up of the tractionstress is a measure of the neurite tension. We find a net force or
neurite tension of FNet ¼ 602� 149 pN, which is in good agree-ment with previously reported values (20, 35).
Summary of the Determined Viscoelastic Forces on the Actin Cytoske-leton. To summarize our findings we propose a simple scheme asshown in Fig. 4. Contractile stresses are generated at the forcefoci in the transition zone (Fig. 2A and Fig. 3C). The viscoelasticactin network in the lamellipodium partially transmits theseforces to the leading edge where the forces are coupled to thesubstrate via adhesion sites, whereas part of the energy is dissi-pated by the viscoelastic deformation of the actin network and thesubstrate clutch. The contractile forces do furthermore compen-sate for the neurite tension that is constantly pulling on thegrowth cone. This neurite tension has been extensively studiedin the literature (10) and it is well known that it originates fromthe contraction of the neurite cytoskeleton (8–10).
The force transmission toward the substrate depends partiallyon the interaction between the actin network and the substrate,which is mediated by actin to integrin force transmission, but alsoby the mechanical properties of the lamellipodium. This clutchmechanism of force transmission has been well documented inthe literature (6, 36–38), but the underlying molecular detailsare yet to be understood. As we show in this work, the actin net-work in the lamellipodium is a viscoelastic material, and hencethe force transmission strongly depends on its viscoelastic proper-ties, a fact that should be considered when investigating the forceclutch mechanism, as not only the actin to integrin connection,but also the actin network itself presents a viscous flow. In thelong time regime (>10 s) the viscous effects dominate, and there-fore any force transmission requires flow. In this view it becomesclear that the actin network in the lamellipodium has to deformsteadily to maintain a constant force transmission to the sub-strate. From a mechanical point of view our results may alsoexplain why even in stationary growth cones a steady and fast ret-rograde flow is observed. Without the continuous polymerizationand viscous flow, the actin network could not sustain the contin-uous neurite tension and would simply disintegrate and loose itssubstrate adhesions. This in turn would lead to a retraction of the
Fig. 3. Traction stress, internal stress, and the combined total stress of a neu-ronal growth cone. (A) Traction stress distribution of a neuronal growth cone.(B) Internal stress field of growth cone shown in A. Contractile stresses arelocalized at the central domain of the growth cone. (C) The total stress fieldof the growth cone reveals that the forces are generated at the central do-main, and the cross-linked actin network transmits the stress to the substrateadhesions in the peripheral region. The black arrow represents the pullingforce with which the neurite is pulling on the growth cone. (A–C) Color codegives stress magnitude in Pa. Scale bar is 10 μm.
Fig. 4. Summarizing scheme of the forces involved in the actin cytoskeletonin growth cone motility. External forces such as neurite tension (black arrow)and the substrate stress (white arrows) are transmitted to the contractingmyosin motors (blue arrows) by the viscoelastic actin networks of the lamel-lipodium and the actin cortex of the neurite. In this model, the effective linkbetween these two types of forces are the force generating myosin motors inthe transition zone.
4 of 6 ∣ www.pnas.org/cgi/doi/10.1073/pnas.1106145108 Betz et al.
whole growth cone, as the pulling forces of the neurite need to bebalanced by transmitting them to the substrate, which requiressufficiently strong lamellipodial rigidity and substrate adhesion.Hence, the steady flow allows even soft viscoelastic structures likethe growth cone to bear the constant tension generated in theneurite.
ConclusionNeuronal growth is a highly specialized type of cell motility thatappears to be mechanically optimized for the movement in softenvironments. The neuronal growth cones’ weak forces and lowelastic stiffness may indicate an important adaptation to the softtissue found in the brain: glial cells provide a soft mechanicalsubstrate with rather small elastic moduli of E approximately300 Pa (14). The passive and active mechanical properties of neu-ronal growth cones investigated in this study provide a plausiblemechanical framework for the preference of neurons for soft sub-strates (7). In addition, our results may explain why it is necessaryto keep the energy consuming retrograde flow running even whenthe growth cone is in a resting phase and does not move exten-sively. Our results suggest that the continuous retrograde flowallows maintaining the substrate traction forces that are requiredto prevent growth cone retraction by the neurite tension. If theflow would cease, the viscoelastic characteristics of the lamellipo-dium would result in a simple relaxation of any transmitted stres-ses within a few seconds, leading to an immediate retraction ofthe whole structure due to neurite tension. Regarding biomecha-nics and force generation, the presented work allows the specula-tion that there may be a fundamental relation between themechanical properties of a growth cone and the mechanical prop-erties of the environment. Growth cone mechanics could there-fore optimize navigation in soft environments, and mechanicscould even be an additional guidance cue on top of all the bio-chemical guidance cues already identified to control neuronalgrowth. Further investigation on the role of mechanics in neuro-nal navigation will yield unique insights into the complex behaviorof neuronal navigation.
Materials and MethodsPreparation of Elastic Polyacrylamide Substrates. A modified version of theprotocol published by Wang and Pelham (28) was used. Briefly, as bottomplate round coverslips (diameter: 20 mm; VWR) were cleaned and thencovered with 400 μL of 0.1N NaOH, which was evaporated using a hotplate.Subsequently, coverslips were covered with 200 μL of 3-aminopropyltri-methoxy silane (Sigma) for 5 min, rinsed with Millipore water and treatedwith 0.5% glutaraldehyde for 30 min to finalize the coating. As nonadherentsurface, microscope slides were pretreated to prevent any adhesion to PAA.After cleaning, a thin film of SurfaSil (Perbio Science) was applied to the slidesusing either a cotton swab or a small cotton cloth. Subsequently, the film wascleaned off using a cotton swab or cloth and the slides were submerged inmethanol to finalize the reactions. The composition of PAA determines theelastic properties of the final gel, and for the presented experiments, 170 μLof 40% acrylamide solution (Sigma) and 30 μL of 2% bis-acylamid (Sigma)were added to 1,750 μL PBS, yielding a final concentration of 3.5% acryla-mide and 0.03% bis-acrylamide. Fluorescent beads were embedded intothe gel by addition of 20 μL bead solution (Fluo Sphere, 100 nm diameter,2%, Molecular Probes). Polymerization was started by adding 8 μL of 10%(w∕v) ammonium persulfate (Sigma) and catalyzed by 12 μL of N,N,N’,N’-tetramethylethylenediamine (Sigma). A drop of 14 μL solution was addedonto the inert microscope slides and the silanized coverslips were put ontothe drop, with the treated side down. The polymerization finished within30 min. Using scanning force microcopy (SFM), the elasticity of the gelwas measured to be EPAA ¼ 200� 20 Pa.
For surface modification, 1.5 μg Sulfo-SANPAH (Perbio Science) wasdissolved in 20 μL DMSO, and then 1980 μL of a 20 mM Hepes solution witha pH of 8.5 was added to the solution. One hundred microliters of the finalsolutionwere added to each of the PAA gels, which were subsequently storedin the dark for 30 min and then photoactivated for 5 min using a strong UVlamp (Model B, Blak-Ray). The activated solution was carefully washed offusing 20 mM Hepes solution. After washing three times with PBS, 100 μLpoly-L-lysine (Sigma) was added to each gel and stored at 4 °C over night.Finally, gels were washed three times in PBS, and 100 μL of a 40 μg∕mL
laminin (Sigma) solution were applied to the gels. Gels with laminin wereincubated at 37 °C for 1 h, washed with PBS, then stored at least 24 h in cellculture medium for equilibration before cells were plated.
Cell Culture and Image Acquisition. Details are given in SI Text.
Microrheology. The methods used to determine the viscoelastic properties ofneuronal growth cones have been described in detail before (13, 14). Briefly,we used a 5.6 μm diameter bead that was glued on the SFM cantilever andapplied a sinusoidal force on the lamellipodium with a given frequency(Fig. 1, Inset). The applied forces and the resulting deformation were mea-sured and the in and out of phase components were acquired using a lock-inamplifier (13). The final viscoelastic modulus for each frequency was deter-mined by fitting the data to a viscoelastic model that takes into account thethickness of the lamellipodium, as previously discussed in the literature(13, 18).
Traction Force Microscopy. After recording the time series of GFP-actin trans-fected growth cones and fluorescent tracer particles embedded in the PAAgel, growth cones were removed using a combination of 0.5% trypsine and0.5% Tween 20 (Sigma), and a reference image of the relaxed PAA gel wasrecorded. The deformation between the time-series images and the refer-ence image was calculated using a cross correlation algorithm implementedin LabView (National Instruments) and Matlab (MathWorks). Finally, tractionstresses were calculated following the unconstrained deconvolution methodas presented in (22). The analysis method was successfully verified by repro-ducing an applied lateral force of 1 nN using SFM.
AppendixTo gain the forces that drive retrograde actin flow, we extendedlinear elasticity theory (39) to the viscoelastic regime. Viscoelas-ticity connects the stress σ and the strain u using the characteristicmemory function, or relaxation modulus E(t) that contains infor-mation about both viscous and elastic material characteristics. Ifthe stress resulting from a known deformation is sought, theBoltzmann superposition principle is useful (40):
σðtÞ ¼Z
t
−∞Eðt − τÞ du
dτdτ; [2]
where _u ¼ du∕dt is the strain rate. If the time dependent relaxa-tion modulus E(t) and u(t) are known, the time dependent stresscan be calculated. In 3D, it is necessary to change to a tensorialdescription. The linear strain tensor uij is calculated at each pointin the object from the deformation vector ~u by
uij ¼1
2
�∂ui∂xj
þ ∂uj∂xi
�: [3]
The pure elastic material properties can be described by theYoung’s modulus E and the Poisson ratio ν to calculate the stressby
σij ¼E
1þ ν
�uij þ
ν
1 − 2νukkδij
�: [4]
Recalling the Boltzmann superposition principle (Eq. 2), thetime dependent stress can be calculated by
σijðtÞ ¼Z
t
−∞
Eðt − τÞ1þ ν
�duijdτ
þ ν
1 − 2ν
dukkdτ
δij
�dτ: [5]
In a final step we calculate the internal force vectors using thelocal equilibrium condition that requires that any spatial stressgradient has to be balanced by an internal force:
f inti ¼ −∂σik∂xk
: [6]
ACKNOWLEDGMENTS. We thank Jacques Prost, Klaus Kroy, Ulrich Schwarz,and Iva Tolic-Norrelykke for helpful discussions. This work was supported
Betz et al. PNAS Early Edition ∣ 5 of 6
BIOPH
YSICSAND
COMPU
TATIONALBIOLO
GY
PHYS
ICS
by the Deutsche Forschungsgemeinschaft-Graduiertenkolleg Interneuro,Specific Targeted Research Project of the European Union, called Active
Biomics, the Alexander von Humboldt Foundation [Feodor Lynen ReturnFellowship (K.F.)], and Ms. Marianne Duda.
1. Chilton JK (2006) Molecular mechanisms of axon guidance. Dev Biol 292:13–24.2. Franze K, Guck J (2010) The biophysics of neuronal growth. Rep Prog Phys 73:094601–
094619.3. Lin CH, Espreafico EM, Mooseker MS, Forscher P (1996) Myosin drives retrograde
F-actin flow in neuronal growth cones. Neuron 16:769–782.4. Mallavarapu A, Mitchison T (1999) Regulated actin cytoskeleton assembly at filopo-
dium tips controls their extension and retraction. J Cell Biol 146:1097–1106.5. Heidemann SR, Lamoureux P, Buxbaum RE (1990) Growth cone behavior and produc-
tion of traction force. J Cell Biol 111:1949–1957.6. Chan CE, Odde DJ (2008) Traction dynamics of filopodia on compliant substrates.
Science 322:1687–1691.7. Flanagan LA, Ju YE, Marg B, Osterfield M, Janmey PA (2002) Neurite branching on
deformable substrates. Neuroreport 13:2411–2415.8. Joshi HC, Chu D, Buxbaum RE, Heidemann SR (1985) Tension and compression in the
cytoskeleton of PC 12 neurites. J Cell Biol 101:697–705.9. Ahmad FJ, et al. (2000) Motor proteins regulate force interactions between microtu-
bules and microfilaments in the axon. Nat Cell Biol 2:276–280.10. Baas PW, Ahmad FJ (2001) Force generation by cytoskeletal motor proteins as a
regulator of axonal elongation and retraction. Trends Cell Biol 11:244–249.11. Ji L, Lim J, Danuser G (2008) Fluctuations of intracellular forces during cell protrusion.
Nat Cell Biol 10:1393–1400.12. Juelicher F, Kruse K, Prost J, Joanny JF (2007) Active behavior of the Cytoskeleton.
Phys Rep 449:3–28.13. Mahaffy RE, Park S, Gerde E, Kas J, Shih CK (2004) Quantitative analysis of the viscoe-
lastic properties of thin regions of fibroblasts using atomic force microscopy. Biophys J86:1777–1793.
14. Lu YB, et al. (2006) Viscoelastic properties of individual glial cells and neurons in theCNS. Proc Natl Acad Sci USA 103:17759–17764.
15. Wottawah F, et al. (2005) Optical rheology of biological cells. Phys Rev Lett 94:098103.16. Miller K, Chinzei K, Orssengo G, Bednarz P (2000) Mechanical properties of brain tissue
in vivo: Experiment and computer simulation. J Biomech 33:1369–1376.17. Christ AF, et al. (2010) Mechanical difference betweenwhite and graymatter in the rat
cerebellum measured by scanning force microscopy. J Biomech 43:2986–2992.18. Mahaffy RE, Park S, Gerde E, Kas J, Shih CK (2004) Quantitative analysis of the viscoe-
lastic properties of thin regions of fibroblasts using atomic force microscopy. Biophys J86:1777–1793.
19. Brunner CA, et al. (2006) Cell migration through small gaps. Eur Biophys J 35:713–719.20. Dennerll TJ, Joshi HC, Steel VL, Buxbaum RE, Heidemann SR (1988) Tension and com-
pression in the cytoskeleton of PC-12 neurites. II: Quantitative measurements. J CellBiol 107:665–674.
21. Bernal R, Pullarkat PA, Melo F (2007) Mechanical properties of axons. Phys Rev Lett99:018301.
22. Butler JP, Tolic-Norrelykke IM, Fabry B, Fredberg JJ (2002) Traction fields, moments,and strain energy that cells exert on their surroundings. Am J Physiol Cell Physiol282:C595–605.
23. Lee J, Jacobson K (1997) The composition and dynamics of cell-substratum adhesions inlocomoting fish keratocytes. J Cell Sci 110((Pt 22)):2833–2844.
24. Danuser G, Waterman-Storer CM (2006) Quantitative fluorescent speckle microscopyof cytoskeleton dynamics. Annu Rev Biophys Biomol Struct 35:361–387.
25. Betz T, Koch D, Lim D, Kas JA (2009) Stochastic actin polymerization and steady retro-grade flow determine growth cone advancement. Biophys J 96:5130–5138.
26. Medeiros NA, Burnette DT, Forscher P (2006) Myosin II functions in actin-bundle turn-over in neuronal growth cones. Nat Cell Biol 8:216–226.
27. Bridgman PC, Dave S, Asnes CF, Tullio AN, Adelstein RS (2001) Myosin IIB is required forgrowth cone motility. J Neurosci 21:6159–6169.
28. Wang YL, Pelham RJ (1998) Preparation of a flexible, porous polyacrylamide substratefor mechanical studies of cultured cells. Methods Enzymol 298:489–496.
29. Gatlin JC, Estrada-Bernal A, Sanford SD, Pfenninger KH (2006) Myristoylated, alanine-rich C-kinase substrate phosphorylation regulates growth cone adhesion and path-finding. Mol Biol Cell 17:5115–5130.
30. Dembo M, Wang YL (1999) Stresses at the cell-to-substrate interface during locomo-tion of fibroblasts. Biophys J 76:2307–2316.
31. Gardel ML, et al. (2008) Traction stress in focal adhesions correlates biphasically withactin retrograde flow speed. J Cell Biol 183:999–1005.
32. Lo C-M,WangH-B, DemboM,Wang Y-li (2000) Cell movement is guided by the rigidityof the substrate. Biophys J 79:144–152.
33. Georges PC, Miller WJ, Meaney DF, Sawyer ES, Janmey PA (2006) Matrices with com-pliance comparable to that of brain tissue select neuronal over glial growth in mixedcortical cultures. Biophys J 90:3012–3018.
34. Bray D (1979) Mechanical tension produced by nerve cells in tissue culture. J Cell Sci37:391–410.
35. Bernal R, Melo F, Pullarkat PA (2010) Drag force as a tool to test the active mechanicalresponse of PC12 neurites. Biophys J 98:515–523.
36. Mitchison T, Kirschner M (1988) Cytoskeletal dynamics and nerve growth. Neuron1:761–772.
37. Suter DM, Forscher P (2000) Substrate—cytoskeletal coupling as a mechanism for theregulation of growth cone motility and guidance. J Neurobiol 44:97–113.
38. Moore SW, Biais N, Sheetz MP (2009) Traction on immobilized netrin-1 is sufficient toreorient axons. Science 325:166.
39. Landau LD, Lifschitz EM (1986) Theory of Elasticity (Pergamon, Oxford).40. Lakes RS (1998) Viscoelastic Solids (CRC, Boca Raton).
6 of 6 ∣ www.pnas.org/cgi/doi/10.1073/pnas.1106145108 Betz et al.