GROWTH COMPETING FROM AUSTRALIA
104
58 GROWTH CEDA GROWTH NO 58 JULY 2007 COMPETING FROM AUSTRALIA SUPPORTED BY
Transcript of GROWTH COMPETING FROM AUSTRALIA
58GROWTH
CEDA GROWTH NO 58 JULY 2007
COMPETING FROM AUSTRALIA
SUPPORTED BY


COMPETING FROM AUSTRALIA

About this paper
Growth 58: Competing from AustraliaISBN 0-85801-269-3ISSN 0085-1280
© Committee for Economic Development of Australia 2007
The views expressed in this paper are solely those of theauthor and should not be attributed to CEDA. CEDA’s objectivein publishing this paper is to encourage constructive discussionon matters of national, economic and social importance.Persons who act in reliance upon the material publisheddo so at their own risk.
The research for this project was coordinated by CEDA’sResearch Director, Dr Ian Marsh, and CEDA’s Policy andCommunications Director, David Walker.
This document has been prepared by CEDA’s Policyand Communications Department. Please direct commentsand suggestions to David Walker.
Copy editing: Margaret TrudgeonDesign: Robyn Zwar Design/Mary Callahan DesignPrinting: Braemar GraphicsCover photography: istockphoto.com
All contributions to this publication have been independentlyrefereed prior to publication.
About CEDA
CEDA (the Committee for Economic Development of Australia)connects leaders of Australian organisations to promoteAustralia’s economic development.
CEDA’s activities: CEDA holds more than 250 events,seminars and chief executive roundtables each year, and publishes a range of research papers.
CEDA’s mission: CEDA’s research and forums identify andexplore issues that influence the nation’s long-term economicand social development.
CEDA’s reach: CEDA draws its members, which numberaround 1000, from businesses, universities, governments andthe not-for-profit sector. During 2006 CEDA’s economic andbusiness events attracted more than 21,000 people.
CEDA’s independence: CEDA advocates policy in the nationalinterest, rather than lobbying on behalf of special interestgroups. It is staunchly non-partisan. CEDA’s funding comesfrom membership, events, grants and sponsorship.
Committee for Economic Development of AustraliaLevel 5/136 Exhibition StreetMelbourne 3000 AustraliaTelephone: (61 3) 9662 3544Fax: (61 3) 9663 7271Email: [email protected]: ceda.com.au
1COMPETING FROM AUSTRALIA
Foreword 3David ByersCEO CEDA
1. Summary 4CEDA
2. Distance – A key to Australia’s economic dilema 6Geoffrey BlaineyAustralia’s most eminent historian
3. A new generation of policy questions 10Professor Ian MarshResearch Director, CEDA
4. Can distance be defeated 18Professor Glenn Withers, AOProfessor of Public Policy, Crawford School of Economicsand Government, Australian National University
5. Export weakness, investment strength 28Dr John EdwardsChief economist HSBC, Australia
6. Competing through innovation 42Professor Roy GreenDean of the Graduate School of Management, Macquarie University
7. Innovation and growth in resource-based economies 50Professor Keith SmithChair in Innovation, University of Tasmania
8. Australia’s capability for systems integration 58Dr Thomas BarlowBusiness and research strategy consultant, Barlow Advisory
9. Multinational companies in Australia 66Andrew McCredieGlobal Opportunities Branch, Department of Industry, Tourismand Resources.
10. Global chains 84Professor John HoughtonProfessorial Fellow, Centre for Strategic Economic Studies(CSES), Victoria University
11. Appendix: Australia's 50 global leaders 98
contentscontentscontributorsand

Sponsor and contributor acknowledgements
CEDA would like to acknowledge the generous contributionsof the following organisations and individuals to theCompeting From Australia project.
Research sponsors
Export Finance and Insurance Corporation (EFIC) is a specialised financial services organisation supportingAustralian businesses exporting and investing overseas byproviding finance, finance guarantees, insurance and bondingfacilities. As well as working directly with exporters, it worksclosely with commercial financiers to support exporters.
Invest Victoria is responsible for attracting productive foreign direct investment into Victoria, and for promoting the state internationally as a world class investment location.It is a focus for the Victorian Government’s investmentattraction initiatives, providing quality services to investorclients in Australia and off-shore, as well as coordinating a range of investment and re-investment initiatives andprocesses within Government.
Research guidanceCEDA’s Research & Policy Committee has overseen the Competing From Australia project:
• Professor Percy Allan AM• Mr David Byers• Professor Peter Drake AM• Mr Saul Eslake• Mr John Harris• Professor Ian Marsh• Professor John Nevile• Professor John Nieuwenhuysen• Dr Suzanne Rickard• Mr Phil Ruthven• Mr David Walker• Ms Marina Williams-Wynn• Professor Kenneth Wiltshire• Professor Glenn Withers
Growth 58 text 21/6/07 12:34 PM Page 2
3COMPETING FROM AUSTRALIA
This CEDA collection of papers isone of our most ambitious. Likeseveral CEDA collections over our47 years’ existence, it seeks to plotout the economic frontiers for pol-icymakers, businesspeople and
citizens. It is the product of more than 18 months’ workby CEDA’s expert authors, staff and a number of CEDAtrustees and advisors.
The authors come from a wide variety of institutions,businesses and government bodies. Yet their ideas meshat many points. Competing From Australia unites afamiliar theme in Australian economic history – thetyranny of distance – with a number of new ideas aboutglobal connectedness and innovation. It seeks to ensureAustralia continues to engage more deeply with the restof the world, and to stay at the leading edge of economicactivity. It points to Australia’s recent economic andpolicy successes, including some – such as our success inraising our foreign direct investment – that have gonelargely unnoticed until now. But it also asserts that thereremains room to improve our performance further.
This project once again underlines the strength CEDAgains from its membership and from many of Australia’sleading public policy thinkers. It gained early focus andinsight from a CEDA reference group which broughttogether a number of leading CEDA trustees and outsideexperts in late 2005. It was this group which first high-lighted the rising significance of global supply chains.
Many of our authors also collaborated at a SydneyRoundtable in 2006, and the project’s themes emergedfurther there. As always, we owe a great debt to ourauthors for their generous contribution of time andideas.
We are also indebted to CEDA’s Research and PolicyCommittee and our Research Director, Professor IanMarsh, for their work on the project. Professor GlennWithers, head of our ACT advisory council and oneof Australia’s most distinguished economists, deserves aspecial mention both for his contribution as an authorand for his intellectual guidance throughout the project.
The papers already released as part of Competing FromAustralia have been well received. A great manyAustralians clearly share CEDA’s goal: to find ways,through debate and discussion, to continue and accel-erate Australia’s economic development.
David ByersChief Executive Officer, CEDA
forewordforeword

4
1
CEDA GROWTH 58
summarysummary
At the start of the 21st century, world economic production is yet again transforming. Several factors previously regarded as minor are becoming rapidly more important: cross-firm collaboration, world-scaleproduction efficiency, integration into global supplychains dominated by multinational corporations, anddirect communication between team members located in the same office, city or region. The common theme isincreasing connectedness between different firms,between different locations, and between people.
These changes challenge Australia. Distance and scale,in particular, loom as issues for Australia.
It is often suggested that advances in telecommunica-tions are making distance and scale less important andconnectedness less of a challenge – that “distance is dead”and that, as one popular book has put it, the globaleconomic playing field is now “flat” or at least flattening.

5COMPETING FROM AUSTRALIA
However, recent economic theory and data suggeststhe opposite – that “the tyranny of distance” has notabated and will continue into the future, and thatAustralia cannot rely on technological advances alone totie us more strongly into the world economy.
Australia can, however, take advantage of industry andtechnological trends which minimise or avoid the effectsof distance and scale. Australia already appears to betaking advantage of skills developed in response toAustralia’s small domestic market size and distance frommarkets - most notably its strongly developed businessservices sector and its “generalist” skills such as the abilityto integrate existing components into systems.
To engage more closely with the evolving world econ-omy, Australia will also need to:
• maximise its ability to interact with world markets;
• excel at remote delivery, supply chain management andlogistics;
• foster innovation, particularly in so-called “traditional”industries, including those industries that rely on theresources sector;
• minimise communications and transport costs;
• continue to emphasise economic openness and flexibility;
• continue to build human capital, both through immi-gration and through investment in education and skills;and
• continue to support inward and outward foreign directinvestment as well as trade.
Australia cannot rely on technological
advances alone to tie us more
strongly into the world economy.

From 1968 to 1988 GEOFFREY
BLAINEY was first Professor of
Economic History and then Ernest
Scott Professor of History at the
University of Melbourne; in 1982–83
he was Professor of Australian Studies at Harvard University.
His 1966 book The Tyranny of Distance was a landmark account
of Australia’s economic evolution. His other books include Triumph
of the Nomads, a prehistory of Aboriginal Australia; The Rush That
Never Ended: A History of Australian Mining and A Short History
of the World.
6
It is fascinating to read the essays here and to see thatdistance more often than not is deemed to be importantas an economic factor. Some of these essays view thetyranny of distance as a continuing liability. Indeed, theMacro Dynamics Unit of the Australian Treasury –whose work on distance is cited by Glenn Withers in thisvolume – argues that it is “unlikely that the costs ofdistance can ever be completely overcome”.
2
CEDA GROWTH 58
dilemma
distanceeconomicA K E Y T O A U S T R A L I A’ S
distance
© L
OUI S
ESEL
JA

7COMPETING FROM AUSTRALIA
When I coined the phrase “the tyranny of distance” forthe name of a book in 1966, I did not foresee how thepithy phrase would travel. The phrase had a looseness, aslightly abstract air, and that looseness enabled it to beused widely, serving all kinds of purposes. On the otherhand, the imprecision in the phrase led easily to misun-derstanding, and sometimes the phrase or slogan wasmisused. For example, many commentators said that fora long period it was the “tyranny of distance” whichretarded the flow of new ideas to Australia. But my view– I could be wrong – was that distance had far moreeffect on retarding the flow of commodities and peoplethan of ideas. While observing and even apologising thatthe phrase gives rise to misunderstanding, it says – atleast in my view – something important about Australia.
In its first 20 years, the book was reprinted on averageonce a year, and gave rise to intense debate among histo-rians. Their interest was in chapter 2 and especially onmy argument that distance as a factor threw strong lighton why Australia was settled by the British in 1788.However, the book, did not have an impact on mosteconomists, partly because it was not speaking theirlanguage. Admittedly, the transport economists, like the
geographers, were pleased to annex the phrase “tyrannyof distance”, but my attempt to analyse the origins of thebreak of gauge in the railways, and that break’s con-trasting effects on the economy in the short term andlong term, was not widely read. In hindsight, there wasanother valid reason why economists did not worryabout the book itself. Most Australian industries andprofessions already knew in general whether distance wasimportant or not to their well-being. Many knew farmore about distance in their particular realm than Icould possibly know.
The general economists were less interested in distanceas a concept. Even the book’s latest updating in 2001,when I added more pages pointing out how distance wasstrongly affecting the increasingly prominent service
PHOTO: iSTOCK
Some of these essays view
the tyranny of distance as
a continuing liability.

8
sector of Australia’s economy, had little impact. To thebest of my knowledge, it was hardly commented onpublicly by anybody in the next couple of years. And yetsomehow the phrase itself still lived on. I am not com-plaining: the book and its central idea has had a longinnings.
An important part of the concept of The Tyranny ofDistance is still relevant, as at least half of the essays inthis collection maintain. Several vividly point to thescatter or dispersal of population within Australia, and toits adverse economic effects. Where else, they ask, willyou find such a distance between the major cities? Onemight also ask the pertinent question: where else – exceptmaybe Siberia and Canada – would you find such crucialnational industries operating so far from a major city?Fortunately, as pointed out in this volume, Australia pos-sesses one notable concentration or clustering ofpopulation, even if it is not an intensive cluster byEuropean, North American or East Asian standards.
Michael Porter’s book of 1990 The CompetitiveAdvantage of Nations, placed innovative emphasis on therole of clusters in driving economic development. Aversion of “clustering” was one of the themes of TheTyranny of Distance, though the word and the intricaciesof its economic mechanism were unknown to me. Thebook pointed out that in 1966 the core of Australia’seconomy and the heartland of its population extendedaround the coast and a narrow hinterland that ran all theway from Brisbane past Sydney and Melbourne andAdelaide to Port Pirie. I should have added Whyalla and,perhaps even then, the Sunshine Coast. I christened itthe Boomerang Coast because of its shape, and pointedout that it held less than one-tenth of the nation’s areaand less than half of the nation’s natural resources(which, in retrospect, was a very rough guess), and yet itheld eight of every ten people. Chapter 6 concluded withthe sentences:
Through the concentration of population on the BoomerangCoast, Australia spends much less of its energy in carryinggoods and supplying services over vast distances. Its standardof living and its ability to support a larger population aremuch higher than if its main economic activities and itspopulation had been scattered around the rim of the conti-nent. The Boomerang Coast, and the dominant cities onthat coast, were the simplest solution to the problem ofdistance.
Interestingly, in the last 40 years, with the proportion-ately faster growth of Western Australia and Queensland,the Boomerang coast is not quite so dominant.
Elsewhere, but not in The Tyranny of Distance, I coinedthe phrase “the mating of resources” in an attempt todescribe how in certain areas the juxtaposition or clus-tering of very different resources, side by side, conferredbenefits on each resource or economic activity. TheBallarat district was probably the most successful zone of
CEDA GROWTH 58
inland development in the whole continent up to 1900,largely because of this mating and multiplying ofresources. Much of that district’s poorer, gold-bearingdeposits might not have been extracted at a profit exceptfor the fact that the cost of living and the general miningcosts at Ballarat were relatively low. Thus, at Ballarat thetimber for the mine props and the fuel for the steamboilers and their huge pumping engines came in massivequantities from nearby forests. As the forests were near,the firewood and timber were cheaper. In turn, theclearing of the forests laid open fertile land to smallfarms, which in turn helped to provide cheap food; thefoodstuffs being the largest component of the cost ofliving and indirectly of the miners’ wages. The ring offarms around Ballarat made it even more of a regionalcentre and service city than a mining city by the 1870s,and the aggregation of engineering skills required by themines gave rise to foundries and other industries thatserved one of the first Australian cities to make steamlocomotives. This is a highly simplified version of acomplex process of interaction seen especially at Ballaratand Bendigo, but far less important at remote BrokenHill and Kalgoorlie, with their arid soils and remotenessfrom the coast.
In contrast, a characteristic of today’s huge miningindustry is that it rarely gives rise to the mating ofresources. The fly-in, fly-out workforce, and the smallpopulation of the actual mining fields, is the new trend.Fly-in is as much an effect as a cause of the economicinsulation and the lack of clustering benefits of the latestgeneration of mining fields.
The service sector, now the employer of about 75 percent of the labour in Australia, obviously depends on amating process. Its resource endowment is not gold orpasture or arable soil. To some degree its resource isknowledge and information, both low grade and highgrade, if you like to use mining terminology. Informationis one of the new gold rushes, and presumably obeysseveral of the same economic laws, of which the price oftransport is one. In other words, distance is one determi-nant of whether the new information technology willreally flourish, creating jobs and wealth in one town orregion rather than another, or in one nation rather thananother.
It is understandable that alert
observers should argue that in the
last ten years the world has shrunk,
that distance is no longer decisive.

Is distance, once such an obstacle, now less important?It is understandable that alert observers should argue thatin the last ten years the world has shrunk, that distance isno longer decisive. Thomas Friedman’s book The Worldis Flat has won a vast audience for this proposition.Slightly earlier, Rupert Murdoch, with an almost unpar-alleled knowledge of the new and old media, announcedthat “the tyranny of distance” – this was the phrase heused – was dead. In 1997, in the UK, Frances Cairncrosscompleted an illuminating book, The Death of Distance,which predicted that the decline of distance will“probably be the single most important force shapingsociety” in our time. Part of what these trans-Atlanticobservers have predicted will probably occur. In thesemomentous times, numerous barriers are toppling. Whatthe observers don’t say, or say less emphatically, is that innearly every momentous change there are losers as well asgainers, and that certain nations, industries and citiesgain far more than others.
9COMPETING FROM AUSTRALIA
Many go-ahead observers insist that
… distance is dead. But Australia,
a first-rating testing ground of this
theory, seems to prove otherwise.
Is Australia a loser, relatively? The view of some distin-guished economists writing in this volume is thatAustralia in recent years has suffered because of distance– and the relative weakness of its economic clusteringinside the country. Perhaps because Australians have tra-ditionally been conscious of distance they are quick tonotice what their nation gains from the new communi-cations technologies and their assault on distance. Wethink we are gaining, compared to rival nations, in mostfacets of the assault, but maybe we are not. Australiagains much from, say, the communications revolution –mobile phones are almost an infection – and rejoices inthe visible effects. But its comparative economic gainfrom this network of allied industries, with their vastramifications, is perhaps not as large as the gains made bysome other countries with specific geographical advan-tages. According to Professor Houghton, “On many ofthe indicators of globalisation, Australia scores relativelylow”, and this applies especially to global productionsystems. One of the intriguing statistics cited in theseessays is that between 1995 and 2003, Australia’s share inthe world’s total export of services fell by 13 per cent.And yet that statistic is not easily analysed. Such majoreconomies as Italy, France and Japan experienced evenlarger falls in their share of service exports.
Many go-ahead observers insist that, in the era of theInternet and satellite, distance is dead. But Australia, afirst-rate testing ground of this theory, seems to proveotherwise.

10
Australia’s recent economic performance has been, onmost measures, outstanding. After such a protractedperiod of exceptional results it may seem churlish tobegin searching for new ways to speed up growth. But itis arguably best to search for new policy improvementsbefore medium-term economic growth slows. Seasonedobservers, notably the Governor of the Reserve Bank,have wondered out loud if there is not the need for a newimpetus.1 Saul Eslake, Chief Economist of the ANZBank, has been more explicit. He has charged the gov-ernment with wasting the windfall revenue gains fromthe resources boom. The Economist recently concluded:“Without further policy reform, the Australian kangaroorisks turning into a sleepy koala” (31 March 2007, p. 74).
3
CEDA GROWTH 58
PROFESSOR IAN MARSH is CEDA’s
research director and holds the
ANZSOG Chair of Public Manage-
ment at the University of Sydney.
Former appoint-ments included the
Research School of Social Sciences, ANU and the Australian
Graduate School of Management. He has also worked as research
director for the Liberal Party Federal Secretariat and as a
consultant with McKinsey & Company. His recent books include:
Globalisation and the People (2007); Into the Future: The Neglect
of the Long term in Australian Politics (2006), and Democracy
Governance and Regionalism in East and South East Asia (2006).
generationgenerationpolicy
A NEW
questions
OF

11COMPETING FROM AUSTRALIA
This year’s World Competitiveness Yearbook 2007 alsoemphasised Australia’s long-term economic developmentchallenge. Out of 55 countries, Australia scored poorlyon a number of economic infrastructure measures,including Internet costs (42nd), mobile telephone costs(38th) and availability of various types of skilled labour,such as qualified engineers (40th). It ranked only 12thfor education, 20th for scientific infrastructure and 21stfor technological infrastructure. Overall, Australiaranked 16th on economic infrastructure, just up from2006’s 17th position.
The need to renew Australia’s economic reformprogram was emphasised in CEDA’s earlier studies ofInnovating Australia (Growth 53) and Infrastructure –Getting on with the job (Growth 54). These reviews sug-gested that the current microeconomic reform agendahas realised the majority of its potential gains. Most ofthe policy changes associated with deregulation havebeen implemented – indeed, our recent performance tes-tifies to their cumulative impact. But different, oradditional, policy frameworks have been adopted inother relatively small, resource-intensive and openeconomies, such as Denmark, Sweden and Finland, and
their economic performance has equalled and, morerecently, surpassed, that of Australia. To the extent thatpolicy influences outcomes, it is hard to argue thatAustralia’s current strategy is the only or the bestapproach – or that it exhausts what might be done.
This consideration is reinforced by the papers in thiscurrent collection. Save for one contributor, they alladvocate a renewal of policy reform. However, their rec-ommendations vary. They approach the need for a freshpolicy effort from three overlapping (and potentiallycomplementary) perspectives: one perspective draws onthe features of our general economic circumstances,including new interpretations of the “tyranny ofdistance” and the recent deterioration in our export per-formance; a second approaches the need for new policyeffort from the perspective of innovation; and a third istaken from the perspective of the role of MNCs in globaltrade and R&D.
Deregulation and micro-economic reform involvewhat might now be seen as the first wave in the interna-tionalisation of the Australian economy. But they do notend the story. This first phase was powerfully based on
PHOTO: iSTOCK

12
paradigms drawn from neo-classical economic theory.The basic idea was that domestic and internationaleconomic arrangements should, as much as possible, useunfettered markets. In this perspective, exchange andcoordination are best achieved through arm’s length pricemediated transactions. Some also argue that this is thebest path to growth and dynamic efficiency. And someargue that, even in cases of market failure, interventionsby governments are likely to produce third-best or worseoutcomes. This is because of the risk of relevantprograms being captured by favoured interests. Australia’srecent success in rolling back protectionist and other reg-ulatory frameworks would seem to call this latterargument into question, at least as an unqualified gener-alisation.
More generally, in a neo-classical perspective, marketforces will drive down costs to an economically efficientlevel and market exchanges will allocate resources andpeople to their most productive uses. In Australia’s case,the elimination of tariffs, the floating of the exchangerate, the introduction of a vigorous competition regimeand, most recently, labour market reform, have all drawnon this theoretical tradition. Of course, the idea thatmarket signals could carry the entire policy load wasacknowledged as a gross simplification even by themarket-oriented reformers of the 1980s and 1990s. Inpractice, market failure was widely acknowledged. Inresponse, a variety of subsidies and incentive paymentshave been maintained. On some issues, coordination ofactivity or allocation of scarce resources has been orches-trated through governance rather than markets.
Transaction costs were also recognised as a criticaldeterminant of performance, costs that are often no lessimportant than direct production costs. Hence wide-spread programs of privatisation and commercialisationwere introduced, particularly involving public utilities.In general, Australia’s transformation in the post-1983period was a remarkable episode of national policychange. In just over a decade, policies, frameworks andapproaches that had guided national economic develop-ment broadly since 1909, were completely jettisoned.
Unfettered markets remain critical in efficient resourceallocation and ensuring that competitiveness is nothobbled by transaction costs. But other approaches meritassessment at this point in the reform process. Concernover Australia’s level of global engagement is just onefactor driving a fresh look at policy. Another factor is thepotential shift in industry structure that will result froman extended period of high commodity prices, a shiftexplored in a notable recent speech by Treasury SecretaryKen Henry2.
In addition, theoretical perspectives that complement,and in important respects qualify, the neo-classicalapproach to “best” strategies for building performancehave also emerged in recent years. They offer grounds forthinking about policy needs, instruments and settings
that encompass, but extend beyond, market failure.Because some grounding assumptions cut across those inthe neo-classical framing, these newer paradigms presentparticularly acute problems of assessment and evaluation.One perspective involves the international economy –and argues for the importance of multinational corpora-tions (MNCs) as primary gatekeepers in theinternational trading system. This analysis, based inpolitical economy, notes that some two-thirds of worldtrade passes through MNCs, either directly or via supplychains. These transactions are far from the textbookmodel of arm’s length, price mediated exchanges.Further, approximately one-third of private R&D is con-ducted by MNCs. States can seek to create infrastructuresand capabilities to attract this activity in the same way asthey now seek to entice MNC investment.
The second more recent theoretical paradigm concernsinnovation – and recognises the role of collaboration andlinkage in driving superior performance at the firm level.This framing holds the potential to change a number ofcurrent approaches to economic management (see e.g.Lipsey, Carlaw & Bekar, 2005). Innovation strategy inAustralia is currently primarily based on a linear, science-push conception of the process.3 This continues to berelevant. But science-based industries account for a tinyproportion of overall economic activity, generating pro-portionately very little employment or investment. Theyremain small proportions even of economies such as theUnited States, where high-tech sectors are largest andmost robust. In fact, most innovation occurs in estab-lished manufacturing and service industries.
The most challenging aspects of innovation theoryconcern the role of the state in facilitating upgrading andcontinuous knowledge development in these establishedareas of activity. There is at least one classic and home-grown example of this approach, involving the Australianwine industry. As its performance illustrates, collabora-tion around knowledge development can yield outcomessuperior to those available from the operation of marketforces alone, with the important proviso that this needsto work with the grain of markets. But the very successof this industry invites attention to the unique capabili-ties and knowledge infrastructures it has developed, andto the contribution of federal and state governments tothese outcomes.
All three segments in this collection of papers raisefresh questions about the strategic and catalytic role ofgovernments in facilitating economic activity. As already
CEDA GROWTH 58
Concern over Australia’s level of
global engagement is just one factor
driving a fresh look at policy.

13COMPETING FROM AUSTRALIA
noted, those in the first part propose a new salience forcommunications, transport and educational strategiesand for export development. Meantime the papers con-cerned with innovation and MNCs present, if anything,deeper challenges to current policy settings. All theseissues are currently being considered by Australia’s federaland state governments – with, it must be said, conspicu-ously variable energy. This collection asks if theirsignificance and/or implications are being adequatelyrecognised.
The first part of this collection looks at the implica-tions of the recent deterioration in aspects of oureconomic performance. In particular, the impact of geo-graphic location on trade performance and theimplications of recent developments affecting theexternal account are explored. A recent Treasury reviewsuggests that, allowing for the impact of distance,Australia’s export performance in manufactures andservices is actually above what might have been expectedfrom a country of our economic size and geographiclocation. Glenn Withers endorses this approach and citeswork that suggests the impact of distance, far fromdiminishing, is actually rising. This licenses fresh atten-tion to policy settings. In deciding what strategies areappropriate, Withers suggests we need look no furtherthan those which framed the very high levels of pros-perity that marked the latter part of the nineteenthcentury:
It is little known and little understood that Australia’searlier achievement as world’s best practice by 1890 sprangnot just from the luck of possession of natural resources. Itwas also the result of having the most skilled, educated andurbanised work force in the world and the most innovativepopulace. Australia spent more on education across more ofits people than any other country; it chose its migrants care-fully for their skills and it had the highest per capita patentsof any country.
The need now is to augment the policy framework.Withers suggests a wide-ranging agenda aimed at aug-menting human and knowledge capital. Attention tocommunications technologies and transport corridors isalso an imperative. More generally, domestic fertility and
skilled migration both need to be emphasised. Family-friendly policies that allow women (or men) to linkcareer and family development need to be instituted.
In the second paper, John Edwards presents both acomprehensive assessment of recent developmentsaffecting Australia’s trade and investment and an evalua-tion of their longer-term policy implications. In anutshell, Australia has done poorly at lifting its exportperformance since 2000, but Australian companies havedone very well at integrating themselves into the globaleconomy through foreign direct investment. His assess-ment of recent developments involves a detailed analysisof trends in the various categories of goods and servicesexports.
Export volumes grew by 56 per cent in the six years to2000. Since 2000, they have grown by just 9 per cent –a remarkable and unexpected slowdown. Most of theslowdown in export volume growth is due to thedownturn in the rate of growth of rural exports, oil,metals, gold, and services, including higher educationand overseas tourism. Roughly half the decline in the rateof growth is attributable to a decline in the rate of growthof minerals, metals and energy exports, a decline dis-guised by rising prices for key commodities, notably ironore and coal.
How can Australia improve its export performanceagain? While overseas demand for education and tourismhas had some impact, Australia’s challenge in areas suchas metals, energy and minerals is to improve its ability tosupply. While the mining investment boom in the threeyears to 2006 will likely result in higher export volumesin coming years, supply constraints are a relatively newchallenge for Australia. We need concentrated effort toremove infrastructure bottlenecks; to build additionalinfrastructure to meet expected demand; to educate,train and retrain Australians so as to increase the supplyof skilled workers; and to support innovation.
While export volume growth has flattened, exactly theopposite has happened to Australia’s outward directinvestment. Australian foreign direct investment (FDI)abroad has almost caught up with FDI in Australia.
Why has this happened? The typical Australian firminvesting offshore is one that has been successful inAustralia but outgrown the relatively small home market.Offshore investment reflects specialisation rather thansize. The typical successful business has intellectualproperty, marketing and management skills and abusiness concept that has been successful in Australia andcan be replicated elsewhere.
The second part of this collection explores themeaning and policy implications of innovation. This partconsists of three papers. Roy Green introduces the dis-cussion. He provides an overview of this activity, whichessentially entails the application of knowledge and cre-ativity to add value to products and processes. Higher
… Australia has done poorly at
lifting its export performance since
2000, but Australian companies
have done very well at integrating
themselves into the global economy
through foreign direct investment.

14
resources income, such as that delivered to Australia bythe rise of China, can be dissipated in sustaining currentprosperity – or used to enhance longer term economicsustainability. Green suggests that Norway and Finlandhave adopted approaches that do the latter, and heproposes that Australia learn from their experience. Atthe most general level, this requires much more invest-ment in human knowledge and infrastructure – both ofwhich have declined in recent years in Australia.
In categorising the scope of innovations, Green distin-guishes between “sustaining” (or incremental) and“disruptive” change. In each of these major categories,innovation could involve one or a combination of threeelements: technological change, organisational changeand institutional change. Meantime, much currentpolicy in Australia is concentrated on disruptive change(via science-based conceptions of innovation) and aimedonly at its technological dimension. This remains impor-tant, but it is far from the whole story. Australia’srelatively low spending on business R&D is often attrib-uted to the high proportion of low-tech industries in ourindustry structure. Green disagrees, arguing that “… thisjustification ignores the importance of R&D in miningand agriculture, and of innovation more broadly in ‘low-tech’ activities and services, where ‘absorptive capacity’for externally sourced technologies and skills may be thedriver of competitive advantage …”. He notes that onthe broadest possible definition only 35 per cent ofAustralian firms acknowledged making an innovation inthe 2001–03 survey period.
Drawing on a global survey, Green explores the lesswidely recognised role of organisational and institutionalinnovations. The importance of institutional stimuli toinnovation is emphasised in a recent IBM survey:“Extensive collaborators outperformed the competitionin terms of both revenue growth and average operatingmargin.” Green concludes with a detailed review ofAustralia’s innovation system. He emphasises that inno-vation is naturally not a task for governments alone. Buthe notes the lamentable decline in public spending onhigher and vocational education, despite politicalrhetoric vaunting individual skills and capabilities. Morebroadly, and at a strategic level, he laments the absence inAustralia of any overarching commitment, conceptuali-sation or vision. Government has failed to lead thedevelopment of public or stakeholder opinion. Becauseimplementation requires extensive new linkages andengagements between public and private sector actors, heargues, government has an unavoidable and quite novelleadership role in the innovation field.
In the second paper in this group, Keith Smith outlinesthe framework for a comparative study of approaches toinnovation in a number of resource-intensive economies.These are countries which all resemble Australia in theimportance of their resources sector, but which all have ahigh resource dependence associated with strong manu-facturing and/or services activity. Indeed, some of therichest and/or fastest growing economies are resource-based – Norway, Sweden, Finland, New Zealand,Canada, Australia and the Netherlands. This is incontrast to an influential strand of economic theory thatargues natural resource endowments can be a “curse”.
This “resource curse” is said to arise as a result ofimpacts on the exchange rate, precluding the develop-ment of other activities. However, Sweden, Finland andthe Netherlands, all resource-intensive economies, havealso all developed high-tech sectors that have supple-mented their much more extensive engagement in low-and medium-technology activities, allowing them toremain high-productivity nations.
In explaining this achievement, Smith focuses on howimpacts from initial resource developments ramifiedserially through three broad phases: initially, there wassignificant investment in knowledge upgrading inresources-based industries, followed by other flow-onconsequences as resource activities leveraged the develop-ment of downstream industry and services. In a thirdphase, a further round of opportunities developed fromthe extensive and deliberate use of knowledge infrastruc-tures to drive knowledge creation in other sectors. Smithrefers to the development of “vertical clusters” extendingup out of the resources sectors into manufacturing andservices. Smith concludes that if the detailed path bywhich the cited resource-rich countries progressivelytransformed their natural endowments into vibrant sec-ondary and tertiary sectors remains obscure, so too is thepath by which these outcomes might be preserved andmagnified. These questions – and processes – havespecial salience for Australia.
The third paper in the segment on innovation is byThomas Barlow. He reviews recent changes in policyframeworks designed to aid innovation. To highlighttheir impacts, he also reviews data about relative changesin Australia’s business structure. This emphasises thegrowing importance of services in the Australian
CEDA GROWTH 58
At the most general level, this
requires much more investment in
human knowledge and infrastructure
– both of which have declined in
recent years in Australia.
15COMPETING FROM AUSTRALIA
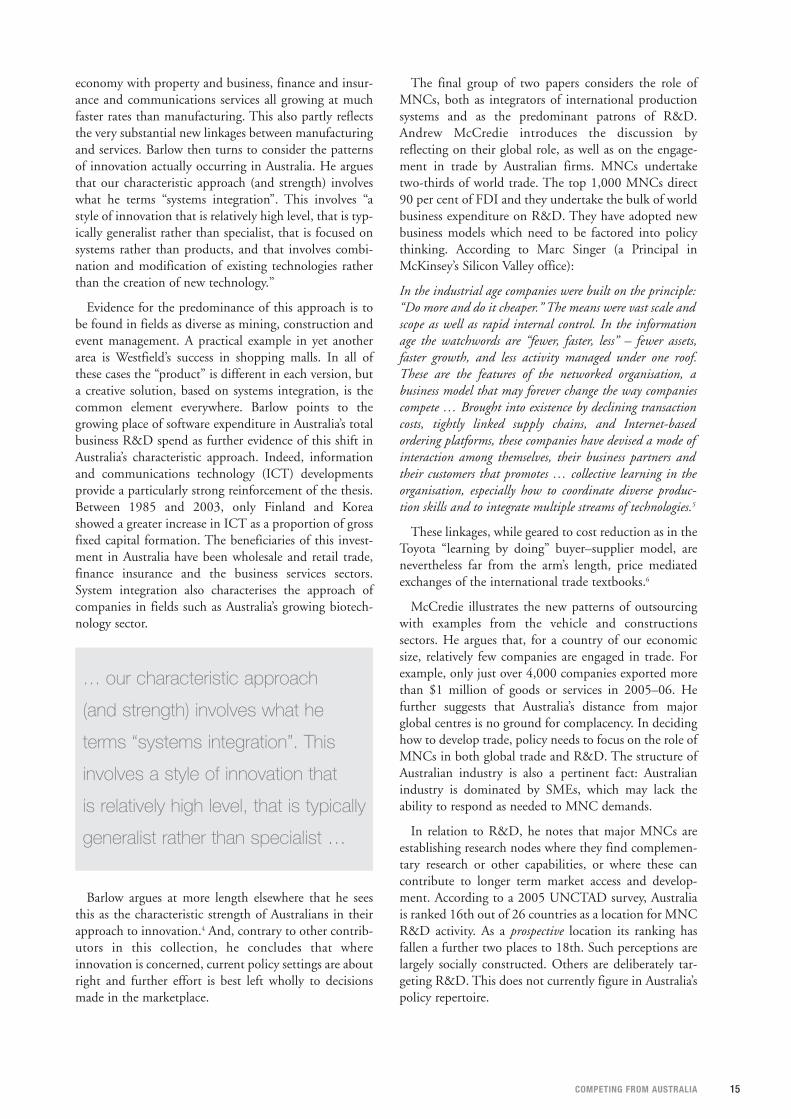
economy with property and business, finance and insur-ance and communications services all growing at muchfaster rates than manufacturing. This also partly reflectsthe very substantial new linkages between manufacturingand services. Barlow then turns to consider the patternsof innovation actually occurring in Australia. He arguesthat our characteristic approach (and strength) involveswhat he terms “systems integration”. This involves “astyle of innovation that is relatively high level, that is typ-ically generalist rather than specialist, that is focused onsystems rather than products, and that involves combi-nation and modification of existing technologies ratherthan the creation of new technology.”
Evidence for the predominance of this approach is tobe found in fields as diverse as mining, construction andevent management. A practical example in yet anotherarea is Westfield’s success in shopping malls. In all ofthese cases the “product” is different in each version, buta creative solution, based on systems integration, is thecommon element everywhere. Barlow points to thegrowing place of software expenditure in Australia’s totalbusiness R&D spend as further evidence of this shift inAustralia’s characteristic approach. Indeed, informationand communications technology (ICT) developmentsprovide a particularly strong reinforcement of the thesis.Between 1985 and 2003, only Finland and Koreashowed a greater increase in ICT as a proportion of grossfixed capital formation. The beneficiaries of this invest-ment in Australia have been wholesale and retail trade,finance insurance and the business services sectors.System integration also characterises the approach ofcompanies in fields such as Australia’s growing biotech-nology sector.
Barlow argues at more length elsewhere that he seesthis as the characteristic strength of Australians in theirapproach to innovation.4 And, contrary to other contrib-utors in this collection, he concludes that whereinnovation is concerned, current policy settings are aboutright and further effort is best left wholly to decisionsmade in the marketplace.
The final group of two papers considers the role ofMNCs, both as integrators of international productionsystems and as the predominant patrons of R&D.Andrew McCredie introduces the discussion byreflecting on their global role, as well as on the engage-ment in trade by Australian firms. MNCs undertaketwo-thirds of world trade. The top 1,000 MNCs direct90 per cent of FDI and they undertake the bulk of worldbusiness expenditure on R&D. They have adopted newbusiness models which need to be factored into policythinking. According to Marc Singer (a Principal inMcKinsey’s Silicon Valley office):
In the industrial age companies were built on the principle:“Do more and do it cheaper.” The means were vast scale andscope as well as rapid internal control. In the informationage the watchwords are “fewer, faster, less” – fewer assets,faster growth, and less activity managed under one roof.These are the features of the networked organisation, abusiness model that may forever change the way companiescompete … Brought into existence by declining transactioncosts, tightly linked supply chains, and Internet-basedordering platforms, these companies have devised a mode ofinteraction among themselves, their business partners andtheir customers that promotes … collective learning in theorganisation, especially how to coordinate diverse produc-tion skills and to integrate multiple streams of technologies.5
These linkages, while geared to cost reduction as in theToyota “learning by doing” buyer–supplier model, arenevertheless far from the arm’s length, price mediatedexchanges of the international trade textbooks.6
McCredie illustrates the new patterns of outsourcingwith examples from the vehicle and constructionssectors. He argues that, for a country of our economicsize, relatively few companies are engaged in trade. Forexample, only just over 4,000 companies exported morethan $1 million of goods or services in 2005–06. Hefurther suggests that Australia’s distance from majorglobal centres is no ground for complacency. In decidinghow to develop trade, policy needs to focus on the role ofMNCs in both global trade and R&D. The structure ofAustralian industry is also a pertinent fact: Australianindustry is dominated by SMEs, which may lack theability to respond as needed to MNC demands.
In relation to R&D, he notes that major MNCs areestablishing research nodes where they find complemen-tary research or other capabilities, or where these cancontribute to longer term market access and develop-ment. According to a 2005 UNCTAD survey, Australiais ranked 16th out of 26 countries as a location for MNCR&D activity. As a prospective location its ranking hasfallen a further two places to 18th. Such perceptions arelargely socially constructed. Others are deliberately tar-geting R&D. This does not currently figure in Australia’spolicy repertoire.
… our characteristic approach
(and strength) involves what he
terms “systems integration”. This
involves a style of innovation that
is relatively high level, that is typically
generalist rather than specialist …

16
McCredie also explores the significance of Australia’sincreasing offshore FDI. He notes that were the incomefrom these investments to count as an export, it would bethird only to coal and iron ore. He concludes with aseries of policy recommendations, starting with an effortto build understanding and overcome information defi-ciencies among MNCs. The large number of MNCsalready located in Australia provide a primary potentialsource of intelligence about the requirements for con-necting local firms to their international parent supplychains. A similar intelligence opportunity exists inrelation to attracting R&D. Similarly, Australian firmsneed to be encouraged to see supply to global chains as apath for business growth. Programs may be needed todevelop capabilities for and reduce the risks of theseengagements. Finally, Asia may present special opportu-nities. The number of regional MNCs is multiplying andthere would appear to be many potential complementar-ities between Australian capabilities and their needs. Butonce again, more intelligence and a deliberate strategymay be required.
The final paper, by John Houghton, also explores thechanging role of supply chains in the global economyand the requirements for enhancing the participation ofAustralian firms. His analysis reinforces that of AndrewMcCredie. MNCs now dominate trade and their globaloutsourcing creates a new context for firms seeking togrow through international engagement. Houghtonreviews trade data that not only illustrates Australia’s rel-atively poor trading performance but also suggests thescale of the disconnection between local manufacturesand services and global supply chains. The metricsinclude trends in our share of IT-enabled servicesexports, intra-industry trade as a share of total manufac-turing trade, Australia’s share of foreign R&D locations,and trends in export market shares for both goods andservices. In all these cases we rank in the lowest deciles.Echoing the judgements of other contributors to this col-lection, Houghton concludes that our potential as agoods and services exporter depends above all on thedevelopment of education and skills, ICT infrastructureand on the ability of local suppliers to link into globalproduction systems and offer appropriate cost-effectivesolutions.
In general, the contributors to this collection urge thefurther development of government policies aimed atincreasing the international engagement of Australianfirms. The policies they variously propose pose challengesof varying degrees of difficulty. The proposals to buildeducation and training investment, lift communicationslinkages and emphasise export development, importantand far-reaching though they are, present the fewest dif-ficulties. All these recommendations are consistent withcurrent policy frameworks and approaches. They wouldrepresent a realignment of priorities and involve morespending, but they do not present any fundamental chal-lenge to overarching orientations.
Proposals to deliberately foster the links betweenAustralian firms, particularly SMEs, and MNCs involvea higher order of policy difficulty. This would represent aconsiderable extension of present approaches.
However, innovation as discussed here represents themost challenging of all these proposed fresh approaches.Currently national government strategies are largelyfocused on a science push view of this activity. The chal-lenge of adding a substantial demand-driven componentthat is focused on established services and manufacturingsectors is far from trivial, and far from a simple extensionof current approaches. It could involve such higher orderactivities as formulating a general vision that is ambi-tious, plausible and capable of inspiring effort. It couldinvolve a variety of sectoral activities that might be stim-ulated by governments but realised through relevantindustry associations and/or groups of firms. Forexample, clusters of firms might be encouraged to setgoals and targets, but in a frame that allows revision andadaptation as experience accumulates and contingenciesunfold. In other words, it would involve engagements ata sectoral level that cuts across present hostility to selec-tive interventions and discriminatory approaches. Butthe forms of engagement would also be novel – based oninformation and incentives to identify opportunities andto set ambitious goals and targets and reward designatedachievements rather than non-discriminatory regulatoryor financial inducements.
Such activities pose considerable challenges both to thestate and to business. For business, collaboration can bevery complex and demanding to establish. For the publicsector, the risks of capture would need to be deliberatelycountered. Fortunately there are abundant examples ofsuccessful approaches in other states. Perhaps the biggestchallenge concerns the degree to which such approachescut across current orthodoxies about the role of the stateand the relationship between public and private sectorswhich are championed by Australia’s political andbureaucratic elites. Concepts of partnership and collabo-rative engagement are currently generally discounted.They are the exception. Similarly, while ministers gestureto “joined up” approaches, practice shows only a fewexamples of effective concerted effort. Evolved forms ofinnovation strategy explicitly take account of the linkagesbetween industry policy and education, migration, com-munications, infrastructure and social policy. Suchholistic approaches are barely evident in the Australianpolicy system and, particularly where there is overlapbetween federal and state governments, often thwartedby make-believe political combat.
In other words, the adoption of innovation policies asenvisaged by some of the contributors to this volumewould represent at its furthest not just the evolution ofcurrent approaches, but a major shift towards a moreactive industry policy. As noted in the earlier papers,appropriate approaches are well developed in other coun-
CEDA GROWTH 58

17COMPETING FROM AUSTRALIA
tries, notably the Nordic block. However, policy transferis never merely straight copying and is always problem-atic – local conditions and circumstances, includingpolitical factors, necessarily obtrude. This is as it shouldbe.
In sum, the challenge in re-crafting Australia’s policyframeworks to lift international economic engagement toa new level could be unpacked in several different ways.The possibilities extend from shifting to new prioritieswithin present broad orientations to the adoption of newpolicy approaches, instruments and settings. Theachievements of the past couple of decades show whatdetermined and focused leadership can accomplish. Thenext phase, whatever its components, requires a renewalof motive and energy, and a fresh engagement with goals,means and purposes.
ENDNOTES
1 Evidence, 21 February 2007, House of Representatives Committee on Economics,Finance and Public Administration.
2 Managing Prosperity, Speech to the National Economic and Social Outlook Conference,2 November 2006.
3 Marsh & Edwards (2006) review the Innovation Summit as an exercise nominally posi-tioned as an assessment of alternative conceptions of ways to promote innovation.They conclude this was ultimately an elaborate exercise in outreach, basically designedto legitimise largely pre-determined positions. This has since locked Australia’s inno-vation strategy into a linear, science-push view of the process.
4 Barlow, 2006.
5 Singer, M., 2001.
6 See also Charles Sabel, 1994, Learning by monitoring: the institutions of economicdevelopment, in N Smeltser & R Swedborg (eds) Handbook of Economic Sociology,Princeton University Press, New Jersey.
REFERENCES
Barlow, T. 2006, The Australian Miracle: An Innovative Nation Revisited, Picador Pan-Macmillan, Sydney.
Lipsey R., Carlaw, K. & T. Bekar, 2005, Economic Transformations: General PurposeTechnologies and Long Term Economic Growth, Oxford: Oxford University Press.
Singer, M. 2001, “Beyond the unbundled corporation”, The McKinsey Quarterly, No. 3.
Smith K. & I. Marsh, 2007, “Wine production and economic development: Technological andmarket dynamics of the Australian wine industry”, International Journal of Technology andGlobalisation, Jan–Feb.

18
IntroductionTwo well-known books encapsulate much that is partic-ular to the challenges facing Australia today: DonaldHorne’s The Lucky Country and Geoffrey Blainey’s TheTyranny of Distance. Both titles have become part ofthe Australian lexicon and are keys to our sense of selfas a nation.
Horne’s phrase evokes in the minds of many thebounty of Australia possessing a continent rich in naturalresources, some of which comprise a large share indeedof the global resource endowment.
The continent has over 20 per cent and, in some cases,much more of the world’s known stock of recoverableuranium, iron ore, bauxite, diamonds and mineral sands.Proven black coal resources have centuries of life atcurrent extraction rates and millennia for brown coal.The land currently occupied by mining is 0.01 per centof the land area.
PROFESSOR GLENN WITHERS, AO,
is Professor of Public Policy at the
Crawford School of Economics and
Government at the Australian
National University. He works on
applied microeconomics, public economics, public policy and
administration, population policy and cultural economics. He
headed the Federal Government’s Economic Planning Advisory
Commission in the mid-1990s and has advised federal and state
governments, COAG, the Business Council of Australia and the
OECD. He is CEDA’s ACT president and a member of its Research
and Policy Committee.
4
CEDA GROWTH 58
distancedefeated?distance
BE
can

19COMPETING FROM AUSTRALIA
Australia’s relatively small population means that thisbounty can be shared and can support a good living,thanks to the fortune provided by nature and by isola-tion. Recognition of such a sentiment was reflected inthe Prime Minister’s recent comment on dealing withclimate change, that “we have to make sure that we do itin a way that preserves our natural advantages becausefuture generations will not thank us for squandering anatural advantage providence has given us”.1
Isolation is Blainey’s theme. The continent is geo-graphically separated from the historic centres of majorhuman population or, as Paul Keating once put it morecolourfully, “Australia is at the arse end of the universe”.(Some might say Keating’s comment neglects NewZealand and Tierra Del Fuego, but the point is clear.)Isolation is not just literal physical geography but also amatter of economic mass – and the most prosperous andpopulous are elsewhere. Canberra is 16,500 kms fromBonn, 16,000 kms from Washington, and 6,000 kmsfrom Tokyo, even in our own Asia Pacific region.
According to some historians, Australia may have hadan indigenous population of half a million before whitesettlement. Noel Butlin 1983) suggested this was amassive underestimate; in his view the number was morelike one million. However, disease (and not the frontierviolence that has so occupied the culture war historians)decimated this native population, leaving only 250,000
indigenous Australians by 1815 supplemented by 15,000Europeans; a tiny population for a continent of 3 millionsquare miles. Almost 200 years later the indigenous pop-ulation has risen back to half a million and the totalpopulation has passed 20 million.
Global integrationOne consequence of nature’s bounty has been a long his-torical reliance upon natural, resource-based exports as amajor component of Australian trade, as shown in Figure1. Wool, gold and other minerals alone have never beenless than 30 per cent of total Australian exports, puttingaside the years of war and depression.2 The reliance hasvaried over time and manufacturing and service exports(including sectors such as tourism and education) haveexpanded. But the natural resource base has remainedcrucially important and, in circumstances, such as therecent period of commodity price boom in response toChina’s fast growth, has accelerated to assume renewedprominence. And we have used our resources most efficiently, showing much higher labour productivity in these areas than comparable countries such as theUnited States.
The implications of bounty and distance for Australia’sgrowth, structure and stability are profound. How werespond to this bounty determines whether we continue
PHOTO: iSTOCK

20 CEDA GROWTH 58
as one of the group of countries to escape the “ResourceCurse” (Smith 2007). So many countries rich in natural,resource-based products have not used their bounty welland have suffered restricted growth. But countries suchas Canada, Australia, and Norway have developed asaffluent and stable democratic societies. Whether weshould have done even better is open for debate, but theneed to ensure that resource wealth flows are not wastedin the manner of the Spains and Portugals of centuriesago or some of the mid-East, African and SouthAmerican oil countries of modern times remains a policypriority.
The priority is recognised somewhat in Australiathrough the structural impacts associated with what localeconomists call the “Gregory Thesis” or, as it is calledelsewhere, “The Dutch Disease”. The exchange rateeffects of bountiful natural exports inhibit competitivemanufacturing and service exports and raise importcosts, so placing pressure on urban living standards andemployment.
Australia was the world’s first post-industrial society.Most industrial countries went through a major period oftransition from land-based production for domestic con-sumption, though a manufacturing revolution and thegrowth of urbanisation, to emerge as service societies. Inthis process, cheaper manufactures elsewhere undercutbasic domestic manufacturing, which then remainedwith specialised high-value-added niches. Australia wasreally born modern; a society that never possessed alanded peasantry, thoroughly urban from foundation,with well-constructed institutions of modern liberaldemocracy, the rule of law and efficient administration.
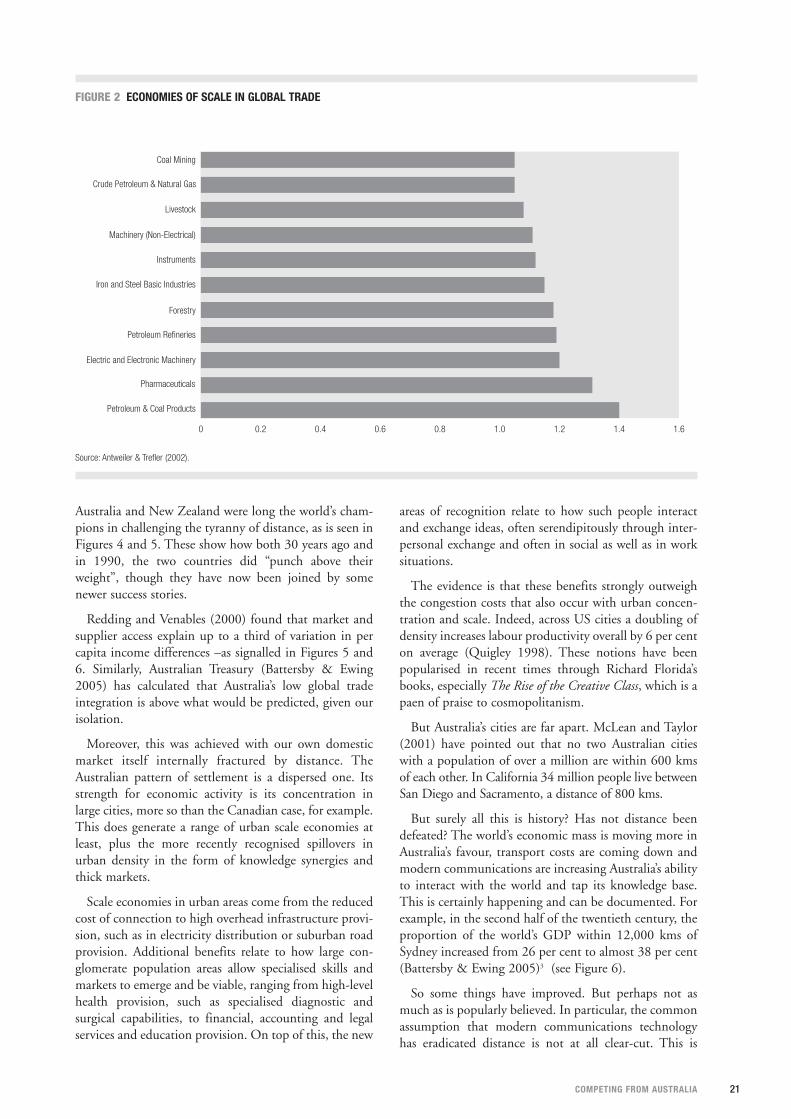
Its distance from markets meant that its naturalresource advantages dominated its global trade and notbasic manufacturing, which only really grew when force-fed by artificial protection. There is clear evidence thatapart from the costs of transport, which for Australia arelarge, there are also considerable advantages to scale inmanufacturing compared to most natural resource indus-tries. Figure 2 shows this clearly from recentinternational research (Antweiler & Trefler 2002) onscale advantages in global trade. And Blum and Leamer(2000) have further estimated that exporting a good to acountry 1,500 kms away is, on average, equivalent to animport tariff of between 7 and 17 per cent, depending onthe type of good. Or, to put the problem differently, ifAustralia was as close to other economies as is the UK, itstrade would be 50 per cent higher (Battersby & Ewing2005).
The result is a relatively low global integration forAustralia. The sum of exports and imports as a ratio toGDP puts Australia at the lower end of the OECDspectrum, as seen in Figure 3.
But at least historically for Australia a relatively effi-cient domestic construction and service sector was ableto flourish, and economic achievement could alsoembrace urban utilities and construction – as these werelargely non-traded – and both could benefit from ahealthy, educated, enterprising and growing population.With efficient land and capital-intensive mining andagriculture, and with human-capital-intensive serviceproduction, embedded in a rich foundation of institu-tional capital, Australia still could prosper and grow ahigh living standard. As Ed Leamer (2006) has shown,
FIGURE 1 AUSTRALIA’S EXPORT COMPOSITION, 1861–1991
0% 20% 40% 60% 80% 100%
OtherMineralsGoldWool
1861
1871
1881
1891
1901
1911
1947
1951
1961
1971
1981
1991
Source: McLean & Taylor (2001)
21COMPETING FROM AUSTRALIA
Australia and New Zealand were long the world’s cham-pions in challenging the tyranny of distance, as is seen inFigures 4 and 5. These show how both 30 years ago andin 1990, the two countries did “punch above theirweight”, though they have now been joined by somenewer success stories.
Redding and Venables (2000) found that market andsupplier access explain up to a third of variation in percapita income differences –as signalled in Figures 5 and6. Similarly, Australian Treasury (Battersby & Ewing2005) has calculated that Australia’s low global tradeintegration is above what would be predicted, given ourisolation.
Moreover, this was achieved with our own domesticmarket itself internally fractured by distance. TheAustralian pattern of settlement is a dispersed one. Itsstrength for economic activity is its concentration inlarge cities, more so than the Canadian case, for example.This does generate a range of urban scale economies atleast, plus the more recently recognised spillovers inurban density in the form of knowledge synergies andthick markets.
Scale economies in urban areas come from the reducedcost of connection to high overhead infrastructure provi-sion, such as in electricity distribution or suburban roadprovision. Additional benefits relate to how large con-glomerate population areas allow specialised skills andmarkets to emerge and be viable, ranging from high-levelhealth provision, such as specialised diagnostic andsurgical capabilities, to financial, accounting and legalservices and education provision. On top of this, the new
areas of recognition relate to how such people interactand exchange ideas, often serendipitously through inter-personal exchange and often in social as well as in worksituations.
The evidence is that these benefits strongly outweighthe congestion costs that also occur with urban concen-tration and scale. Indeed, across US cities a doubling ofdensity increases labour productivity overall by 6 per centon average (Quigley 1998). These notions have beenpopularised in recent times through Richard Florida’sbooks, especially The Rise of the Creative Class, which is apaen of praise to cosmopolitanism.
But Australia’s cities are far apart. McLean and Taylor(2001) have pointed out that no two Australian citieswith a population of over a million are within 600 kmsof each other. In California 34 million people live betweenSan Diego and Sacramento, a distance of 800 kms.
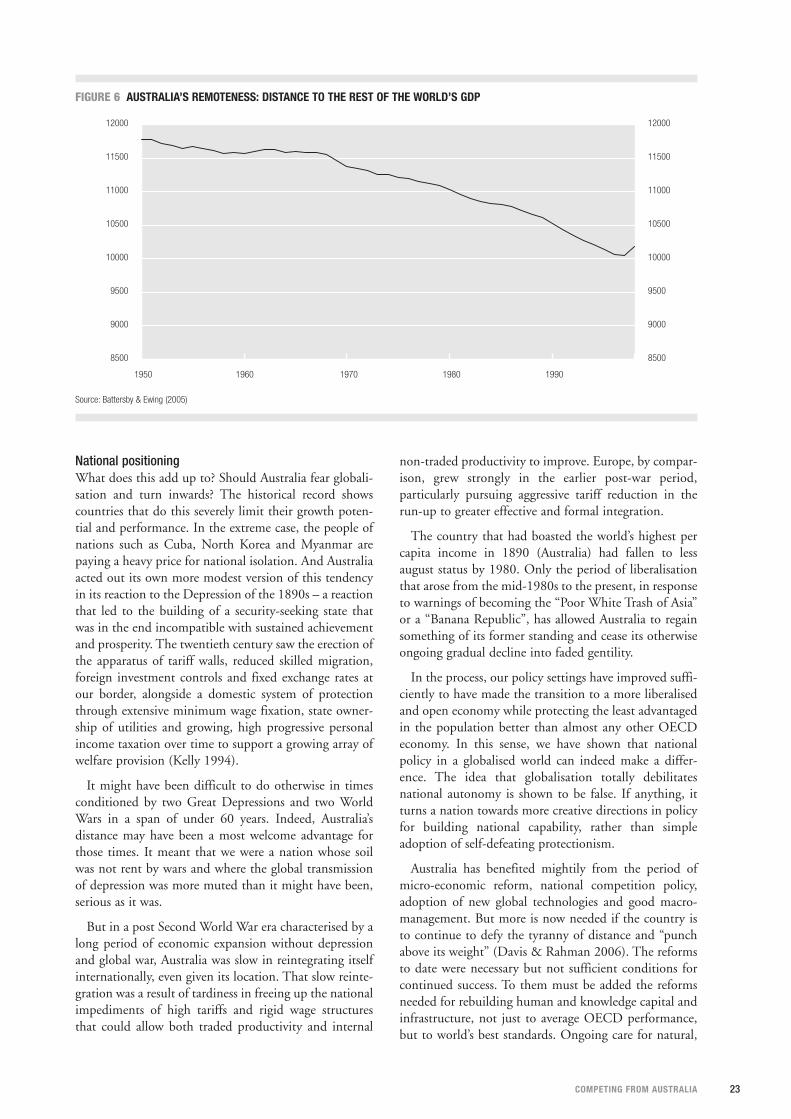
But surely all this is history? Has not distance beendefeated? The world’s economic mass is moving more inAustralia’s favour, transport costs are coming down andmodern communications are increasing Australia’s abilityto interact with the world and tap its knowledge base.This is certainly happening and can be documented. Forexample, in the second half of the twentieth century, theproportion of the world’s GDP within 12,000 kms ofSydney increased from 26 per cent to almost 38 per cent(Battersby & Ewing 2005)3 (see Figure 6).
So some things have improved. But perhaps not asmuch as is popularly believed. In particular, the commonassumption that modern communications technologyhas eradicated distance is not at all clear-cut. This is
FIGURE 2 ECONOMIES OF SCALE IN GLOBAL TRADE
0 0.2 0.4 0.6 0.8 1.0 1.2 1.4 1.6
Petroleum & Coal Products
Pharmaceuticals
Electric and Electronic Machinery
Petroleum Refineries
Forestry
Iron and Steel Basic Industries
Instruments
Machinery (Non-Electrical)
Livestock
Crude Petroleum & Natural Gas
Coal Mining
Source: Antweiler & Trefler (2002).

22 CEDA GROWTH 58
because as the world moves increasingly to become aglobal knowledge economy, much of the creative, high-level knowledge is tacit, not codified in formalcommunication, and serendipitous, conveyed in directpersonal interaction that is a function of co-location(Levy & Murnane 2004).
Indeed, there is evidence to suggest that the impact ofdistance is rising and not declining with time. Reddingand Schott (2003) have found that comparing 1990 with1970, a one per cent distance that previously reducedbilateral exports by 1.2 per cent in 1970 did so by 1.5 percent 20 years later.
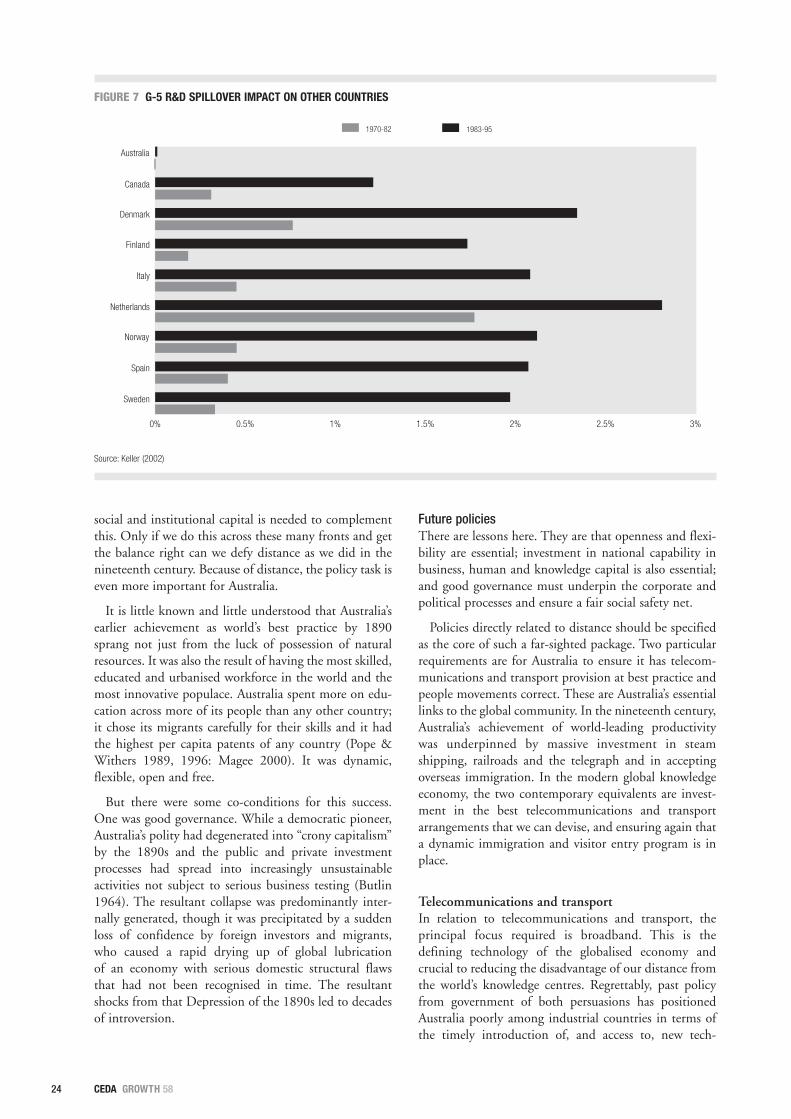
In the world of ideas, which underpins value-addedeconomic activity, Keller (2002) has calculated how tech-nology is itself substantially local in use and not global,despite the communications revolution. What he meansis that the benefits from spillovers in using knowledgedecline dramatically with distance. The amount ofspillovers, meaning use of knowledge beyond formallycontracted parties to the technology development,declines by half on average for every 1,200 kms.
If we use Keller’s calculations to look at the averagebenefit to small industrial countries from the R&D in theG-5 nations of the US, UK, Japan, France and Germany,it is all too abundantly clear how proximity pays great div-idends in access to technology, as is shown in Figure 7.
FIGURE 4 GDP PER CAPITA AND DISTANCE TO WORLD GDP, 1960 FIGURE 5 GDP PER CAPITA AND DISTANCE TO WORLD GDP, 1990
0 1000 2000 3000 4000 5000 6000 7000 8000 9000
0
5000
10000
15000
TrinidadVenezuela
Australia, New Zealand
Uruguay
Mauritius
0 1000 2000 3000 4000 5000 6000 7000 8000
0
5000
10000
15000
20000
Australia
SingaporeNew Zealand
Taiwan
Source: Leamer (2006) Source: Leamer (2006)
FIGURE 3 TRADE INTENSITIES, 2001
Source: Battersby & Ewing (2005).
JapanUnited States
AustraliaUnited Kingdon
ItalyTurkeyFranceSpain
NorwayIceland
New ZealandPortugal
GermanyPortugal
DenmarkFinland
SwedenCanada
SwitzerlandAustria
NetherlandsIreland
23COMPETING FROM AUSTRALIA
National positioningWhat does this add up to? Should Australia fear globali-sation and turn inwards? The historical record showscountries that do this severely limit their growth poten-tial and performance. In the extreme case, the people ofnations such as Cuba, North Korea and Myanmar arepaying a heavy price for national isolation. And Australiaacted out its own more modest version of this tendencyin its reaction to the Depression of the 1890s – a reactionthat led to the building of a security-seeking state thatwas in the end incompatible with sustained achievementand prosperity. The twentieth century saw the erection ofthe apparatus of tariff walls, reduced skilled migration,foreign investment controls and fixed exchange rates atour border, alongside a domestic system of protectionthrough extensive minimum wage fixation, state owner-ship of utilities and growing, high progressive personalincome taxation over time to support a growing array ofwelfare provision (Kelly 1994).
It might have been difficult to do otherwise in timesconditioned by two Great Depressions and two WorldWars in a span of under 60 years. Indeed, Australia’sdistance may have been a most welcome advantage forthose times. It meant that we were a nation whose soilwas not rent by wars and where the global transmissionof depression was more muted than it might have been,serious as it was.
But in a post Second World War era characterised by along period of economic expansion without depressionand global war, Australia was slow in reintegrating itselfinternationally, even given its location. That slow reinte-gration was a result of tardiness in freeing up the nationalimpediments of high tariffs and rigid wage structuresthat could allow both traded productivity and internal
non-traded productivity to improve. Europe, by compar-ison, grew strongly in the earlier post-war period,particularly pursuing aggressive tariff reduction in therun-up to greater effective and formal integration.
The country that had boasted the world’s highest percapita income in 1890 (Australia) had fallen to lessaugust status by 1980. Only the period of liberalisationthat arose from the mid-1980s to the present, in responseto warnings of becoming the “Poor White Trash of Asia”or a “Banana Republic”, has allowed Australia to regainsomething of its former standing and cease its otherwiseongoing gradual decline into faded gentility.
In the process, our policy settings have improved suffi-ciently to have made the transition to a more liberalisedand open economy while protecting the least advantagedin the population better than almost any other OECDeconomy. In this sense, we have shown that nationalpolicy in a globalised world can indeed make a differ-ence. The idea that globalisation totally debilitatesnational autonomy is shown to be false. If anything, itturns a nation towards more creative directions in policyfor building national capability, rather than simpleadoption of self-defeating protectionism.
Australia has benefited mightily from the period ofmicro-economic reform, national competition policy,adoption of new global technologies and good macro-management. But more is now needed if the country isto continue to defy the tyranny of distance and “punchabove its weight” (Davis & Rahman 2006). The reformsto date were necessary but not sufficient conditions forcontinued success. To them must be added the reformsneeded for rebuilding human and knowledge capital andinfrastructure, not just to average OECD performance,but to world’s best standards. Ongoing care for natural,
FIGURE 6 AUSTRALIA’S REMOTENESS: DISTANCE TO THE REST OF THE WORLD’S GDP
Source: Battersby & Ewing (2005)
8500
9000
9500
10000
10500
11000
11500
12000
8500
9000
9500
10000
10500
11000
11500
12000
1950 1960 1970 1980 1990
24
social and institutional capital is needed to complementthis. Only if we do this across these many fronts and getthe balance right can we defy distance as we did in thenineteenth century. Because of distance, the policy task iseven more important for Australia.
It is little known and little understood that Australia’searlier achievement as world’s best practice by 1890sprang not just from the luck of possession of naturalresources. It was also the result of having the most skilled,educated and urbanised workforce in the world and themost innovative populace. Australia spent more on edu-cation across more of its people than any other country;it chose its migrants carefully for their skills and it hadthe highest per capita patents of any country (Pope &Withers 1989, 1996: Magee 2000). It was dynamic,flexible, open and free.
But there were some co-conditions for this success.One was good governance. While a democratic pioneer,Australia’s polity had degenerated into “crony capitalism”by the 1890s and the public and private investmentprocesses had spread into increasingly unsustainableactivities not subject to serious business testing (Butlin1964). The resultant collapse was predominantly inter-nally generated, though it was precipitated by a suddenloss of confidence by foreign investors and migrants,who caused a rapid drying up of global lubricationof an economy with serious domestic structural flawsthat had not been recognised in time. The resultantshocks from that Depression of the 1890s led to decadesof introversion.
Future policiesThere are lessons here. They are that openness and flexi-bility are essential; investment in national capability inbusiness, human and knowledge capital is also essential;and good governance must underpin the corporate andpolitical processes and ensure a fair social safety net.
Policies directly related to distance should be specifiedas the core of such a far-sighted package. Two particularrequirements are for Australia to ensure it has telecom-munications and transport provision at best practice andpeople movements correct. These are Australia’s essentiallinks to the global community. In the nineteenth century,Australia’s achievement of world-leading productivitywas underpinned by massive investment in steamshipping, railroads and the telegraph and in acceptingoverseas immigration. In the modern global knowledgeeconomy, the two contemporary equivalents are invest-ment in the best telecommunications and transportarrangements that we can devise, and ensuring again thata dynamic immigration and visitor entry program is inplace.
Telecommunications and transportIn relation to telecommunications and transport, theprincipal focus required is broadband. This is thedefining technology of the globalised economy andcrucial to reducing the disadvantage of our distance fromthe world’s knowledge centres. Regrettably, past policyfrom government of both persuasions has positionedAustralia poorly among industrial countries in terms ofthe timely introduction of, and access to, new tech-
CEDA GROWTH 58
0% 0.5% 1% 1.5% 2% 2.5% 3%
1970-82 1983-95
Sweden
Spain
Norway
Netherlands
Italy
Finland
Denmark
Canada
Australia
FIGURE 7 G-5 R&D SPILLOVER IMPACT ON OTHER COUNTRIES
Source: Keller (2002)
25COMPETING FROM AUSTRALIA
nology. This extends back to the introduction of colourtelevision and through to pay television, mobile phonesand broadband today. In each case Australia has been alaggard in permitting introduction of these advances incommunications. Yet, in each case once change is per-mitted, Australia’s take-up rate of these technologies istypically very rapid and the pay-off from informationand communications technology (ICT) has contributedmightily to sustaining our growth (Parham 2004). Thisis called “catch-up”.
In the case of broadband, according to OECDCommunications Outlook 2005, Australia ranks 23rdout of 32 OECD countries in terms of broadband accessrates. At the same time, Australia is the only OECDcountry where half the broadband users download at 512kilobytes a second or less. It is, of course, easier for geo-graphically smaller countries such as Korea or Japan toprovide such infrastructure, but we also fall well behindsimilarly placed countries to Australia such as Canada.Such have been the national logjams in this area thatstate and territory governments have been seeking tocompensate for the national problems in policy and reg-ulation in this sphere.4 And local possibilities for adecentralised policy have been recently defined forAustralia (Gans 2006).
Indeed, in order to keep information transaction costsdown and to allow the “new economy” industries toflourish (including “virtual” supply chains for export),and to contribute better to economic growth and socialbenefit (Economides 1996; Skilling & Boven 2007)), itmay be that such a move away from a national solutionto a more decentralised strategy is opportune. In partic-ular, on a global basis, broadband Internet access ispeaking and the next phase of global internet usage islikely to be a move from “wired” (DSL, optical fibre andcable modem) to “wireless”. This is being driven bygrowing notebook take-up and handheld mobile internetuse, and many developing country markets are movingstraight to this technology, leapfrogging the tetheredconnections (Ipsos 2007).
Australia could anticipate this. What is needed is a newbroadband strategy premised on opening up and facili-tating decentralisation. Opening up access to Telstraexchange interconnection and street conduits (“the lastmile”) on a local basis for conventional broadband, and
removing major regulatory obstacles to new wirelessbroadband are the core new steps needed for Australiaitself to “leapfrog” in provision, competition and pro-curement in broadband instead of being a perennialbridesmaid in telecommunications.
Greater progress is also needed on rationalisation oftransport infrastructure arrangements. Public transportand storage is about 4.5 per cent of GDP and total shareof GDP going to freight logistics is at least double this,5
and personal transport arrangements should also beadded. Yet international and national transport needs arearguably under-appreciated in the policy domain.Climate change, environment and energy policies arebringing a new focus, but underlying economic dimen-sions in terms of personal and business costs, quality andeffectiveness remain crucial for competing from adistance. Ongoing emphasis on sustained improvementis therefore essential.
The main challenges are actually domestic, especiallyland transport and its relationship with ports. Particularattention must be paid to upgrading infrastructure in keytransport corridors, to be facilitated by new technologyand improved co-ordination across governments andmodes.
The major test of advance here will be the next roundof AusLink funding and it is important that this proceedon a systematic basis and not be undermined by moreimmediate electoral opportunism, whereby projectsproceed in isolation and without proper evaluation. Theprocess should be informed by supply and logistics chainframeworks (CEDA 2004).
On the international transport front, we mustcontinue progress in expanding international air routeaccess and travel options for passengers in particular.Dedicated air freight is already a more open marketsubject only to airport capacity issues.
Immigration movementsRegarding people movements, more progress has beenmade than in telecommunications and transport. Indeed,in many respects, Australia’s immigration arrangementsperform well by the benchmark of the national interest.Other countries have begun to emulate the points systemby which we manage the immigration inflow, and ourpost-arrival and support services overall have producedmore successful integration of settlers than in most com-parable countries.
The actual levels of immigration are close to what isrequired to maximise per capita income growth, andcomprise a reasonable balance of economic, family andhumanitarian entry. A figure of 1.25 per cent annualincrease of population should remain a target for policyfor net migration and natural increase. Much more thanthis runs into absorption problems and much less under-mines investor certainty and confidence.
Two particular requirements
are for Australia to ensure it has
telecommunications and transport
provision at best practice and
people movements correct.

26
Short-term entry for business, study and tourism andvisits has been liberal, though subject to essential securityrequirements in visa management, and cross-borderflows have risen steadily. Australia offers on-shore con-version from temporary to permanent settlement forthose meeting settlement standards, and the system hasbuilt in a welcome capacity to distribute settlement toregional priority areas around Australia. Attention to the“global diaspora” of Australians overseas, has also beenadded to the armoury of migration policy.
There have been past problems with matters of restric-tions on aged parent entry, but this has evolved to strikea better if not perfect balance between family reunionentitlements and minimising taxpayer burdens.Humanitarian entry arguably lost sight of true refugeesmost in need for some time, focusing instead onAustralia-linked humanitarian entry, but this too hasbeen somewhat redressed. However, concerns do stillremain over denial of family reunion for valid refugees onbridging visas and on the mandatory offshore detentionpolicies adopted.
One other issue, and one more directly relevant to theeconomic effects of distance, is the recent expansion ofguest-worker visas (such as section 457 visas) to helpmeet labour shortages. These programs have beensensible in restricting their ambit to professional, mana-gerial and skilled workers, but they do carry big risks forindividual worker exploitation and worker over-stay andremoval, for creating a segmented group of workers andbecause of ongoing pressure to expand to less skilledareas. These features may begin to undermine publicsupport for broader permanent immigration. Suchsupport is always fragile and easily led by populism.
At the same time, it is a myth anyway that this guest-worker process solves worker shortages. A small, highlytargeted program can help, where local training takes toolong to fill the gap or the need is transitional, but a large-scale program soon creates as many jobs as it fills. As suchprograms grow, spending by and on behalf of the guestworkers merely creates new job needs and new shortageselsewhere. The policy becomes one of “a dog chasing itstail”, even though individual employers think they arefinding solutions to their problems and governments canclaim they are assisting business in meeting its require-ments. The bigger picture and much research (Castles etal 1998) says otherwise and the policy ultimatelybecomes self-defeating.
Reasonable quotas for high priority areas with longskill formation characteristics are a better way forward,rather than an open-ended, demand-driven guest-workerprogram. The program should be capped at present levelsuntil a comprehensive, thorough, independent andexpert review with balanced terms of reference is com-pleted.
In sum, Australia has developed a strong and dynamicimmigration program. But its sustainability dependsupon maintaining the legitimacy of that program, andpresent refugee and guest-worker policies may needreform to support this.
Third and Fourth Wave reform policiesOf course, beyond the directly distance-linked priorities,many other polices directed at enhancing value-adding inany production sphere, irrespective of distance, can alsokick in and, by encouraging or enabling us to be smarterin all and any spheres, help Australia stand out as thenation that is most competitive from afar.
The complementary policies that are needed includeespecially:
• sustained progress on the so-called “Third Wave”reforms directed at human capital, business regulationand energy, and also health, but with primary focus onhuman capital as the source of sustainable advantage.This must cover all levels of education, but especiallyearly childhood education, more delegation in govern-ment school systems, and reduced regulation ofuniversities; and new initiatives in innovation with thisnotion being defined broadly and as much directed atbusiness culture and practice in knowledge manage-ment as at R&D production itself (Green 2007); and
• anticipation of “Fourth Wave” reforms directed at theinstitutions of public governance themselves, wherebywe need to fix up the structures of federation and thepolicy capacities of the bureaucracy.6 If internationalcompetition is muted by distance for Australia, weshould seek to get domestic competition right. Muchhas been done to achieve this under micro-economicreform, but this process has left the core governmentstructures themselves relatively untouched. Yet the factis that while Australia has the advantage of federalarrangements that permit more cross-government com-petition than in a unitary state, we have the mostcentralised federal system of the major developedeconomies. The highest priority should be given toreducing overlapping roles and responsibilities in gov-ernment and improving incentives for co-operationwhen overlap is inevitable. Australia is well out of stepwith international best practice in these areas, andrecent estimates suggest that there is a reform bonus ofsome $4,188 per head for pursuing best practice fiscaldecentralisation (Twomey & Withers 2007).
CEDA GROWTH 58

ConclusionCurrently Australia is ranked third in the UNDP HumanDevelopment Index after Norway and Iceland. It isworld number 15 in GDP and 14 in GDP per capita,but it is falling down the competitiveness scale onceagain, with the 2006 World Economic Forum rankingshaving the country slip to number 19 and especially ourinnovation ranking down to 24. We have a strong base inmacro-economic environment with which to recoversome ground, which requires both progress from govern-ment and private companies, especially intelecommunications and knowledge acquisition. And wemust maintain, but carefully manage, our immigrationmomentum.
Progress by government on the New Reform Agendaof COAG in areas such as human capital, infrastructureand water and energy is essential, as is some substantialbootstrapping by private companies in the acquisition,development, and management of knowledge and inno-vation. A centrepiece of the reforms must be to enhancethe policies that help us defeat distance in areas of trans-port and communications and international populationmovement.
If this is done, “smart growth” can offset the otherwiseincreasingly evident prospect of gradual long-term pro-ductivity decline and the fate of being only a QuarryEconomy.
AUTHOR’S NOTE
Particular thanks are due to Ed Leamer for the data used in Figures 5 and 6, BenMethukawallat and Lynette Ong for research assistance, and John Bowdler, Joshua Gansand David Walker for policy discussion. Naturally the views expressed remain those of theauthor.
REFERENCES
Antweiler, W. & Trefler , D. 2002, “Increasing returns and all that: A view from trade”,American Economic Review, vol. 92, no. 1, pp. 93–119.
Battersby, B.D. 2006, “Does distance matter? The effect of geographic isolation on pro-ductivity levels”, Treasury Working Paper no. 2006–03, Australian Treasury Canberra.
Battersby, B. D. & Ewing, R. J. 2005, “International Trade Performance: the gravity ofAustralia’s remoteness”, Treasury Working Paper no. 2005–03, Australian Treasury,Canberra.
Blainey, G. 1983, The Tyranny of Distance: How Distance Shaped Australia’s History, Pan-Macmillan, place of publication?.
Blum, B. & Leamer, E. 2002, Can FTAA suspend the Laws of Gravity and give the Americashigher growth and better income distributions? Mimeo.
Butlin, N.G. 1964, Investment in Australian Economic Development, 1861–1900. ANUPress, Canberra.
Butlin, N. G. 1983, Our Original Aggression, Aboriginal Populations of SoutheasternAustralia. 1788-1850, George Allen & Unwin, Sydney.
Castles, S., Foster, W., Iredale, R. & Withers, G.,1988, Immigration and Australia: Myths andRealities, Angus and Robertson, place of pub?.
CEDA 2006, Infrastructure: Getting on with the job, Growth Report 54, CEDA, Melbourne.
Ciccone, A. & Hall, R. 1996,“Productivity and the density of economic activity”, AmericanEconomic Review, vol. 86, no. 1, pp. 54–70.
Davis, G. & Rahman, J. 2006, “Perspectives on Australia’s productivity prospects”, TreasuryWorking Paper no.2006–04, Australian Treasury, Canberra.
Dolman, B., Parham, D., & S. Zheng, 2007, “Can Australia match US productivity perform-ance?”, Staff Working Paper, Productivity Commission, Canberra, 8 March.
27COMPETING FROM AUSTRALIA
Economides, N. 1996, “The economics of networks”, International Journal of IndustrialOrganisation, vol. 14, no. 6, October, pp. 673–89.
Florida, R. 2002, The Rise of the Creative Class, Basic Books, New York.
Gans, J. 2006, The Local Broadband Imperative, CEDA Information Paper 86, CEDA,Melbourne.
Green, R. 2007, “Competing through innovation: an international perspective”, manuscript,.
Industry Steering Committee, 2002, Freight Logistics in Australia: an Agenda for Action,Department of Transport and Regional Services, 26 March (J. Bowdler, Chair).
Ipsos 2007, The Face of the Web, Ipsos, New York.
Keller, W. 2002, “Geographic location of international technology diffusion”, AmericanEconomic Review, vol. 92, no. 1, pp. 120–42.
Kelly, P. 1994, The End of Certainty: Power, Politics and Business in Australia, Allen & Unwin,Sydney.
Leamer, E. 2006, “A flat world, a level playing field, a small world after all, or none of theabove?” Journal of Economic Literature issue/nr, pages?.
Levy, F. & Murnane, R. 2004, The New Division of Labour, Princeton University Press,Princeton N.J.
McIntosh, L. 2007, “Independent public policy research in partisan times”, Canberra Times,6 March.
McLean, I. & Taylor, A. 2001, “Australian growth: A California perspective”, National Bureauof Economic Research Working Paper, WP 8408.
Magee, G. 2000, Knowledge Generation, Technological Change and Economic Growth inColonial Australia. Australian Scholarly Publishing, Melbourne.
Parham, D. 2004,“ICT: An Engine or Enabler of Australia's Productivity Growth?”, AsiaPacific Productivity Conference, Brisbane, July.
Pope, D. & Withers, G. 1995, “The role of human capital accumulation in Australia’s long-term economic growth”, 24th Conference of Economists, Adelaide.
Quigley, J. 1998, “Urban Diversity and Economic Growth”, Journal of EconomicPerspectives, vol. 122, pp. 127–38.
Redding, S. & Schott, P.K. 2003, Distance, Skill Deepening and Development: Will periph-eral countries ever get rich?, NBER Working Paper, No. 9447.
Redding, S. & Venables, A. 2000, “Economic geography and international inequality”,Centre for Economic Policy Research, London, Discussion Paper, DP 2568.
Skilling, D. & Boven, D. 2007, So Far Yet So Close: Connecting New Zealand to the GlobalEconomy, The New Zealand Institute, Auckland, Discussion paper 2007/1, March.
Smith, K. 2007,“Innovation and growth in resource-based economies: Some issues”, man-uscript, February.
Twomey, A. & Withers, G. 2007, Australia’s Federal Future, Federalist paper 1, Council forthe Federation, March.
Withers, G. 2004, Australia’s Population Future, Position Paper, Business Council ofAustralia, Melbourne.
ENDNOTES
1 Prime Minister, Transcript of address, 2 November 2006.
2 See Mclean & Taylor (2001).
3 Also see updates in Battersby (2006) and Dolman, Parham & Zhang (2007).
4 See, for example, New South Wales, ‘People First: the NSW Government ICT StrategicPlan’ (July 2006); Queensland, ‘Communication and Information Strategic Plan’(2006); South Australia, ‘South Australia’s Broadband Strategy’ (October 2006); andVictoria, ‘Broadband Framework: Pathway to the Future’ (April 2005).
5 Industry Steering Committee (2002).
6 L. McIntosh (2007).

28
5
CEDA GROWTH 58
investment
JOHN EDWARDS has been chief
economist for HSBC in Australia
since 1997. Between 1991 and
1994 he was Senior Adviser
(Economic) to Treasurer and then
Prime Minister Paul Keating. Since leaving the Prime Minister’s
office in 1994 he has worked in financial markets. Earlier in his
career he was an economic and political reporter in Sydney,
Canberra and Washington. He holds a PhD in economics from
George Washington University and is the author of four books,
including Keating, a best-selling biography of the former
prime minister, and Curtin’s Gift, a reinterpretation of the wartime
prime minister.
export weakness
The changing pattern
of Australia's integration
into the global economy
The downturn in export growthThough the global economy has experienced thestrongest growth in human history and the prices of com-modities produced by Australia have risen to stellarheights, the growth of Australian exports since the begin-ning of this decade has been persistently disappointing.At first assumed to be temporary, the downturn in exportgrowth from 2000 has defied official forecasts andindustry expectations. In the six years to the Septemberquarter 2006, the volume of exports increased by only 9per cent. In the previous six-year period, by contrast, ithad increased 56 per cent. Because commodity prices roseby half as much again in the six years to the September
strengthinvestment
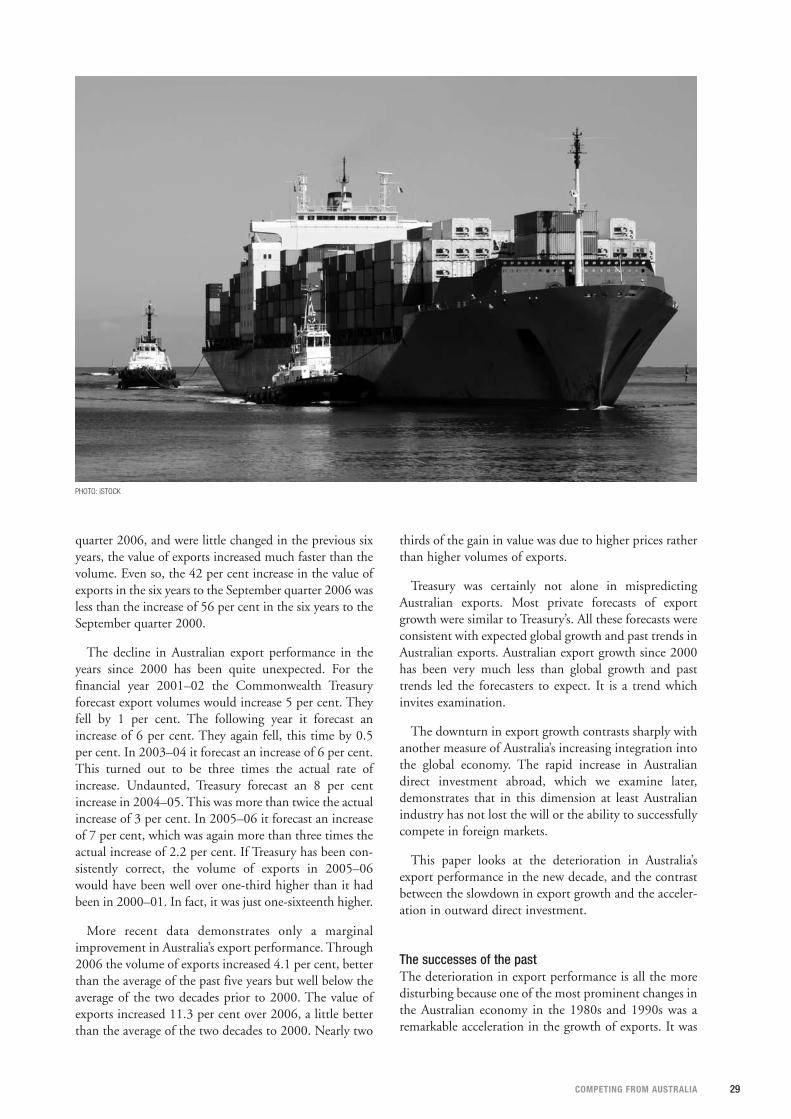
29COMPETING FROM AUSTRALIA
quarter 2006, and were little changed in the previous sixyears, the value of exports increased much faster than thevolume. Even so, the 42 per cent increase in the value ofexports in the six years to the September quarter 2006 wasless than the increase of 56 per cent in the six years to theSeptember quarter 2000.
The decline in Australian export performance in theyears since 2000 has been quite unexpected. For thefinancial year 2001–02 the Commonwealth Treasuryforecast export volumes would increase 5 per cent. Theyfell by 1 per cent. The following year it forecast anincrease of 6 per cent. They again fell, this time by 0.5per cent. In 2003–04 it forecast an increase of 6 per cent.This turned out to be three times the actual rate ofincrease. Undaunted, Treasury forecast an 8 per centincrease in 2004–05. This was more than twice the actualincrease of 3 per cent. In 2005–06 it forecast an increaseof 7 per cent, which was again more than three times theactual increase of 2.2 per cent. If Treasury has been con-sistently correct, the volume of exports in 2005–06would have been well over one-third higher than it hadbeen in 2000–01. In fact, it was just one-sixteenth higher.
More recent data demonstrates only a marginalimprovement in Australia’s export performance. Through2006 the volume of exports increased 4.1 per cent, betterthan the average of the past five years but well below theaverage of the two decades prior to 2000. The value ofexports increased 11.3 per cent over 2006, a little betterthan the average of the two decades to 2000. Nearly two
thirds of the gain in value was due to higher prices ratherthan higher volumes of exports.
Treasury was certainly not alone in mispredictingAustralian exports. Most private forecasts of exportgrowth were similar to Treasury’s. All these forecasts wereconsistent with expected global growth and past trends inAustralian exports. Australian export growth since 2000has been very much less than global growth and pasttrends led the forecasters to expect. It is a trend whichinvites examination.
The downturn in export growth contrasts sharply withanother measure of Australia’s increasing integration intothe global economy. The rapid increase in Australiandirect investment abroad, which we examine later,demonstrates that in this dimension at least Australianindustry has not lost the will or the ability to successfullycompete in foreign markets.
This paper looks at the deterioration in Australia’sexport performance in the new decade, and the contrastbetween the slowdown in export growth and the acceler-ation in outward direct investment.
The successes of the past The deterioration in export performance is all the moredisturbing because one of the most prominent changes inthe Australian economy in the 1980s and 1990s was aremarkable acceleration in the growth of exports. It was
PHOTO: iSTOCK

30
the most widely cited symbol of Australia’s economicrenaissance after several decades of faltering growth andeconomic difficulty.
Though exports accounted for a large share of GDP in19th-century Australia, two World Wars and the GreatDepression in the first half of the 20th century, togetherwith the growth of the services sector, construction, util-ities and of a significant protected import substitutionmanufacturing sector after 1945, saw export growthslowing. At around 8 per cent, export volumes barelychanged as a share of GDP in the 20 years from 1961 to1981.
From the early 1980s, however, exports as a share ofGDP began to rapidly increase. Mineral and energy dis-coveries, the resurgence of Japan and then the rapiddevelopment of Korea and other Asian tigers helpedexports to grow faster than GDP. By 1991 exports were alittle over 14 per cent of GDP. Export growth was checked by the Asian financial crisis in 1997 and1998 but then resumed. By 2001 export volumesreached 19 per cent of GDP.
Not only had exports as a whole grown faster thanGDP over those two decades, but the composition haddramatically changed. In 1980 manufactures1 were 8 percent of all exports. By 2000 they were just short of 20 percent of all exports. The volume of manufactured exportsover the 20 years had increased sevenfold. Though lessspectacular service exports also rapidly increased from 16 per cent of all exports in 1980 to 22 per cent in 2000.
This prolonged export boom changed Australia. Itbrought thousands of domestic Australian businessesinto competition in global markets. The sustained boomin exports stimulated and demanded changes in manage-ment and labour practices, efficiency, supply chaindevelopment and logistics, in transport and marketing,
to meet the global standards to which businesses success-fully aspired. It was accompanied by and depended upona lower and more flexible exchange rate, lower importcosts and lower labour costs, changed workplace regula-tions, and increased productivity.
Mining and farming have been export industries sincethe beginning of European settlement in Australia. In the1980s and 1990s other sectors also began exporting anincreasing share of their output. Australian services andmanufacturing industries transformed themselves intomajor exporters. In 1981 exports were less than one-tenth of manufacturing sales. Twenty years later, theexport share of sales had doubled, even while total salesof manufacturing output had increased by nearly half asmuch again. The motor vehicle industry, which had beenhighly protected and focused on the Australian marketsince inception, exported one-third of its output by theend of the 20th century. In manufactured products toonumerous to catalogue, but including pharmaceuticals,precision instruments, metal fabrication and auto parts,Australian firms found and won export markets.
Inward-bound foreign travel grew so rapidly that bythe end of the century tourism was one of Australia’smajor export industries. Education became an exportindustry, with Australian institutions attracting a dispro-portionately large share of foreign students compared tothe traditional destinations of the United States and theUnited Kingdom. Wine became a $1 billion exportindustry, and then a $2 billion export industry.
What caused the export surge? On the demand sidethe continued rapid growth of East Asia was certainlyone factor, with Australian exports to the region growingfaster than those to Europe and North America. Over the20 years to 2000, Japanese output nearly doubled, whilethe output of Korea, Taiwan and Singapore quadrupled.From well under half of all exports in 1980, exports tothe major Asian markets accounted for well over half in
CEDA GROWTH 58
5
10
15
20
25
2004
/05
1999
/00
1994
/95
1989
/90
1984
/85
1979
/80
1974
/75
1969
/70
1964
/65
1959
/60
FIGURE 1 EXPORTS, AS PERCENTAGE OF GDP, 1959–60 TO 2005–06
Source: ABS, HSBC

31COMPETING FROM AUSTRALIA
2000 – even though the share had dropped in the after-math of the Asia financial crisis.
The growth of new export products, such as tourismand education, reflected the changing demand of foreigncustomers. It is significant too, that the most rapidlygrowing markets for Australia’s elaborately transformedmanufactures were the tiger economies of East Asia.
On the supply side, new supplies of minerals andenergy added to Australia’s export base over the period.
But while new products and new markets were impor-tant, so was the renovation of Australia’s economicframework. Tariff cuts initiated in 1988 and again in1991 reduced costs for Australian exporters, and forcedmanufacturers to either meet import competitionor cease business. If they could meet the competitionof foreign producers at home, they could meet it else-where. Australian manufacturing began exporting.
Export supply and demand were both encouraged byan important long-term result of the 1983 float of theAustralian dollar. The result was that the average exchangerate after the float was much lower than the averageexchange rate before the float. Between 1984 and 1986the trade-weighted value of the currency fell 50 per cent.Over the 20 years from 1986 to 2006 the average trade-weighted value of the Australian dollar was 40 per centless than its value in the 15 years from 1970 to 19862.
The slowdownAt the beginning of the new century, however, this solidgrowth abruptly slowed. The year 2001 proved to bethe peak of the 20-year export boom. By 2005 exportvolumes had fallen to just over 17 per cent of GDP, from19 per cent in 2001. It was the biggest and most sus-tained fall in export volumes as a share of GDP in 45years of data.
Exports accounted for nearly one-third of the entiregrowth of output or GDP over the 20 years from1980–81 to 2000–01. In the five financial years to2005–06, they accounted for only a little more than one-sixteenth of output growth.
The value of exports has increased at roughly the samerate as nominal GDP, but three-quarters of that growth inexport value in the new decade was accounted for byincreases in prices – principally mining commodities, andespecially iron ore and coal. This strength in commodityprices disguises the deterioration in Australia’s underlyingexport performance. The cumulative trade deficit, or gapbetween exports and imports, has been markedly wider asa share of GDP in the five years to 2005–06 than in theprevious five years. Without commodity price increases,however, it would have been very much worse. Hadexport prices remained the same in 2005–2006 as in2000–2001, for example, and had nothing else changed,the trade deficit in 2005–06 would have been twice ashigh as it was. It would have been 3.6 per cent of GDPinstead of 1.8 per cent of GDP3, or $35 billion insteadof $17 billion.
There was considerable concern too, that the composi-tion of export growth also appeared to change in the newdecade. In terms of values (though as we shall see, thestory is quite different for volumes), export compositionbegan reverting towards an earlier pattern. Rather thangrowing faster than exports as a whole, the value ofservices and manufacturing exports increased much moreslowly in the six years to 2005–06 than in the previoussix years. The value of manufactured exports increasedonly 9 per cent over the six years, compared to over 60per cent in the previous six years. The value of serviceexports increased only 21 per cent over the period,compared to an increase of nearly 60 per cent inthe previous six years – even disregarding the spike inservice exports due to the sale of TV rights in the 2000Olympic Games.
-5
0
5
10
15
20
2005
/06
2004
/05
2003
/04
2002
/03
2001
/02
2000
/01
1999
/00
1998
/99
1997
/98
1996
/97
1995
/96
1994
/95
1993
/94
1992
/93
1991
/92
1990
/91
1989
/90
1988
/89
1987
/88
1986
/87
1985
/86
1984
/85
1983
/84
1982
/83
FIGURE 2 EXPORT VOLUME GROWTH, PERCENTAGE CHANGE, 1982–83 TO 2005–06
Source: ABS, HSBC

32
Australia’s poor export performance contributed to thesize of trade deficits during the first half of this decade,and thus to the current account deficit and the additionto Australia’s net foreign liabilities over the period. By2006 net foreign liabilities had increased to 60 per centof GDP. The ratio will continue to increase faster thanGDP, and the servicing costs of foreign debt faster thannational income, unless and until Australia can run a per-manent trade surplus – a circumstance uncommon in itswhole history. Improving exports is a necessary part ofthe adjustment Australia must eventually make if it is toretain control of its own economic destiny.
Before examining the downturn in more detail, weshould note that most of the general supply and demandfactors that encouraged the higher rate of growth ofexports in the 20 years to 2000 continued into the newdecade. East Asian growth was checked by the 1997financial crisis, but has since picked up. China hasbecome a much more important market to Australia.There has been no lack of demand for Australian com-modity exports. The currency has been up and down, buton average has remained cheaper than it was in the yearsbefore 1983. So too, the change in Australia’s economicframework and in the intensity of competition remain asthey were a decade ago.
In examining the downturn in more detail, we will lookfirst at export volumes and then at export values. In eachcase we will look at minerals and energy commodities,farm commodities, manufactured exports, and services.The results of this enquiry are unexpected.
Export volumesCompared to the previous 20 years, the rate of growth ofexports volumes has plummeted during this decade.Over the financial years 2000–2001 to 2005–2006 theincrease in the volume of goods exports averaged 2.1 percent, less than a third of the average growth of 7.3 percent from 1982–1983 to 2000–2001.
It is no surprise that rural exports have fallen, givenback-to-back droughts. The volume of rural exports fellby an average of 0.7 per cent a year in the new decade,compared to an increase of 4 per cent on average in theyears of rapid export expansion from 1982–83 to2000–01.
It is also no surprise that the volume of metal ores andminerals exports has been growing quite well in the newdecade. This category includes iron ore. The averageannual increase in the volume of metal ores and mineralsexports from 2000–2001 to 2005–06 was 6 per cent,compared to a 4 per cent average annual increase from1982–83 to 2000–2001. However, given the strength ofglobal demand and the incentive of a sharp increase inprices, the volume increase on the previous decade issomewhat less than might have been expected.
Rural exports are down and metals ores exports are up,but in many other respects the pattern of export growthis surprising.
Though widely thought to be a high growth per-former, for example, the rate of growth of the volume of exports of coal, coke and briquettes fell to an averageof 5 per cent from 2000–2001 to 2005–06, compared toa 7 per cent average in the years from 1982–83 to2000–01. This reflects both constraints in mine andtransport capacity, and also China’s ability to increase itsown production of coal.
Metals exports (excluding non-monetary gold) fell by anaverage of 1.6 per cent a year from 2000–01 to 2005–06,compared to an average increase of 6.4 per cent from1982–83 to 2000–01. This is probably due not to fallingglobal demand but to the closing down of some metalsproduction in the late 1990s and early in the 2000s.
Reflecting declining oil production, the volume ofexports of “other mineral fuels” have fallen on average2.7 per cent a year this decade, compared to a gain of 12per cent a year in the earlier period.
CEDA GROWTH 58
FIGURE 3 THE MAKE-UP OF EXPORTS BY VALUE, SEASONALLY ADJUSTED $ BILLION,1983–2006
0
10
20
30
40
50
60
Machinery, transport equipment, other manufactures
Metal ores & minerals, other mineral fuels, coal coke and briquettes, metals
Rural Exports
2006
2005
2004
2003
2002
2001
2000
1999
1998
1997
1996
1995
1994
1993
1992
1991
1990
1989
1988
1987
1986
1985
1984
1983
Source: ABS, HSBC

33COMPETING FROM AUSTRALIA
The volume of gold exports is well down. Gold exportsrose an average of 26 per cent a year between 1982–83and 2000–2001, and have on average fallen by 1.8 percent a year since. Falling gold production is the maincause, though the earlier numbers were also inflated bylarge gold sales by the Reserve Bank of Australia.
Summing the major minerals, metals and energyexports categories (metal ores and minerals, coal cokeand briquettes, other minerals fuels, and metalsexcluding gold) shows that the rate of growth of the totalvolume of these exports (measured in 2004–05 dollars)fell to 2 per cent in the years from 2000–01, less thanone-third of the average growth rate of 6.6 per cent from1982–83 to 2000–01.
After making up more than half of all goods exportsthrough the 1970s and 1980s, exports of these metalsminerals and energy as a share of all goods exports havedeclined to around 45 per cent in recent years.(Including non-monetary gold, the change in minerals,metals and energy is even more dramatic. Adding goldbrings the total of these exports up to half of all goodsexports. The average rate of growth from 1982–83 to2000–01 climbs to 7 per cent, and falls to an averageof 1 per cent in the new decade. The calculation is,however, influenced by 1997 gold sales by the ReserveBank.)
Roughly half of the decline in the growth of Australianexport volumes in the new decade is attributable to a declinein the rate of growth of minerals, metals and energy exports,widely believed to be growing exceptionally quickly.
This is remarkable enough. But what is equally remark-able is that even though growing much more slowly thanin the earlier period, the volume of manufacturingexports has on average increased faster than the volume ofall goods exports in the period 2000–01 to 2005–06. The
volume of manufactured exports has been rising atroughly the same rate as the volume of coal exports.While exports of oil, metals excluding gold and gold itselfhave all declined in the 2000s, the volume of manufac-tured exports has increased.
The sum of the ABS categories of exports of machinery,transport equipment and “other manufactures” rose at anannual average rate of 4 per cent over the years from2000–01 to 2005–06, compared to 11 per cent from theyears 1982–83 to 2000–01. This group corresponds toelaborately transformed manufactures. Of its compo-nents, machinery exports slowed from an average of 14.4per cent to 4.7 per cent, transport equipment from 13 percent to 2 per cent, and other manufactures from 10 percent to 4.5 per cent. These three categories of manufac-tured exports have doubled in importance in the last 20years. In the mid-1980s they accounted for 10 per cent ofgoods exports. Today they account for 20 per cent.
Services export growth also slowed, from an annualaverage of 8 per cent – slightly above the average of goodsexports in the earlier period – to an annual average of 2per cent, or slightly below the average of goods exports inthe later period. This calculation is distorted by the saleof media rights to the Sydney Olympics, which werebooked in 2000. Even so, the level of services exports hasbeen flat for most of this decade. Travel services increaseda little, but there was a gentle decline in “other services”.There are measurement issues here that need to be bornein mind. The volume of overseas tourist services is notdirectly included, but it is separately estimated and showssteady growth over the last decade or more. It has alsoproved difficult to measure the value of educationservices exports. But as a share of export volumes overall,services accounted for around one-quarter, so theslowdown in services credits contributed to the slowgrowth of exports overall.
FIGURE 4 THE MAKE-UP OF EXPORTS BY VOLUME, INDEX, 1983–2006
0
30
60
90
120
150
Machinery, transport equipment, other manufacturesMetal ores & minerals, other mineral fuels, coal coke and briquettes, metalsRural Exports
2006
2005
2004
2003
2002
2001
2000
1999
1998
1997
1996
1995
1994
1993
1992
1991
1990
1989
1988
1987
1986
1985
1984
1983
Source: ABS, HSBC

34
It is apparent that the slowdown in the growth ofvolumes of exports is quite widely based, but taking intoaccount the change in growth and their relative impor-tance in the export mix, most of the slowdown is due torural exports, oil, metals, gold, and services.
The story is not much changed if we take a morerecent period. It is again the case that the real weakness isin some commodity exports (see Appendix 2).
Export valuesThe story with export values is different, but not quite asdifferent as one might expect.
The difference between values and volumes is theinfluence of price changes. These changes may be in theforeign currency or international prices of the goods andservices. They may be changes in Australian dollar pricesindependent of currency changes, though it is unusual tohave major exports priced in Australian dollars. Therecorded value of the exports may also change because ofchanges in the value of the Australian dollar, independ-ently of a change in foreign currency price.
The foreign exchange value of the Australian dollar isvolatile, and over longer periods its influence may not beimportant. But from the end of 1996 to the first quarterof 2001 the Australian dollar depreciated, from peak ofnearly $US0.80 to a low of a little under $US0.50. Thishuge move had the effect of increasing the Australiandollar value of exports priced (as most commodities are)in US dollars. The subsequent appreciation from under$US0.50 to around $US0.75 had the opposite effect.
Quite apart from the effect it may or may not have hadin increasing the competitiveness of Australian exports orencouraging capital and labour into producing exports,the currency depreciation thus had the mechanical effectof increasing export values in the second half of the1990s, and diminishing them in the new decade. Sincevolume growth was also declining, the effect would havebeen to reinforce a slowdown in value growth. As weshall see, however, it was offset by increases in the USdollar prices of some commodities, especially metals, inthe new decade.
Though less marked than with volumes, there is still amarked slowdown in export values growth in the past 5years compared with the previous 18 years. The value ofgoods exports increased at an average rate of 10.2 per
cent in the earlier period, and 5.6 per cent in the mostrecent period.
The decline in rural exports is again an important partof the story, with an average increase of 7.8 per cent inthe earlier period and an average fall of 2.6 per cent inthe latter. The improvement in metal ores and mineralsexports is more marked, with an 8.2 per cent averageannual increase in the first period and 15 per cent in thesecond. In terms of volumes, the growth of coal exportsslowed in the second period. In terms of values, it accel-erated quite markedly, from an average 9 per cent in thefirst period to a 21 per cent increase in the second. Thegrowth of oil exports slowed markedly from 20 per centaverage growth in the first period to 1.3 per cent averagegrowth in the second. Metals fared better in values thanvolumes, though the growth rate declined. It was 11 percent in the first period and 3 per cent in the second.
Probably because of the exchange rate appreciation inthe past five years, along with stiff global competition,the value of more elaborately transformed manufacturedexports did not increase as fast as volumes in this period,whereas the reverse was true of the earlier 18-year period.Machinery exports fell 1.4 per cent on average in thesecond period after rising 5 per cent on average in thefirst period; transport equipment rose only 1.5 per centafter rising 13.4 per cent on average in the earlier period,and other manufactures rose only 2 per cent a year onaverage compared to 13.4 per cent on average in theearlier period.
The growth of gold exports was well down, but valueswere better than volumes.
Corresponding to the change in volumes the annualaverage growth in the value of services exports slowed to3 per cent this decade, compared to a 12 per cent averagein the previous 18 years.
It is evident from these results that the main contribu-tions to the marked decline in the rate of growth ofexport values came from rural exports, services, elabo-rately transformed manufactures and oil. These wereonly partly offset by sharp increases in the values ofexports of metals ores and coal.
In the two major periods we have been looking at,export growth slowed in the second period compared tothe first, but it slowed more for volumes than values. Itwas also true that commodity exports were by and largeresponsible for the decline in volumes growth, while thedecline in value growth was more broadly based and theperformance of manufactures and services in particularshowed more deterioration.
Volumes versus valuesMovement in volumes and values are both important, fordifferent reasons. It is the change in values of exports andimports which is recorded in the trade balance, which is
CEDA GROWTH 58
... most of the (export growth)
slowdown is due to rural exports,
oil, metals, gold, and services.

35COMPETING FROM AUSTRALIA
part of the current account balance. Even with no changein the volume of exports, a change in the value of exportswill change the trade balance and therefore the currentaccount balance. Since a current account deficit must bematched by an equal addition of liabilities to foreigners(whether as additional investment inflow, or additionalforeign borrowing), the size of the current accountbalance is important.
The value of exports is also important in changingdollar incomes of Australians. Even without highervolumes, a higher value of exports will increase profits forexporters and see labour and capital attracted towardsthat industry.
The standard calculation of “real” GDP or after infla-tion output and income will eliminate the independentinfluence of price changes. The percentage increase in thevalue of exports will be reduced by the percentage increasein the price of exports, and the result is the percentagechange in the volume of exports. The bigger the priceincrease, the more will be taken off export values growthto reach export volumes growth. The same will apply toimports. When the value is adjusted for price changes inthis way to arrive at the underlying volume change, it issaid to be “deflated”.
The ABS also publishes a GDP measure intended toshow an effect on real incomes of a change in Australia’sterms of trade, or the ratio of export prices to importprices. The technique it uses here is essentially to deflateexports by the change in import prices and imports bythe change in export prices. If export prices are risingfaster than import prices (which has been true inAustralia most of this decade), then the effect of this cal-culation is to increase apparent export volumes anddecrease apparent import volumes. Since export volumesare added to the calculation of GDP and imports are sub-tracted from it, the overall result is to increase real GDP(and real incomes) compared to the normal method ofcalculation.
Price is also important, of course, because sooner orlater changes in relative prices cause change in volumes.Higher relative prices ought to cause more production,lower relative prices less.
In these respects the value of exports is significant, evenif there is no change in volumes. But the change involumes is also important. While price changes mayguide changes in production, the average price of anexport will stabilise over time (other than for a generalinflation trend) and the returns to exporters will be deter-mined by changes in volume. It is also true that it is thevolume of exports that shows actual production oftonnes of iron or coal, and that is therefore most closelytied to the number of employees in the industry, thenumber of mines, factories and facilities. It is volumesthat are counted in the normal calculation of GDP.
The differences in trends between volumes and valuesis instructive. It guides us to what is better than itappears, and what it worse than it appears. Because thevolume of manufactured exports is rising while the valueis falling, for example, we can conclude that this exportcategory has not become uncompetitive. It is doingbetter than it seems. Because the volume of coal exportsis falling while values are rising, we can conclude thatincreases in supply are constrained. There is clearly aproblem with coal exports.
Explaining the downturnIt is apparent from the detailed examination of exportcategories that no single reason explains Australia’s poorperformance since 2000. It does seem clear that demandinfluences have played an important role for manufac-turing and for services.
For manufacturers, the high real effective exchange rate and the appreciation of the Australian dollar againstthe US dollar from the bottom of its range to the upperpart of its range in the years from 2000 to 2006 would certainly have cut profit margins and discouraged sales.
Even so, the fact that the volume of manufacturingexports rose faster than the volume of commodityexports over the period suggests the price effect on eitherdemand or supply was less than might have beenexpected. The mechanical effect of currency appreciationin lowering the Australian dollar returns from salesinvoiced in foreign currency is unavoidable, and wouldshow up as reduced value of exports. But the increase involumes indicates that Australian manufacturesproduced more, despite lower Australian dollar prices.
It is also true that the value of some elaborately trans-formed manufactures has been growing quickly. This istrue of the ABS export categories of inorganic chemicals,pharmaceuticals, fertilisers, plastics, chemicals, metalsmanufactures, power-generating equipment, generalindustrial machinery and equipment, electrical equip-ment, and professional, scientific and controllinginstruments.
Wine is another high value-added product, notincluded in the manufacturing totals, that has done well.The rate of growth has slowed, but the value of beverageexports nonetheless increased by over one-third to justshort of $3 billion in the five years to 2006.
The area of greatest disappointment in Australianmanufacturing exports has been motor vehicles. Thelevel of exports has held up quite well, with exports in2006 at $3.8 billion, only a little below the level of $4.3billion in 2000 when the currency was much cheaper.However, in the previous six years motor vehicle exportshad more than doubled.
Metals may be thought of as simply (as opposed toelaborately) transformed manufactures. By value, some
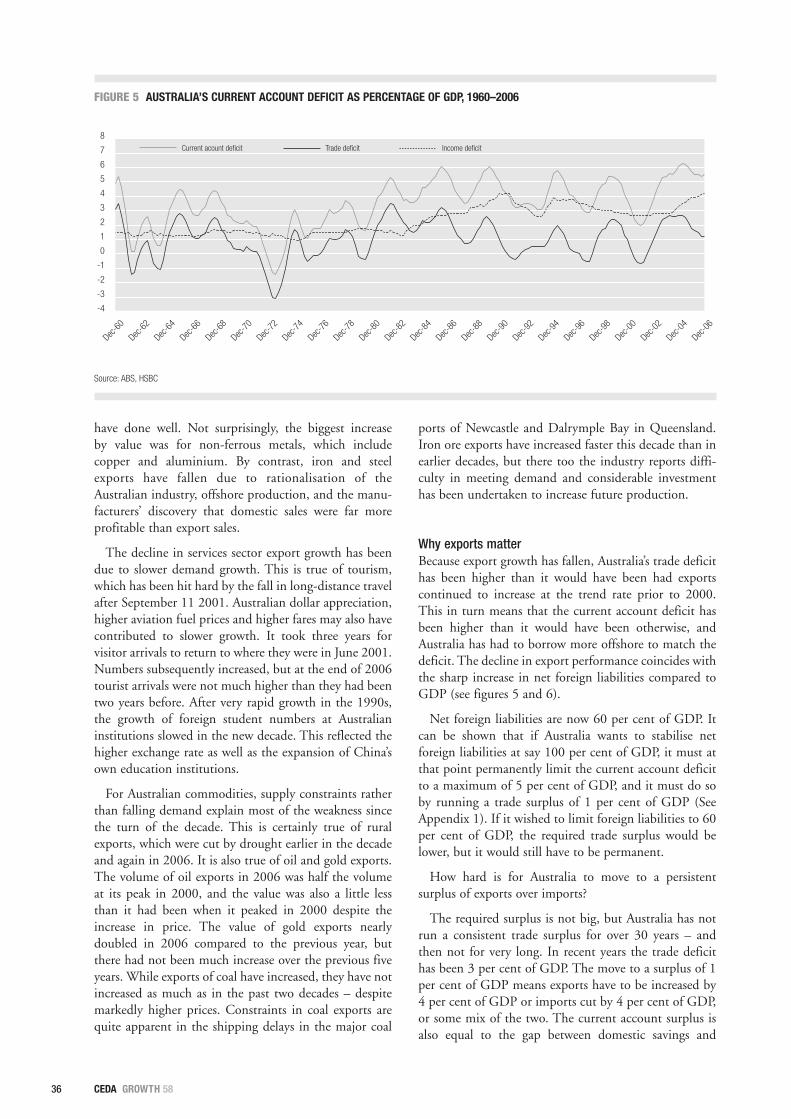
36
have done well. Not surprisingly, the biggest increase by value was for non-ferrous metals, which includecopper and aluminium. By contrast, iron and steelexports have fallen due to rationalisation of theAustralian industry, offshore production, and the manu-facturers’ discovery that domestic sales were far moreprofitable than export sales.
The decline in services sector export growth has beendue to slower demand growth. This is true of tourism,which has been hit hard by the fall in long-distance travelafter September 11 2001. Australian dollar appreciation,higher aviation fuel prices and higher fares may also havecontributed to slower growth. It took three years forvisitor arrivals to return to where they were in June 2001.Numbers subsequently increased, but at the end of 2006tourist arrivals were not much higher than they had beentwo years before. After very rapid growth in the 1990s,the growth of foreign student numbers at Australianinstitutions slowed in the new decade. This reflected thehigher exchange rate as well as the expansion of China’sown education institutions.
For Australian commodities, supply constraints ratherthan falling demand explain most of the weakness sincethe turn of the decade. This is certainly true of ruralexports, which were cut by drought earlier in the decadeand again in 2006. It is also true of oil and gold exports.The volume of oil exports in 2006 was half the volumeat its peak in 2000, and the value was also a little lessthan it had been when it peaked in 2000 despite theincrease in price. The value of gold exports nearlydoubled in 2006 compared to the previous year, butthere had not been much increase over the previous fiveyears. While exports of coal have increased, they have notincreased as much as in the past two decades – despitemarkedly higher prices. Constraints in coal exports arequite apparent in the shipping delays in the major coal
ports of Newcastle and Dalrymple Bay in Queensland.Iron ore exports have increased faster this decade than inearlier decades, but there too the industry reports diffi-culty in meeting demand and considerable investmenthas been undertaken to increase future production.
Why exports matterBecause export growth has fallen, Australia’s trade deficithas been higher than it would have been had exportscontinued to increase at the trend rate prior to 2000.This in turn means that the current account deficit hasbeen higher than it would have been otherwise, andAustralia has had to borrow more offshore to match thedeficit. The decline in export performance coincides withthe sharp increase in net foreign liabilities compared toGDP (see figures 5 and 6).
Net foreign liabilities are now 60 per cent of GDP. Itcan be shown that if Australia wants to stabilise netforeign liabilities at say 100 per cent of GDP, it must atthat point permanently limit the current account deficitto a maximum of 5 per cent of GDP, and it must do soby running a trade surplus of 1 per cent of GDP (SeeAppendix 1). If it wished to limit foreign liabilities to 60per cent of GDP, the required trade surplus would belower, but it would still have to be permanent.
How hard is for Australia to move to a persistentsurplus of exports over imports?
The required surplus is not big, but Australia has notrun a consistent trade surplus for over 30 years – andthen not for very long. In recent years the trade deficithas been 3 per cent of GDP. The move to a surplus of 1per cent of GDP means exports have to be increased by4 per cent of GDP or imports cut by 4 per cent of GDP,or some mix of the two. The current account surplus isalso equal to the gap between domestic savings and
CEDA GROWTH 58
FIGURE 5 AUSTRALIA’S CURRENT ACCOUNT DEFICIT AS PERCENTAGE OF GDP, 1960–2006
-4
-3
-2
-1
0
1
2
3
4
5
6
7
8Income deficitTrade deficitCurrent acount deficit
Dec-0
6
Dec-0
4
Dec-0
2
Dec-0
0
Dec-9
8
Dec-9
6
Dec-9
4
Dec-9
2
Dec-9
0
Dec-8
8
Dec-8
6
Dec-8
4
Dec-8
2
Dec-8
0
Dec-7
8
Dec-7
6
Dec-7
4
Dec-7
2
Dec-7
0
Dec-6
8
Dec-6
6
Dec-6
4
Dec-6
2
Dec-6
0
Source: ABS, HSBC

37COMPETING FROM AUSTRALIA
domestic investment. Looking at the requirement for sta-bilisation of foreign liabilities to GDP from this point ofview, it means Australia has to save 4 per cent of GDPmore than it does, or invest 4 per cent of GDP less, orsome mix of the two.
Australia experienced a business investment boom inthe three years to 2006, much of it in mining. No doubt,that investment will result in higher export production incoming years. It would take several years of growth at therate achieved towards the end of 2006 to restore exportvolumes to the same share of GDP they had reached atthe beginning of the decade.
The unexpected and disappointing export perform-ance of the new decade caught Australia by surprise. Theexperience contains an important lesson. Almost all tradepolicy emphasis for the last several decades has been onmeasures to increase the foreign demand for Australiangoods and services. This policy objective motivatesAustralia’s leading participation in the World TradeOrganisation and its search for regional trade agree-ments. It rationalises government support for exportmarketing through Austrade and export financingthrough EFIC and AusAid.
But the lesson of the new decade is that failures ofsupply can be as damaging as failures of demand.Accordingly, restoring Australia’s export success and, indoing so, stabilising the rate of growth of foreign liabili-ties compared to GDP requires policies that influencesupply. These include the removal of infrastructure bot-tlenecks, the provision of additional infrastructure tomeet expected demand, programs in education, trainingand retraining that increase the supply of skilled workers,and programs that support the basic science, engineeringand research and development that no single businesscan make commercially viable.
The investment revolutionThough the deterioration of export performance mightsuggest Australian business is less interested in seekingsuccess in the global economy, the acceleration of directoffshore investment shows otherwise. Far from retreatingfrom the global economy, Australian businesses integra-tion into it has accelerated (see figure 7).
A quarter of a century ago the stock of Australiandirect investment abroad was only one-fifth of the stockof foreign direct investment in Australia. (As distinctfrom portfolio investment, direct investment is where theinvestor owns ten per cent or more of the business). Evenby the beginning of the 1990s, Australian investmentabroad was less than half of foreign direct investment inAustralia. Over the last two decades the stock of foreigndirect investment in Australia has trebled, while the stockof Australian direct investment abroad has increasedseven-fold. Australian direct investment abroad nowrivals foreign direct investment in Australia. By the endof 2006 the stock of direct Australian investment abroad(AIA) was $286 billion, compared to the stock of foreigndirect investment (FDI) in Australia at $312 billion. Injust 20 years the stock of Australian direct investmentabroad increased from 32 per cent to 92 per cent of thestock of foreign direct investment in Australia.
Given these trends, it will not be long before Aus-tralian business assets abroad exceed foreign businessassets in Australia. It is already the case, for example, thatthe value of Australian direct investment in the US very considerably exceeds the value of US direct investment inAustralia. Were it not for the change in the domicile ofNews Corporation, a transaction that reduced the stockof Australian investment abroad and at the same timeincreased the stock of foreign investment in Australia,Australian ownership of foreign businesses worldwidewould already exceed foreign ownership of Australianbusinesses.
FIGURE 6 AUSTRALIA’S FOREIGN LIABILITIES, PERCENTAGE OF GDP, 1988–2006
0
10
20
30
40
50
60
70
80
Net foreign debt Net equity liabilitiesNet foreign liabilities
Dec-0
6
Dec-0
5
Dec-0
4
Dec-0
3
Dec-0
2
Dec-0
1
Dec-0
0
Dec-9
9
Dec-9
8
Dec-9
7
Dec-9
6
Dec-9
5
Dec-9
4
Dec-9
3
Dec-9
2
Dec-9
1
Dec-9
0
Dec-8
9
Dec-8
8
Source: ABS, HSBC
NOTE: NEGATIVE NUMBERS ARE SURPLUSES
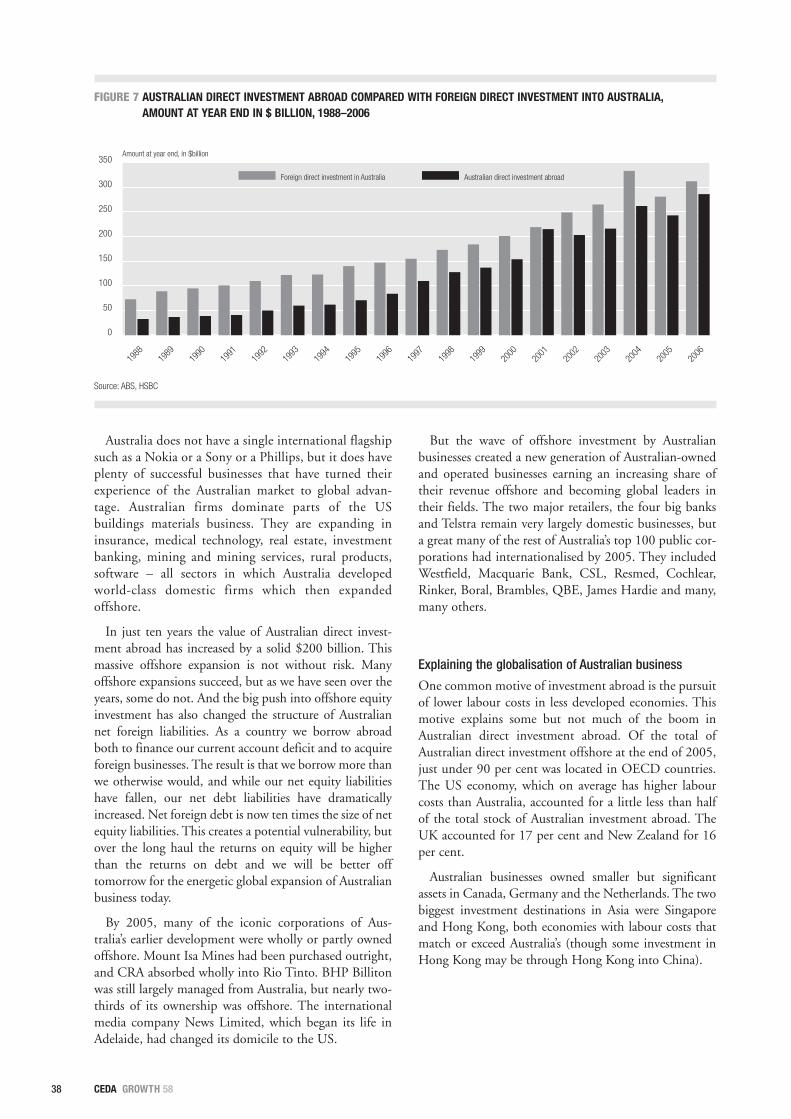
38
Australia does not have a single international flagshipsuch as a Nokia or a Sony or a Phillips, but it does haveplenty of successful businesses that have turned theirexperience of the Australian market to global advan-tage. Australian firms dominate parts of the USbuildings materials business. They are expanding ininsurance, medical technology, real estate, investmentbanking, mining and mining services, rural products,software – all sectors in which Australia developedworld-class domestic firms which then expandedoffshore.
In just ten years the value of Australian direct invest-ment abroad has increased by a solid $200 billion. Thismassive offshore expansion is not without risk. Manyoffshore expansions succeed, but as we have seen over theyears, some do not. And the big push into offshore equityinvestment has also changed the structure of Australiannet foreign liabilities. As a country we borrow abroadboth to finance our current account deficit and to acquireforeign businesses. The result is that we borrow more thanwe otherwise would, and while our net equity liabilitieshave fallen, our net debt liabilities have dramaticallyincreased. Net foreign debt is now ten times the size of netequity liabilities. This creates a potential vulnerability, butover the long haul the returns on equity will be higherthan the returns on debt and we will be better offtomorrow for the energetic global expansion of Australianbusiness today.
By 2005, many of the iconic corporations of Aus-tralia’s earlier development were wholly or partly ownedoffshore. Mount Isa Mines had been purchased outright,and CRA absorbed wholly into Rio Tinto. BHP Billitonwas still largely managed from Australia, but nearly two-thirds of its ownership was offshore. The internationalmedia company News Limited, which began its life inAdelaide, had changed its domicile to the US.
But the wave of offshore investment by Australianbusinesses created a new generation of Australian-ownedand operated businesses earning an increasing share oftheir revenue offshore and becoming global leaders intheir fields. The two major retailers, the four big banksand Telstra remain very largely domestic businesses, buta great many of the rest of Australia’s top 100 public cor-porations had internationalised by 2005. They includedWestfield, Macquarie Bank, CSL, Resmed, Cochlear,Rinker, Boral, Brambles, QBE, James Hardie and many,many others.
Explaining the globalisation of Australian business
One common motive of investment abroad is the pursuitof lower labour costs in less developed economies. Thismotive explains some but not much of the boom inAustralian direct investment abroad. Of the total ofAustralian direct investment offshore at the end of 2005,just under 90 per cent was located in OECD countries.The US economy, which on average has higher labourcosts than Australia, accounted for a little less than halfof the total stock of Australian investment abroad. TheUK accounted for 17 per cent and New Zealand for 16per cent.
Australian businesses owned smaller but significantassets in Canada, Germany and the Netherlands. The twobiggest investment destinations in Asia were Singaporeand Hong Kong, both economies with labour costs thatmatch or exceed Australia’s (though some investment inHong Kong may be through Hong Kong into China).
CEDA GROWTH 58
FIGURE 7 AUSTRALIAN DIRECT INVESTMENT ABROAD COMPARED WITH FOREIGN DIRECT INVESTMENT INTO AUSTRALIA,AMOUNT AT YEAR END IN $ BILLION, 1988–2006
0
50
100
150
200
250
300
350
Australian direct investment abroadForeign direct investment in Australia
2006
2005
2004
2003
2002
2001
2000
1999
1998
1997
1996
1995
1994
1993
1992
1991
1990
1989
1988
Amount at year end, in $billion
Source: ABS, HSBC

39COMPETING FROM AUSTRALIA
The stock of Australian investment in China was stillunder $1 billion at the end of 2005; in Indonesia it wasonly $0.8 billion.
These shares in the stock of direct investment abroadhave not much changed in recent years. Most investmentcontinues to go into the US, the UK and New Zealand.Investment in China is growing, but remains quite small.
The forces driving this change are readily apparent.Businesses that succeed in Australia often do so againstinternational competition, and in a market that hasmany of the same characteristics as other developedcountry markets. More effective competition law inAustralia in the last two decades has forced successfulAustralian businesses to look offshore for expansion,rather than absorbing the domestic competition.
The destination of foreign investment reveals a greatdeal about the motives and drivers of Australian invest-ment abroad. Partly because of its small population,relatively high labour costs and the past decades of tariffprotection, Australia has developed very few mass marketmanufacturing industries. It is typically these industriesthat have relocated their labour-intensive processes intoEast Asia over recent decades. Japan, Korea, and Taiwan,for example, have moved much of their manufacturinginto China. Australia did not have much labour-intensivemass market manufacturing to move4.
A 2002 survey by the Productivity Commission askedcompanies why they invested offshore. Not surprisingly,it found that “improved access to overseas markets is byfar the most important commercial factor influencingdecisions by Australian firms to move offshore”. In somecases and especially for manufacturers, lower labour costswere important. Other motives included closer prox-imity to shareholders, deeper capital markets, morecongenial tax regimes, and a wider spread of market andproduction risks.
The typical Australian globaliser is a business that hasbeen successful in Australia but has outgrown the rela-tively small home market. Stronger competition laws inAustralia over the last few decades have discourageddomination of the home market by a single business,increasing the pressure to look offshore.
Economic globalisation increases the opportunities fordifferentiation and specialisation by vastly increasing themarket size. One implication is that successful globalisers
are not necessarily big businesses, though they will oftenbe dominant within their market segment in Australia.Offshore investment reflects specialisation rather thansize. In the last decade or so the typical successfulbusiness has intellectual property, marketing and man-agement skills and a business concept that have beensuccessful in Australia and can be replicated elsewhere.Globalisation encourages midsized specialists againstnational heavyweights.
Australia is a wealthy OECD country, with similar char-acteristics to other wealthy OECD countries – especiallythe US, UK, Canada and New Zealand. For example, theAustralian economy has a very large service sector thatutilises world-class management, marketing and tech-nology. Because of its characteristics and preferences it hasdeveloped particular skills in transport and logistics,medicine, real estate and residential development, fundsmanagement and finance generally, sport, gambling, farmtechnologies, mining and mining services.
Boral, Rinker and James Hardie dominate sectors ofthe US building materials market. The global businessesof medical technology firms CSL, Resmed and Cochlearare now much more important than their Australianbusinesses. In logistics, Brambles dominates the globalmarket for shipping pallets. In finance, Macquarie Bankis important in infrastructure funds management, QBEin insurance, Westfield in shopping mall developmentand management, Lend Lease in construction, BHP andWoodside in mining, WorleyParsons in mining services,Foster’s in alcohol, PBL in gambling and Amcor inpackaging. These are just a few of hundreds ofAustralian businesses, large and small, public andprivate, which have substantial businesses offshore aswell as in Australia.
Export failure, investment successThe deterioration in Australia’s export performance isnot due to the failure of Australian manufacturing tocompete, as is sometimes supposed. On the contrary, thefacts suggest that while manufacturing exports are notgrowing as fast as in the previous two decades, they haveheld up as least as well as exports of metals, minerals andenergy this decade. The downturn in service exportgrowth is related to lower demand growth for Australianeducation services, and lower growth in long haul flighttourism. Otherwise, much of the weakness has been pre-cisely in those export categories where Australia isthought to be doing well – metals, energy and minerals.The shortcomings are in supply rather than demand, andthe remedies must be at home rather than abroad. Moreattention to Australia’s export infrastructure needs andworkforce skills must be part of the solution. Meanwhile,as is apparent in the acceleration of direct business invest-ment abroad, Australia’s integration into the globaleconomy flourishes in new ways.
... Globalisation encourages
midsized specialists against
national heavyweights.
40
Appendix 1: Stabilising Australia’s net foreign liabilities
It is noted earlier in this paper that if Australia wants tostabilise net foreign liabilities at, say, 100 per cent ofGDP, it must at that point permanently limit the currentaccount deficit to a maximum of 5 per cent of GDP, andit must do so by running a trade surplus of 1 per cent ofGDP
The current account deficit is also equal to the excessof domestic investment over domestic saving. In prin-ciple, the additional liability created by the currentaccount deficit is matched by additional investment,which will service that liability. Not all the additionalinvestment, however, is capable of servicing the addi-tional liability. About half of the increased investment inthe last decade has been in the construction of houses.These houses provide many valuable services, but there isonly a tenuous link between the quality and cost of thehousing stock, and a nation’s capacity to export and thusservice debt.
Business investment has certainly increased, but not allof business investment is capable of servicing anincreased liability by adding to output. The capital stockis roughly five times the size of annual investment, andeach year roughly one-tenth of capital stock wears out.Depending on the asset type, around half of total newinvestment therefore only replaces worn out capital,rather than adding to the capital stock. Since this pro-portion of new investment does not increase the existingcapital stock, it cannot add to output.
The best measure of an additional capacity to servicedebt is the addition to net capital stock. This varies butin the period 1990–91 to 2004–05 it averaged around 5per cent of GDP. There is a good argument for saying theaverage addition to net capital stock (excluding housing)should also be the average maximum sustainable currentaccount deficit. If the current account deficit is biggerthan the addition to net productive capital stock, theadditional liabilities must be bigger than the additionalproductive assets. Part of the offshore borrowing musthave been used to sustain the existing capital stock,household consumption and house building. Since theadditional debt has to be serviced, the result would be arelative decline in living standards in future years.
This rule sets a desirable limit to the current accountdeficit. It does not say the foreign lenders will not providethe funding to exceed it. It does say that beyond about 5 per cent of GDP Australians are using foreign savings tofund household consumption, house building, and thedepreciation of existing business capital rather than thecreation of assets which would service the new debt.
A deficit of around 5 per cent of GDP is actuallyhigher than the 4.3 per cent average of the 14 years ofexpansion to the end of 2005, and would not thereforeappear to be a difficult challenge. It will increasinglybecome so, however, because of the iron arithmetic of thecurrent account.
The first proposition in this arithmetic is that theAustralian economy grows by around 5 per cent a year onaverage, including both increase in the volume of goodsand services and the increase in their prices. The secondis that net foreign liabilities are now equal to 60 per centof GDP. The third is that foreign lenders and investorsexpect to receive a return of around 6 per cent on theirAustralian assets.
Those three propositions have some powerful implica-tions. The first result is that any current account deficithigher than 3 per cent of GDP will see net foreign liabil-ities increasing as a share of GDP. (This is because 3 percent of 100 is 5 per cent of 60.)
The second is that the cost of servicing existing liabili-ties is 3.6 per cent of GDP. (This is because 6 per cent of60 is 3.6 per cent of 100.)
It follows that to stabilise net foreign liabilities at 60per cent of GDP Australia would need to run a tradesurplus of at least 0.6 per cent of GDP. This is becausethe net income deficit or cost of servicing foreign liabili-ties is a component of the current account deficit, andthe net income deficit is 3.6 per cent of GDP. To get thecurrent account deficit down to 3 per cent requires atrade surplus of 0.6 per cent.
When net foreign liabilities are 100 per cent of GDPthe net income deficit will be 6 per cent of GDP. If at thepoint the economy is growing at 5 per cent, any currentaccount deficit higher than 5 per cent of GDP willincrease net foreign liabilities as a share of GDP. Butsince the net income deficit is already 6 per cent of GDP,it follows that Australia requires a trade surplus of 1 percent of GDP to prevent liabilities continuing to increasefaster than GDP. It also requires a trade surplus toprevent the current account deficit increasing andremaining beyond the critical level of 5 per cent of GDP.
So, the conclusion: if Australia does want to stop net foreign liabilities at 100 per cent of GDP in 2015, itmust at that point to limit the current account deficit toa permanent maximum of 5 per cent of GDP, and it mustdo so by running a trade surplus of 1 per cent of GDP.
CEDA GROWTH 58

41COMPETING FROM AUSTRALIA
Appendix 2: Export volumes from 2004
In the period from 2004 onwards export volumes havecontinued to perform below their post-1982 trend rate ofgrowth.
In the financial year 2004–05 the volumes of goodsexports increased 3.2 per cent, and in the following year,2.1 per cent. Rural exports were above the average of allgoods in 2004–05, but fell in 2005–06, perhaps becausedrought conditions had initially stimulated sales as cattlewere turned off, and then cut sales as the stock fell.Exports of metals ores and minerals were stronger thanthe average of all goods in both years, through at 3.9 percent, the growth in 2005–06 was less than half the 8.4per cent increase the previous year. Exports of metals fellin each of the three years to 2004–05, but then rose by alittle over 9 per cent in 2005–06.
In 2005–06 manufactured export volumes increasedwell above the average of goods exports as a whole.Machinery exports expanded 11 per cent in 2004–05 and4.2 per cent the next year, transport equipment (whichincludes cars) fell in 2003–04 and again in 2004–05 butrose nearly 6 per cent in 2005–06. The category “othermanufactures” rose 6 per cent in 2005–06, and hadincreased in each of the previous years.
If the strength of manufactures is unexpected, so too isthe persistent weakness of coal export volumes. Theyincreased nearly 6 per cent in 2004–05 but fell by 0.6 percent in 2005–06. So too, oil exports fell nearly 4 per centin 2005–06 after increasing a little over 1 per cent in2004–05. The volume of gold exports may be recovering.They rose nearly 9 per cent in 2005–06 after falling inthe previous two years. However, gold exports are volatilefrom year to year and a sustained increase is not yetapparent.
Wine exports were widely said to be in trouble, but thenumbers show the volume of beverage exports rose sub-stantially in the three years to 2005–06, although at alittle under 4 per cent export growth in 2005–06 it wasless than a third of the previous year.
The weakness in volumes in the last year has been incoal, oil and rural exports.
ENDNOTES
1 Using the three Balance of Payments categories of machinery, transport equipment,and other manufactures. ABS 5302.0
2 Though the change was not as big, the real effective exchange rate also fell after thefloat. This is the exchange rate against a basket of currencies weighted for Australia’strade composition, and adjusted to take account of the different inflation rates in thecountries concerned. The average real effective rate in the 23 years following the floatwas 27 per cent less than the same rate in the 13 years prior to the float.
3 Taking financial years, the value of exports in 2005–06 was 51 per cent higher thanin 2000–01 and the volume 12 per cent higher.
4 A study by the Productivity Commission appears to show otherwise. It reported that for1999–2000 two-thirds of the businesses investing offshore were in manufacturing,and that the share had increased from 51 per cent at the beginning of that decade.The ABS data on the destination of offshore investment, however, suggests that labourcost cannot be the predominant motive. Presumably, manufacturers have indeedinvested offshore but they are by and large small businesses. For example, this wouldbe true of textiles, clothing and footwear, which have been forced offshore by tariffcuts. (Very often these businesses will contract with a local firm to make the product,so the move offshore does not show up as investment.)

42
6
CEDA GROWTH 58
innovation
IntroductionThere is increasing recognition around the world thatinnovation is a key driver of the competitiveness of firmsand organisations in the global economy, and the qualityof both private and publicly provided services. TheAustralian Government is one of many encouraginginnovation as part of a strategy to “enhance … interna-tional competitiveness, economic prosperity and socialwellbeing” (Backing Australia’s Ability, 2001, 2004). Itwill be argued here that this strategy has shortcomingsthat must be urgently addressed.
innovation competing
PROFESSOR ROY GREEN is Dean
of the Macquarie Graduate School
of Management (MGSM). He was
previously Professor of Management
and Dean of the Faculty of Commerce at the National University
of Ireland (NUI). He has been a Research Fellow at the University
of Cambridge, where he earned his PhD, and has worked in
universities and government in Australia, the UK and Ireland. He
has published widely in the areas of innovation, industry policy,
regional development and workplace analysis. He has also served
on public bodies and under-taken projects with industry and
organisations such as the OECD, European Commission and
Enterprise Ireland.
T H R O U G H
An international perspective

43COMPETING FROM AUSTRALIA
Innovation has been defined and interpreted in manyways. Essentially, we can take it to mean “doing newthings or doing things in a new way”, drawing on knowl-edge and creativity to add value to products andprocesses. It is now evident that the most successful soci-eties of the new millennium will grasp the challenge ofinnovation, make it their vision of the future and trans-late the vision into reality. To compete on a global scale,and to do so in a sustainable way, Australia must ensurethat it is one of these societies. This is the central propo-sition of a recent policy statement by the BusinessCouncil of Australia (BCA 2006), which notes dimin-ishing returns from microeconomic reform and makesthe point that, “While productivity has become theprimary determinant of our economic prosperity as anation, innovation in turn has become an increasinglyimportant factor in productivity growth”.
Why innovationTraditionally, wealth was thought to have its source inland, labour and capital as factors of production, butwith the joining of information to technology the worldchanged forever. This new industrial revolution hasforged greater understanding among business leaders,researchers and policy-makers of the dynamic role of
innovation in creating value for organisations and, indoing so, transforming the productive performance ofwhole economies.
Australia is currently experiencing an unprecedentedboom in its primary commodity exports, and a reversalin the decades-long deterioration of its terms of trade, asmarkets are reshaped by China’s entry into the worldeconomy. Whether this boom proves to be temporary orlonger lasting, significant adjustments will be requiredfor Australia to take advantage of its good fortune andprepare for an uncertain future. Possible scenarios forAustralia in coming years include the so-called “Dutchdisease”, where a rise in the exchange rate associated withNorth Sea gas discoveries made much of Dutch industryuncompetitive, or Britain in the 1980s, where a NorthSea oil windfall was squandered on domestic consump-tion, or alternatively Norway, which has leveraged its oilwealth for strategic investment in research, educationand infrastructure.
Norway is following the example of countries that havesought competitive advantage through knowledge-inten-sive products and services. Many of these are smalleconomies on the periphery of larger markets. Theyinclude Finland, now a world leader in mobile telephonyand related technologies; Ireland, whose success is based
PHOTO: iSTOCK

44 CEDA GROWTH 58
on integrating global investors with local supply chainsto build a presence in software, pharmaceuticals andmedical devices; Taiwan, with its formidable manufac-turing capability in electronics and informationtechnology; and Singapore, which is reinventing itself asa trade, investment and financial services hub for theAsia-Pacific region.
Other successful knowledge-based economies may belarger, but they are similarly characterised by geographi-cally concentrated clusters of skills and technologies thatdrive an increasing share of growth. Examples from theUnited States have included Silicon Valley, the Carolinas“Research Triangle”, Austin Texas, and, following the exitof computer hardware, the remarkable emergence of aMassachusetts biotech region. And from Europe,examples include biosciences clusters in Cambridge andMunich, digital media in South-East England andFlanders, and French “competitiveness poles” such asGrenoble and Sophia Antipolis.
While these economies are diverse and complex, withdistinctive systems of governance and public policy, thereis arguably a single common thread in their success –investment in human capital and infrastructure. It is thisinvestment, through a mix of government, business andeducation institutions that creates innovation capacity atnational and regional levels. This capacity in turn under-pins the development of more specific innovationcapabilities at the organisational level, where it counts forgrowth, employment and competitiveness.
Scope of InnovationInnovation can only be understood in its totality as acombination of different but interrelated elements con-tributing to the development of new, commerciallyrelevant products and processes, or the delivery of better,more cost-effective services. It ranges from what ClaytonChristensen calls “sustaining” or incremental innovation,
by improving the performance of organisations, to “dis-ruptive” innovation, which creates whole new markets.While the innovation pathway may proceed along a con-ventional, “linear” route from scientific discovery toexploitable invention, and then to market, this tends tobe the exception rather than the rule. Innovation is botha more complex and much broader phenomenon.
Essentially, innovation has at least three main elements– technological, organisational and institutional. Thefirst of these, technological innovation, is often identifiedwith the formal, codified knowledge arising from basicresearch in science and technology, and its application toproduct and process development. In this sense, it can bemeasured by the output of scientific papers and patents,and a strong correlation with public investment inresearch and education is suggested by the internationaldata. However, such innovation may also reflect contin-uous improvement in technology, which results from aninternal focus on quality and externally from a broaderprocess of networking and collaboration, including withcustomers and suppliers, and is inherently more difficultto quantify.
Australia has always compared well in scientificoutput, but declining research and education spendingover many years threatens this achievement. There arealso serious gaps and weaknesses in R&D performanceand in the transfer of knowledge to markets by industryand public research organisations. While technologicalinnovation has been stepped up in the past decade, so hasthe performance of the rest of the world, and in manycountries at a faster pace. According to OECD data for2004/05, Australia spent 1.76% of GDP on R&D,
lagging behind the OECD average of 2.26% and farshort of leaders such as Finland (3.5%), Japan (3.13%)and the US (2.68%). While R&D may not be a com-prehensive performance measure, it is a reliable proxy.
ABS data point to a 25% increase in higher educationexpenditure on R&D to 0.48% of GDP in the two yearsto 2004, which is still behind leaders such as Sweden(0.88, 2003) and Canada (0.73) but a clear improve-ment. On the other hand, the modest increase inbusiness expenditure on R&D to 0.95% of GDP in2005 compares much less favourably with the position inSweden (2.95%), Finland (2.46%), Japan (2.36%) andKorea (2.01%). Aggregating expenditure on R&D,
0% 1% 2% 3% 4% 5% 6% 7%
Finland
Denmark
Canada
Australia
Sweden
FIGURE 1 INVESTMENT IN KNOWLEDGE (R&D, HIGHEREDUCATION, SOFTWARE), PERCENTAGE OF GDP, 2002
Source: OECD
Australia has always compared
well in scientific output, but declining
research and education spending
over many years threatens this
achievement.

45COMPETING FROM AUSTRALIA
higher education and software into an index of “invest-ment in knowledge”, OECD data show Australia trailingcomparable countries at 4.1% of GDP, including Canadaat 4.7% with a similarly substantial resources sector,Denmark at 5.5%, Finland at 6.1% and Sweden at 6.8%(see Figure 1).
Indeed, it is often the structure of Australian industrythat is treated as justification for low levels of businessexpenditure on R&D. While Australia does have a largerresources sector and smaller scale manufacturing thanother countries, there is also a much lower proportion of“high tech” industries in manufacturing exports than theOECD average, and less innovation reported as a per-centage of total manufacturing sales. Moreover, thisjustification ignores the importance of R&D in miningand agriculture, and of innovation more broadly in “lowtech” industries and services, where “absorptive capacity”for externally sourced technologies and skills may be thedriver of competitive advantage rather than internalR&D. Even in the most advanced knowledge-intensiveeconomies, high-tech firms account for a relatively smallshare of output and employment, though they impactdisproportionately on growth and productivity.
Of course, not all knowledge is codified and measur-able, and nor does innovation always embody R&D innew products and processes. The second element ofinnovation is organisational innovation, where knowledgeand learning may be tacit as well as codified, and yet maytransform organisations through adaptation and absorp-tion of new technologies, introduction of newoperational processes and implementation of new work-place structures and practices.
Significantly, a recent ABS-DITR (2006) survey,Patterns of Innovation in Australian Businesses, found thatnon-R&D spending accounted for over two-thirds oftotal business expenditure on innovation, but that only35% of firms across industry sectors undertook even thisbroader definition of innovation in the survey period2001–03. While most innovating firms reported changesthat were “new to the business” rather than “new to theworld”, research suggests that organisational innovationcan result in substantially improved performance. In thiscontext, the BCA (2006) has argued that the innovationdebate “needs to be broadened to address the question ofwhether businesses in Australia are able to maximise thepotential level of innovation within their companies”.
There is support for this approach in IBM’s 2006global CEO survey, Expanding the Innovation Horizon.While CEOs continue to place more emphasis on tech-nological innovation, according to the survey, they nowfocus 30% of their efforts on organisational innovation,particularly changes in their business models. Further,“companies that have grown their operating marginsfaster than their competitors were putting twice as muchemphasis on business model innovation as underper-formers”. In this context, CEOs identified “organisation
structure changes” and “major strategic partnerships” askey features of business model innovation.
Clearly, as the IBM survey indicates, firms engaged ininnovation do not operate in isolation from the externalbusiness and public policy environment. They alsobenefit from structured collaboration, technologyspillovers, networking and knowledge diffusion, wherethe boundaries of the extended enterprise become lesseasy to draw. Recent research has highlighted the emer-gence of “open systems” approaches to innovation,including increasing engagement with the innovativefeedback loop generated by customer engagement. InAustralia, a recent DITR (2006) analysis, Collaborationand Other Factors Influencing Innovation Novelty inAustralian Businesses, found that firms that collaboratedfor innovation had a much greater chance of achievinga “new to the world” degree of novelty, especially in tech-nology intensive sectors.
Internationally, a Frost and Sullivan (2006) researchprogram supported by Verizon Business and Microsoftfound that “collaboration works in conjunction withstrategic orientation and opportunities inherent in themarket environment… to improve business perform-ance”, and that collaboration was more than twice assignificant for performance than these other factors. Thisis largely confirmed by the results of the IBM surveywhich showed that “extensive collaborators outper-formed the competition in terms of both revenue growthand average operating margin”, though many CEOs weresaid to be “lacking the skills and expertise needed to col-laborate and partner externally”.
This is why the external environment of innovatingfirms is, and must be, shaped by institutional innovation,the third element of innovation. Successful and emergingknowledge-based economies are typified by sets of insti-tutions that support not only the internal capabilities offirms and organisations but also the interrelationshipsthat allow them to realise their full productive potentialin the context of national “systems of innovation”.International comparative studies by Michael Porter andothers have demonstrated that national innovationcapacity – including research, education and networkinginfrastructure – may be as important as internal techno-logical capabilities in driving competitiveness.
…this justification ignores the
importance of R&D in mining and
agriculture, and of innovation more
broadly in “low tech” industries
and services.

46
Australia’s innovation systemThe development of world-class innovation capacityrequires as its precondition a national commitment toinvest in human capital and infrastructure, includingschools and universities, vocational education andtraining and provision for life-long learning. Such aninvestment will ensure a skilled and adaptable workforce,ready to meet the challenge of innovation and change.Significantly, the IBM global CEO survey identifiedemployees as the main source of innovative ideas inorganisations, followed closely by business partners andcustomers.
While Australia performs well on some education andtraining indicators, a major problem inhibiting progressis that, against the trend of all other countries, totalpublic education spending is actually in decline, and noweven lags spending on defence. The OECD (2005) hasnoted that Australia is the only country “where the shifttowards private expenditure at tertiary level has beenaccompanied by a fall in the level of public expenditurein real terms”. This is at a time when, according to anindependent working group for the Prime Minister’sScience, Engineering and Innovation Council(PMSEIC), China and India, as well as the US andEurope, are increasing the rate of investment in humancapital as a matter of priority: “Today we stand at thebrink of a new era – investing in our education andresearch base now will create opportunities to build atechnology-based Australian economy that is interna-tionally engaged”.
Similarly, the Australian Innovation Scorecard indicatesa better than average performance up to now in percapita publication of scientific and technical articles. Yetother countries are catching up fast, and a much worseperformance in per capita US patents suggests a “discon-nect” between research and the transfer of knowledge tomarkets, which may in turn be symptomatic of a widerfailure. It has been clear for some time since the work ofChris Freeman and Richard Nelson that innovationcapacity depends not only on the research and educationinfrastructure, but also on an effective national innova-tion system, defined by Nelson in 1993 as a “set ofinstitutions whose interactions determine the innovativeperformance of … national firms”. Keith Smith andJonathan West have recently applied these observationsto Australia:
The capacity to innovate is capability based, cumulative,collaborative in character, and highly uncertain. So anysuccessful innovating economy needs mechanisms andinstitutions to provide sustained investment in capabilitiesto manage collaboration and cope with risk anduncertainty and their implications for businessdevelopment. The “national innovation system” is thetotality of these mechanisms and institutions: it is theoverall context within which innovation occurs (Smith &West, 2005, p. 16).
The Australian Government’s (2002) report onMapping Australian Science and Innovation restated “theimportance of strengthening our ability to generate ideasand undertake research, accelerating the commercialapplication of these ideas, and developing and retainingskills”. Backing Australia’s Ability (2004) emphasised “thecomplex nature of innovation and the importance of thepeople, linkages and interactions between the differentsystem elements”. Certainly, Australia’s national innova-tion system has pockets of excellence, but its effectivenessis compromised by the lack of innovation policy focusand “joined-up thinking” in government, publicagencies, business and universities as much as by fundingdeficiencies. These are key actors in the innovationsystem (see Figure 2) who must have a shared under-standing of their role and interrelationships for thesystem to deliver results and build innovation capabilitiesat the level of individual firms and organisations.
For example, were there to be a substantial increase inresearch funding for priority areas of science, engineeringand technology, how would resulting inventions and dis-closures find their way to market as products withcommercial potential? By what mechanisms would part-nership opportunities between business and universitiesbe maximised? And how would infrastructure andexpertise be deployed for intellectual property protec-tion, licensing arrangements, equity stakes and spin-offs?More broadly, as the UK’s Lambert (2003) Review ofBusiness-University Collaboration noted, the further chal-lenge “is not about how to increase the supply ofcommercial ideas from the universities into business.Instead, the question is about how to raise the overalllevel of demand by business for research from allsources”.
Australia’s national innovation system has major gapsat both strategic and operational levels. At the strategiclevel, there is little understanding of the long-termadvantages conferred by a comprehensive innovationsystem, which promotes both the generation and system-atic application of knowledge within and across sectors.While Australia is unlikely to become a significant “tech-
CEDA GROWTH 58
FIGURE 2 NATIONAL INNOVATION SYSTEM
Government/public agencies
Finance/venture capital
Research and education institutions
Companies and organisations
Source: BCA (2006)

47COMPETING FROM AUSTRALIA
nology maker” in its own right, this does not imply a roleonly as “technology taker”. There is scope for a technologyintegrator to add value to existing products and servicesand create new ones by providing business solutions.Some validation may be found for this approach in theinnovation literature, including the IBM global surveywhose “CEOs view business and technology integrationas integral to innovation”, though a much lesser propor-tion had the capacity and skills to undertake itsuccessfully.
At the operational level as well, innovation agencies inAustralia have neither the support or funding to emulatethe role of their counterparts in other countries, such asthe Fraunhofer institutes in Germany, the FinnishFunding Agency for Technology and Innovation (Tekes)and the highly effective Enterprise Ireland. Theseagencies work with business and public research organi-sations to identify and evaluate opportunities and then toexploit them in a systematic way, from “proof ofconcept” stage to commercial application, includingopportunities for business and technology integration. Insome cases, these agencies also support technologytransfer and commercialisation to ensure researchfunding is used for public benefit, either individually oron a “shared services” basis as in Switzerland, Israel,Midlands UK and the University of California system(Cunningham & Harney 2006), and to encourage uni-versities to become “innovation hubs” for businessnetworks and clusters. Public agencies of this kind aresimply part of a whole new emerging technology andinnovation infrastructure of “innovation intermediaries”(Dodgson, Gann & Salter 2005).
Building innovation capabilitiesUltimately, the purpose of a national innovation systemis to transform knowledge and resources into dynamiccapabilities at the level of firms and organisations, whichare then better placed to contribute to the innovationperformance of the economy as a whole. These capabili-ties will be exercised by workforces and their managers,who have the key task of leading, enabling and, crucially,mobilising the commitment to change and innovation atthe organisational level.
As organisations change, so do labour markets whichreflect the growing importance of knowledge resourcesand preponderance of “knowledge workers”. Alreadymore than a decade ago, the Karpin report (1995) onleadership and management skills noted that in drawingupon the pool of talent and creativity, managers facemore complex challenges: “Future waves of technologicalinnovation and new competitive challenges will requireour enterprises to recreate themselves on a more or lesscontinuous basis. To do so they will require multi-skilledmanagers with great capacity to learn and relearn boththeir own roles and the bases of their enterprises’ com-petitive advantages” (1995, p xiv). However, the rewards
are also increasingly being recognised. A recentEconomist Intelligence Unit (2006) world-wide surveyof executives and managers found that most identifiedknowledge and innovation management, in preference toareas such as marketing and product development, as thesource of the greatest anticipated productivity gains overthe next 15 years.
Knowledge management entails the development,tracking, measuring and sharing of intangible assets, par-ticularly the knowledge and expertise employees mayapply to products and services, and to the operations ofthe organisation itself. In line with much of the research,the IBM global CEO survey reported “creativity culturesas highly collaborative, collegial and team-oriented – asopposed to being focused on individuals or predomi-nantly confined to specific sub-groups… Companies inwhich the CEO orchestrates a more team-orientedculture were decidedly more profitable than organiza-tions with segregated pockets of innovators”. The realissue for CEOs and managers was whether they possessedthe skills to generate committed and effective teams andto ensure they were given structured opportunities tocontribute to the innovative capability and performanceof the organisation.
A recent OECD (2004) report on The Significance ofKnowledge Management in the Business Sector identifiedkey knowledge management practices as (1) creating aknowledge sharing culture, (2) incentives policy to retainemployees, (3) alliances for acquiring knowledge, and (4)written knowledge management policy. The study foundthat these practices were becoming more widespreadinternationally, and that a clear association could beobserved between such practices and innovation and pro-ductivity, though not one that is well researched orunderstood. According to the study,
Knowledge management practices seem to have a far fromnegligible effect on innovation and other aspects of corporateperformance. But there is little systematic evidence of justhow great an effect ... Among the various categories ofknowledge-related investments … knowledge managementis one of the areas about which little is known in terms ofquality, quantity, costs and economic returns.
What is known is that Australian managers will have todevelop a closer interest in these trends, and incorporate
At the operational level as well,
innovation agencies in Australia
have neither the support or funding
to emulate the role of their
counterparts in other countries
them into the strategy of their firms and organisations. Anew international survey of manufacturing firms con-ducted by Mark Dodgson and Peter Innes for theAustralian Business Foundation (2006) concludes inrelation to the local sample that “while there is evidenceof manufacturers engaging in some innovative businesspractices, especially towards achieving production effi-ciencies, they generally fail to appreciate and employinnovation as a decisive competitive strategy”. Other sig-nificant trends reported earlier are the increased“openness” of innovation activities in large firms(Chesbrough 2003), the “democratisation” of innovationthrough customer engagement (von Hippel 2005) andthe increasing role of innovation “intermediaries” in theevolving technology and commercialisation infrastruc-ture (Dodgson, Gann & Salter 2005). These trends againrequire new management skills and capabilities, buildingon the Karpin report and subsequent research and publicinquiries.
The argument here is that the success of Australia’sinnovation system, at both national and regional levels,will depend on the quality and relevance of capabilities atthe organisational level. Accordingly, as workplacesbecome more flexible and responsive in a changing com-petitive environment, the emphasis of microeconomicreform will need to evolve to a new stage – the leadershipand management of Australian organisations, and the edu-cational infrastructure and programs required to supportthe development of innovative capabilities at this level.
The way forwardIn sum, the challenge of innovation is not just for theinnovators but for the whole range of stakeholders in amodern and prosperous economy, positioning itself forlong-term competitive success in global markets. Thesestakeholders include government, research and educationinstitutions, business and individuals. According toBacking Australia’s Ability (2004), “People and their inter-actions are critical in innovation. Collaboration increasesthe ‘interconnectedness’ of the system, providing moreand varied pathways to use and the marketplace”. It mustbe accepted and understood that all have a part to play inbuilding innovation capabilities at the organisationallevel and, as a result, delivering high performance acrossAustralian industries and services.
Clearly, government has a responsibility for establishingkey elements of the national innovation system, whichprovides a framework for the development of a knowl-edge-based economy. This will require a cooperativeprocess between federal and state governments to ensurecoherence and “joined up thinking” across the system.Research and education institutions must prepare gradu-ates for a labour market which increasingly valuesknowledge and skills, undertake world-class basicresearch with internationally comparable public funding,identify ideas and exploitable inventions with commer-
cial application, and participate in innovation partner-ships with industry. Business must develop innovationcapabilities at the organisational level and in collabora-tive networks and clusters, so that knowledge may bedeployed as a source of competitive advantage. Finally,individuals – both managers and workforce – must havethe opportunity to develop their own skills and capabili-ties so that they contribute effectively to the innovationperformance of their organisations while fulfilling theirown personal potential.
48 CEDA GROWTH 58
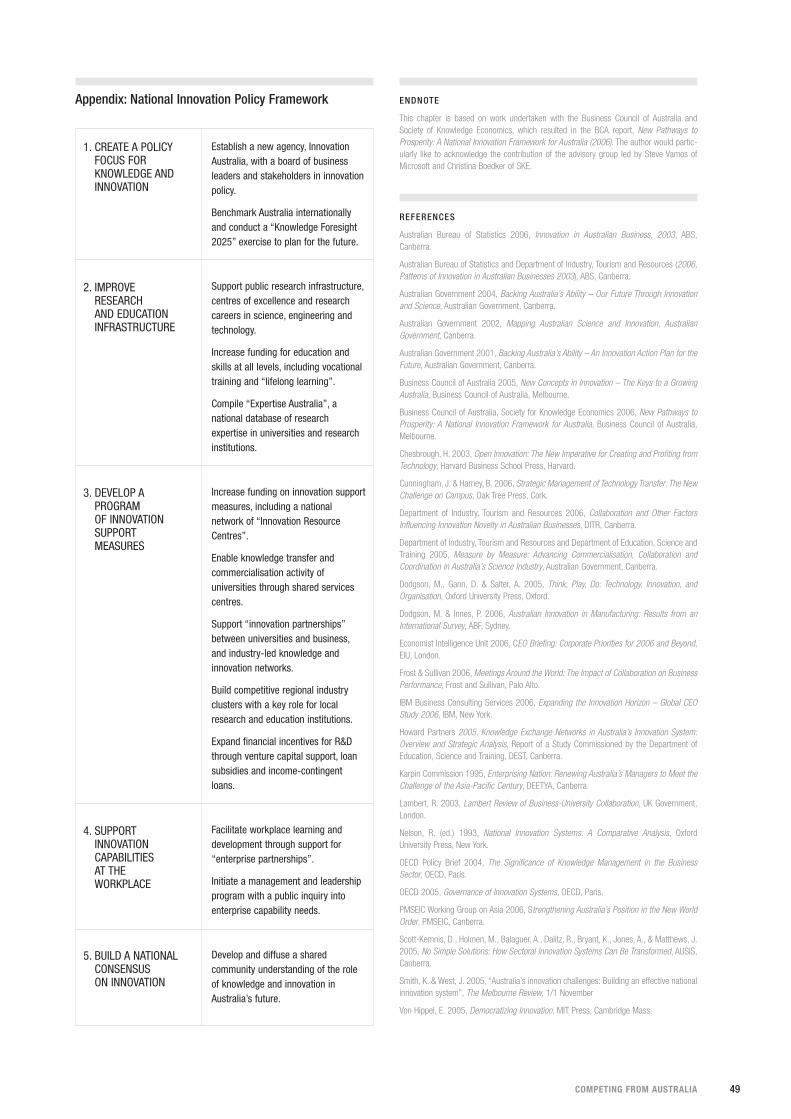
1. CREATE A POLICYFOCUS FORKNOWLEDGE ANDINNOVATION
Appendix: National Innovation Policy Framework
Establish a new agency, InnovationAustralia, with a board of businessleaders and stakeholders in innovationpolicy.
Benchmark Australia internationallyand conduct a “Knowledge Foresight2025” exercise to plan for the future.
Support public research infrastructure,centres of excellence and researchcareers in science, engineering andtechnology.
Increase funding for education andskills at all levels, including vocationaltraining and “lifelong learning”.
Compile “Expertise Australia”, anational database of researchexpertise in universities and researchinstitutions.
Increase funding on innovation supportmeasures, including a nationalnetwork of “Innovation ResourceCentres”.
Enable knowledge transfer andcommercialisation activity ofuniversities through shared servicescentres.
Support “innovation partnerships”between universities and business,and industry-led knowledge andinnovation networks.
Build competitive regional industryclusters with a key role for localresearch and education institutions.
Expand financial incentives for R&Dthrough venture capital support, loansubsidies and income-contingentloans.
Facilitate workplace learning anddevelopment through support for“enterprise partnerships”.
Initiate a management and leadershipprogram with a public inquiry intoenterprise capability needs.
Develop and diffuse a sharedcommunity understanding of the roleof knowledge and innovation inAustralia’s future.
2. IMPROVERESEARCH AND EDUCATION INFRASTRUCTURE
3. DEVELOP APROGRAM OF INNOVATIONSUPPORTMEASURES
4. SUPPORT INNOVATIONCAPABILITIESAT THE WORKPLACE
5. BUILD A NATIONAL CONSENSUS ON INNOVATION
49COMPETING FROM AUSTRALIA
ENDNOTE
This chapter is based on work undertaken with the Business Council of Australia andSociety of Knowledge Economics, which resulted in the BCA report, New Pathways toProsperity: A National Innovation Framework for Australia (2006). The author would partic-ularly like to acknowledge the contribution of the advisory group led by Steve Vamos ofMicrosoft and Christina Boedker of SKE.
REFERENCES
Australian Bureau of Statistics 2006, Innovation in Australian Business, 2003, ABS,Canberra.
Australian Bureau of Statistics and Department of Industry, Tourism and Resources (2006,Patterns of Innovation in Australian Businesses 2003), ABS, Canberra.
Australian Government 2004, Backing Australia’s Ability – Our Future Through Innovationand Science, Australian Government, Canberra.
Australian Government 2002, Mapping Australian Science and Innovation, AustralianGovernment, Canberra.
Australian Government 2001, Backing Australia’s Ability – An Innovation Action Plan for theFuture, Australian Government, Canberra.
Business Council of Australia 2005, New Concepts in Innovation – The Keys to a GrowingAustralia, Business Council of Australia, Melbourne.
Business Council of Australia, Society for Knowledge Economics 2006, New Pathways toProsperity: A National Innovation Framework for Australia, Business Council of Australia,Melbourne.
Chesbrough, H. 2003, Open Innovation: The New Imperative for Creating and Profiting fromTechnology, Harvard Business School Press, Harvard.
Cunningham, J. & Harney, B. 2006, Strategic Management of Technology Transfer: The NewChallenge on Campus, Oak Tree Press, Cork.
Department of Industry, Tourism and Resources 2006, Collaboration and Other FactorsInfluencing Innovation Novelty in Australian Businesses, DITR, Canberra.
Department of Industry, Tourism and Resources and Department of Education, Science andTraining 2005, Measure by Measure: Advancing Commercialisation, Collaboration andCoordination in Australia’s Science Industry, Australian Government, Canberra.
Dodgson, M., Gann, D. & Salter, A. 2005, Think, Play, Do: Technology, Innovation, andOrganisation, Oxford University Press, Oxford.
Dodgson, M. & Innes, P. 2006, Australian Innovation in Manufacturing: Results from anInternational Survey, ABF, Sydney.
Economist Intelligence Unit 2006, CEO Briefing: Corporate Priorities for 2006 and Beyond,EIU, London.
Frost & Sullivan 2006, Meetings Around the World: The Impact of Collaboration on BusinessPerformance, Frost and Sullivan, Palo Alto.
IBM Business Consulting Services 2006, Expanding the Innovation Horizon – Global CEOStudy 2006, IBM, New York.
Howard Partners 2005, Knowledge Exchange Networks in Australia’s Innovation System:Overview and Strategic Analysis, Report of a Study Commissioned by the Department ofEducation, Science and Training, DEST, Canberra.
Karpin Commission 1995, Enterprising Nation: Renewing Australia’s Managers to Meet theChallenge of the Asia-Pacific Century, DEETYA, Canberra.
Lambert, R. 2003, Lambert Review of Business-University Collaboration, UK Government,London.
Nelson, R. (ed.) 1993, National Innovation Systems: A Comparative Analysis, OxfordUniversity Press, New York.
OECD Policy Brief 2004, The Significance of Knowledge Management in the BusinessSector, OECD, Paris.
OECD 2005, Governance of Innovation Systems, OECD, Paris.
PMSEIC Working Group on Asia 2006, Strengthening Australia’s Position in the New WorldOrder, PMSEIC, Canberra.
Scott-Kemnis, D., Holmen, M., Balaguer, A., Dalitz, R., Bryant, K., Jones, A., & Matthews, J.2005, No Simple Solutions: How Sectoral Innovation Systems Can Be Transformed, AUSIS,Canberra.
Smith, K. & West, J. 2005, “Australia’s innovation challenges: Building an effective nationalinnovation system”, The Melbourne Review, 1/1 November
Von Hippel, E. 2005, Democratizing Innovation, MIT Press, Cambridge Mass.

50
IntroductionOne of the striking features of the economics of bothdevelopment and growth, both in the mainstream and itsself-styled heterodox alternatives, is a resolute failure totake account of some key empirical and historical char-acteristics of the world we live in. The major problemseems to be an inability to look clearly at the structuresof production and learning that actually characterisegrowing economies. This failure takes two forms. On theone hand there is an approach, popular in treasuries andfinance ministries, that conducts economic analysis at ahighly aggregated level. This in effect erases industriesand sectors by treating the economy as a one-sector oper-ation that produces one output (an output that islabelled “GDP”). On the other hand, there is a sectoraland industrial approach that focuses on a small numberof industries and technologies that are held to “drive”economic growth.
7
CEDA GROWTH 58
PROFESSOR KEITH SMITH holds
the Chair in Innovation at the
University of Tasmania and is co-
founder (with Jonathan West) of the
Australian Innovation Research
Centre in Hobart. He previously
worked at the European Commission Joint Research Centre in
Seville. Trained in economics and development studies, he has
worked extensively as a consultant to policy agencies on
innovation. His paper “A perspective on the knowledge economy
in the Australian context” was published in CEDA’s 2004 Growth
collection Innovating Australia.
innovationeconomies
growthinnovation
IN RESOURCE-BASED
AND
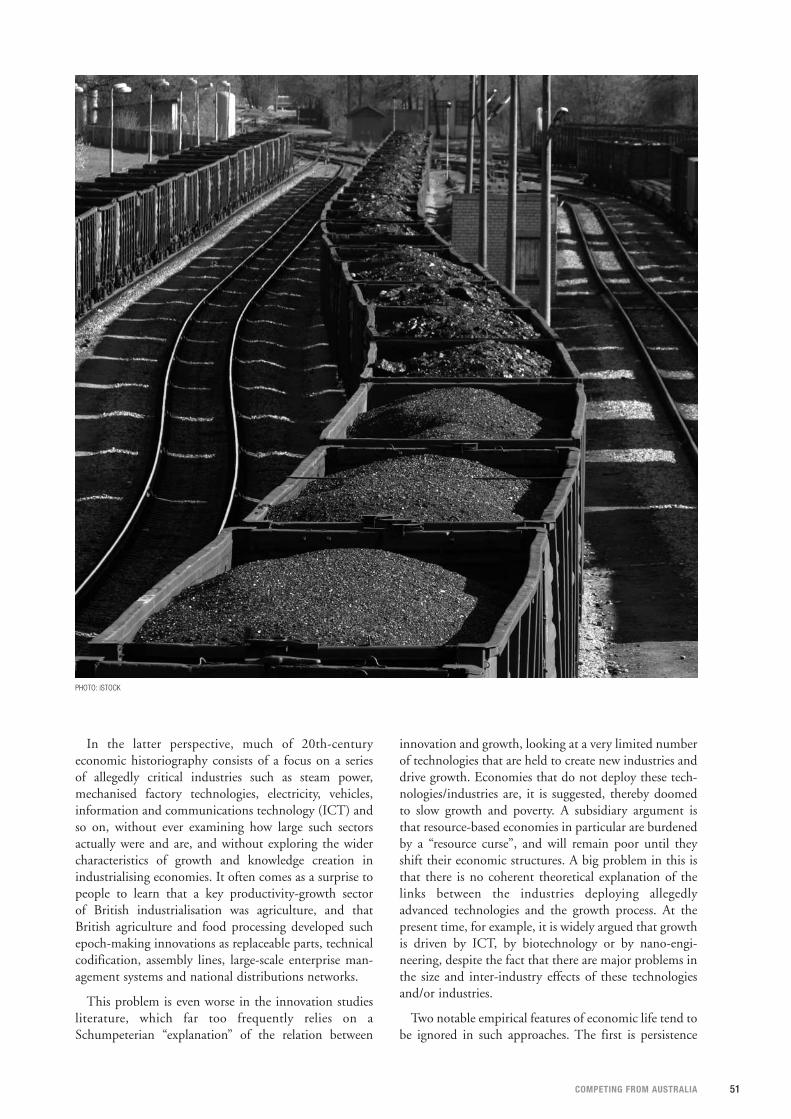
51COMPETING FROM AUSTRALIA
In the latter perspective, much of 20th-centuryeconomic historiography consists of a focus on a seriesof allegedly critical industries such as steam power,mechanised factory technologies, electricity, vehicles,information and communications technology (ICT) andso on, without ever examining how large such sectorsactually were and are, and without exploring the widercharacteristics of growth and knowledge creation inindustrialising economies. It often comes as a surprise topeople to learn that a key productivity-growth sectorof British industrialisation was agriculture, and thatBritish agriculture and food processing developed suchepoch-making innovations as replaceable parts, technicalcodification, assembly lines, large-scale enterprise man-agement systems and national distributions networks.
This problem is even worse in the innovation studiesliterature, which far too frequently relies on aSchumpeterian “explanation” of the relation between
innovation and growth, looking at a very limited numberof technologies that are held to create new industries anddrive growth. Economies that do not deploy these tech-nologies/industries are, it is suggested, thereby doomedto slow growth and poverty. A subsidiary argument isthat resource-based economies in particular are burdenedby a “resource curse”, and will remain poor until theyshift their economic structures. A big problem in this isthat there is no coherent theoretical explanation of thelinks between the industries deploying allegedlyadvanced technologies and the growth process. At thepresent time, for example, it is widely argued that growthis driven by ICT, by biotechnology or by nano-engi-neering, despite the fact that there are major problems inthe size and inter-industry effects of these technologiesand/or industries.
Two notable empirical features of economic life tend tobe ignored in such approaches. The first is persistence
PHOTO: iSTOCK
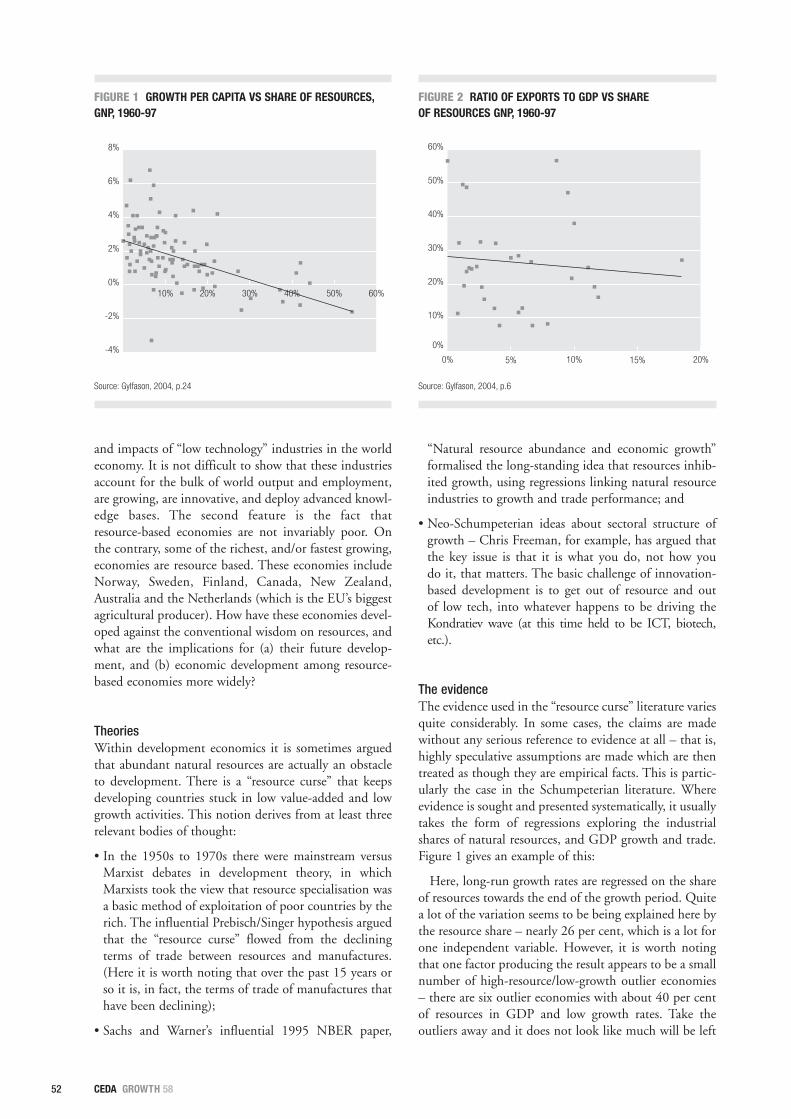
52
and impacts of “low technology” industries in the worldeconomy. It is not difficult to show that these industriesaccount for the bulk of world output and employment,are growing, are innovative, and deploy advanced knowl-edge bases. The second feature is the fact thatresource-based economies are not invariably poor. Onthe contrary, some of the richest, and/or fastest growing,economies are resource based. These economies includeNorway, Sweden, Finland, Canada, New Zealand,Australia and the Netherlands (which is the EU’s biggestagricultural producer). How have these economies devel-oped against the conventional wisdom on resources, andwhat are the implications for (a) their future develop-ment, and (b) economic development among resource-based economies more widely?
TheoriesWithin development economics it is sometimes arguedthat abundant natural resources are actually an obstacleto development. There is a “resource curse” that keepsdeveloping countries stuck in low value-added and lowgrowth activities. This notion derives from at least threerelevant bodies of thought:
• In the 1950s to 1970s there were mainstream versusMarxist debates in development theory, in whichMarxists took the view that resource specialisation wasa basic method of exploitation of poor countries by therich. The influential Prebisch/Singer hypothesis arguedthat the “resource curse” flowed from the decliningterms of trade between resources and manufactures.(Here it is worth noting that over the past 15 years orso it is, in fact, the terms of trade of manufactures thathave been declining);
• Sachs and Warner’s influential 1995 NBER paper,
“Natural resource abundance and economic growth”formalised the long-standing idea that resources inhib-ited growth, using regressions linking natural resourceindustries to growth and trade performance; and
• Neo-Schumpeterian ideas about sectoral structure ofgrowth – Chris Freeman, for example, has argued thatthe key issue is that it is what you do, not how youdo it, that matters. The basic challenge of innovation-based development is to get out of resource and outof low tech, into whatever happens to be driving theKondratiev wave (at this time held to be ICT, biotech,etc.).
The evidenceThe evidence used in the “resource curse” literature variesquite considerably. In some cases, the claims are madewithout any serious reference to evidence at all – that is,highly speculative assumptions are made which are thentreated as though they are empirical facts. This is partic-ularly the case in the Schumpeterian literature. Whereevidence is sought and presented systematically, it usuallytakes the form of regressions exploring the industrialshares of natural resources, and GDP growth and trade.Figure 1 gives an example of this:
Here, long-run growth rates are regressed on the shareof resources towards the end of the growth period. Quitea lot of the variation seems to be being explained here bythe resource share – nearly 26 per cent, which is a lot forone independent variable. However, it is worth notingthat one factor producing the result appears to be a smallnumber of high-resource/low-growth outlier economies– there are six outlier economies with about 40 per centof resources in GDP and low growth rates. Take theoutliers away and it does not look like much will be left
CEDA GROWTH 58
10% 20% 30% 40% 50% 60%
-4%
-2%
0%
2%
4%
6%
8%
FIGURE 1 GROWTH PER CAPITA VS SHARE OF RESOURCES,GNP, 1960-97
Source: Gylfason, 2004, p.24
0% 5% 10% 15% 20%
0%
10%
20%
30%
40%
50%
60%
FIGURE 2 RATIO OF EXPORTS TO GDP VS SHAREOF RESOURCES GNP, 1960-97
Source: Gylfason, 2004, p.6

53COMPETING FROM AUSTRALIA
of the regression. But a wider problem here is the inde-pendent variable, the share of resources in GDP. This isnot, in fact, a good indicator of whether or not a countryis “resource based”; it simply reflects the relative absenceof non-resource industries, and so in a way the result isimplied by the choice of indicator. A country such asSweden, which has high resource output per capita buthas succeeded in creating a large sector of non-resourceindustries, is simply not considered as a resource-basedeconomy if using this indicator.
Similar problems exist with most such regressions.Figure 2 looks at natural resources and exports.
In this case, very little of the variation in trade ratios isbeing explained, and once again the regression seems tobe heavily influenced by a small number of outlyingobservations. The explanatory variable – share of resourcesin GDP – has the same problems described above.
ExplanationsThe main economic explanations that are offered forthese phenomena are:
• the “Dutch disease”, in which exchange rate apprecia-tion as a result of the resources sector renders domesticactivity uncompetitive, and labour supply decreases (asthe resources sector draws off key labour inputs fromthe rest of the economy) combine to inhibit non-resource growth;
• declining terms of trade in primary commodities andinstability in commodities markets prevent capitalaccumulation and hinder growth;
• resources create rent-seeking behaviour that under-mines entrepreneurship and growth; and
• resources sectors generally involve a lack of linkageswith the wider economy.
To these, Michael Ross has added a set of potentialpolitical explanations. These are:
• cognitive (short-sightedness among policymakers);
• societal (empowering of elites that hinder growth); and
• state-centered (resources undermine state institutions,or create cumbersome state enterprises) (Ross, 1999).
However, if the data on resource-based economies isnot as secure as it might be, then it may be that theproblems the “resource curse” hypothesis is seeking toexplain are not as general as they seem to be. This leavesus with an interesting question: what factors explaingrowth in successful resource-based economies? Thisrequires a look at the characteristics of resource-basedeconomic development.
Dimensions of resource-based developmentResource-based economies are often characterised byindustrial structures with a strong emphasis on agricul-ture, a small manufacturing sector with a largeproportion of output concentrated on low- and medium-technology sectors, and a large service sectorincorporating a large social and community serviceselement (meaning especially health and education).Natural resources may provide a significant proportionof output, but more commonly a large proportion ofexports. Both the gross and business (GERD and BERD)R&D intensities tend to be low. There is usually a tech-nology balance of payments deficit, suggestingsignificant technology import. Likewise, a significantshare of gross fixed capital formation is met by imports;so here also there is likely to be a strong level ofembodied technology import. Significant naturalresources may include agricultural land, timber andforests, fish, hard rock minerals, and oil and gas. Thesecountries often have significant area/population imbal-ances, and the physical make-up is such that there arecommunications problems and hence major physicalinfrastructure challenges.
In a general way such countries as Finland, Sweden,Norway, Denmark, Iceland, New Zealand, the Nether-lands, Canada, and Australia share the characteristicsdescribed above. These small, open economies haverested their development paths on resource-based sectors,and out of them have developed low- and medium-tech-nology industries that have driven growth within thesecountries. This has been the case not only historically,but in many instances remains so today. Even where somecountries – such as Sweden, Finland and the Netherlands– have developed significant high-tech sectors, these havesupplemented the low- and medium-tech specialisations,but have not replaced them.
The importance of the shared structures and geophys-ical situations lies in the fact that these comparatorcountries are not simply advanced economies, but areamong the richest in the world. In terms of the under-lying productivity measure, output per worker hour,several of them outstrip the United States and most ofthem have sustained very high growth rates of outputand productivity in recent decades. Most of these coun-tries have not only generated high income levels in termsof GDP per capita, but also maintain major welfaresystems related to health, education and social protec-tion. It is worth noting that this prosperity in many casesis relatively recent rather than intrinsic to the situation ofthe countries. The Nordic area countries in particularwere, until comparatively recently, very poor. In the 19thcentury they all faced major rural crises, had low levels ofincome relative to other countries (Norway in the mid-19th century was comparable to Sicily), and had veryhigh rates of emigration. So, against this backgroundtheir development trajectories since the late 19th centuryhave been spectacular.

54
How can these development trajectories be under-stood? Three points can be noted:
• development through knowledge upgrading andinvestment strategies in resource-based industries;
• development through the leveraging of resource basesinto downstream industries; and
• knowledge creation via knowledge infrastructures.
Development through knowledge upgrading andinvestment strategies in resource-based industriesHere the point is that resource industries can be the siteof major learning processes that permit sustained pro-ductivity and output growth. It is not the case that termsof trade for these products are inevitably declining, and –even if they are – the real issue is overall revenues, notunit prices. The development of sophisticated seismolog-ical knowledge and techniques, the construction oflarge-scale infrastructures, the automation of productiontechnologies and the improvement of logistics can allmaintain the viability of resource industries over the longterm.
Development through the leveraging of resource basesinto downstream industriesResources are almost invariably capable of developmentdownstream, away from the resources themselves andinto related resource-using industries. This strategy hasbeen central to many of the resource-based economies,leading to a degree of historical linkage between past andpresent specialisations. Table 1 sets out some of these spe-cialisations, both from historical and contemporaryperspectives.
In developing both upstream and downstream linkagesfrom the resource bases, leading to major cluster devel-opment, Sweden shifted from iron ore production toiron and steel, to fabricated metal products (mostnotably cars and trucks), and then to machine tools andelectronic systems. Norway moved from marine trans-port to shipbuilding to marine electronics, developingthe world’s first automated navigation systems, and con-tinuing to be a leader in surface and sub-sea marineelectronics applications. Finland went from paper pro-duction to chemicals for paper, and then to papermachinery (a major sector in which it is a world leader).Of course, four of the countries (Canada, Sweden, theNetherlands and Finland) have succeeded in creatingimportant electronics and telecommunications sectors,and the processes through which this happened deserveattention; however,in each of these countries electronicsremain a relatively small sector, and prosperity continuesto depend on continuously upgraded traditional indus-tries (Finland’s paper exports are roughly equivalent to itselectronics exports). Moreover, it remains the case thatthe Netherlands, Denmark, Australia and New Zealandare heavily agricultural economies, with substantial
CEDA GROWTH 58
SOME CONTEMPORARYSPECIALISATIONS
Fishing
Aquaculture
Marine biotechnology
Timber products
Oil
Marine transport
Marine electronics (navigationand subsea technologiesincluding sonar and imaging)
Non-ferrous metals andaluminum
Timber products includingadvanced building materials and flooring
Engineering products
Vehicles
Telecommunications
Aerospace (military and civilian)
Ships and boats
Newsprint and high-qualitypaper
Machinery (especially for paper industry)
Chemicals (especially for paper industry)
Telecommunications equipment
Ships and boats
Agriculture (including extension into new products,e.g. fresh flowers)
Agricultural trading andcommodity exchanges
Aquaculture (includingfeedstocks and technology)
Electronics
Finance and Insurance
High-value agriculture
Domestic and Office Furniture
Architecture and interior design
Agricultural equipment
Transport and ports
Electronics
Pharmaceuticals
HISTORICAL GROWTHINDUSTRIES
Fishing
Timber products
Marine transport
Non-ferrous metals
Hydro power
Timber products
Iron ore
Iron and steel
Marine transport
Timber products
Machinery
Transport equipment(especially ships)
Chemicals
Agriculture
Trade and Finance
Machinery
Agriculture
Timber products
Shipping
COUNTRY
Norway
Sweden
Finland
Netherlands
Denmark
TABLE 1 HISTORICAL INDUSTRIES AND CONTEMPORARYSPECIALISATIONS

55COMPETING FROM AUSTRALIA
export earnings from food products (a point which is alsotrue of another allegedly high-tech small economy,namely Israel). It is worth noting that these linkages haveunderpinned a distinctive approach to economic policyin some of these economies.
The Swedish economist Erik Dahmen developed aninfluential body of analysis based on the concept of“development blocks”, that is, mutually supportiveindustries that could be linked in both the input–outsenses and in terms of shared knowledge bases. This workbecame a key contributor to the development of innova-tion system concepts (Dahmen 1970). Much later, it alsobecame the basis of the work of Michael Porter onclusters. Here it should be noted that Porter has stronglyemphasised the importance of cluster development outof existing industries and resources.
Dahmen’s work both reflected and contributed to aspecifically Swedish mode of industrial organisation. Thekey point is that in Sweden, and in the Scandinavianeconomies more generally, the emergence of linkages anddevelopment blocks did not just happen, it was organ-ised. In Sweden a specific form of corporate organisationand governance emerged that was central to its industrialdevelopment. The main specifically Swedish element isthe persistence of concentrated ownership and practicalcontrol of key industrial enterprises by family spheres orother conglomerate blockholdings. Sweden is charac-terised by large-scale blockholdings in significant parts ofthe industrial system by what are in effect active family-based or bank-based closed-end investment companies.The most famous of these is the investment vehicle of the
TABLE 2 INNOVATION ACTIVITY IN NEW ZEALAND:PROPORTION OF INNOVATING COMPANIES
NUMBER PERCENTAGE
Industry sector
Agriculture, forestry and fishing 1476 32
Mining and quarrying 57 37
Manufacturing 3522 56
Electricity, gas and water supply 12 50
Construction 1209 25
Total 6276 44
Services sector
Wholesale trade 1767 46
Transport and storage 885 38
Communication services 87 41
Finance and insurance 282 54
Business services 2181 42
Motion picture, radio and 84 61television services
Total 5286 42
Overall 11562 44
Source: Statistics New Zealand, 2003
0
20
40
60
80
100
Other m
anufa
cturin
g
Indus
trial e
quipm
ent
Electr
onic
and o
ptica
l equ
ipmen
t
Trans
port e
quipm
ent
Metal p
roduc
t
Non-m
etallic
mine
ral pr
oduc
t
Petro
leum, c
oal a
nd ch
emica
l
Printi
ng, p
ublish
ing an
d rec
orded
med
ia
Wood a
nd pa
per p
roduc
t
Textile
, clot
hing,
footw
ear a
nd le
ather
Food
, beve
rage a
nd to
bacc
o
FIGURE 3 INNOVATION IN NEW ZEALAND MANUFACTURING SECTORS (PERCENTAGE OF INNOVATING COMPANIES)
Source: Statistics New Zealand, 2003

56
Wallenberg family, Investor AS. There are at least a dozensuch family groupings, often playing an active role inenterprise strategy, organisation and operations. This isby no means unknown elsewhere, but the scale andimpact of this pattern nevertheless remains a distinctivefeature of the Swedish system. The “investment trust”ownership structure also has an institutional formoutside of the family groups, based on bank-centredinvestment companies that own and control very signifi-cant parts of the Swedish economy. So closed-endconglomerate holdings dominate large parts of theeconomy, and form a core element of the governancesystem. These holdings have rather deep historical rootsand in some cases even the individual holdings stretchback almost a century. So they impart an importantdegree of continuity to the Swedish system. At the sametime the fate of these holdings is one of the key elementsthat is shaping change at the present time. Such arrange-ments are not unique to Sweden. Distinctive,development-oriented governance arrangements can befound across the industries of the Nordic world.
These general points are more widely relevant forsmall, open resource-based economies because they sharethe low-tech emphases, the resource characteristics andthe widely distributed economic structures of the smalleconomies mentioned. Such an industrial structure is notnon-innovative (see Ferranti et al, 2002, and Hirsch-Kreinsen et al, 2005, for arguments on this point). If welook at the distribution of innovation activity (meaningintroduction of new products or processes, or expendi-ture on innovation) in New Zealand, for example, wefind the following:
Firstly, innovation activity is widely distributed acrossall the major sectors, according with the “pervasiveness”characteristic described above. Figure 3 above shows thatwithin manufacturing, innovation is found across allsectors, regardless of their formal classifications of tech-nology intensity. That is, in common with other smallopen economies, New Zealand has innovative low-techsectors.
These results accord quite closely with those of otherinnovation surveys in small, open economies. Forexample, in all sectors of the Australian economy at least30 per cent of firms are innovating over any three-yeartime period. In Australian manufacturing the mostintensively innovating sectors are machinery and equip-ment and chemicals, each with about 50 per cent of firmsinnovating. Nevertheless in such “traditional” industriesas food products, textiles and metal products, between30 and 35 per cent of firms are innovating (see AustralianBureau of Statistics 2005; see also Eurostat 2004).
What follows from this structure is the suggestion thatinnovation policy for resource-based economies cannotsimply be based on high-tech sectors, but will have tohave an extensive base in the resources and industriesactually possessed by an economy. Linkages, develop-
ment blocks or clusters have not, in similar economies,emerged out of some general propensity to clustergrowth, rather, they have emerged from locationallyspecific resources, and have developed in rather logicalways both forward and backward. The result is strong“vertical” clusters. For New Zealand, for example, animportant current challenge is to technologically upgradeand to innovate in such sectors as food and beverages,textiles and clothing, printing and publishing, timberproducts and so on, while also developing their upstreamand downstream potentials.
Such linkages need not be directly into related manu-facturing industries, but can also lead to service sectordevelopment. The clearest case of this is Australia wherethe major financial markets in Sydney are heavily focusedon specialised finance for the resource sector. Resourceexploration and exploitation involve major risks, and theinvestment banking and equity markets in Australia(both in Perth and Sydney) are heavily involved inmanaging the risk-spreading portfolio problems of theresource sector. Over time, this has led to Sydneyevolving into one of the major financial centres of theworld – the growth of Sydney as one of the pre-eminentfinancial centres of the Asia-Pacific region rests in partwith its resource-finance background (which continuesto be one of its major specialisations).
A final point here relates to knowledge infrastructures.In general, neither resource-based activities nor theindustries linked to them are R&D intensive. Rather,they rely on flows of knowledge emanating from infra-structural institutions such as universities and researchinstitutes, as well as embodied R&D in technologies usedin capital and intermediate goods. This means that amajor focus of public policy for these industries is infra-structural.
Research questions on the resource economiesThere are clearly a number of important but unresolvedquestions concerning resource-based economies. Theseinclude:
• What kinds of learning determine the capabilitiesneeded to exploit resource bases?
• Are there spillover effects related to resource extraction?Czelusta and Wright (2004) suggest that “if resourcesare developed through advanced forms of knowledgedevelopment, their spillover effects may be just aspowerful as anything done in manufacturing”.
• What was the dependence on resources historically?How important was the reliance on resources by suchlarge economies as the US? (It is important toremember here that Habbakuk’s influential argumentwas that resource abundance was a contributor to highproductivity in the US).
CEDA GROWTH 58

57COMPETING FROM AUSTRALIA
• Is natural resource abundance itself a natural phenom-enon? David and Wright suggested that “naturalresource abundance was an endogenous, ‘socially con-structed’ condition that was not geologicallypre-ordained”. How should this relate to potentialresources of the future?
• How are allegedly non-renewable resources extendedthrough exploration, technological change, advances incountry-specific knowledge and so on?
• How have linkages been created historically? Is the viewthat they are essentially a policy issue correct? What arethe contemporary implications?
The issue of how today’s small resource-basedeconomies became so rich is a neglected and importantone in economic history. How they might stay rich,however, is a critical issue in their futures and inAustralia’s future. Answering some of these questionsmight give important pointers to some answers.
REFERENCES
Australian Bureau of Statistics, 2005, Innovation in Australian Business 2003, Cat no.
8158.0, Canberra.
Czelusta, J. & G. Wright 2004, “Who’s Afraid of the Resource Curse? Mineral Resources
and Economic Development,” with Gavin Wright, Challenge, vol. 47, April.
Dahmen, E. 1970, Entrepreneurial Activity and the Development of Swedish Industry,1919–1939, American Economic Association Translation Series, R.D. Irwin, New York.
David, P.A. and Wright, G., 1997, 'Increasing returns and the genesis of American resource
abundance', Industrial and Corporate Change, Vol 6, No 2, pp 203-245
de Ferranti, D., Perry, G. Lederman, D. & W. Maloney 2002, From Natural Resources to theKnowledge Economy, World Bank: Washington DC.
European Commission, 2004, Innovation in EU Industry, EC, Luxembourg.
Eurostat 2004, Eurostat Yearbook 2004: The Statistical Guide to Europe.
Gylfason, T., 2004, 'Natural resources and economic growth: from dependence to diversi-
fication', Centre for Economic Policy Research, Discussion Paper 4804
Hirsch-Kreinsen, H., Jacobson, D & S. Laestadius (eds) 2005, Low-Tech Innovation in theKnowledge Economy, Peter Lang, Frankfurt.
Ross, M. 1999, “The political economy of the resource curse”, World Politics, vol 51, no 2,
pp. 297–322.
Statistics New Zealand, 2003, Innovation in New Zealand, 2003.

58
BackgroundFor the best part of the 20th century, growth in theAustralian economy lagged behind that of other devel-oped nations. National policies geared towardsprotecting Australian manufacturing industry and home-grown Australian ideas consistently failed to generateeconomic returns to our society. Over the course of thecentury, Australian gross domestic product (GDP) percapita declined from the highest in the world at the startof the First World War to a middling position amongdeveloped nations in the 1970s (Maddison, 2001).
Moreover, Australians were especially slow to discoverthe value of deregulation and of allowing markets, notgovernments, to establish where comparative advantagelies. By the 1960s our tariffs in some sectors were amongthe highest in the developed world.
However, this tardiness may ultimately have accentu-ated the benefits of transition to a more open economicsystem, when it finally did occur. Following deregulationof the Australian economy in the 1980s and 1990sAustralia has prospered – perhaps even to an unexpecteddegree.
The country’s economic expansion since 1990 nowrepresents the longest period of growth (that is withouttwo consecutive quarters of negative growth) sinceFederation at the start of the 20th century. From theearly 1990s to the present, Australian per capita GDP hasincreased faster relative to the rest of the developed worldthan at any other period throughout the precedingcentury. Indeed, across the final two decades of the 20thcentury, Australia was one of only three developed coun-tries to increase its share of world GDP.
DR THOMAS BARLOW is a business
and research strategy consultant.
He was formerly Science Advisor to
Dr Brendan Nelson during Dr
Nelson’s term as Minister for Education, Science and Training. He
has been a Research Fellow at Oxford University and a columnist
for London’s Financial Times newspaper. His book, The Australian
Miracle, was published by Picador in 2006.
8
CEDA GROWTH 58
capabilitysystems integration
Australia’scapability
FOR

59COMPETING FROM AUSTRALIA
Australia’s recent economic history presents a powerfulcase-study. Deregulation and the opening up of theAustralian economy have had a positive impact onnational prosperity. But the lesson for Australia is notsimply an economic one. When Australian governmentsstopped trying to impose a particular industrial structureon Australian society they forged the conditions not onlyfor better economic growth, but also a change in focus ofAustralian innovation. This created an opportunity forunderstanding something new about ourselves and ourplace in the world.
Trends in the Australian economyLet us start by looking at some of the broad trends in theAustralian economy. Since the 1980s the sectors of theAustralian economy that have most markedly increasedtheir share of total Australian production have beenin services. Over the past 25 years:
• the average annual rate of growth in property andbusiness services has been three times that of manufac-turing;
• the average annual rate of growth in finance andinsurance has been two and a half times that of manu-facturing; and
• the average annual rate of growth in communicationsservices has been four times that of manufacturing.
This trend is shown in Table 1. Indeed, although thegranularity of this data do not show it, property andbusiness services have now surpassed manufacturing asAustralia’s leading sector of the domestic economy.
For those who associate innovation predominantlywith the production of widgets and gizmos, these trendsmay seem disturbing. The rise of the service economycan create the impression that we are not as clever as weought to be – or even perhaps as we used to be.
But it may be cleverness of a different kind that isdriving the present shifts in our economy. As we shall see,one of the consequences of Australia’s changing economyis that Australians have begun innovating in new ways –in ways that do not appear “high-tech” in any traditionalsense, but which are probably more reflective ofAustralian strengths.
Changing patterns of innovation intensityOne important indicator of innovative activity – businessexpenditure on research & development (R&D) – hasgrown dramatically across all sectors in Australia inrecent years, albeit from a relatively low base (OECD,2005a). Over the decade 1993–2003, business R&Dexpenditures grew by 6.4% per annum in real terms inAustralia, compared with 3.6% growth for the OECD asa whole (ABS, 2005b). More recently, over the five yearsto 2004–05, Australian business expenditures on R&Dhave increased in real terms at 14.3% annually.
PHOTO: iSTOCK
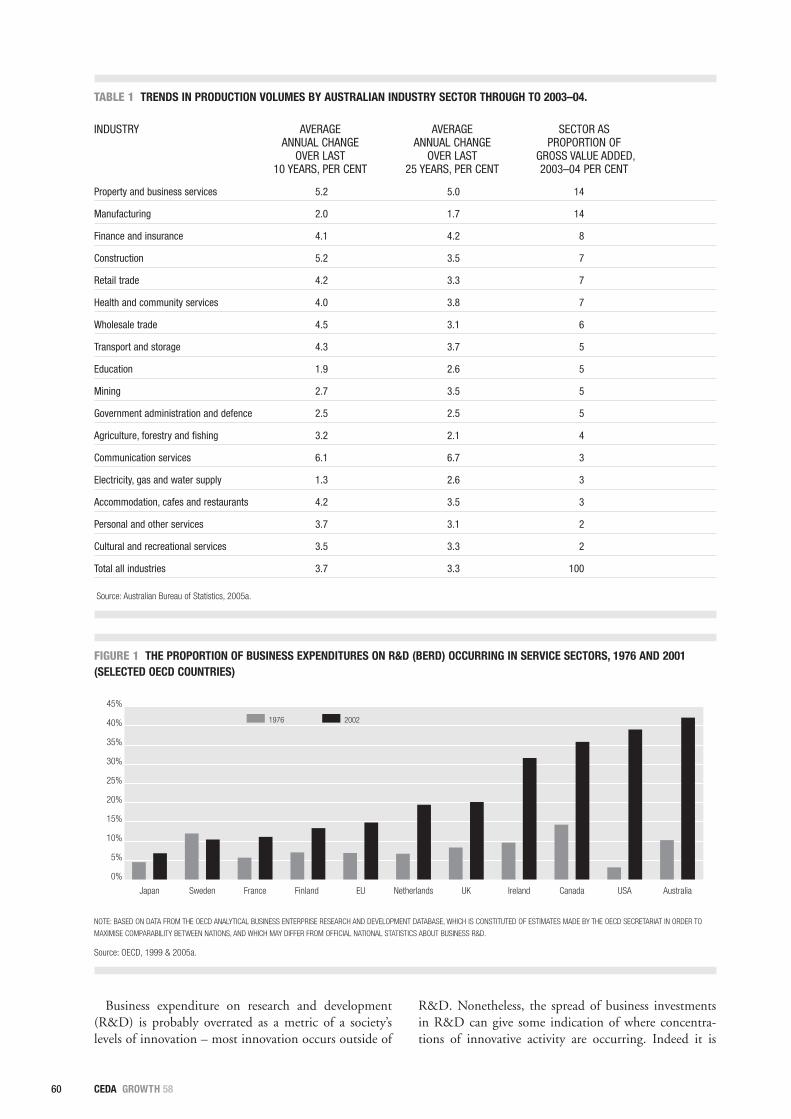
60 CEDA GROWTH 58
TABLE 1 TRENDS IN PRODUCTION VOLUMES BY AUSTRALIAN INDUSTRY SECTOR THROUGH TO 2003–04.
INDUSTRY AVERAGE AVERAGE SECTOR AS ANNUAL CHANGE ANNUAL CHANGE PROPORTION OF
OVER LAST OVER LAST GROSS VALUE ADDED,10 YEARS, PER CENT 25 YEARS, PER CENT 2003–04 PER CENT
Property and business services 5.2 5.0 14
Manufacturing 2.0 1.7 14
Finance and insurance 4.1 4.2 8
Construction 5.2 3.5 7
Retail trade 4.2 3.3 7
Health and community services 4.0 3.8 7
Wholesale trade 4.5 3.1 6
Transport and storage 4.3 3.7 5
Education 1.9 2.6 5
Mining 2.7 3.5 5
Government administration and defence 2.5 2.5 5
Agriculture, forestry and fishing 3.2 2.1 4
Communication services 6.1 6.7 3
Electricity, gas and water supply 1.3 2.6 3
Accommodation, cafes and restaurants 4.2 3.5 3
Personal and other services 3.7 3.1 2
Cultural and recreational services 3.5 3.3 2
Total all industries 3.7 3.3 100
Source: Australian Bureau of Statistics, 2005a.
NOTE: BASED ON DATA FROM THE OECD ANALYTICAL BUSINESS ENTERPRISE RESEARCH AND DEVELOPMENT DATABASE, WHICH IS CONSTITUTED OF ESTIMATES MADE BY THE OECD SECRETARIAT IN ORDER TO
MAXIMISE COMPARABILITY BETWEEN NATIONS, AND WHICH MAY DIFFER FROM OFFICIAL NATIONAL STATISTICS ABOUT BUSINESS R&D.
Source: OECD, 1999 & 2005a.
FIGURE 1 THE PROPORTION OF BUSINESS EXPENDITURES ON R&D (BERD) OCCURRING IN SERVICE SECTORS, 1976 AND 2001(SELECTED OECD COUNTRIES)
0%
5%
10%
15%
20%
25%
30%
35%
40%
45%
20021976
AustraliaUSACanadaIrelandUKNetherlandsEUFinland FranceSwedenJapan
Business expenditure on research and development(R&D) is probably overrated as a metric of a society’slevels of innovation – most innovation occurs outside of
R&D. Nonetheless, the spread of business investmentsin R&D can give some indication of where concentra-tions of innovative activity are occurring. Indeed it is

FIGURE 3 THE PERCENTAGE OF BUSINESS EXPENDITURES ON R&D (BERD) OCCURRING IN KEY COMMUNICATIONS EQUIPMENTSECTORS, 1976 AND 2002 (SELECTED OECD COUNTRIES)
NOTE: BASED ON DATA FROM THE OECD ANALYTICAL BUSINESS ENTERPRISE RESEARCH AND DEVELOPMENT DATABASE, WHICH IS CONSTITUTED OF ESTIMATES MADE BY THE OECD SECRETARIAT IN ORDER TO
MAXIMISE COMPARABILITY BETWEEN NATIONS, AND WHICH MAY DIFFER FROM OFFICIAL NATIONAL STATISTICS ABOUT BUSINESS R&D.
Source: OECD, 1999 & 2005a.
0%
10%
20%
30%
40%
50%
60%
20021976
NetherlandsAustraliaUKUSAEUFranceJapanSwedenCanadaIrelandFinland
61COMPETING FROM AUSTRALIA
interesting in this respect to observe that, while businessR&D has grown across all sectors in Australia in the past30 years, it has clearly grown much more quickly in somesectors than others.
Figure 1, for example, shows just how markedlyAustralian businesses in the service sector have increasedtheir share of national business R&D. And Figure 2,which presents an analogous contemporary dataset basedon official national figures, shows the consequences ofthis dramatic increase: Australia is now a world leader inthe share of its business R&D that is performed inservices.
Of course, most developed countries have experiencedsome increase since the 1970s in the proportion of
business R&D in services, and a decline to some extentin the share of total business R&D in manufacturing.However, it should be noted that this rebalancing hasbeen disproportionate in Australia.
Implications for high-techDoes a shift into services mean that Australia is becomingless high-tech? This is a question I am often asked, andindeed Figure 3 shows one fairly specific respect in whichthis is certainly the case. Over the final decades of the20th century, Australia experienced a dramatic decreasein the proportion of business R&D being performed inthe radio, television and communications equipmentsector.
FIGURE 2 THE PERCENTAGE OF BUSINESS EXPENDITURES ON R&D (BERD) PERFORMED IN THE SERVICE INDUSTRIES, 2003 (OECDCOUNTRIES)
Source: OECD, 2005c.
0%
5%
10%
15%
20%
25%
30%
35%
40%
45%
50%
Austr
alia (2
002)
Denmark
(200
2)
Norway
US (2
002)
Canad
a
Czech R
epub
lic
Irelan
d (20
01)
Spain
(200
2)
OECD (2
002)Ita
ly
UK (2
002)
Netherl
ands
(200
2)
EU (2
002)
Belgi
um (2
002)
Finlan
d
Polan
d (20
02)
Franc
e (20
02)
Swed
enKo
rea
German
y
Japa
n (20
02)

62 CEDA GROWTH 58
In the 1970s one-fifth of Australian business R&D wasperformed around communications equipment,compared with less than one-tenth of the business R&Dconducted at that time in Finland. By 2002 though, thetwo economies’ degree of research specialisation towardsthis sector had dramatically reversed. Today, due pre-dominantly to the growth of Nokia, 50% of Finland’sbusiness R&D is concentrated in this area, whileAustralian R&D intensity is negligible.
Moreover, this is a picture that is broadly emulatedacross several sectors of manufacturing and hardwaredevelopment, and is entirely consistent with Australia’sposition at the bottom of OECD league tables for theshare of gross value added derived from high- andmedium-technology manufactures.
Does this matter? Old-fashioned economic patriotsand technophiles, no doubt, will find it disturbing.There is good reason to believe though that Australiansare just migrating their innovation intensity to areaswhere they have greater comparative advantage – thatthey are, in fact, just beginning to work in ways that aremore reflective of Australian strengths.
Systems integrationAustralian innovation experts have argued thatAustralians are predominantly ‘systems integrators’.1 Theterm ‘systems integration’ is typically used in informationtechnology and defence technology.
In information technology, the systems integratorstend to buy components (whether software or hardware)and then to integrate them into novel kinds of products,processes or capabilities – or they may simply work tohelp clients integrate existing applications. In defencetechnology, the systems integrators tend to do somethingsimilar – they combine a series of technologies, often amixture of hardware and software, in order to createsomething greater than the sum of its parts.
But the term can be used in a broader sense too: toreflect a style of innovation that is relatively high level,that is typically generalist rather than specialist, that isfocused on systems rather than products, and thatinvolves the combination and modification of existingtechnologies rather than the creation of new technology.
The success of Australian firms in mining, construc-tion, and event management has often been attributed tothese kinds of skills. These are industries where everyproject is different and where performance is often linkedto sophisticated integration skills in marrying establishedtechnologies to solve site-specific problems, and inmanaging people, often contractors or temporaryworkers, who may come together for one-off projects orjust for short parts of projects.
But the systems integrator model is of underlyingimportance in other sectors too – in services for example
– where such skills may be invisible to the wider com-munity because the innovations they engender are toolow-tech to attract much public attention.
Westfield provides a good example of this effect.Doubtless few shoppers ever reflect on the origins oftheir experience in a Westfield Shoppingtown, but thefact that an Australian company is now the world’s largestshopping centre group must be attributed, at least inpart, to that company’s flare for integration. Since the1970s Westfield has led the world in combining retailshopping with the provision of services and entertain-ment, and in blending retail servicing with propertydevelopment and construction.
Of course, having an apparent national strength in onemode of operation does not rule out Australian compet-itiveness in other respects. Today Boeing and Airbus, togive a countervailing example, both source key wingcomponents from Boeing’s Australian subsidiary Hawkerde Havilland – a reminder that the bias in the Australianeconomy towards services, low-tech industry, andsystems integration does not at all preclude outstandingspecialised technology creation in manufacturing.
Indeed, ironically Hawker de Havilland’s Americanowner, Boeing, is itself increasingly a high-tech global‘systems integration’ company, outsourcing nearly all
FIGURE 4 EXPENDITURE ON SOFTWARE AS A PERCENTAGE OFTOTAL KNOWLEDGE EXPENDITURE, 2002 (OECD COUNTRIES)
0% 50% 100%
Higher educationR&DSoftware
Ireland
Portugal
New Zealand
Germany
Belgium
France
Canada
Austria
Korea
EU
Finland
OECD
Japan
Greece (2001)
Sweden
US
Italy (2001)
Spain
Denmark
UK
Netherlands
Australia
Source: OECD, 2005c.
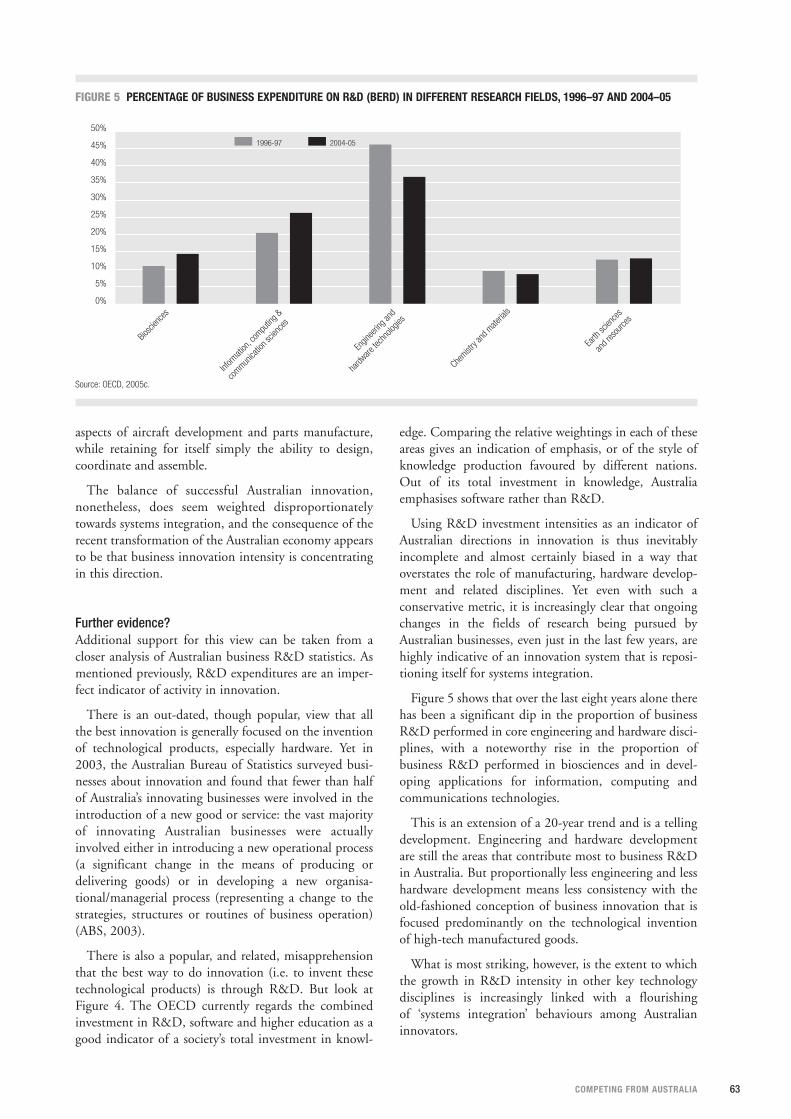
63COMPETING FROM AUSTRALIA
aspects of aircraft development and parts manufacture,while retaining for itself simply the ability to design,coordinate and assemble.
The balance of successful Australian innovation,nonetheless, does seem weighted disproportionatelytowards systems integration, and the consequence of therecent transformation of the Australian economy appearsto be that business innovation intensity is concentratingin this direction.
Further evidence?Additional support for this view can be taken from acloser analysis of Australian business R&D statistics. Asmentioned previously, R&D expenditures are an imper-fect indicator of activity in innovation.
There is an out-dated, though popular, view that allthe best innovation is generally focused on the inventionof technological products, especially hardware. Yet in2003, the Australian Bureau of Statistics surveyed busi-nesses about innovation and found that fewer than halfof Australia’s innovating businesses were involved in theintroduction of a new good or service: the vast majorityof innovating Australian businesses were actuallyinvolved either in introducing a new operational process(a significant change in the means of producing ordelivering goods) or in developing a new organisa-tional/managerial process (representing a change to thestrategies, structures or routines of business operation)(ABS, 2003).
There is also a popular, and related, misapprehensionthat the best way to do innovation (i.e. to invent thesetechnological products) is through R&D. But look atFigure 4. The OECD currently regards the combinedinvestment in R&D, software and higher education as agood indicator of a society’s total investment in knowl-
edge. Comparing the relative weightings in each of theseareas gives an indication of emphasis, or of the style ofknowledge production favoured by different nations.Out of its total investment in knowledge, Australiaemphasises software rather than R&D.
Using R&D investment intensities as an indicator ofAustralian directions in innovation is thus inevitablyincomplete and almost certainly biased in a way thatoverstates the role of manufacturing, hardware develop-ment and related disciplines. Yet even with such aconservative metric, it is increasingly clear that ongoingchanges in the fields of research being pursued byAustralian businesses, even just in the last few years, arehighly indicative of an innovation system that is reposi-tioning itself for systems integration.
Figure 5 shows that over the last eight years alone therehas been a significant dip in the proportion of businessR&D performed in core engineering and hardware disci-plines, with a noteworthy rise in the proportion ofbusiness R&D performed in biosciences and in devel-oping applications for information, computing andcommunications technologies.
This is an extension of a 20-year trend and is a tellingdevelopment. Engineering and hardware developmentare still the areas that contribute most to business R&Din Australia. But proportionally less engineering and lesshardware development means less consistency with theold-fashioned conception of business innovation that isfocused predominantly on the technological inventionof high-tech manufactured goods.
What is most striking, however, is the extent to whichthe growth in R&D intensity in other key technologydisciplines is increasingly linked with a flourishingof ‘systems integration’ behaviours among Australianinnovators.
FIGURE 5 PERCENTAGE OF BUSINESS EXPENDITURE ON R&D (BERD) IN DIFFERENT RESEARCH FIELDS, 1996–97 AND 2004–05
0%
5%
10%
15%
20%
25%
30%
35%
40%
45%
50%
2004-051996-97
Earth
scien
ces
and r
esou
rces
Chemist
ry an
d mate
rials
Engin
eerin
g and
hardw
are te
chno
logies
Inform
ation
, com
putin
g &
commun
icatio
n scie
nces
Biosci
ence
s
Source: OECD, 2005c.
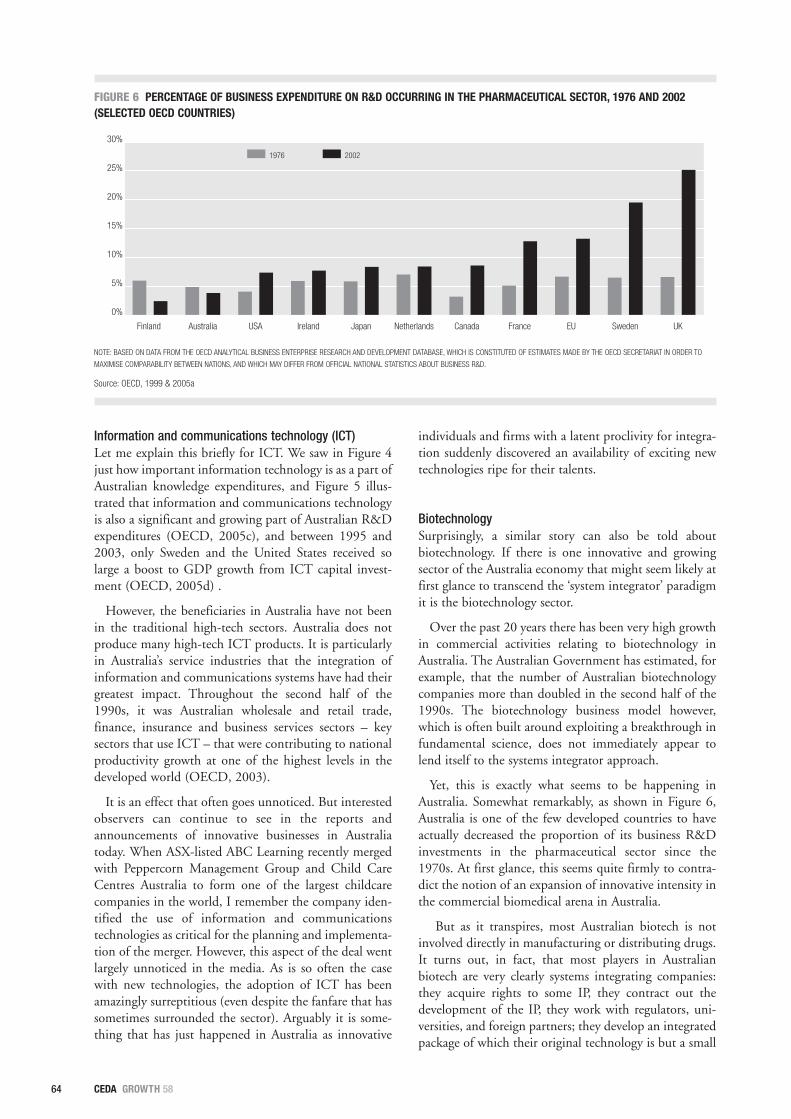
64 CEDA GROWTH 58
Information and communications technology (ICT)Let me explain this briefly for ICT. We saw in Figure 4just how important information technology is as a part ofAustralian knowledge expenditures, and Figure 5 illus-trated that information and communications technologyis also a significant and growing part of Australian R&Dexpenditures (OECD, 2005c), and between 1995 and2003, only Sweden and the United States received solarge a boost to GDP growth from ICT capital invest-ment (OECD, 2005d) .
However, the beneficiaries in Australia have not beenin the traditional high-tech sectors. Australia does notproduce many high-tech ICT products. It is particularlyin Australia’s service industries that the integration ofinformation and communications systems have had theirgreatest impact. Throughout the second half of the1990s, it was Australian wholesale and retail trade,finance, insurance and business services sectors – keysectors that use ICT – that were contributing to nationalproductivity growth at one of the highest levels in thedeveloped world (OECD, 2003).
It is an effect that often goes unnoticed. But interestedobservers can continue to see in the reports andannouncements of innovative businesses in Australiatoday. When ASX-listed ABC Learning recently mergedwith Peppercorn Management Group and Child CareCentres Australia to form one of the largest childcarecompanies in the world, I remember the company iden-tified the use of information and communicationstechnologies as critical for the planning and implementa-tion of the merger. However, this aspect of the deal wentlargely unnoticed in the media. As is so often the casewith new technologies, the adoption of ICT has beenamazingly surreptitious (even despite the fanfare that hassometimes surrounded the sector). Arguably it is some-thing that has just happened in Australia as innovative
individuals and firms with a latent proclivity for integra-tion suddenly discovered an availability of exciting newtechnologies ripe for their talents.
BiotechnologySurprisingly, a similar story can also be told aboutbiotechnology. If there is one innovative and growingsector of the Australia economy that might seem likely atfirst glance to transcend the ‘system integrator’ paradigmit is the biotechnology sector.
Over the past 20 years there has been very high growthin commercial activities relating to biotechnology inAustralia. The Australian Government has estimated, forexample, that the number of Australian biotechnologycompanies more than doubled in the second half of the1990s. The biotechnology business model however,which is often built around exploiting a breakthrough infundamental science, does not immediately appear tolend itself to the systems integrator approach.
Yet, this is exactly what seems to be happening inAustralia. Somewhat remarkably, as shown in Figure 6,Australia is one of the few developed countries to haveactually decreased the proportion of its business R&Dinvestments in the pharmaceutical sector since the1970s. At first glance, this seems quite firmly to contra-dict the notion of an expansion of innovative intensity inthe commercial biomedical arena in Australia.
But as it transpires, most Australian biotech is notinvolved directly in manufacturing or distributing drugs.It turns out, in fact, that most players in Australianbiotech are very clearly systems integrating companies:they acquire rights to some IP, they contract out thedevelopment of the IP, they work with regulators, uni-versities, and foreign partners; they develop an integratedpackage of which their original technology is but a small
FIGURE 6 PERCENTAGE OF BUSINESS EXPENDITURE ON R&D OCCURRING IN THE PHARMACEUTICAL SECTOR, 1976 AND 2002(SELECTED OECD COUNTRIES)
NOTE: BASED ON DATA FROM THE OECD ANALYTICAL BUSINESS ENTERPRISE RESEARCH AND DEVELOPMENT DATABASE, WHICH IS CONSTITUTED OF ESTIMATES MADE BY THE OECD SECRETARIAT IN ORDER TO
MAXIMISE COMPARABILITY BETWEEN NATIONS, AND WHICH MAY DIFFER FROM OFFICIAL NATIONAL STATISTICS ABOUT BUSINESS R&D.
Source: OECD, 1999 & 2005a
0%
5%
10%
15%
20%
25%
30%
20021976
UKSwedenEU FranceCanadaNetherlandsJapanIrelandUSAAustraliaFinland
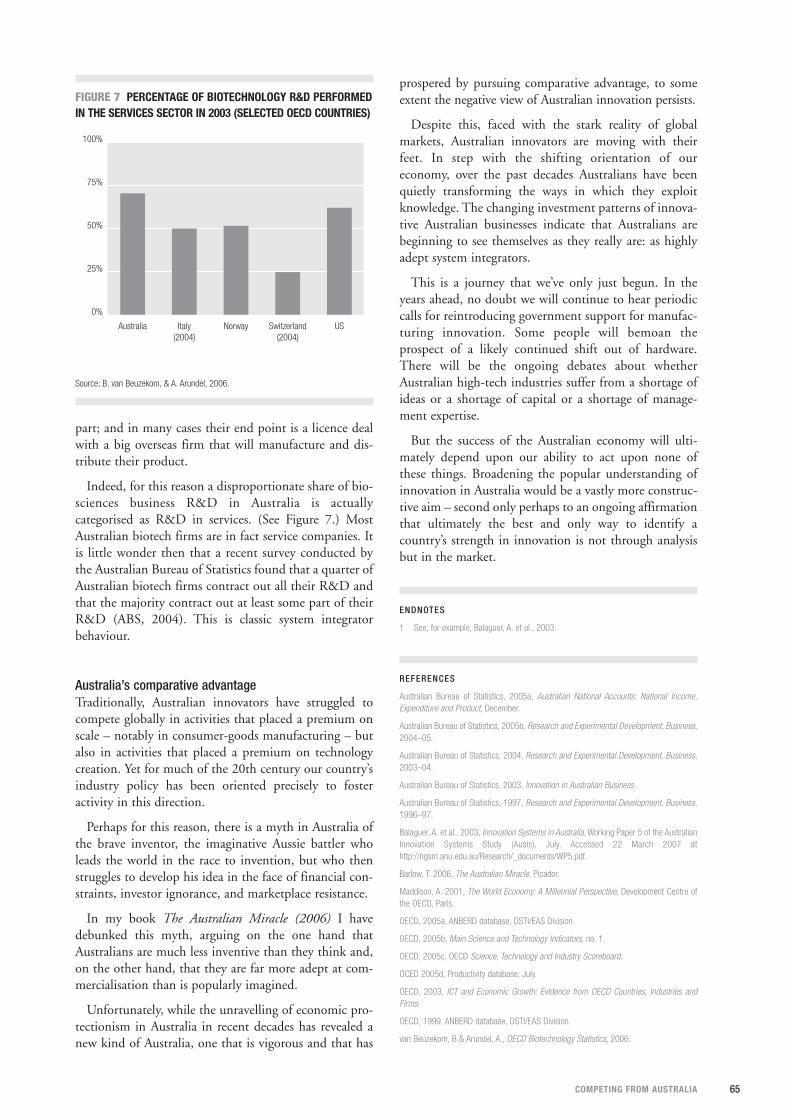
65COMPETING FROM AUSTRALIA
ENDNOTES
1 See, for example, Balaguer, A. et al., 2003.
REFERENCES
Australian Bureau of Statistics, 2005a, Australian National Accounts: National Income,Expenditure and Product, December.
Australian Bureau of Statistics, 2005b, Research and Experimental Development, Business,2004–05.
Australian Bureau of Statistics, 2004, Research and Experimental Development, Business,2003–04.
Australian Bureau of Statistics, 2003, Innovation in Australian Business.
Australian Bureau of Statistics, 1997, Research and Experimental Development, Business,1996–97.
Balaguer, A. et al., 2003, Innovation Systems in Australia, Working Paper 5 of the AustralianInnovation Systems Study (Ausis), July. Accessed 22 March 2007 athttp://ngsm.anu.edu.au/Research/_documents/WP5.pdf.
Barlow, T. 2006, The Australian Miracle, Picador.
Maddison, A. 2001, The World Economy: A Millennial Perspective, Development Centre ofthe OECD, Paris.
OECD, 2005a, ANBERD database, DSTI/EAS Division.
OECD, 2005b, Main Science and Technology Indicators, no. 1.
OECD, 2005c, OECD Science, Technology and Industry Scoreboard.
OCED 2005d, Productivity database, July.
OECD, 2003, ICT and Economic Growth: Evidence from OECD Countries, Industries andFirms.
OECD, 1999, ANBERD database, DSTI/EAS Division.
van Beuzekom, B & Arundel, A., OECD Biotechnology Statistics, 2006.
part; and in many cases their end point is a licence dealwith a big overseas firm that will manufacture and dis-tribute their product.
Indeed, for this reason a disproportionate share of bio-sciences business R&D in Australia is actuallycategorised as R&D in services. (See Figure 7.) MostAustralian biotech firms are in fact service companies. Itis little wonder then that a recent survey conducted bythe Australian Bureau of Statistics found that a quarter ofAustralian biotech firms contract out all their R&D andthat the majority contract out at least some part of theirR&D (ABS, 2004). This is classic system integratorbehaviour.
Australia’s comparative advantageTraditionally, Australian innovators have struggled tocompete globally in activities that placed a premium onscale – notably in consumer-goods manufacturing – butalso in activities that placed a premium on technologycreation. Yet for much of the 20th century our country’sindustry policy has been oriented precisely to fosteractivity in this direction.
Perhaps for this reason, there is a myth in Australia ofthe brave inventor, the imaginative Aussie battler wholeads the world in the race to invention, but who thenstruggles to develop his idea in the face of financial con-straints, investor ignorance, and marketplace resistance.
In my book The Australian Miracle (2006) I havedebunked this myth, arguing on the one hand thatAustralians are much less inventive than they think and,on the other hand, that they are far more adept at com-mercialisation than is popularly imagined.
Unfortunately, while the unravelling of economic pro-tectionism in Australia in recent decades has revealed anew kind of Australia, one that is vigorous and that has
FIGURE 7 PERCENTAGE OF BIOTECHNOLOGY R&D PERFORMEDIN THE SERVICES SECTOR IN 2003 (SELECTED OECD COUNTRIES)
Source: B. van Beuzekom, & A. Arundel, 2006.
0%
25%
50%
75%
100%
USSwitzerland(2004)
NorwayItaly(2004)
Australia
prospered by pursuing comparative advantage, to someextent the negative view of Australian innovation persists.
Despite this, faced with the stark reality of globalmarkets, Australian innovators are moving with theirfeet. In step with the shifting orientation of oureconomy, over the past decades Australians have beenquietly transforming the ways in which they exploitknowledge. The changing investment patterns of innova-tive Australian businesses indicate that Australians arebeginning to see themselves as they really are: as highlyadept system integrators.
This is a journey that we’ve only just begun. In theyears ahead, no doubt we will continue to hear periodiccalls for reintroducing government support for manufac-turing innovation. Some people will bemoan theprospect of a likely continued shift out of hardware.There will be the ongoing debates about whetherAustralian high-tech industries suffer from a shortage ofideas or a shortage of capital or a shortage of manage-ment expertise.
But the success of the Australian economy will ulti-mately depend upon our ability to act upon none ofthese things. Broadening the popular understanding ofinnovation in Australia would be a vastly more construc-tive aim – second only perhaps to an ongoing affirmationthat ultimately the best and only way to identify acountry’s strength in innovation is not through analysisbut in the market.

companies
66
Introduction Globalisation is changing Australian industry. Successdepends on the enterprise and adaptability of Australianfirms and the individual Australians who make up thesefirms. Australians have a deserved reputation for innova-tion and adaptability that has taken so many to the topinternationally.1 We should be confident that the changesin international business will benefit Australia.
The Minister for Industry Tourism and Resources, IanMacfarlane, has identified four factors that underlie thegrowth of Australian industry – investment, innovation,global integration and international competitiveness –and announced in July 2006 the government’s intentionto release an industry statement in 2007 around thetheme of global integration. Following extensive consul-tations, the 10-year, $1.4 billion Statement was releasedby Prime Minister John Howard and MinisterMacfarlane in Sydney on 1 May 2007. Titled GlobalIntegration: Changing Markets, New Opportunities, it aimsto address impediments to growth and encourage thenation's businesses to achieve greater integration into theglobal economy.
For more than a decade Australia has enjoyedeconomic prosperity. Sound macroeconomic manage-ment has kept interest rates and inflation low.Microeconomic reforms including taxation policy,labour market and competition policy have supportedstrong productivity growth, increased business competi-tiveness, and encouraged greater firm flexibility.
In industry policy the focus has shifted from protec-tionism to encouraging capable businesses that cancompete successfully in an open market. The tariff wallsthat once insulated Australian industry have gone.
ANDREW MCCREDIE is a manager
in the Global Opportunities Branch in
the Department of Industry, Tourism
and Resources. He has worked both
in Australia and overseas for US and Australian-owned
multinationals. He has represented Australia at meetings of the
World Bank, OECD and APEC, and was Industry and Science
Counsellor in the Australian Embassy, Seoul.
9
CEDA GROWTH 58
companiesAustralia
I N
multinational
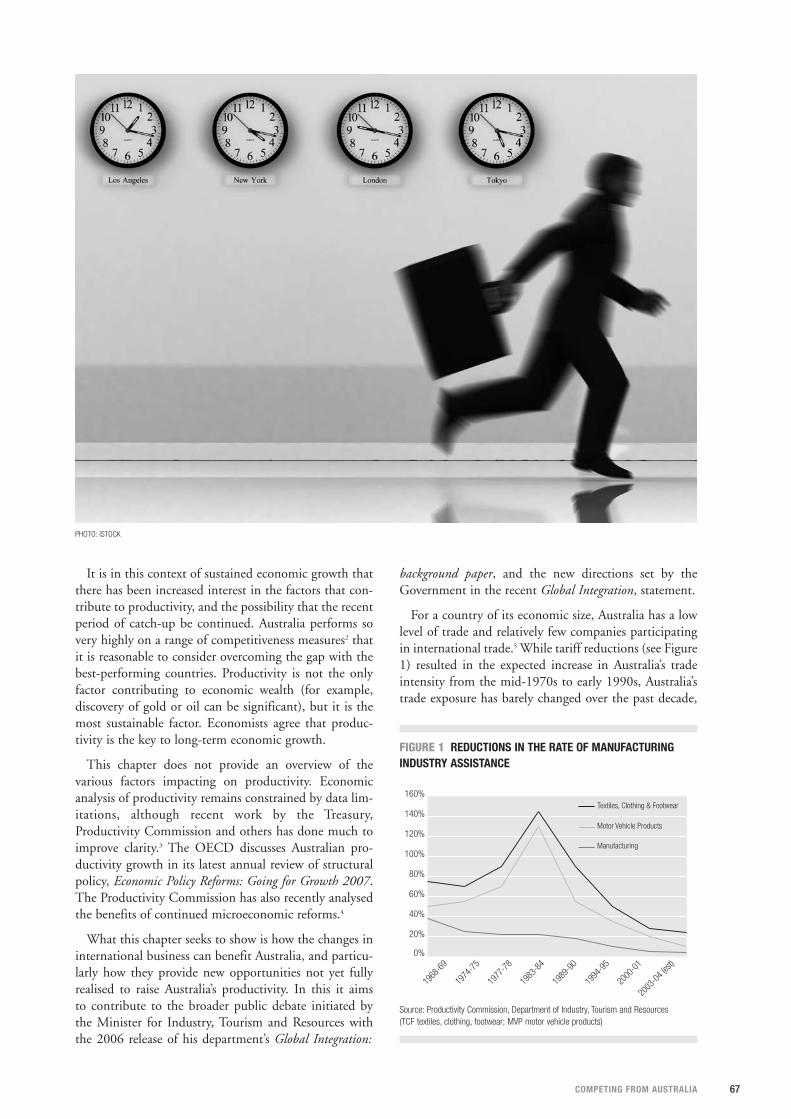
67COMPETING FROM AUSTRALIA
It is in this context of sustained economic growth thatthere has been increased interest in the factors that con-tribute to productivity, and the possibility that the recentperiod of catch-up be continued. Australia performs sovery highly on a range of competitiveness measures2 thatit is reasonable to consider overcoming the gap with thebest-performing countries. Productivity is not the onlyfactor contributing to economic wealth (for example,discovery of gold or oil can be significant), but it is themost sustainable factor. Economists agree that produc-tivity is the key to long-term economic growth.
This chapter does not provide an overview of thevarious factors impacting on productivity. Economicanalysis of productivity remains constrained by data lim-itations, although recent work by the Treasury,Productivity Commission and others has done much toimprove clarity.3 The OECD discusses Australian pro-ductivity growth in its latest annual review of structuralpolicy, Economic Policy Reforms: Going for Growth 2007.The Productivity Commission has also recently analysedthe benefits of continued microeconomic reforms.4
What this chapter seeks to show is how the changes ininternational business can benefit Australia, and particu-larly how they provide new opportunities not yet fullyrealised to raise Australia’s productivity. In this it aimsto contribute to the broader public debate initiated bythe Minister for Industry, Tourism and Resources withthe 2006 release of his department’s Global Integration:
background paper, and the new directions set by theGovernment in the recent Global Integration, statement.
For a country of its economic size, Australia has a lowlevel of trade and relatively few companies participatingin international trade.5 While tariff reductions (see Figure1) resulted in the expected increase in Australia’s tradeintensity from the mid-1970s to early 1990s, Australia’strade exposure has barely changed over the past decade,
PHOTO: iSTOCK
0%
20%
40%
60%
80%
100%
120%
140%
160%
Manufacturing
Motor Vehicle Products
Textiles, Clothing & Footwear
2003
-04 (
est)
2000
-01
1994
-95
1989
-90
1983
-84
1977
-78
1974
-75
1968
-69
FIGURE 1 REDUCTIONS IN THE RATE OF MANUFACTURINGINDUSTRY ASSISTANCE
Source: Productivity Commission, Department of Industry, Tourism and Resources (TCF textiles, clothing, footwear; MVP motor vehicle products)
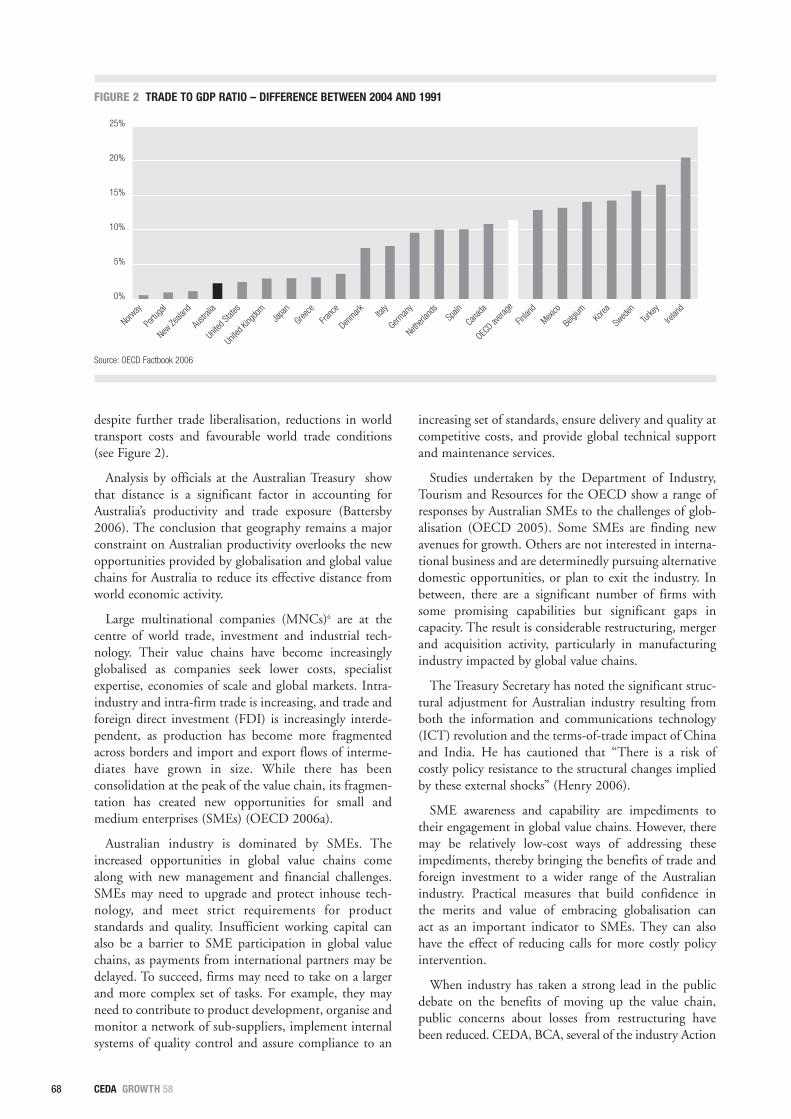
68
despite further trade liberalisation, reductions in worldtransport costs and favourable world trade conditions(see Figure 2).
Analysis by officials at the Australian Treasury showthat distance is a significant factor in accounting forAustralia’s productivity and trade exposure (Battersby2006). The conclusion that geography remains a majorconstraint on Australian productivity overlooks the newopportunities provided by globalisation and global valuechains for Australia to reduce its effective distance fromworld economic activity.
Large multinational companies (MNCs)6 are at thecentre of world trade, investment and industrial tech-nology. Their value chains have become increasinglyglobalised as companies seek lower costs, specialistexpertise, economies of scale and global markets. Intra-industry and intra-firm trade is increasing, and trade andforeign direct investment (FDI) is increasingly interde-pendent, as production has become more fragmentedacross borders and import and export flows of interme-diates have grown in size. While there has beenconsolidation at the peak of the value chain, its fragmen-tation has created new opportunities for small andmedium enterprises (SMEs) (OECD 2006a).
Australian industry is dominated by SMEs. Theincreased opportunities in global value chains comealong with new management and financial challenges.SMEs may need to upgrade and protect inhouse tech-nology, and meet strict requirements for productstandards and quality. Insufficient working capital canalso be a barrier to SME participation in global valuechains, as payments from international partners may bedelayed. To succeed, firms may need to take on a largerand more complex set of tasks. For example, they mayneed to contribute to product development, organise andmonitor a network of sub-suppliers, implement internalsystems of quality control and assure compliance to an
increasing set of standards, ensure delivery and quality atcompetitive costs, and provide global technical supportand maintenance services.
Studies undertaken by the Department of Industry,Tourism and Resources for the OECD show a range ofresponses by Australian SMEs to the challenges of glob-alisation (OECD 2005). Some SMEs are finding newavenues for growth. Others are not interested in interna-tional business and are determinedly pursuing alternativedomestic opportunities, or plan to exit the industry. Inbetween, there are a significant number of firms withsome promising capabilities but significant gaps incapacity. The result is considerable restructuring, mergerand acquisition activity, particularly in manufacturingindustry impacted by global value chains.
The Treasury Secretary has noted the significant struc-tural adjustment for Australian industry resulting fromboth the information and communications technology(ICT) revolution and the terms-of-trade impact of Chinaand India. He has cautioned that “There is a risk ofcostly policy resistance to the structural changes impliedby these external shocks” (Henry 2006).
SME awareness and capability are impediments totheir engagement in global value chains. However, theremay be relatively low-cost ways of addressing theseimpediments, thereby bringing the benefits of trade andforeign investment to a wider range of the Australianindustry. Practical measures that build confidence inthe merits and value of embracing globalisation canact as an important indicator to SMEs. They can alsohave the effect of reducing calls for more costly policyintervention.
When industry has taken a strong lead in the publicdebate on the benefits of moving up the value chain,public concerns about losses from restructuring havebeen reduced. CEDA, BCA, several of the industry Action
CEDA GROWTH 58
0%
5%
10%
15%
20%
25%
Irelan
d
Turke
y
Swed
en
Korea
Belgi
um
Mexico
Finlan
d
OECD av
erage
Canad
a Sp
ain
Netherl
ands
German
y Ita
ly
Denmark
Franc
e
Greece
Japa
n
Unite
d King
dom
Unite
d Stat
es
Austr
alia
New Ze
aland
Portu
gal
Norway
FIGURE 2 TRADE TO GDP RATIO – DIFFERENCE BETWEEN 2004 AND 1991
Source: OECD Factbook 2006

69COMPETING FROM AUSTRALIA
Agendas such as electronics and advanced manufac-turing, and more recently the Australian Industry Group,particularly in its 2006 report Manufacturing Futures,have been active in advocating high-value growthprospects for Australia, including adoption of offshoremanufacture where appropriate. As the recent furoreabout Blundstone illustrates, this issue remains sensitive.7
It is not just in Australia that offshoring has been con-troversial. South Korea, Taiwan and Hong Kong have allfaced significant industrial restructuring resulting fromlow wage competition from China, particularly duringthe 1990s in the textile, clothing and footwear industries.Effective industry advocacy can counter calls for policyresistance.8
The “smiling curve” was developed by Stan Shih,founder and former CEO of Acer Computers in his roleas industry adviser to Taiwan President Chen Shui-bian,when there was a concern about manufacturing ofTaiwan laptops moving to China in the early 2000s:
I try to convince the Taiwan general public that the hol-lowing out of low-value-added activity is not a criticalconcern. Hollowing out the future higher-value-addedactivity is the concern, and those areas are more intangible.Hollowing out of tangible things is not critical. Hollowingout of intangible things is really critical. But this kind ofmessage is not easy to communicate and appreciated by thegeneral public (Business Week International online extra2005).
Mr Shih was successful; no Taiwanese restrictions wereplaced on the migration of computer manufacture toChina.
Multinationals and the global value chainsMNCs dominate global value chains. They undertaketwo-thirds of world trade, much of that in intra-firmtransfers. The world’s top 1000 companies direct 90 percent of world foreign direct investment (FDI) (OECD2003) and undertake the bulk of world business expen-diture on R&D.9 About seven multinationals spendmore on R&D individually than Australian businesses intotal (ABS 2006; Department of Trade and Industry2006). The global markets served by multinationals are the main means of commercialising industrial innovation.
The largest firms are also important drivers of produc-tivity growth. In the United States, between 1995 and2005, labour productivity of the largest enterprisesemploying just 20 per cent of the workforce increased byalmost 70 per cent. In consequence, the 1000 largest USenterprises are at the origin of a significant portion of theoverall US economic growth (Dembinski 2007).10 Theindustries that have shown the strongest productivitygrowth in the US are manufacturing, wholesale and retail– industries where large US firms have made extensiveuse of global value chains.
The political and economic changes of the past 15years have seen a global move towards market economies,resulting in the emergence of significant new capitalmarkets, trade liberalisation, privatisation and the spreadof financial deregulation, as well as the creation of anincreasingly integrated global economy. The conditionshave provided MNCs with increased opportunities toachieve global economies of scale resulting fromimprovements in communications, transport and pro-duction process innovation within global value chains.
FIGURE 3 GLOBAL VALUE CHAIN MODEL BASED ON STAN SHIH’S “SMILING CURVE”
Source: Business Week International online extra, May 16, 2005, Stan Shih on Taiwan and China.
AddedValue
Value Creation
Value-added
process
Brand
Marketi
ng
Logis
tics
Asse
mbly
Design
Manufa
cture
R&D
Innova
tion
Stand
ardisa
tion
High Value-AddedProduct and Services
CentreR&D/Innovation
Centre
Higher Added-valueand Lower Replacement
Global LogisticsCentre

70
The number of MNCs grew from 24,000 in 1990 to77,000 in 2006, and they now employ 62 million peopleand create $US4.5 trillion in value-added goods(UNCTAD 2006). The growth in FDI (offshore invest-ment by multinationals) has outstripped world economicand trade growth over the last decade, even discountingthe exuberance of the 2000 technology boom. Figure 4illustrates the impact of globalisation. While world GDPdoubled over the period 1991–2005; world trade tripledand world FDI increased six-fold over the same period.
Global value chains11 can be considered at both theindustry and firm level. Figure 3, Stan Shih’s smilingcurve, provides an industry level schematic of a goodsvalue chain. As illustrated in the figure, the value chainmodel maps the linkages and networks at the industrylevel and analyses the sources of value in the chain.
At the firm level, value chain analysis helps determinewhich specific activities give organisations a competitiveadvantage and create value, as well as which activitiesshould be outsourced. It is now common for OriginalEquipment Manufacturers (OEMs) to outsource signifi-cant parts of their value chain. For example, OEMs forlaptops and mobiles (such as Dell and Nokia) now typi-cally outsource the goods manufacturing process tospecialist electronics manufacturing service firms (such asFoxconn and Flextronics).
The capacity for value-adding processes to be sliced upfinely among many firms has implications for nationalstatistical classification systems (like ANZSIC) and theuse of these classifications to understand productivitytrends. Are pharmaceutical companies, where the cost ofmanufacturing a pill is a few cents, no longer manufac-turers but really in business services (like Microsoft)? AreOEMs that contract out manufacturing still manufac-turers? Such classifications can be a distraction fromunderstanding the value-adding processes in the valuechain. The industry classification systems used by major
stock markets avoid this issue and classify companiessuch as Dell and Nokia in consumer goods and compa-nies such as Foxconn and Flextronics in industrials.
The trends in global value chains mean:
• lead companies are categorised by their financial andtechnical capabilities with consolidation occurringamong the lead companies in many value chains;
• domestic suppliers are being replaced by more techno-logically-advanced and lower-cost global suppliers;
• more manufacturing and service processes are being sys-tematised and established in low-wage areas, spreadingcentres of global business beyond developed countries;and
• global value chains of networked suppliers have sup-planted the model of vertically integrated regionaloperations within MNCs.
There is also a trend towards partnerships with keysuppliers to reduce cost, risk and time of new productdevelopment. This is generating new opportunities forSMEs. Reflecting this, in many OECD countries SMEsaffiliated with multinationals show stronger rates ofoutput and export growth than independent SMEs(OECD 2003).
Global drivers of value
Customer expectations Time Magazine person of the year for 2006, “you”,reflects the growing recognition of the importance ofconsumers in the value chain. Increased incomes haveincreased discretionary spending, stimulating greaterindividualisation of products as a social trend andincreased choice of goods and services. Environmentalissues/values of consumers are impacting on brand valueand regulation.
CEDA GROWTH 58
Source: Trade data from WTO database, FDI data from UNCTAD database, and GDP data from IMF database.
0
200
400
600
800
1000
Trade (merch) GDPFDI inward
200520042003200220012000199919981997199619951994199319921991
FIGURE 4 GLOBALISATION 1991–2005

71COMPETING FROM AUSTRALIA
As Stan Shih’s smiling curve illustrates, there is richvalue associated with understanding consumers, the finalcustomer in the value chain and ensuring that their needsare met – timeliness, design, fashion, environment, tech-nology, reliability and cost. Some MNCs are viewing thisrelationship as their core business and are pushing cons-umer demands as they view them onto their supply chain.
Key developments include:
• widespread adoption of lean processes by customers insupply chains, with attention on build-to-order andtime-to-deliver cycles;
• expectation of continual cost and quality improvementsas a result of product and process innovation; and
• mass customisation that involves a “family” of productsthat appeal to a wider range of consumers.
Underlying mass customisation is a common platformfrom which distinctive product variants can be derived orcustomised. The platform is defined as components andsubsystems commonly shared across a product family. Awell-organised platform is critical to achieving economiesof scale by identifying repetitive applications of sharetooling, knowledge and other resources, includingrelating these to order fulfilment and customer service.
Achieving economies of scale in global supply chainsThe lowering of trade barriers, including better intellec-tual property protection, improved communications andtransport systems, convergence of global consumerneeds, and increased miniaturisation of many products,is enhancing the scope for multinationals to gaineconomies of scale not available to domestic firms.
In the consumer electronics and clothing industries,global manufacturing centres have been established inAsia to take advantage of low wages. Manufacturingplants built in these regions by multinationals as globalproduction centres are typically highly advanced, usingthe latest in process technology.
In the services industry, India has become a globalcentre for call centres, financial and accounting services,engineering design and software development.
The automotive industry has also sought to realisegreater economies of scale. Faced with prospects for rapidtechnological innovation particularly in new engines,light materials and automotive electronics/telematics andthe resultant need for massive investment in technologyand new products, the industry has consolidated, asexemplified by the mergers of Daimler–Chrysler andRenault–Nissan. There are now 11 carmakers withannual production above one million vehicles.
In parallel with increasing scale through M&A,automakers have reduced exposure to risk and costs oftechnology development by reconfiguring their owner-ship of the supply chain. Ford and General Motors have
sold their former parts divisions, forming the new spe-cialist tier one supply companies, Visteon and Delphi.
Further structural change in the automotive industryseems likely. China has not been a significant manufac-turer of automotive products for world markets, but thatis about to change. Production is expected to doublefrom 5 million vehicles a year in 2005 to 10 million in2010, with an even greater increase in the value of partsproduction. All significant vehicle and parts manufac-turers have already established or are establishingChinese manufacturing operations.
Gaining economies of scale has also been important inthe oil and gas supply chain. Oil majors have used part-nerships and alliances to reduce risks. For example, oilmajors now typically contract the construction of newplant facilities on a cost-performance basis to engi-neering, procurement, construction management(EPCM) firms such as Halliburton, Bechtel and AkerKvaerner.
The trend by EPCMs towards modularisation ofplants, systems and technology has given rise to interna-tional suppliers who have the capacity to competitivelydeliver modular process plants worldwide – for example,synthesis gas plants – and to absorb a significant level ofrisk. To lower costs, the major EPCMs have all estab-lished low-cost Asian engineering and design centres andencouraged consolidation and globalisation among theirsuppliers. Consequently, the proportion of domesticcontracts in major oil and gas engineering projects hassteadily declined.
In the tourism industry, airlines, travel agents, hotelsand car rental companies are also turning towards globalsuppliers. For example, Qantas has outsourced much ofits IT functions to Amadeus – one of the major globaldistribution systems. Better customer relationship man-agement is a major focus for the development of ITbusiness systems within the tourism industry.
Rise of virtual integration in supply chains Rapid, flexible and low-cost means of achieving thebenefits of global operations are increasingly beingexplored through alliances and partnerships. Improve-ments in ICT facilitate the lean integration of globaloperations.
Rapid, flexible and low-cost
means of achieving the benefits
of global operations are increasingly
being explored through alliances
and partnerships.

72
The success of this approach is shifting the competitivelandscape from large, vertically integrated organisationsoperating within national borders to the virtual integra-tion of a number of companies through partnerships andalliances across geographic locations (Porter 1998). Thisapproach has opened up new opportunities for globaloperation by SMEs, with the apparel company Billabongbeing a well-known Australian example.
Traditionally, vertically integrated multinationals haveoperated and managed most functions in the supplychain. They have direct control of these functions, whichenables them to maintain quality and timeliness ofdelivery, keep production close to the customer, andprotect sources of supply. The approach was multi-domestic – there was a considerable degree of localmanagement autonomy, many suppliers were domesticwith little attempt to achieve global economies of scale inthe supply chain.
The trend over the past decade has been to replacevertical integration within national boundaries withvirtual integration. Here, the management processes ofglobal enterprises are organised internationally. There ismuch less national autonomy and the global businesscentres look to suppliers that provide cost-savingsthrough standardisation and improved quality andservice – particularly in the context of lean productionsystems, in addition to unit cost savings. This means thatsuppliers with domestic supply capability only are beingreplaced by suppliers with regional or global capacity.
In the virtually integrated supply chain model pio-neered by firms like CISCO and Dell, partnerships withkey suppliers are developed to help multinationalsmanage costs and risks and respond faster to globalchanges. The value of the virtual integration modelability to perform in a superior way was demonstrated by
CISCO/Dell during the 2001 technology downturn andnow has been widely emulated by their competitors.
Impact of changing technology Of the various processes in the value chains of MNCs,technical development has been the least globalised andmost commonly kept, predominantly in the homecountry. For some time technology’s importance forMNC competitiveness has been growing. In response,MNCs are seeking to reduce the time to market andbroaden their access to new ideas through rising levels ofcollaboration and increasing the global integration oftheir innovation process.
During the 1980s there was significant migration ofR&D to production centres abroad, but the objectivewas primarily adaptation to domestic markets. Duringthe 1990s, the trend of establishing foreign technicalcentres with global product development mandatesbecame well established, drawing on specific skills andcentres of expertise.
Increasingly over the past decade technical develop-ment has come to be treated by firms like other businessservices functions, with issues of cost and scalabilitydriving companies to establish R&D centres in countriessuch China and India, and also to outsource longer termand non-core research. There is also a rise in foreignR&D investment from China, Korea, Taiwan and so onseeking advanced knowledge in the US and EuropeanUnion.
Within the bounds of relatively static or slowlygrowing business investment in R&D within OECDcountries there is considerable flux at the firm level.Developments in technology promise efficiencies inprocesses and new products at an increasing rate. Leadfirms need to be able to respond rapidly to new develop-
CEDA GROWTH 58
Source: UNCTAD, World Investment Report 2005 (fig IV.8)
FIGURE 5 DISTRIBUTION OF FOREIGN R&D LOCATIONS
0%
10%
20%
30%
40%
50%
60%
70%
Thaila
ndKo
reaIsrae
l
Austr
ia
Taiwan
Polan
dIre
land
Netherl
ands
Russi
a
Norway
Findla
nd
Austr
alia
Switzl
and
Swed
en
Belgi
umSp
ainBra
zilItaly
Singa
pore
German
y
Canad
aInd
iaJa
pan
Franc
eChin
aUKUS

73COMPETING FROM AUSTRALIA
ments, and failure to do so is a leading cause of consoli-dation at the peak of many value chains. The explosionof scientific knowledge in bio-, nano- and informationtechnology is beyond the capacity of even the largestfirms to assess and maintain inhouse capabilities.
Therefore leading firms are making greater use ofR&D conducted elsewhere and targeting internalresearch at either filling in missing gaps or creating inte-gration mechanisms that build upon external researchactivity. Many large firms use merger and acquisitions togain the technology that they need. International corpo-rate R&D involves mobility of people and collaborationaround the world with suppliers, universities, researchinstitutes, customers and even competitors.
Companies are using a variety of commercialisationprocesses to increase the speed to market. Internaldeployment, spin-off companies and licensing are allused, depending on the business fit. The role of corpo-rate technical centres has changed from being a developerof technology for use within the company to integratingglobally distributed R&D to create business value eitherwithin or outside the company.
The pace of internationalisation of R&D seems to beincreasing. An UNCTAD survey of the largest R&Dinvestors in 2004–05 found that as many as 69 per centof the responding firms stated that their share of foreignR&D is set to increase.
Figure 5 is based on data from the UNCTAD survey,and shows the distribution of foreign R&D locationsamong the largest MNCs. Notable is the rise of China,reflecting both China’s increasing importance as a marketand as the fourth largest R&D performer after the US,EU and Japan (OECD 2006d). Reportedly, there were750 foreign R&D centres in China in 2005, up from 30
in 1999 (OECD 2006d, p. 133).12 Although there aresome caveats to this,13 the growth and significance ofChina as a centre for industrial technical researchremains impressive.
Figure 6 shows the most attractive prospective loca-tions for R&D by major MNCs. China, India andRussia feature strongly.
The internationalisation of R&D poses issues forpolicy-makers. Detailed econometric assessment of thenational costs and benefits must await development andcollection of data – perhaps many years. In themeantime, policy-makers are being challenged to changetheir mindset from supporting R&D and innovationactivities of “their” companies to making their countrythe best place for companies around the world toinnovate and perform R&D (Karlsson, 2006, p. 11).
As Australia’s location and size has frequently meantthat our capabilities are overlooked, it is a fair assump-tion that internationalisation of Australian businessR&D by raising the profile of Australian capability, ismore likely to bring benefits than more centrally locatedbut higher cost/lower capability economies.
Australia’s international engagementInternational engagement contributes to Australia’s pro-ductivity growth and long-term economic growth. Whileefforts to improve Australia’s trade performance areimportant, there are other means by which Australia canengage internationally. International engagement thatgenerates productivity benefits can also be gainedthrough FDI, and associated global value chains, andthrough engagement in world class science, R&D andinnovation.
Source: UNCTAD, World Investment Reports 2005 (figi IV.11)
FIGURE 6 MOST ATTRACTIVE PROSPECTIVE FOREIGN R&D LOCATIONS
0%
10%
20%
30%
40%
50%
60%
70%
Viet N
amTu
rkey
Tunis
ia
Swed
enSp
ain
South
Afric
a
Roman
iaPo
land
Norway
Morocc
o
Mexico
Israe
l
Irelan
d
Czech R
epub
licBra
zil
Austr
alia
Thaila
nd
Repu
blic o
f Kore
a
Malaysi
aIta
ly
Belgi
umTai
wan
Singa
pore
Canad
a
The N
etherl
ands
German
y
Franc
e
Russi
an Fe
derat
ionUKJa
pan
IndiaUS
China
74
Australian MNCsAustralian firms including CSL, BlueScope Steel,Cochlear, ResMed and Billabong are showing Australiacan grow global firms that take advantage of the oppor-tunities for MNCs. Some of these companies arerelatively new, their capabilities being realised and takento world-leading performance following corporaterestructuring.
The importance of intangibles such as intellectualproperty (IP), knowledge and relationships to the successof Australia’s global firms has been noted by Bruce Grey,Managing Director, Bishop Technology Group (DITR2006). Australia cannot compete with developing Asiaon costs and is distant from world markets, so intangiblesare especially important. The IP doesn’t have to be devel-oped just in Australia. Most of Australia’s successfulglobal companies have built on their IP with foreignacquisitions, licences and joint ventures so as to establishcompetitive advantage in their industry.
For example, through European and US acquisitionsCSL has complemented its process technology withproduct-related IP and its plasma business now has fiveR&D centres outside Australia. See case study box forfurther details of CSL’s global business.
Faced with competition from much larger steel com-panies, BlueScope Steel has focused on the brandedproducts spectrum of the steel business, backing its leadin flat steel and coatings technology with a series of part-nerships with companies like Bethlehem Steel, IHHIndustries of Japan, Akzo-Nobel and Nucor. Since itssplit from BHP in 2002, BlueScope Steel has leveragedits world-class IP beyond its Australian base throughinvestments in China (it is the largest Australian investorin China), India, the US and ASEAN. The global expan-sion strategy seems successful; BlueScope Steel’s shareprice has risen from $2.80 from the share float in July2002 to $9.60 with a market capitalisation of $7 billionin March 2007.
CEDA GROWTH 58
BOX 1CSL IS ONE OF AUSTRALIA’S MOST SUCCESSFUL COMPANIES. SINCE ITS PUBLIC FLOAT IN 1994 ITS MARKET VALUE HAS INCREASED FROM AROUND $300 MILLION TO AROUND $15 BILLION IN 2007.
The Commonwealth Serum Laboratories (CSL) were estab-
lished in 1916 to supply Australia with vaccines and other
bacteriological products otherwise unavailable due to the
First World War. Under public ownership, CSL was a leader
in the introduction of several vaccines, including the vaccine
for polio, and was one of the first organisations to manufac-
ture penicillin following the discoveries made by Dr Howard
Florey.
Before its public float in 1994, CSL was well advanced in
developing commercial-scale chromatographic separation
of blood. The chromatographic process was known to
increase albumin purity from around 95 per cent to 98 per
cent and the yield from about 65 per cent to 85 per cent over
conventional blood separation processes, but there are sig-
nificant impediments to doing this at commercial scale.
Small percentage increases in purity can be therapeutically
very significant.
CSL’s chromatographic plasma fractionation plant in
Broadmeadows, Victoria was built in 1994 and in 1995 CSL
issued the world’s first chromatography-based albumin
product. CSL states that its $350 million Broadmeadows
plant is “one of the most sophisticated plasma fractionation
facilities in the world, and the only commercial scale facility
of its type” (CSL 2007).
CSL has exploited its leading process technology mainly
through acquisition of overseas plasma manufacturing and
collection capacity, rather than exporting. Blood donation is
an important mode of collection and people feel more com-
fortable with their blood being processed and used for local
purposes. CSL purchased ZLB in 2000 and Aventis Behring
in 2004 (acquiring manufacturing facilities and plasma
product R&D capacity in Germany, Switzerland and the US).
In doing this, the CEO of CSL noted that success in the
plasma products industry demands “a broad portfolio of
quality products, an innovative R&D pipeline, an efficient
high yield production operation, the ability to balance market
demands and outputs and a global marketing effort”.14 CSL
has methodically put together each of these elements.
The strategy has been successful with CSL on track to
record a $500 million after-tax profit in 2006–07, primarily
via its US and European-based CSL Behring plasma group.
Australia has long made a significant global contribution in
fields such as public health as the history of CSL illustrates.
In the mid-20th century when public health authorities were
dominant, CSL made its contribution through exchanges of
technology with similar authorities overseas. In the 21st
century commercial practices dominate health products, as
Australia’s fast-growing imports illustrate. The trans-
formation of CSL into a private company illustrates that
Australians remain just as capable of creating value in the
development and use of health products as we were in the
pre-commercial world.
.

75COMPETING FROM AUSTRALIA
Billabong is Australia’s most successful apparelcompany, being an ASX Top 100 company with a marketcapitalisation of $3.5 billion. Under ANZSIC industryclassifications, Billabong’s business is clothing wholesaleand it provides an illustrative example of productivitygrowth by the wholesale industry in Australia. Billabonginvests heavily in the creation of brand loyalty and valuethrough product design and iconic sports sponsorship. Ithas complemented its core brand with investment inother brands, Element (skates), Nixon (watches) and VanZipper (sunglasses). The headquarters of Billabong are onthe Gold Coast, Queensland, and it has business andproduct-development centres in Europe and NorthAmerica. Its products are distributed globally with morethan two-thirds of its sales outside of Australia. Billabongalso owns and licenses retail stores. Manufacture is prima-rily contracted to Asia.
Australian suppliers succeed in global value chains All major instrument manufacturers in chromatographyand mass spectroscopy incorporate SGE analyticalscience manufactured components in their systems.Bishop Technologies is a supplier of steering technologyto around 20 per cent of the world’s cars. Worley Parsonsis a global leader in alliance contracts in engineeringservices, especially in the oil and gas industry. AnimalLogic produces visual effects, animation and design forthe film, television and advertising industries such as theaward-winning Happy Feet. GKN Aerospace EngineeringServices Australia has designed more than 1000 parts forthe Joint Strike Fighter15 – 10 per cent of the total.Traditionally, aerospace engineering firms have been co-located or closely located to the final assembly site,excluding Australian suppliers, but technology allowswork to be undertaken remotely where the best engineersare located (Invest Australia 2006). Peregrine Australiamakes a radio frequency (RF) sapphire wafer chip thatcombines antennas with amplifier and is the RF chip ofchoice for top end Nokia and Motorola mobile phones.
Silverbrook Research is a specialist IP developer in opto-electronics, and is Australia’s leading filer of patents inglobal markets. Its CEO, Kia Silverbrook, has more than800 US patents in his name.
What this means is that even though Australia’s shareof world trade in these industries is only about 0.3 percent, Australian designs and products are inside a signifi-cant proportion of the world’s cars, scientific instruments,films, aircraft and phones. Australian components arehigh value, helping make good products great. The com-panies that create these products in Australia generatehigh-value jobs, and their growth is a major contributorto Australian productivity growth.
Figure 7 shows that Australia’s stock of outward FDI,that is investment in foreign affiliates by AustralianMNCs, has consistently been above 1.5 per cent of worldFDI stocks for most of the past decade, that is 50 percent higher than Australia’s share of world trade. Giventhe rapid rise in world FDI this is a strong indicator ofthe success of firms like BlueScope Steel and CSL.
Figure 8 shows that investment income fromAustralian FDI abroad has risen from 4 per cent to 6 percent of all Australian credits from abroad, that is creditsfor exports or goods and services plus credits resultingfrom equity and portfolio income. In current dollars, therise has been from about $4 billion in 1995–06 to $13billion in 2005–06. Were FDI income to be comparedwith the top 20 exporting industries, it would be thirdonly to coal and iron ore, and ahead of personal traveland education services. A large part of Australianoutwards FDI is in manufacturing at 44 per cent, withfinance and insurance the next largest at 36 per cent. FDIby business services companies is growing rapidly, butfrom a small base (ABS 2006a). Given the apparent con-straints placed by Australia’s location on trade growth,further growth in outwards FDI may be an importantmeans of gaining the benefits of global integration.
FIGURE 7 AUSTRALIA’S SHARE OF THE WORLD
Source: UNCTAD, WTO and IMF databases
0%
1%
2%
3%
4%
5%
Trade (Merch)
GDP
FDI Outward (stock)
FDI inward (stock)
20052004200320022001200019991998199719961995199419931992199119901989198819871986198519841983198219811980

76
Asia may be the most promising location for growth inAustralia’s outward FDI. While overall Australianoutwards FDI is strong, Asia is missing out. ABS data(2006a) on Australian investment abroad shows that atDecember 2005 around 88 per cent of Australianoutwards FDI was in the US, EU, New Zealand andCanada; an increase from 82 per cent in 2001.
Out of the total $241 billion of Australian FDI abroadas of December 2005, investment in some Asian coun-tries was low – $135 million in Japan, $47 million inIndia, $799 million in Korea and $856 million in China.Total stock of FDI in China was around A$415 billion,16
so Australia’s investment in China has the potential torise more than seven-fold were Australian firms to investin China at their global average (UNCTAD 2006).Given the productivity benefits that the US in particularseems to have derived from FDI in Asia, the AustralianGovernment’s focus on a free trade agreement (FTA) inAsia to address a range of impediments to investment isappropriate. Australia has strong cultural ties to much ofAsia which should be a major benefit in developinginvestment opportunities. For example, there are 50,000Australians resident in Hong Kong, and the Hong Kongchapter of Engineers Australia has 1700 members.
Trevor Rowe, Chairman, Investment Banking,Rothschild (Australia), noted the following impedimentsto Australian investment in Asia:
• the track record has not always been good;
• Australian institutional investors’ attitude towardsAsian expansion has generally been negative, with apreference to invest in proven and established ventures;
• difficulties in structuring the equity in a way that meetsAsian requirements and is acceptable to the institu-tional investor in the Australian market;
• investing in Asian businesses often requires a longerinvestment timeframe. Articulating long-term benefitsto shareholders who have an imperative for short-termreturns can be challenging; and
• there is a lack of truly local knowledge and in num-erous situations the lack of local partner connections.
As a result, Rowe (2006) says the race for investmentin the high-growth Asian economies is often being wonby the larger US and European players, who have greatercapital to deploy and for whom the relative size ofinvesting in Asia is significantly smaller than anAustralian company.
The very rapid maturing of China’s economy, withlarger middle-class markets, greater opportunities fortechnology acquisition, fewer restrictions on investmentand better intellectual property protection will openopportunities for Australian companies.
Foreign MNCs in AustraliaInvestment in Australia by foreign-owned multinationalsis also an important mechanism for global integration.Figure 7 shows Australia has a share of world FDI stockaround twice that of its share of world production. Thereare three primary drivers of foreign investment: access tomarkets, resources, and intangibles such as IP and knowl-edge. Multinational investment in Australia’s resourcessector remains strong with growth in Asia expanding andopening up major markets for Australian resources. Thisis attracting investment by MNCs, including from newsources in Asia beyond Japan. The challenge for Australiais in turning declining interest in Australia as a marketinto greater interest in Australia for its intangibles. As ofDecember 2005, the $281 billion of FDI in Australiawas allocated as follows: 21 per cent mining, 19 per centmanufacturing, 17 per cent wholesale, 14 per centfinance and insurance, 9 per cent transport and commu-nications and 5 per cent business services (ABS 2006a).
There is a significant opportunity to expand Australia’sposition as a technology provider into global valuechains. We have noted the increased willingness formultinationals to contract out and acquire R&D frominnovative SMEs, research institutions and universities.Australian firms and research institutions are benefiting.Major acquisitions of Australian-developed IP includethe purchase of the wireless technology firm Radiata by CISCO, the membrane technology firm Memtech byUSFilter (itself now part of the French Veolia Enviro-nnement group), the electrical switches company Clipsalby Schneider Electric, and the 2007 investment by Boschin Pacifica – the latter particularly for its drive-by-wiretechnology.
CEDA GROWTH 58
Source: ABS Cat. No. 5302.0
FIGURE 8 AUSTRALIA’S OVERSEAS EQUITY INCOMEAS PROPORTION OF TOTAL CREDITS
0%
1%
2%
3%
4%
5%
6%
7%
2005
-06
2004
-05
2003
-04
2002
-03
2001
-02
2000
-01
1999
-00
1998
-99
1997
-98
1996
-97
1995
-96
1994
-95
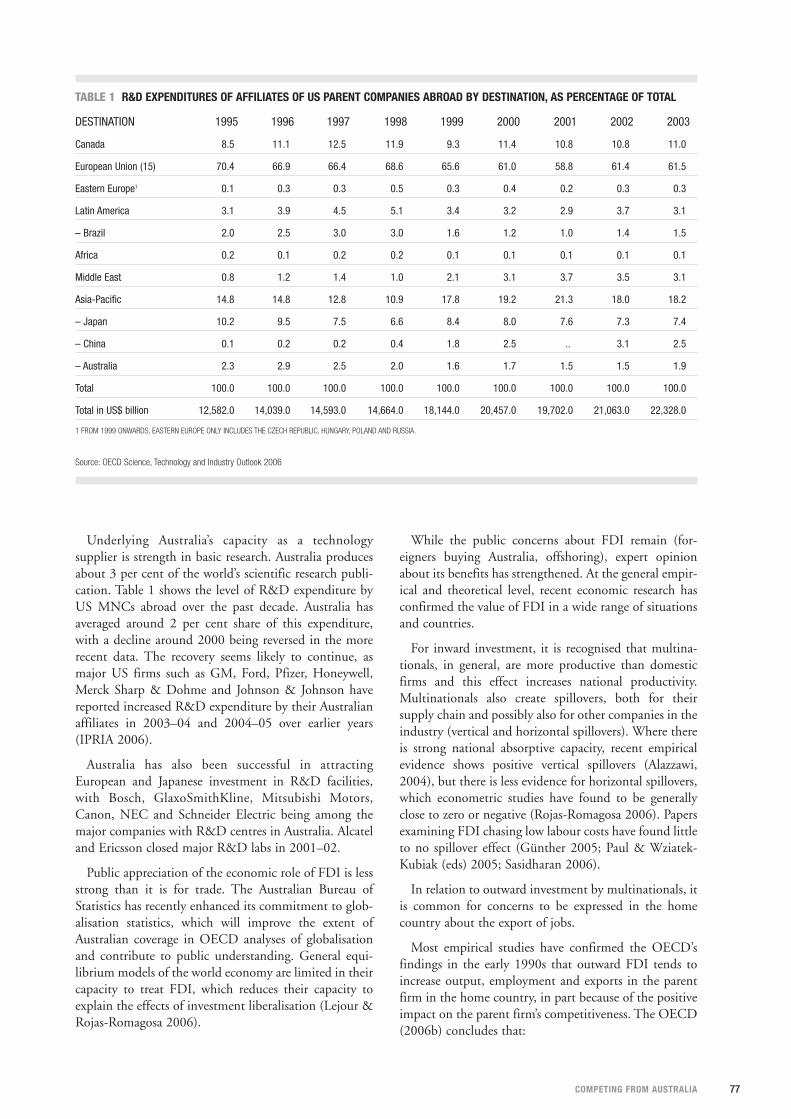
77COMPETING FROM AUSTRALIA
Underlying Australia’s capacity as a technologysupplier is strength in basic research. Australia producesabout 3 per cent of the world’s scientific research publi-cation. Table 1 shows the level of R&D expenditure byUS MNCs abroad over the past decade. Australia hasaveraged around 2 per cent share of this expenditure,with a decline around 2000 being reversed in the morerecent data. The recovery seems likely to continue, asmajor US firms such as GM, Ford, Pfizer, Honeywell,Merck Sharp & Dohme and Johnson & Johnson havereported increased R&D expenditure by their Australianaffiliates in 2003–04 and 2004–05 over earlier years(IPRIA 2006).
Australia has also been successful in attractingEuropean and Japanese investment in R&D facilities,with Bosch, GlaxoSmithKline, Mitsubishi Motors,Canon, NEC and Schneider Electric being among themajor companies with R&D centres in Australia. Alcateland Ericsson closed major R&D labs in 2001–02.
Public appreciation of the economic role of FDI is lessstrong than it is for trade. The Australian Bureau ofStatistics has recently enhanced its commitment to glob-alisation statistics, which will improve the extent ofAustralian coverage in OECD analyses of globalisationand contribute to public understanding. General equi-librium models of the world economy are limited in theircapacity to treat FDI, which reduces their capacity toexplain the effects of investment liberalisation (Lejour &Rojas-Romagosa 2006).
While the public concerns about FDI remain (for-eigners buying Australia, offshoring), expert opinionabout its benefits has strengthened. At the general empir-ical and theoretical level, recent economic research hasconfirmed the value of FDI in a wide range of situationsand countries.
For inward investment, it is recognised that multina-tionals, in general, are more productive than domesticfirms and this effect increases national productivity.Multinationals also create spillovers, both for theirsupply chain and possibly also for other companies in theindustry (vertical and horizontal spillovers). Where thereis strong national absorptive capacity, recent empiricalevidence shows positive vertical spillovers (Alazzawi,2004), but there is less evidence for horizontal spillovers,which econometric studies have found to be generallyclose to zero or negative (Rojas-Romagosa 2006). Papersexamining FDI chasing low labour costs have found littleto no spillover effect (Günther 2005; Paul & Wziatek-Kubiak (eds) 2005; Sasidharan 2006).
In relation to outward investment by multinationals, itis common for concerns to be expressed in the homecountry about the export of jobs.
Most empirical studies have confirmed the OECD’sfindings in the early 1990s that outward FDI tends toincrease output, employment and exports in the parentfirm in the home country, in part because of the positiveimpact on the parent firm’s competitiveness. The OECD(2006b) concludes that:
TABLE 1 R&D EXPENDITURES OF AFFILIATES OF US PARENT COMPANIES ABROAD BY DESTINATION, AS PERCENTAGE OF TOTAL
DESTINATION 1995 1996 1997 1998 1999 2000 2001 2002 2003
Canada 8.5 11.1 12.5 11.9 9.3 11.4 10.8 10.8 11.0
European Union (15) 70.4 66.9 66.4 68.6 65.6 61.0 58.8 61.4 61.5
Eastern Europe1 0.1 0.3 0.3 0.5 0.3 0.4 0.2 0.3 0.3
Latin America 3.1 3.9 4.5 5.1 3.4 3.2 2.9 3.7 3.1
– Brazil 2.0 2.5 3.0 3.0 1.6 1.2 1.0 1.4 1.5
Africa 0.2 0.1 0.2 0.2 0.1 0.1 0.1 0.1 0.1
Middle East 0.8 1.2 1.4 1.0 2.1 3.1 3.7 3.5 3.1
Asia-Pacific 14.8 14.8 12.8 10.9 17.8 19.2 21.3 18.0 18.2
– Japan 10.2 9.5 7.5 6.6 8.4 8.0 7.6 7.3 7.4
– China 0.1 0.2 0.2 0.4 1.8 2.5 .. 3.1 2.5
– Australia 2.3 2.9 2.5 2.0 1.6 1.7 1.5 1.5 1.9
Total 100.0 100.0 100.0 100.0 100.0 100.0 100.0 100.0 100.0
Total in US$ billion 12,582.0 14,039.0 14,593.0 14,664.0 18,144.0 20,457.0 19,702.0 21,063.0 22,328.0
1 FROM 1999 ONWARDS, EASTERN EUROPE ONLY INCLUDES THE CZECH REPUBLIC, HUNGARY, POLAND AND RUSSIA.
Source: OECD Science, Technology and Industry Outlook 2006

78
Any policy which sought to limit the ability of a domesticfirm to establish operations abroad would have a negativemacroeconomic impact equivalent to the effect of erectingtrade barriers… if parent companies benefit by investingabroad, then the corollary must also be true that their com-petitiveness would suffer from any attempt to discouragethose foreign activities.
For Australia, distance has limited the growth of trade,but is less a constraint on investment. Australia’s share ofworld trade and world production is around 1 per cent,but its share of world inwards FDI typically has beenseveral times larger (Figure 7). Australia’s absorptivecapacity is strong, it has strong research and innovationskills and a range of dynamic and innovative SMEs withworld-leading capabilities ready to benefit from multina-tional linkages.
Taken as a whole, both the findings of the economicliterature and Australia’s specific circumstances (geo-graphic location, industry structure, role of SMEs,technological capability) mean that for Australia inwardand outward investment by multinationals is an impor-tant mechanism for global integration.
Realising the opportunities through global integrationI think the most emphatic reason why this country has donewell and this country will continue to do well, is thatAustralians by world standards are remarkably adaptablepeople, and the capacity of Australian employers andemployees in the face of dramatically changed world cir-cumstances, facing the globalisation of the world economy,our capacity to adapt and change has been second to none.And the reason why Australian workers are sought afteraround the world, the reason why we have an enviablereputation as contributors and innovators, is that we dohave a great capacity to adapt. (Prime Minister JohnHoward, MP)17
Enterprise and adaptability by firms are required torespond to the competitive challenges facing Australianindustry. The government has a framework of industrymeasures to support firms realise opportunities throughglobal integration. While the Minister for Industry,Tourism and Resources has indicated that furthermeasures may be included in the forthcoming industrystatement, the current initiatives are already extensive,and could be made better use of by industry.
An important underlying principle is that governmentinitiatives are not a substitute for enterprise and adapt-ability by industry. An overview of the support availablefollows. Details of existing programs to strengthen globalintegration of Australian industry are provided inAppendix A.
1. Overcoming information deficiencies that result inmultinationals failing to appreciate the benefits ofinvesting in or sourcing from Australia and ofAustralian SMEs that lack knowledge of global valuechains There are several government agencies whose task is toraise awareness of Australian capabilities and addressinformation deficiencies. These include: Austrade, InvestAustralia, Geoscience Australia, Tourism Australia,Industry Capability Network Limited (ICNL), as well asmany State and Territory agencies.
Australia’s size and location also means that manyMNCs do not appreciate Australia’s potential. It is diffi-cult for an individual Australian company to remedy thisissue on its own. Industry associations have an importantrole in helping companies share marketing costs and bemore efficient users of government services such asAustrade.
There are examples where expatriate Australians inglobal headquarters with knowledge of Australianindustry capability have resulted in access by Australianfirms to global supply chains that they otherwise wouldnot have been considered as potential suppliers. Forexample, Bosch Australia’s success in becoming the globalcentre within the Bosch group for car security systems isattributed to Jac Nasser’s role as CEO of Ford Europe.
International engagement is increasingly a core successfactor for Australian firms. Government can help firmsget started and facilitate networking, but cannot substi-tute for firm investment in this activity. There is a widerange of networks that firms need to develop to be suc-cessful internationally, company links with salesdepartments are not enough. Logistics, R&D andleading customers and CEOs are also important in globalsupply chains. Most international supply links alsoinvolve investment and corporate investment analysts. E-business systems are important in many supply chainsand it is critical for firms to be informed on how to effec-tively use such systems to market to target buyers.
Industry associations have an important role to play inhelping companies share marketing costs and be moreefficient users of government services such as Austrade,Invest Australia and the ICNL. Several industries, forexample, Aerospace, Electronics and AdvancedManufacturing, have mapped Australian capability for
CEDA GROWTH 58
… for Australia, inward and outward
investment by multinationals is an
important mechanism for global
integration.
79COMPETING FROM AUSTRALIA
use in export and investment promotion. Often theawareness by local subsidiaries of MNCs of Australiancapability outside the state they are based in is weak.Industry Action Agendas can help bring AustralianSMEs closer together with foreign-owned multina-tionals. This has occurred, for example, in the medicaldevices industry where AusBiotech mainly representingAustralian-owned firms and Medical IndustryAssociation of Australia, mainly representing foreignMNCs, are both engaged.
2. Ensuring that Australian firms are in a position togain from the technology and production know-howof multinationals and access their supply chainsThere is potential for many Australian firms to effectivelybecome exporters by selling domestically to multina-tionals who then supply globally. This can be a low-costmeans for Australian SMEs to enter export markets.Governments are keen to encourage these links withMNCs as they bring national benefits through the intro-duction of new or improved products and services,provision of technology and production systems thatlower the costs of producing existing goods and services,and international market intelligence and global mar-keting channels that can open new markets for localfirms.
Qualification can be a barrier. MNCs enforceadvanced internal standards and accreditation systemsrelating to safety, quality, delivery, tendering, procure-ment, skills, labour and the environment that AustralianSMEs and their supply chains may struggle to meet.
The costs of compliance procedures to required stan-dards can be proportionally too high for small firms,particularly where these private standards set by cus-tomers are in addition to government standards.
One way that government can help is throughreducing variation between national and local standardsand international standards as recommended by theBanks Taskforce on Business Regulation. The taskforcerecommendation is being acted upon by the government,including through Council of Australian Governmentprocesses (Treasury 2006).
Initiatives such as group certification for small firms inlocal regions might also prove effective, and engagementof MNCs in certification processes. ICNL and itsnetwork18 have been active in providing advice on thecertification requirements of MNCs. Education andtraining system are also important as specific workforcecompetencies may be mandated. Australian governmentleadership of efforts to improve the responsiveness of theskills system has been welcomed by industry.
The OECD work on SME access to global valuechains has identified that while the information tech-nology has made market intelligence more available forSMEs, their limited resources and lack of managerialcapacities hamper development of opportunities inforeign markets. This also applies to the potential forSMEs to subcontract abroad part of their production inorder to improve their competitiveness. Several govern-ment agencies have been active in assisting SMEs withe-business, including ICNL and Tourism Australia.
Even where Australian SMEs have establisheddomestic supply relations with multinationals, new issuesarise in becoming a global supplier. For example, it maybe necessary to provide global technical and servicesupport. Firms may need to develop enhanced ormodified products, or bundle their product or servicewith other products or services through internationalstrategic alliances and other partnering arrangements.MNCs also use advanced contractual arrangements withtheir suppliers that adopt a shared risk and rewardapproach. Many Australian SMEs lack experience ininternational collaboration, and many multinationals arereluctant to initiate significant partnerships with inexpe-rienced companies. Alliancing initiatives have beensponsored in several Action Agendas, including theConstruction Industry Action Agenda and the HeavyEngineering Action Agenda, which has helped to spreadunderstanding of understanding of and capability inthese arrangements to SMEs.
Experience generated through the Supplier Access toMajor Projects program and the Team Australia engage-ment in the Joint Strike Fighter has shown that in somecases MNC engagement is needed for Australian suppliercapability to be certified.
The assistance given by Siemens Transportation toAustralian medium-sized firm Air International Transitprovides an example of the value of certification. Inaccordance with its Australian Industry ParticipationPlan, and supported by DITR’s Supplier Access to MajorProjects program, Siemens fast-tracked Air InternationalTransit through its supplier qualification processes(involving technology and know-how transfer). Thisenabled Air International to bid for and win the supplyof air-conditioning systems for the Victorian tramcontract. As a result of the commercial success of thatcontract, Siemens provided marketing assistance to AirInternational Transit that resulted in a $20 million
There is potential for many
Australian firms to effectively
become exporters by selling
domestically to multinationals
who then supply globally.

80
contract for air-conditioners through Siemens UK trainsupply. Air International Transit has gone on to establisha strong international reputation installing air-condi-tioning systems in some of the world’s leading railnetworks, including MTRC Hong Kong, the Las VegasMonorail, Metro Taipei, Delhi Metro Rail andSacramento Light Rail.
The measure of benefit is not the import replacementor export orders won, but improvement in productivitygained through knowledge and technology transfers, andthe economies of scale gained from access to largermarkets and supporting infrastructure.
3. Overcome impediments to supplier financingParticipation in value chains often requires substantialinvestments to acquire or develop superior productiontechnologies and logistics systems, invest in humancapital, or certify newly required standards. Moreover,suppliers normally receive incoming payments from theircustomers several weeks or even months after the deliveryof orders which can result in liquidity problems.
Exporting from Australia has primarily been under-taken by large firms, so domestic bank managers whohandle SME accounts are generally unfamiliar withexport credit financing and how to assess the creditwor-thiness of a major order from an MNC or its suppliers.Export Finance and Insurance Corporation (EFIC)’sHeadway program is an important measure to addressthis issue. Headway provides a guarantee from EFIC to abank enabling banks to lend additional funds to SMEexporters. The Global Integration Statement hasenhanced EFIC’s capacity to assist SMEs seeking tobecome global companies by extending their supply anddistribution chains overseas.
4. Protection of intellectual propertySMEs need to develop a management culture andsystems to enable them to establish effective dialoguewith supply chain principals in relation to intellectualproperty. In an analysis of the ABS Innovation survey,DITR (2006a) has found that firms that collaborated forinnovation had a much greater chance of achieving a“new-to-the-world” degree of novelty, especially in tech-nology-intensive sectors. DITR discussion withAustralian industry has found that many Australian firmsrecognise the importance of a more collaborativeapproach to innovation, but hesitate to act.19 Developingeffective partnerships requires building trust and sharinginformation. Many SMEs fear competitors may gainaccess to vital data about their business.
In new product development, protection of intellectualproperty is critical, and agreements with public researchinstitutions and international collaborators can be comp-lex. Business skills are needed to enable firms to determinewhat type of information is necessary and feasible toshare and what could provide competitive advantages.
Several Action Agendas have recognised this issue andhave sponsored industry-specific guides on the protec-tion of intellectual property. One has been completed forthe biotechnology industry and a further guide isplanned for the electronics industry. Action Agendas arealso helping industries work together on innovationprojects of common benefit such as technologyroadmaps through the support of the AusIndustryIndustry Cooperative Innovation Program.
Another AusIndustry program, the IntermediaryAccess Program pilot is supporting theInnovationXchange (IXC) and the Australian Institutefor Commercialisation (AIC) work with SMEs can act astrusted intermediaries. The Society for KnowledgeEconomics (established with the support of Westpac,Microsoft, CPA Australia, the Institute of Actuaries andthe Australian Government Information Office) ishelping form ideas on innovation.
The protection of intellectual property rights of SMEsmay also warrant international policy action, perhapsthrough OECD guidelines. The power imbalancebetween small contractors and their multinational cus-tomers can result in misappropriation of the intellectualproperty rights of SMEs. Even when the legal position isclear the SME may not be in a position to enforce itsrights. The negative impact is two-fold. In addition tothe direct damage created by sharp business practices,there may be reduced incentives for small firms toinnovate.
Weakness in enforcement of intellectual property rules,as is common in most developing and emergingeconomies, is a particular issue for SMEs as they lack thefinancial resources to ensure fair treatment. IP Australiahas been active in much of Asia in helping build thenational capabilities of many IP agencies. The AustralianGovernment has also been active in developing FTAswhich provide for bilateral government dialogue on IPissues.
5. Developing innovative suppliersAustralia’s distance from world markets means that inno-vation is a key component of firms’ internationalengagement strategies. All of IPRIA’s list of top 50 R&Dperformers are either MNCs or exporters, with mostbeing both. The evidence to date from thePharmaceutical Partnership Program is that innovationsupport is very effective in generating export growth.
Sectoral analysis in Action Agendas and the 2005report, No Simple Solutions: How Sectoral InnovationSystems can be Transformed (Scott-Kemmis et al, 2005)suggest that many of the leading Australian firms are suc-cessful technology integrators – their added value lies inunderstanding the customer’s need and coordinating thedevelopment of the product for that need, more so thanin fundamental R&D. With the rapid increase in Asiantechnical prowess within specific technologies, there has
CEDA GROWTH 58
81COMPETING FROM AUSTRALIA
been an increased appreciation of the value of the systemsintegration role and Asian interest in accessing Australiancapabilities in this arena. This is driving the electronicsindustry Action Agenda’s interest in product realisationand also in its Asia engagement strategy, for examplethrough the Strategic Framework Agreement withTaiwan. Systems integration is the key process in manytechnologies, for example, surveillance, paymentsystems, telematics and eHealth.
In a recent report, the Business Council of Australia(2006) commented that:
There needs to be a more strategic approach to emphasiseand capitalise on [the technology integration] role through acomprehensive policy focus. International engagement is anessential element of such a strategy, as systems integrators arelooking for new technologies, new applications for new tech-nologies and cost effective suppliers – where Asia is especiallyimportant.
In 2006, the Prime Minister’s Science Engineering andInnovation Council commissioned two reports on inter-national engagement, one assessing the impact of Asia(China and India) and the other more broadly examiningAustralia’s science and technology priorities for globalengagement. Because they focus on Australia’s scienceand technology, neither of these reports identifies thestrength of Australian industry in systems integration.
DITR (2006d) has raised the need for a stronger focuson the international aspects of innovation in commentson Productivity Commission’s draft research report,Public Support for Science and Innovation. In line withthese comments, the 2007 Global Integration statementmade changes to the R&D Tax Concession that enableforeign firms to claim the concession when they useAustralia as a base for global R&D. The previous policymeant that effectively foreign firms could only claim thetax concession when their Australian affiliate undertookR&D in Australia for domestic use.
Innovation is covered in a recent report on interna-tional engagement on R&D recently completed in theUK (Global Science and Innovation Forum 2006).Australia is included in the group of eight nations plusthe EU, selected for scientific cooperation, but omittedfrom the group of seven nations plus the EU selected forinnovation cooperation. The report notes that theproposed EU seventh Framework Programme (2007–13)with an average annual budget of about ?7 billion willintroduce a limited number of “Joint TechnologyInitiatives”, large-scale public-private partnerships todeliver priority research agendas essential to the compet-itiveness of European businesses. The FrameworkProgramme allows collaboration with third countriesthat are not EU or associated countries. The large public-private partnerships being supported under the seventhframework are likely to include projects of interest toAustralian systems integrators.
6. Developing an Asia strategyThe Australian Government recognises that governmenthas a special role in facilitating business in Asia.
In Asia, there are FTAs with Singapore and Thailandand discussions are progressing with Malaysia, China,Japan and Association of South-East Asian Nations(ASEAN) with New Zealand (the ASEAN-ANZ FTA).In addition, Australia is undertaking studies to assess thebenefits of pursuing an FTA with South Korea. TheseFTAs can provide improved market access for exportersand investors, particularly in addressing a range of non-tariff and administrative barriers. They are faster tonegotiate and implement than other trade deals.
Austrade has more than 40 offices throughout Asia withmore than 350 staff. In 2005–06, Austrade assisted atotal of more than 700020 clients throughout Asia. Ofthese, Austrade assisted more than 3000 with export saleswith a total value of about $9 billion. In China alone,Austrade has more than 70 specialist staff in 20 locations.
The Electronics Industry Action Agenda with assis-tance from the Australian government has supported astrategic framework agreement with Taiwan to encourageindustrial technology cooperation between Australianand Taiwan electronics industries.
The views expressed in this paper are provided for thepurpose of stimulating discussion and do not necessarily rep-resent those of any Commonwealth department.

82
Appendix: Australian Government programs tostrengthen global integration
Several new programs to strengthen global integrationof Australian industry were introduced in the $1.4billion over ten years Global Integration statement. Theseinclude:
• the new $254.1 million Global Opportunities pro-gramme, which will help Australian firms win work inglobal supply chains and major projects; and
• the $351.8 million Australian Industry ProductivityCentres, which will help firms review their businessperformance and capitalise on new market.
These build on an existing of set of programs tostrengthen global integration of Australian industry.These include:
Industry Capability Network Limited/Supplier Access toMajor Projects helps maximise opportunities forAustralian suppliers to be part of major domestic projectsand global supply chains. SAMP Global has recentlybeen established with a focus on offshore opportunities.
Export Market Development Grants assists firmsdevelop export markets. Austrade and Invest Australiaprovide market information, advice and contacts forexporters and investors.
Team Australia helps maximise Australian participationin the development of the $12 billion Joint Strike FighterProgram.
Free Trade Agreements (FTAs), including with the US,Singapore and Thailand help improve bilateral businesslinks, including on investment, regulation and transfer ofbusiness people. FTAs increase trade and investmentopportunities for Australian firms.
EFIC Headway, a guarantee from Export Finance andInsurance Corporation (EFIC) to a bank, enables banksto lend additional funds to SME exporters.
$7 billion Automotive Competitiveness and InvestmentScheme (ACIS) helps link Australian suppliers to globalmarkets, and stimulate increased R&D and exports.
Provision of geoscientific information throughGeoscience Australia, which has helped establish Australiaas a leading location for exploration.
AXISS facilitates the establishment and operation ofglobal financial services firms in Australia.
Tourism Australia helps strengthen links betweenAustralian tourism operators and the international travelvalue chain such as travel agents and airlines.
$150m Pharmaceuticals Partnerships Program stimu-lates investment in high quality pharmaceuticals researchand development.
CEDA GROWTH 58
Action Agendas foster industry leadership and industry-led strategies for growth, including via global integration.
Industry Cooperative Innovation Program providesgrants for projects that meet strategic industry sectorneeds, including for international projects.
The Intermediary Access Program supports theInnovationXchange and the Australian Institute forCommercialisation , which are intermediaries expert inlinking SMEs with both public researchers and MNCs.The Program has been extended in the Global Integrationstatement.
International Science Linkages Program supportsAustralian scientists, from both the public and privatesectors, to collaborate with international partners onleading-edge science and technology.
ENDNOTES
1 See for example, Barlow 2006.
2 See for example, Invest Australia 2006a.
3 See for example, Dolman B et al. 2007, where Australian productivity is assessed asbeing 87% that of the US; Dolman B et al. 2006; Department of Communications,Information Technology and the Arts, 2006.
4 The Productivity Commission has identified a potential 2.4 per cent improvement inGDP via continued domestic reforms. See Productivity Commission 2007.
5 Only around 4100 companies exported more than $1m in 2005-06, ABS 2006b.
6 MNCs engage in foreign direct investment, the ownership of productive assets outsidethe home country. An MNC comprises a parent company and its foreign affiliates. Anaffiliate is a business that is located in one country but is owned or controlled by aparent company located in another country. Thus, an Australian MNC comprises anAustralian parent company and its foreign affiliates; a foreign MNC is a corporationwhose parent company is located outside Australia.
7 Blundstone, a Tasmanian footwear company announced in early 2007 that it was relo-cating most of its manufacturing to India and Thailand, stimulating much debate, seefor example, Luke McIlveen, "Union ban on Blundstones", The Daily Telegraph, January17, 2007.
8 Korea, Taiwan and Hong Kong have resisted support programs for TCF industries;Australian budgetary assistance to the TCF industries over the last decade has beenaround $1.3 billion – not including the effective assistance provided by tariffs.
9 World data are not available but for example in the US, MNCs performed around 85%of the $204 billion industrial R&D in 2003, with US MNCs contributing just under 70%and affiliates of foreign MNCs the additional 15%; NSF 2006. In Australia, 43 of thetop 50 R&D performers on the ranking by Intellectual Property Research Institute ofAustralia are multinationals, including 22 foreign-owned companies and 21 AustralianMNCs.
10 Australian dollar conversion to UK sterling exchange rates ruling at 31 December2005, $2.34.
11 The value chain is a concept from business management developed in Michael Porter1985.
12 Based on official Chinese government figures.
13 The establishment of an R&D centre is often a licence condition for foreign companiesoperating in China, and subsequently a number never operate. A more realistic numberof centres is around 250-300, with most undertaking adoptive R&D for the Chinamarket. Swedish Embassy analysis as of 2005 found around 30 multinational compa-nies have up to 60 innovative/global R&D centres in China, primarily based in theBeijing and Shanghai areas. See Karlsson, 2006 p. 255.
14 Brian McNamee, CEO CSL, 1 April 2004 media release on acquisition of AventisBehring.
15 Lockheed Martin is teamed with Northrop Grumman and BAE to develop and thenproduce the Joint Strike Fighter (JSF) aircraft.
16 US$317b, exchange rate 1.31.
17 Address on the occasion of the 150th Anniversary of CSR 22 March 2005
18 Industry Capability Network Limited (ICNL) is independently managed and financially

83COMPETING FROM AUSTRALIA
supported by the Commonwealth Department of Industry, Tourism and Resources(DITR). ICNL is part of a network that has 24 offices located around Australia and a staffof around 80 technical experts across a number of major industries, from oil and gasto manufacturing and engineering.
19 The 2003 ABS Innovation Survey found that only 27% of innovating businesses inAustralia were involved in any form of collaboration or alliance, with only 6.5% of inno-vating businesses having collaborative links to universities, governments or researchinstitutions.
20 Clients who Austrade has assisted in more than one market are only counted once.
REFERENCES
Alazzawi, S. 2004, Foreign Direct Investment and Knowledge Flows: Evidence from PatentCitations, Social Science Research Network. Accessed 29/3/07 athttp://ssrn.com/abstract=483322.
Arjan Lejour, Hugo Rojas-Romagosa 2006, Foreign Direct Investment in Applied GeneralEquilibrium Models, CPB Netherlands Bureau for Economic Policy Analysis, December.
Australian Bureau of Statistics 2006a, International Investment Position, Australia:Supplementary Country Statistics, 2005, Cat. No. 5352.0.
Australian Bureau of Statistics 2006b, Number and Characteristics of AustralianExporters, Cat. No. 5368.0.55.006.
Australian Bureau of Statistics 2006c, Research and Experimental Development,Businesses, Australia, 2004–05, Cat. No. 8104.0.
Barlow, T. 2006, The Australian Miracle: An innovative nation revisited, Picador.
Battersbey, B. 2006, Does Distance Matter? The effect of geographic isolation on produc-tivity levels, Treasury Working Papers, 2006–03.
Business Council of Australia 2006, New Pathways to Prosperity: A National InnovationFramework for Australia. Accessed 29/3/07 athttp://www.bca.com.au/Content.aspx?ContentID=100942
Business Week International online extra, May 16, 2005, Stan Shih on Taiwan and China.Accessed 29/3/07 athttp://www.businessweek.com/magazine/content/05_20/b3933011.htm
CSL 2007. Accessed 30 March 2007 at http://www.csl.com.au
Dembinski Paul, 2007 forthcoming, Large and Small Enterprises in Global Value Chains:Comparing industries in Patterns of Globalisation in Five Industrial Sectors, OECD.
Department of Communications, Information Technology and the Arts, 2006, TheEconomic Impact of ICT R&D: A literature review and some Australian estimates,Occasional Economic Paper
Department of Industry, Tourism and Resources 2006a, Collaboration and Other FactorsInfluencing Innovation Novelty in Australian Businesses, Canberra.
Department of Industry, Tourism & Resources 2006b, Global Integration backgroundpaper.
Department of Industry, Tourism & Resources 2006c, Making it Globally, AdvancedManufacturing Action Agenda
Department of Industry, Tourism & Resources 2006d, Supplementary Submission to PCReview of Science and Innovation.
Department of Trade and Industry 2006, The Top 1250 Global R&D Scoreboard and theTop 800 UK R&D Scoreboard.
Dolman, B., Parham, D & Zheng, S. 2007, Can Australia Match US ProductivityPerformance? Staff Working Paper Productivity Commission March 2007.
Dolman, B., Lu, L. & Rahman, J. 2006, ‘Understanding productivity trends’, EconomicRoundup, Summer 2006, Australian Treasury, pp 35–52.
Global Science and Innovation Forum 2006, A Strategy for International Engagement inResearch and Development, October.
Günther, J. 2005, The Absence of Technology Spillovers from Foreign Direct Investment inTransition Economies in Welfens.
Henry, Ken 2006, Managing Prosperity, Address to the 2006 Economic and SocialOutlook Conference Melbourne 2 November 2006. Accessed 29/3/07 athttp://www.treasury.gov.au/documents/1183/PDF/Managing_Prosperity.pdf
Invest Australia 2006a, Australia. Your competitive edge, 2006–07 edition. AustralianGovernment. Accessed 29/3/07 athttp://www.investaustralia.gov.au/media/FLAGSHIP_finalEnglish.pdf
Invest Australia 2006b, GKN Aerospace engineers export design solutions from Australia,Australian Government. Accessed 29/3/07 athttp://www.investaustralia.gov.au/media/CS_AdvMan_GKN.pdf
IPRIA 2006, R&D and Intellectual Property Scoreboard 2006
Karlsson, M., (ed.) 2006, The Internationalization of Corporate R&D Leveraging theChanging Geography of Innovation, Swedish Institute For Growth Policy Studies, p. 11.
OECD 2007, International Policy Reforms: Going for Growth. Accessed 29/3/07 athttp://www.oecd.org/dataoecd/36/25/38088923.pdf
OECD 2006a, Draft Synthesis Report on Global Value Chains, DSTI/IND/STP/ICCP(2006)3.
OECD 2006b, International Investment Perspectives: 2006 edition, p. 116.
OECD 2006c, Science, Technology and Industry Outlook 2006, p. 42.
OECD 2005, Enhancing the role of SMEs in Global Value Chains: Australian Case Studies:Automotive, Precision Instruments and Tourism, CFE/SME(2005)16.
OECD 2003, Understanding the new configuration and management techniques of valuechains of global enterprises and the resulting consequences for independent anddependent SMEs, a proposal by the Swiss delegation, DSTI/IND/PME(2003)17
Paul J.J. & Wziatek-Kubiak, A. (eds) 2005, Structural Change and Exchange RateDynamics: The Economics of EU Eastern Enlargement.
Porter, M. 1998, On Competition, Harvard Business School Press.
Porter, M 1985, Competitive Advantage: Creating and Sustaining Superior Performance,Free Press, New York.
Productivity Commission 2007, Potential Benefits of the National Reform Agenda.
Rojas-Romagosa, H. 2006, CPB Netherlands Bureau for Economic Policy Analysis:Productivity Effects of FDI Inflows: A Literature Review, 12 December.
Rowe, T. 2006, “Investment in Asia”, Asia Society Australasia Centre, CEO Asia updateluncheon Sydney 14 February.
Sasidharan, S. 2006, Foreign Direct Investment and Technology Spillovers: Evidence fromthe Indian Manufacturing Sector, United Nations University Working Paper series 2006-010.
Scott-Kemmis, D., Holmen, M., Balaguer, A., Dalitz, R., Bryant, K., Jones, A. & Matthews,J. 2005, No Simple Solutions: How Sectoral Innovation Systems Can Be Transformed,ANU, Canberra.
Treasury 2006, Report of the Taskforce on Reducing Regulatory Burdens on Business –Final Government Response, Australian Government.
UNCTAD 2006, World Investment Report.

84
IntroductionIn recent years, Australia’s industry and technologypolicy debate has been influenced by the core ideas oftwo major analytical approaches – clusters and innova-tion systems – and, to a lesser extent, complex productsystems. Most cluster analysis has a strong geographicdimension, and a focus on national innovation systemshas predominated over the discussion of sectoral or tech-nology-based innovation systems (Carlsson 2005).Recent globalisation trends may call into question thisgeographic focus and encourage policy makers to paygreater attention to more geographically diffusenetworks, innovation and production systems.
ClustersClusters can be thought of as occurring at the overlap oflocations and networks (Figure 1). Rosenfield (1995)defined a business cluster as “a geographically boundedconcentration of similar, related or complementary busi-nesses, with active channels for business transactions,communication and dialogue, that share specialisedinfrastructure, labour markets and services, and that arefaced with common opportunities and threats.”
CEDA GROWTH 58
chainsAustralia’s challenge in the
evolving world economy
chainsglobal
PROFESSOR JOHN HOUGHTON
is currently Professorial Fellow at
Victoria University's Centre for
Strategic Economic Studies (CSES)
and Director of the Centre's
Information Technologies and the
Information Economy Program. He is a regular consultant to the
Organization for Economic Cooperation and Development (OECD)
in Paris. He has previously been a Senior Research Fellow at the
Centre for International Research on Communication and
Information Technologies (CIRCIT), Principal Economist at the
Bureau of Industry Economics (BIE) and Adviser on Information
Industries Policy at the Australian Commonwealth Department of
Industry, Science and Tourism (DIST).
10

85COMPETING FROM AUSTRALIA
Perhaps the most widely known cluster studies are the“Porter Studies” undertaken during the late 1980s andearly 1990s, and reported in The Competitive Advantageof Nations (Porter 1990). However, as DeBresson and Hu(1999) noted, these were by no means the first of suchstudies. As early as the 1890s, Alfred Marshall com-
mented on the development of “industrial districts”, andSchumpeter noted the importance of “innovativeclusters” in 1912. However, it was probably the work ofDahmen on “development blocks”, and Perroux and laterHirschman during the 1950s and 1960s on “growthpoles”, that first fully developed the idea of clustersof economic development. The common take-off pointfor these early works, as well as those constituting thePorter studies, was the observation that economic devel-opment is unevenly distributed and often concentratedin particular locations.
Subsequent work on cluster development at thenational level was brought into focus by the Organisationfor Economic Cooperation and Development (OECD),which, under the auspices of the National Systems ofInnovation Project, established a focus group on ClusterAnalysis and Cluster-based Policy. The OECD groupfocused more directly upon innovation, and in so doingsuggested a convergence of cluster and innovation systemsanalysis (OECD 1999). Indicative of this shift, Roelandtand den Hertog (1998) suggested that clusters could becharacterised as “networks of production involving inter-dependent firms (including specialised suppliers),knowledge producing agents (e.g. universities, researchinstitutes, engineering companies, etc.), bridging institu-tions (e.g. brokers, consultants, etc.) and customers,linked to each other in a value adding production system.”
CLUSTERS NETWORKSLOCATIONS(AGGLOMERATION)
FIGURE 1 AGGLOMERATIONS, NETWORKS AND CLUSTERS
Source: Author’s analysis
PHOTO: iSTOCK

86
Regional clusters are the main focus for regionalpolicy-makers and have been very widely discussed, withperhaps the best known example being Silicon Valley(e.g. Saxenian 1994). Analysts often focus on core factorsunderlying the regional clustering, be it natural resources(e.g. the Rhur), knowledge infrastructure (e.g. StanfordUniversity), location (e.g. Hong Kong), or a central firm(e.g. Nokia in Finland or Philips in the Netherlands).Value chains have also been a popular focus of clusterstudies in the form of chains of production, valuesystems, and complex product systems (Piore and Sabel1984; Porter 1985; Kaplinsky and Morris 2003; Hobdayet al. 2000).
There are several ways of distinguishing betweenclusters. One distinction is between those studies using“cluster” in a statistical sense (ie a grouping of entitiesaccording to some specific characteristic), and thoseintending to imply actual relationships between theobjects (i.e. networks, alliances, etc.). Overlaying this isthe basic distinction between studies having a geographicdimension and those without, which Spielkamp andVopel (1999) described as the distinction between“milieux or districts” and “clusters, chains or networks”.Hence, at the analytical level, if not the policy level, therehas been considerable blurring of the distinction betweenagglomerations, clusters and networks, and an increasingfocus on innovation and production systems.
Clusters and globalisationPorter (1998, p90) suggested that “in a global economy– which boasts rapid transportation, high-speed commu-nication, and accessible markets – one would expectlocation to diminish in importance. But the opposite istrue. The enduring competitive advantages in a globaleconomy are often heavily local, arising from concentra-tions of highly specialised skills and knowledge,institutions, rivals, related businesses, and sophisticatedcustomers. Geographic, cultural, and institutional prox-imity leads to special access, closer relationships, betterinformation, powerful incentives, and other advantagesin productivity and innovation that are difficult to tapfrom a distance. The more the world economy becomescomplex, knowledge based and dynamic, the more thisis true.” However, as information and communicationtechnologies develop, geographic proximity may bebecoming less important – replaced perhaps by a “geog-raphy” of bandwidth and latency wherein it matters nothow far we are apart, but how many megabits per secondseparate us.
In a knowledge economy, few firms can alonecommand the range and depth of competencies neces-sary to continuously innovate. As a result, they arebecoming more dependent upon alliances with otherfirms and research institutions with complementarytechnology and knowledge assets. Hence, leading firmsare becoming increasingly involved in a network of rela-tionships – which Dunning referred to as “alliance
capitalism”. At the same time, the increasing complexityof products and the increasing drive to offer differenti-ated, service-enhanced products is forcing firms tointegrate supply chains and changing the nature of com-petition in such a way as to encourage greatercooperation and collaboration. There is, in short,mounting pressure for firms to link into increasinglycomplex value chains or production systems. As a result,what is perhaps in question is the geographic focus of thecluster perspective vis-à-vis networks, innovation systemsor production systems.
Recent trends in globalisationIn an introduction to globalisation, the Organisationfor Economic Cooperation and Development (OECD)recently noted that:
The globalisation of trade in goods and services is openingup new and increasingly large markets. The globalisation offinancial markets has triggered sharp growth in investmentportfolios and large movements of short-term capital, withborrowers and investors interacting through an ever moreunified market. The globalisation of competition heralds theemergence of new strategic considerations for enterprises. Theglobalisation of technology stems from the speed with whichinnovations are propagated, with international networkslinking to public and private research centres, as well asfrom converging standards. The globalisation of corporationsand industries was led by sharp increases in foreign directinvestment and relocation of enterprises, driven by jointventures, co-operation agreements, strategic alliances andmergers and acquisitions. One consequence of these changesis the fragmentation of production processes, with differentstages of production carried out in different countries…Thanks to ICTs, firms are organising themselves intotransnational networks in response to intense internationalcompetition and the increasing need for strategic interactionsGlobalisation is a multidimensional process, involving trade
CEDA GROWTH 58
0
2
4
6
8
10
12
ProductionTrade
1990-041973-901963-731950-63
FIGURE 2 WORLD MANUFACTURES TRADE AND PRODUCTION,1950–2004 (AVERAGE ANNUAL PERCENTAGE CHANGE INVOLUME TERMS)
Source: WTO
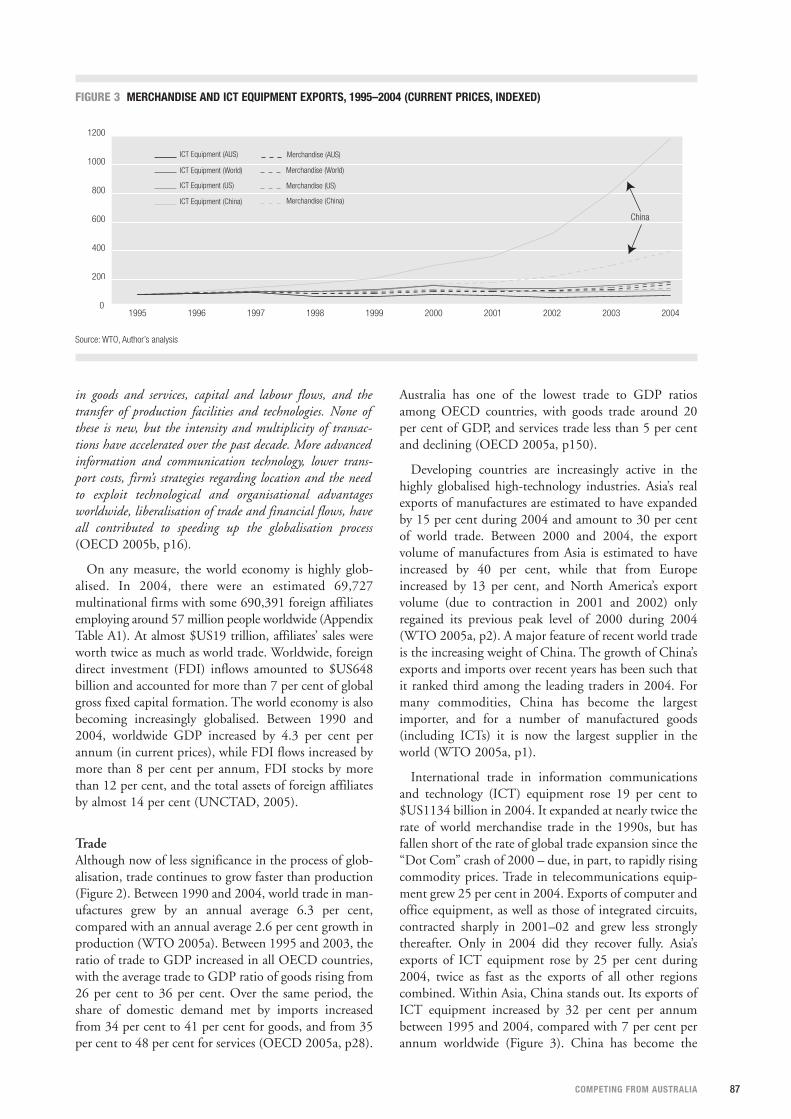
87COMPETING FROM AUSTRALIA
in goods and services, capital and labour flows, and thetransfer of production facilities and technologies. None ofthese is new, but the intensity and multiplicity of transac-tions have accelerated over the past decade. More advancedinformation and communication technology, lower trans-port costs, firm’s strategies regarding location and the needto exploit technological and organisational advantagesworldwide, liberalisation of trade and financial flows, haveall contributed to speeding up the globalisation process(OECD 2005b, p16).
On any measure, the world economy is highly glob-alised. In 2004, there were an estimated 69,727multinational firms with some 690,391 foreign affiliatesemploying around 57 million people worldwide (AppendixTable A1). At almost $US19 trillion, affiliates’ sales wereworth twice as much as world trade. Worldwide, foreigndirect investment (FDI) inflows amounted to $US648billion and accounted for more than 7 per cent of globalgross fixed capital formation. The world economy is alsobecoming increasingly globalised. Between 1990 and2004, worldwide GDP increased by 4.3 per cent perannum (in current prices), while FDI flows increased bymore than 8 per cent per annum, FDI stocks by morethan 12 per cent, and the total assets of foreign affiliatesby almost 14 per cent (UNCTAD, 2005).
TradeAlthough now of less significance in the process of glob-alisation, trade continues to grow faster than production(Figure 2). Between 1990 and 2004, world trade in man-ufactures grew by an annual average 6.3 per cent,compared with an annual average 2.6 per cent growth inproduction (WTO 2005a). Between 1995 and 2003, theratio of trade to GDP increased in all OECD countries,with the average trade to GDP ratio of goods rising from26 per cent to 36 per cent. Over the same period, theshare of domestic demand met by imports increasedfrom 34 per cent to 41 per cent for goods, and from 35per cent to 48 per cent for services (OECD 2005a, p28).
Australia has one of the lowest trade to GDP ratiosamong OECD countries, with goods trade around 20per cent of GDP, and services trade less than 5 per centand declining (OECD 2005a, p150).
Developing countries are increasingly active in thehighly globalised high-technology industries. Asia’s realexports of manufactures are estimated to have expandedby 15 per cent during 2004 and amount to 30 per centof world trade. Between 2000 and 2004, the exportvolume of manufactures from Asia is estimated to haveincreased by 40 per cent, while that from Europeincreased by 13 per cent, and North America’s exportvolume (due to contraction in 2001 and 2002) onlyregained its previous peak level of 2000 during 2004(WTO 2005a, p2). A major feature of recent world tradeis the increasing weight of China. The growth of China’sexports and imports over recent years has been such thatit ranked third among the leading traders in 2004. Formany commodities, China has become the largestimporter, and for a number of manufactured goods(including ICTs) it is now the largest supplier in theworld (WTO 2005a, p1).
International trade in information communicationsand technology (ICT) equipment rose 19 per cent to$US1134 billion in 2004. It expanded at nearly twice therate of world merchandise trade in the 1990s, but hasfallen short of the rate of global trade expansion since the“Dot Com” crash of 2000 – due, in part, to rapidly risingcommodity prices. Trade in telecommunications equip-ment grew 25 per cent in 2004. Exports of computer andoffice equipment, as well as those of integrated circuits,contracted sharply in 2001–02 and grew less stronglythereafter. Only in 2004 did they recover fully. Asia’sexports of ICT equipment rose by 25 per cent during2004, twice as fast as the exports of all other regionscombined. Within Asia, China stands out. Its exports ofICT equipment increased by 32 per cent per annumbetween 1995 and 2004, compared with 7 per cent perannum worldwide (Figure 3). China has become the
0
200
400
600
800
1000
1200
ICT Equipment (AUS)
ICT Equipment (World)
ICT Equipment (US)
ICT Equipment (China)
Merchandise (AUS)
Merchandise (World)
Merchandise (US)
Merchandise (China)
2004200320022001200019991998199719961995
China
FIGURE 3 MERCHANDISE AND ICT EQUIPMENT EXPORTS, 1995–2004 (CURRENT PRICES, INDEXED)
Source: WTO, Author’s analysis

88
world’s largest importer of integrated circuits, and itsexports of computer and office equipment now exceedthe combined exports of the United States and Japan(WTO 2005a, p5). What is notable is the contrastingperformance of China and other “new” suppliers, andthat of traditional suppliers like the United States in thepost-“Dot Com” recovery (Figure 3). The recoveryfeatures a marked restructuring and a new wave of glob-alisation of ICT production.
This restructuring has also effected services. Worldservices exports grew 9 per cent per annum between2000 and 2004, with commercial services (excludinggovernment, transport and travel) growing by 11 percent per annum. In contrast to the deceleration of exportgrowth in North America and Europe, Asia’s exports ofother commercial services (including a range of IT andIT-enabled business services) recorded growth of almost25 per cent. India emerged as Asia’s second largestexporter of other commercial services in 2004, ahead ofChina and Hong Kong. India ranked 9th among theworld’s leading exporters of commercial services in 2004,Hong Kong ranked 11th and China 15th. As importers,China ranked 11th and India 14th (WTO 2005a). Indiaand China are also among those countries growing theirIT and IT-enabled services exports most rapidly –although India was affected by the “Dot Com” downturnover the 2000–03 period (Figure 4). They are among anumber of developing countries experiencing rapidgrowth in exports of ICT and related IT-enabled businessservices (van Welsum and Rief 2006).
Intra-industry and intra-firm tradeIn addition to the increasing intensity of trade, a keyrecent feature has been the development of internationalsourcing (ie international purchasing of intermediateproduct and service inputs) both within firms andbetween firms in the same industry (ie intra-firm andintra-industry trade). These forms of trade reflect theglobal reach of multinational firms, the fragmentation ofvalue chains, and the rationalisation of production on aglobal basis.
The relative level of a country’s intra-industry tradereflects a number of factors, including the industrialstructure of the economy, traditional and emergingeconomic linkages, and the level of participation inglobal production systems. Across OECD countries,intra-industry trade accounted for almost 70 per cent oftotal manufacturing trade between 1996 and 2003. At anaverage of 46 per cent, Australia’s intra-industry trade isamong the lowest in the OECD (Figure 5). It compareswith the United States’ 74 per cent and UnitedKingdom’s 85 per cent (OECD 2005a, p177).
In 2004, intra-firm trade accounted for 42 per cent oftotal US merchandise trade – 48 per cent of imports and31 per cent of exports (Department of Commerce 2005).Reflecting a high level of globalisation, intra-firm trade isa particular feature of the ICT manufacturing industries.
In 2004, it accounted for more than 68 per cent of USICT goods imports and 34 per cent of exports, whileICT goods alone accounted for 21.5 per cent of USrelated party imports and 12.5 per cent of related partyexports.
Intra-firm trade is also increasingly important inservices. In 2003, affiliated trade accounted for 29 percent of US cross-border exports of services and 23 percent of cross-border imports – compared with 16 percent and 22 per cent, respectively, in 1997. Again, theICT sector appears to be highly globalised, with affiliatedtrade accounting for 28 per cent of US cross-borderexports and 63 per cent of cross-border imports ofcomputer and information services – compared with 31per cent and 50 per cent, respectively, in 1997 (Borgaand Mann, 2004). The emergence of “offshoring” maybe one factor accounting for the relatively high andgrowing share of affiliated imports of computer andinformation services, reflecting, in part, the extent ofcaptive (i.e. in-house) offshoring of such services by USparent firms (WTO 2005b).
The large and growing proportion of trade that iswithin industries reflects increasing specialisation andoutsourcing along the value chain, while that within
CEDA GROWTH 58
0 10 20 30 40 50
India
Slovakia
Australia
France
Portugal
Greece
Cyprus
Spain
Germany
Netherlands
United Kingdom
Poland
Korea
Sweden
Argentina
Chile
Hungary
Croatia
Finland
Romania
Russian Federation
Hong Kong
Ireland
China
Luxembourg 51
FIGURE 4 ANNUAL GROWTH OF COMBINED IT AND IT-ENABLED SERVICES EXPORTS, 2000–2003 (PER CENT)
NOTE: INCLUDES THOSE COUNTRIES EXPORTING MORE THAN $US500M IN COMBINED IT AND IT-
ENABLED BUSINESS SERVICES DURING 2003 AND RECORDING AVERAGE GROWTH OF 10 PER CENT
OR MORE BETWEEN 2000 AND 2003, RANKED BY AVERAGE ANNUAL GROWTH RATE.
Source: UNCTAD, Author’s analysis
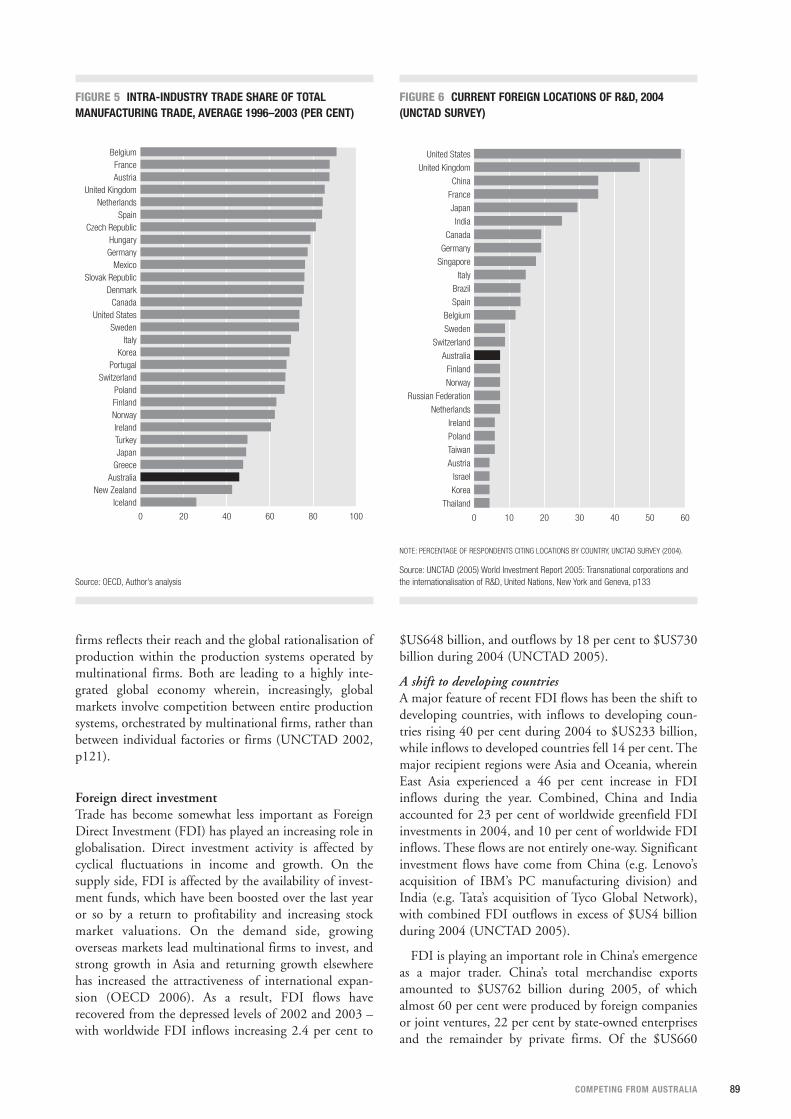
89COMPETING FROM AUSTRALIA
firms reflects their reach and the global rationalisation ofproduction within the production systems operated bymultinational firms. Both are leading to a highly inte-grated global economy wherein, increasingly, globalmarkets involve competition between entire productionsystems, orchestrated by multinational firms, rather thanbetween individual factories or firms (UNCTAD 2002,p121).
Foreign direct investmentTrade has become somewhat less important as ForeignDirect Investment (FDI) has played an increasing role inglobalisation. Direct investment activity is affected bycyclical fluctuations in income and growth. On thesupply side, FDI is affected by the availability of invest-ment funds, which have been boosted over the last yearor so by a return to profitability and increasing stockmarket valuations. On the demand side, growingoverseas markets lead multinational firms to invest, andstrong growth in Asia and returning growth elsewherehas increased the attractiveness of international expan-sion (OECD 2006). As a result, FDI flows haverecovered from the depressed levels of 2002 and 2003 –with worldwide FDI inflows increasing 2.4 per cent to
$US648 billion, and outflows by 18 per cent to $US730billion during 2004 (UNCTAD 2005).
A shift to developing countriesA major feature of recent FDI flows has been the shift todeveloping countries, with inflows to developing coun-tries rising 40 per cent during 2004 to $US233 billion,while inflows to developed countries fell 14 per cent. Themajor recipient regions were Asia and Oceania, whereinEast Asia experienced a 46 per cent increase in FDIinflows during the year. Combined, China and Indiaaccounted for 23 per cent of worldwide greenfield FDIinvestments in 2004, and 10 per cent of worldwide FDIinflows. These flows are not entirely one-way. Significantinvestment flows have come from China (e.g. Lenovo’sacquisition of IBM’s PC manufacturing division) andIndia (e.g. Tata’s acquisition of Tyco Global Network),with combined FDI outflows in excess of $US4 billionduring 2004 (UNCTAD 2005).
FDI is playing an important role in China’s emergenceas a major trader. China’s total merchandise exportsamounted to $US762 billion during 2005, of whichalmost 60 per cent were produced by foreign companiesor joint ventures, 22 per cent by state-owned enterprisesand the remainder by private firms. Of the $US660
0 20 40 60 80 100
IcelandNew Zealand
AustraliaGreeceJapanTurkeyIreland
NorwayFinlandPoland
SwitzerlandPortugal
KoreaItaly
SwedenUnited States
CanadaDenmark
Slovak RepublicMexico
GermanyHungary
Czech RepublicSpain
NetherlandsUnited Kingdom
AustriaFrance
Belgium
FIGURE 5 INTRA-INDUSTRY TRADE SHARE OF TOTAL MANUFACTURING TRADE, AVERAGE 1996–2003 (PER CENT)
Source: OECD, Author’s analysis
0 10 20 30 40 50 60
Thailand
Korea
Israel
Austria
Taiwan
Poland
Ireland
Netherlands
Russian Federation
Norway
Finland
Australia
Switzerland
Sweden
Belgium
Spain
Brazil
Italy
Singapore
Germany
Canada
India
Japan
France
China
United Kingdom
United States
FIGURE 6 CURRENT FOREIGN LOCATIONS OF R&D, 2004(UNCTAD SURVEY)
NOTE: PERCENTAGE OF RESPONDENTS CITING LOCATIONS BY COUNTRY, UNCTAD SURVEY (2004).
Source: UNCTAD (2005) World Investment Report 2005: Transnational corporations andthe internationalisation of R&D, United Nations, New York and Geneva, p133

90
billion of goods imported into China during 2005,almost 59 per cent were imported by foreign investedcompanies, 30 per cent by state-owned enterprises and11 per cent by local private firms (Ryan 2006).
Moving up from simple assembly, there has been a sig-nificant increase in FDI into semiconductormanufacturing in China (UNCTAD 2005). As a result,China plays an increasingly important role as a marketfor semiconductor manufacturing equipment –accounting for more than 30 per cent of European semi-conductor capital equipment manufacturers’ sales during2004 (The Information Network 2005). The USSemiconductor Industry Association recently noted,“there is no question that a major migration of chip man-ufacturing activities toward Asia is under way. More thantwo-thirds of all the state-of-the-art chip making facilitiesnow under construction are being built in Asia” (SIA2005). These investments are attracted by both costadvantages and market growth. Asia is now the leadingmarket for semiconductors, accounting for almost 45 percent of worldwide sales in 2005 (WSTS 2005).
A shift to servicesThe other significant trend in FDI is a shift of focus frommanufacturing towards services – including telecommu-nications, computer and information services, a range ofIT-enabled business process services, and R&D, tech-nical testing and design services with a strong emphasison ICT (e.g. mobile communications related R&D and“chip” design). Over the period 2001 through 2003, FDIflows to services were 2.8 times greater than those tomanufacturing, and services accounted for more than 60per cent of all cross-border M&As during the 1990s(UNCTAD 2004). In 1990, business services accountedfor just 7 per cent of inward FDI stock in developingeconomies. By 2002, their share had risen to 38 per cent(UNCTAD 2004, p100).
During 2002–03, there were an estimated 632 export-oriented FDI projects in IT services worldwide, with afurther 513 call centre projects, and 139 projects relatingto shared services centres. The number of IT servicesprojects in developing countries more than doubledduring 2003. Asia dominated among developing regions,accounting for 265 or 42 per cent of the IT servicesprojects – with India alone accounting for 18 or 19 percent of the worldwide total. More than half the 513 FDIprojects in call centres went to developed countries.Nevertheless, Asia accounted for 33 per cent of the callcentre projects, and 47 per cent of the shared servicescentre projects. Almost all (98 per cent) of the IT servicesprojects were within the IT services and softwareindustry (UNCTAD 2004), suggesting that they werefocused on the rationalisation of IT and IT-enabledservices production (OECD 2006).
A focus on R&DThe growth of international investment in R&D hasbeen particularly notable. Between 1995 and 2001, the
growth of foreign affiliate R&D in manufacturing inOECD countries was more than twice that of total R&Dexpenditure. Multinational firms are key players. A con-servative estimate is that they account for close to half ofglobal R&D expenditures, and at least two-thirds ofbusiness R&D expenditures (estimated at $US450billion). Between 1993 and 2002, the R&D expenditureof foreign affiliates worldwide rose from an estimated$US30 billion to $US67 billion (or from 10 per cent to16 per cent of global business R&D). The rise was rela-tively modest in developed host countries but quitesignificant in developing countries – with the share offoreign affiliates in business R&D in the developingworld increasing from 2 per cent to 18 per cent between1996 and 2002 (UNCTAD 2005).
The share of R&D undertaken by foreign affiliatesvaries considerably from country to country. In 2003,foreign affiliates accounted for more than 50 per cent ofall business R&D in Ireland, Hungary and Singapore,and about 40 per cent in Australia, Brazil, the CzechRepublic, Sweden and the United Kingdom (UNCTAD2005; OECD 2005b). Of the worldwide 1,773 green-field FDI projects involving R&D during 2002–04, themajority (1,095) were undertaken in developing coun-tries or Eastern Europe. Asia and Oceania aloneaccounted for half the worldwide total (861), of which723 were in China and India. Again, ICTs are central. In2002, three-quarters of the R&D expenditure of USmajority-owned foreign affiliates in developing Asia wasrelated to computers and electronic products, while inIndia more than three-quarters of their R&D expendi-ture went into services (notably software development).“From practically nothing in the mid-1990s, the contri-bution of South-East Asia and East Asia to globalsemiconductor design reached almost 30 per cent in2002” (UNCTAD 2005).
What is perhaps most significant about these recentdevelopments is a shift from FDI targeting market accessto FDI in IT and a range of IT-enabled business servicesthat is clearly “efficiency-seeking”. This is leading to anew international division of labour and a global ratio-nalisation of services production similar to that seen inhigh-technology manufacturing, with developing coun-tries playing an increasing role.
Competing from here?On many of the indicators of globalisation, Australia
scores relatively low (i.e. is less globalised and less inte-grated into global production systems than most otherOECD countries). One obvious question is whether thisis affecting Australia’s economic performance.
Export market shares are affected by a number offactors, including relative domestic and internationalgrowth rates, exchange rate fluctuations and changingeconomic structure. Nevertheless, export market sharesare often taken to be a shorthand indicator of firm com-
CEDA GROWTH 58

91COMPETING FROM AUSTRALIA
petitiveness. Australia’s export market shares in bothgoods and services declined between 1995 and 2003 byaround 5.2 per cent (OECD 2005b). Perhaps surpris-ingly, Australia’s share of services markets has declinedmore than its share of goods markets – by 13 per centcompared to 3 per cent (Figures 7 and 8).
A new wave of globalisation?Recent discussion of world development trends has high-lighted key elements of a new wave of globalisation,namely the emergence of international productionsystems, a shift towards services in trade, FDI and M&Aactivities, and the internationalisation of R&D and otherknowledge intensive services (UNCTAD 2002; 2004;2005). Each has potentially profound implications forAustralia.
International production systemsMultinational firms have located different parts of theirproduction processes around the world to take advantageof sometimes quite small differences in costs, resourceavailability, logistics and market access for many years.What is distinctive about the recent rise of internationalproduction systems is the intensity of integration on aglobal scale and the emphasis on the efficiency of the
system as a whole (Kaplinsky 2000). Global marketsincreasingly involve competition between entire produc-tion systems, orchestrated by multinational firms, ratherthan competition between individual factories or firms(UNCTAD 2002, p121).
A major feature of the development of global produc-tion systems is the trend towards outsourcing, withincreasing specialisation and fragmentation of the globalvalue chain in both functional and locational terms.Leading firms are increasingly focusing on specific coreactivities (e.g. research, design, branding, marketing, etc.)and shedding the other value chain activities to affiliates,alliance partners and contract suppliers. Whereas originalequipment manufacturers used to draw on contract man-ufacturers for additional and more flexible productioncapacity at the margin, it is now increasingly common tooutsource entire functions (e.g. Cisco Systems)(UNCTAD 2002, p123). This trend has a number ofimplications.
First, many aspects of “innovation” are driven by thesystem’s leading multinational firm (e.g. product defini-tion, setting and enforcing technical and qualitystandards, etc.) and imposed on other participants upand down the value chain as a condition of participation.At the periphery, this can have the effect of divorcing
-40 -20 0 20 40 60 80
PolandFinland
Czech RepublicFranceJapan
ItalyMexicoTurkey
SwitzerlandAustralia
AustriaSlovak Republic
United StatesNetherlands
KoreaNew Zealand
PortugalGermanyHungaryNorwayCanada
United KingdomSpain
SwedenBelgium-Luxembourg
IcelandDenmark
GreeceIreland 403.2
FIGURE 8 TRENDS IN EXPORT MARKET SHARES: SERVICES,1995–2003 (PER CENT)
Source: OECD, Author’s analysis
-40 -20 0 20 40 60 80 100 120
JapanSwitzerland
New ZealandUnited States
ItalyUnited Kingdom
SwedenNetherlands
FinlandDenmark
FranceIceland
AustraliaBelgium-Luxembourg
PortugalGermany
CanadaAustriaKorea
NorwaySpain
IrelandMexicoGreece
Czech RepublicTurkeyPoland
Slovak RepublicHungary
FIGURE 7 TRENDS IN EXPORT MARKET SHARES: GOODS,1995–2003 (PER CENT)
Source: OECD, Author’s analysis

92
local firms from local innovation systems, reducing localdemand for local innovation and limiting commercialisa-tion pathways. It has been suggested that the majorinnovation policy challenge is the lack of demand forinnovation (Howells 2006, p26).
Second, the organisation and distribution of activitiesthroughout the global value chain becomes central. Valuechains are becoming fragmented as functions are differ-entiated and activities become more specialised. At theperiphery, this can create a number of challenges, such as
adopting mechanisms for participation in global produc-tions systems (e.g. e-commerce, supply chainmanagement and e-business solutions), the capacity forscale in specialisation (e.g. large demand for niche skills,niche financing, etc.), and so forth.
Third, the increasing coordination of the global pro-duction system and the integration of elements intosolutions may pose particular challenges for some partic-ipants. For example, a postponement, just-in-time orbuild-to-order delivery system (e.g. Dell Computers)
CEDA GROWTH 58
Important factors influencing the amenability of services
to online delivery include: the significance of the role of
information exchange in the service concerned; the level of
standardisation; the complexity of the tasks involved; the
nature of the knowledge involved; the nature of the
“problem” addressed by the service; and the context of
delivery.
The level of standardisation of processes is an important
determinant. Services that can be standardised and deliv-
ered in online form (e.g. research reports, statistical updates,
images, etc.) and services that can be standardised and
ordered via the internet (e.g. courier delivery services,
advertising space, airline tickets, etc.) are most amenable to
online delivery. Those that resist standardisation tend to be
less amenable.
The complexity of the tasks involved is one of the factors
retarding standardisation and online delivery. Morris (2000)
pointed out that many have underestimated the complexity
of the work environment, and noted two related concepts
that shed light on these complexities: articulation and emer-
gence. Articulation is the way in which people arrange and
co-ordinate activities to mesh with colleagues. Emergence
refers to actions that are often difficult to articulate too far in
advance. Complexity makes remote delivery more difficult,
although bandwidth increases enable greater richness of
interaction and can support remote delivery of more
complex services.
The nature of the knowledge involved also affects the
amenability of services to online delivery. It is common to
make the distinction between codified and tacit knowledge.
Codified knowledge is knowledge that can be written down
and readily transmitted from one person to another (e.g.
standard operating procedures, policy manuals, legislation,
taxation formulae, etc.). Tacit knowledge tends to resist cod-
ification and remain a part of the knowledge and skills of
individuals – it is more fluid and interpretive. Knowledge that
can be codified is more amenable to online delivery than
tacit knowledge. The transmission of tacit knowledge often
requires face-to-face interaction in the negotiation of
meaning and in learning. This makes online delivery more
difficult. Again, however, high bandwidth networks can
enhance the richness of mediated communications and
enable the online delivery of more knowledge-intensive
services.
The nature of the problem involved also affects amenability
to online delivery. Rittel and Webber (1973) noted that there
are major differences between different kinds of problems
and hence strategies to solve them. A “tame” problem can
be expressed independently of its solution. In engineering,
for example, one can specify what needs to be designed
independent of any particular design solution. In contrast, a
“wicked” problem cannot be explained without its solution.
In working out a solution one understands the problem more
clearly and can redefine it if necessary, which in turn leads
to a better solution, and so on. Tame problems are easier to
distribute in space and time, because they can be more
accurately specified, and worked on independently, drawing
on codified knowledge bases.
The context of delivery also affects amenability. In high
context work, significant (informal) interaction is needed
between co-workers to get the job done, whereas in a low
context activity workers can proceed relatively independ-
ently. High context work tends to require a high degree of
awareness of co-workers and of clients. Low context work is
more amenable to online delivery than high context work.
BOX 1AMENABILITY OF SERVICES TO ONLINE DELIVERY
Source: Houghton, J.W. (2003) Online Delivery of Business Services, OECD, Paris Available http://www.oecd.org/dataoecd/40/5/31818723.pdf
93COMPETING FROM AUSTRALIA
may make participation from a distance increasingly dif-ficult, simply because of transport time and costs, timezone differences, etc., and may favour alternative sup-pliers closer to major growth markets.
Fourth, these issues of integration and coordinationinteract with the locational diversity to create additionaladjustment and coordination challenges. For example, afirm might suddenly go from a position of supplier to amajor US or European multinational, with activitiesoriented to the multinational firm’s core competenciesand home market, to one in which it is a supplier to adeveloping Asian-based intermediary contractor. As aresult, expanding business may mean fundamentally re-assessing comparative advantages in the face of rapidlychanging circumstances. What a firm’s advantage isrelative to a German electronics conglomerate may bevery different to its relative advantage vis-à-vis a Chinesecontract manufacturer, but it may need to re-define andre-articulate that advantage almost overnight. Moreover,for Australia, it is often the very things we have competedon (e.g. lower cost, high skills relative to the UnitedStates and Europe) that we are increasingly competingagainst. The rapid shift of relatively high end manufac-turing and services to Asia brings an urgent need formany Australian firms, and governments, to re-defineand re-articulate their competitive and comparativeadvantages.
The shift towards servicesThe shift in trade and investment towards services isdriven by a number of factors, including the increasedweight of services in the world economy, the liberalisa-tion of services sectors (e.g. banking and finance,infrastructure, transport, etc.), the privatisation of state-owned utilities, the globalisation of services providers onthe coat-tails of their major clients, increasing competi-tion, and the drive for growth through expansion intointernational markets. However, a major factor in therecent globalisation of IT and IT-enabled businessservices has been the development of information andcommunication technologies (ICTs) and globalnetworks.
The use of ICT allows “knowledge to be codified, stan-dardised and digitised, which in turn allows theproduction of more services to be split up into smallercomponents that can be located elsewhere to take advan-tage of cost, quality, economies of scale or other factors.This makes it possible to produce certain services in onelocation and consume them (or use them in further pro-duction) in another – either simultaneously (e.g.information provided via call centres) or at a differenttime (e.g. data entry or software development). Suchfragmentation exceeds that in manufacturing, as the newtechnologies do not just make services transportable,they also often simplify the tasks involved and so allowthem to be relocated more easily. Thus, progress in ICThas solved the technical problem of non-transportability
and, for many services, that of non-storability”(UNCTAD 2004, p149).
UNCTAD (2004) suggested that offshoring representsnothing less than “a revolution in the tradability ofservices”. That “tradability revolution” is already visiblein the balance-of-payments data of some countries (vanWelsum 2004; Borga and Mann 2003). For example, theUnited States has reported the largest increases in servicesimports over recent years, with its share of global importsrising from 11 per cent in 1992 to 13 per cent in 2002(WTO 2004). The largest increases in the export marketshare of other business services and computer and infor-mation services are reported by the United States, India,Ireland, the United Kingdom, Sweden, Spain, China andIsrael, in that order (van Welsum 2004; UNCTAD2004, p149).
“The tradability revolution has fundamentally changedthe environment for doing business and opened com-pletely new opportunities for restructuring theproduction of corporate service functions across borders.This new international division of labour has the poten-tial for producing considerable welfare gains for theworld economy as a whole – possibly, in the longer-term,even more considerable than in the case of manufac-turing activities.” (UNCTAD 2004, p177) What we areseeing is a new wave of globalisation, based around ITand IT-enabled services, that could be even more signifi-cant than the globalisation of manufacturing. Theimplications are profound.
Globalised service activities depend upon local educa-tion and skills, cultural affinity and language skills,timezone, regulatory and business affinity in relation tosuch things as privacy and data security, recognition ofprofessional qualifications, industry standards andbusiness quality accreditation. Nevertheless, they can bevery footloose. Offshoring may deliver cost savings, butit may also involve job losses. On the one hand, costsavings and efficiency gains provide the foundation forproductivity growth and the creation of new employ-ment opportunities. They enable firms to compete, winnew business, gain market share and grow. On the otherhand, some of the jobs lost may be difficult to replace,and there is some concern that labour conditions will beeroded through competition with locations withoutequivalent labour and social welfare provisions – leadingto a “race to the bottom” (OECD 2004, pp97–98).
Reduced costs for those businesses with offshore oper-ations or making use of outsourced offshore operationsshould make them more competitive. In the first instancethey should gain market share and profitability shouldimprove. Over time, competition should ensure that thebenefits flow through to consumers in the form of lowerprices. Thus, offshoring should enable developedeconomy-based firms to gain market share in the globaleconomy, grow, and expand employment opportunitiesboth at home and abroad. In addition, the jobs createdoffshore generate demand for developed country goods
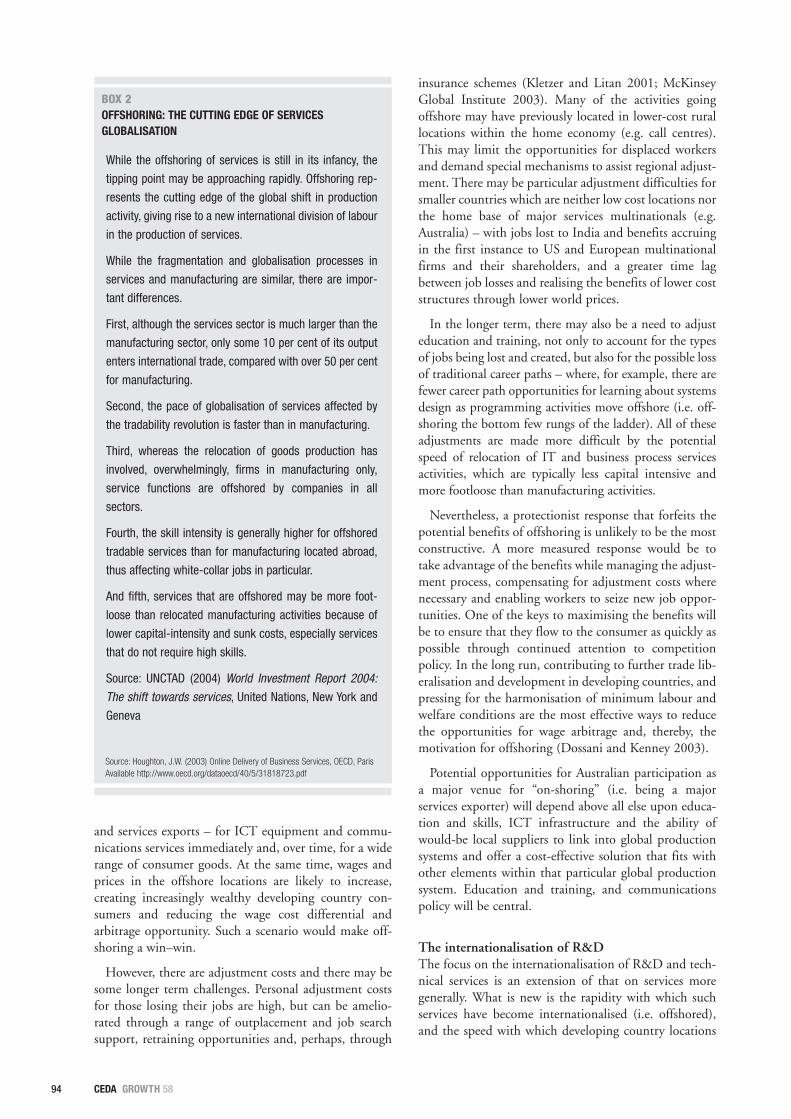
94
and services exports – for ICT equipment and commu-nications services immediately and, over time, for a widerange of consumer goods. At the same time, wages andprices in the offshore locations are likely to increase,creating increasingly wealthy developing country con-sumers and reducing the wage cost differential andarbitrage opportunity. Such a scenario would make off-shoring a win–win.
However, there are adjustment costs and there may besome longer term challenges. Personal adjustment costsfor those losing their jobs are high, but can be amelio-rated through a range of outplacement and job searchsupport, retraining opportunities and, perhaps, through
insurance schemes (Kletzer and Litan 2001; McKinseyGlobal Institute 2003). Many of the activities goingoffshore may have previously located in lower-cost rurallocations within the home economy (e.g. call centres).This may limit the opportunities for displaced workersand demand special mechanisms to assist regional adjust-ment. There may be particular adjustment difficulties forsmaller countries which are neither low cost locations northe home base of major services multinationals (e.g.Australia) – with jobs lost to India and benefits accruingin the first instance to US and European multinationalfirms and their shareholders, and a greater time lagbetween job losses and realising the benefits of lower coststructures through lower world prices.
In the longer term, there may also be a need to adjusteducation and training, not only to account for the typesof jobs being lost and created, but also for the possible lossof traditional career paths – where, for example, there arefewer career path opportunities for learning about systemsdesign as programming activities move offshore (i.e. off-shoring the bottom few rungs of the ladder). All of theseadjustments are made more difficult by the potentialspeed of relocation of IT and business process servicesactivities, which are typically less capital intensive andmore footloose than manufacturing activities.
Nevertheless, a protectionist response that forfeits thepotential benefits of offshoring is unlikely to be the mostconstructive. A more measured response would be totake advantage of the benefits while managing the adjust-ment process, compensating for adjustment costs wherenecessary and enabling workers to seize new job oppor-tunities. One of the keys to maximising the benefits willbe to ensure that they flow to the consumer as quickly aspossible through continued attention to competitionpolicy. In the long run, contributing to further trade lib-eralisation and development in developing countries, andpressing for the harmonisation of minimum labour andwelfare conditions are the most effective ways to reducethe opportunities for wage arbitrage and, thereby, themotivation for offshoring (Dossani and Kenney 2003).
Potential opportunities for Australian participation asa major venue for “on-shoring” (i.e. being a majorservices exporter) will depend above all else upon educa-tion and skills, ICT infrastructure and the ability ofwould-be local suppliers to link into global productionsystems and offer a cost-effective solution that fits withother elements within that particular global productionsystem. Education and training, and communicationspolicy will be central.
The internationalisation of R&DThe focus on the internationalisation of R&D and tech-nical services is an extension of that on services moregenerally. What is new is the rapidity with which suchservices have become internationalised (i.e. offshored),and the speed with which developing country locations
CEDA GROWTH 58
While the offshoring of services is still in its infancy, the
tipping point may be approaching rapidly. Offshoring rep-
resents the cutting edge of the global shift in production
activity, giving rise to a new international division of labour
in the production of services.
While the fragmentation and globalisation processes in
services and manufacturing are similar, there are impor-
tant differences.
First, although the services sector is much larger than the
manufacturing sector, only some 10 per cent of its output
enters international trade, compared with over 50 per cent
for manufacturing.
Second, the pace of globalisation of services affected by
the tradability revolution is faster than in manufacturing.
Third, whereas the relocation of goods production has
involved, overwhelmingly, firms in manufacturing only,
service functions are offshored by companies in all
sectors.
Fourth, the skill intensity is generally higher for offshored
tradable services than for manufacturing located abroad,
thus affecting white-collar jobs in particular.
And fifth, services that are offshored may be more foot-
loose than relocated manufacturing activities because of
lower capital-intensity and sunk costs, especially services
that do not require high skills.
Source: UNCTAD (2004) World Investment Report 2004:
The shift towards services, United Nations, New York and
Geneva
Source: Houghton, J.W. (2003) Online Delivery of Business Services, OECD, ParisAvailable http://www.oecd.org/dataoecd/40/5/31818723.pdf
BOX 2OFFSHORING: THE CUTTING EDGE OF SERVICES GLOBALISATION

95COMPETING FROM AUSTRALIA
have been able to build a presence. In a very short spaceof time, Asia has become not just the location of manyassembly and routine services activities, but also thelocation of an increasing range of relatively knowledge-intensive R&D, design and technical services.
Traditionally, core research activities were located closeto the home base of multinational firms, with overseasR&D being confined to adaption to local markets (Pateland Pavitt 1991; Pavitt 2001, 2002). While still often thecase, there is also increasing globalisation of core R&Dactivities. There are a number of drivers, including: theincreasing scale and complexity of industrial R&D; agingpopulations and skill shortages in some developed coun-tries and increasingly large populations of highly skilledengineering and science graduates in some developingcountries; the increasing international mobility ofscience brought about by the ICT revolution and e-science networks; cost differences; and timezonedifferences, allowing 24/7 round-the-world development(UNCTAD 2005). Increasingly, R&D is treated likeother services and is subject to asset and efficiencyseeking global rationalisation.
The importance of skills and local innovative capacityin the host economies is borne out by the fact that theinternationalisation of R&D involves relatively fewdeveloping countries (e.g. China, Hong Kong, Malaysia,India). In 2000–01, China, India and the RussianFederation together accounted for almost one-third of alltertiary technical students in the world (UNCTAD2005). In 2004, China added 380,000 science and engi-neering graduates to its talent pool, India added 360,000and Russia 240,000 (Hemerling et al. 2005). As notedabove, multinational firms account for a large share ofbusiness R&D in many countries, including Australia –where foreign affiliates account for more than 40 per centof all business R&D expenditure. Again, it is not all one-way. Developing country multinationals are increasinglyexpanding R&D activities into developed countries inorder to tap into their knowledge bases.
No country can expect to produce all the knowledgeneeded to stay competitive, so participation in thesecommercial networks of innovation is as important, ifnot more so, than international collaboration in publicsector research. There are particular opportunities fordeveloping countries to “trade” highly-skilled labour forlinks to, and participation in, global innovation networksthat carry the promise of accelerating innovation devel-opment and possibly generating spillovers to local firms.Key determinants in realising the potential include thecapacity of the host country’s innovation system and sup-porting infrastructure (e.g. treatment of intellectualproperty rights) (UNCTAD 2005). As is the case withthe other two key developments noted, creating andmaintaining linkages into increasingly complex and frag-mented global systems of production and innovation willbe crucial, as the linkage between local innovation andlocal commercialisation breaks down.
ConclusionsThe current phase of globalisation involves an increasingintensity of competition, with greater specialisation andfragmentation of global value chains. The advantagedeveloped countries have enjoyed in knowledge intensiveproducts and services no longer holds. What is perhapsnew is the speed with which some developing countrylocations are emerging as key participants in global pro-duction systems, and services production is beingrationalised on a global basis. Both facilitated and led byICTs, this “tradability revolution” in services has thepotential to be even more significant than the globalisa-tion of manufacturing (UNCTAD 2004, p177).
The importance of global linkages that facilitate par-ticipation in global production systems is increasing andyet, on most indicators, Australia is not highly linkedinto the global economy. In many areas of manufac-turing, and increasingly in services, there is afragmentation of the value chain, and this fragmentationis global in scope. Unable to compete with developinglocations on labour costs and remote from majormarkets, Australia’s manufacturers must seek to maintaina position as a design and development “centre ofgravity” and/or focus on lower unit volume products(Houghton et al. 2004). In services too, there is a need tobuild capabilities in design and development that offercreativity, skills and value for money. Integration andremote delivery require leading-edge infrastructure, espe-cially communications and transport, and strongcapabilities in integrating supply chain and work flowmanagement and logistics.
The key issue is how to participate in these rapidlyemerging, globally organised production systems from aremote location. Roberts (2005, p51) recently reportedon the success of Playford (South Australia), quotingPlayford’s Industrial Strategist, Rodin Genoff, saying:“We are all working in global markets. Building the capa-bilities of local companies we help them engage in globalsupply chains.” Successful clusters focus on globallinkages, as well as local capabilities. Local linkages arestill important, but as multinational firms permeateevery economy and competition is between entire pro-duction systems, global linkages become increasinglyimportant. This is not necessarily inconsistent withcluster theory, but may require a change of emphasis inpolicy. Often, the focus has been on cooperating locallyin order to compete globally. With the new wave of glob-alisation, perhaps it is time to change the emphasis andthink about doing the opposite – cooperating globally inorder to compete locally (or, perhaps, in order tocompete at all).
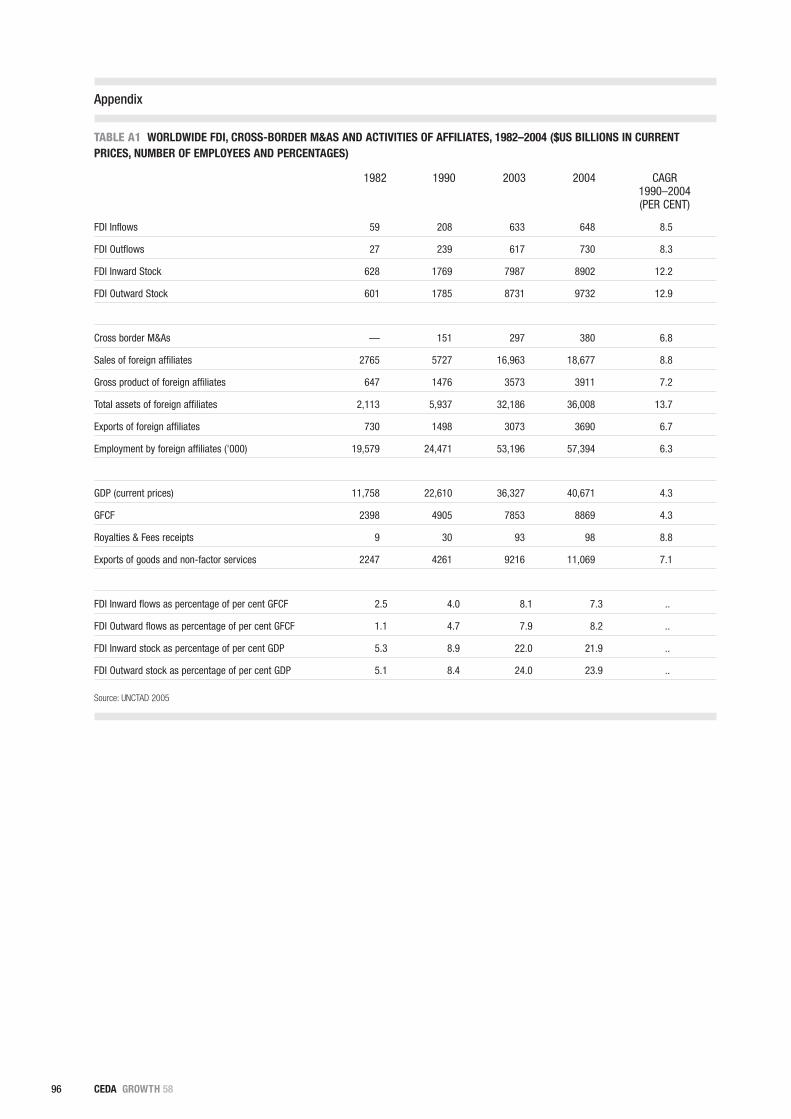
96 CEDA GROWTH 58
Appendix
TABLE A1 WORLDWIDE FDI, CROSS-BORDER M&AS AND ACTIVITIES OF AFFILIATES, 1982–2004 ($US BILLIONS IN CURRENTPRICES, NUMBER OF EMPLOYEES AND PERCENTAGES)
1982 1990 2003 2004 CAGR 1990–2004(PER CENT)
FDI Inflows 59 208 633 648 8.5
FDI Outflows 27 239 617 730 8.3
FDI Inward Stock 628 1769 7987 8902 12.2
FDI Outward Stock 601 1785 8731 9732 12.9
Cross border M&As — 151 297 380 6.8
Sales of foreign affiliates 2765 5727 16,963 18,677 8.8
Gross product of foreign affiliates 647 1476 3573 3911 7.2
Total assets of foreign affiliates 2,113 5,937 32,186 36,008 13.7
Exports of foreign affiliates 730 1498 3073 3690 6.7
Employment by foreign affiliates ('000) 19,579 24,471 53,196 57,394 6.3
GDP (current prices) 11,758 22,610 36,327 40,671 4.3
GFCF 2398 4905 7853 8869 4.3
Royalties & Fees receipts 9 30 93 98 8.8
Exports of goods and non-factor services 2247 4261 9216 11,069 7.1
FDI Inward flows as percentage of per cent GFCF 2.5 4.0 8.1 7.3 ..
FDI Outward flows as percentage of per cent GFCF 1.1 4.7 7.9 8.2 ..
FDI Inward stock as percentage of per cent GDP 5.3 8.9 22.0 21.9 ..
FDI Outward stock as percentage of per cent GDP 5.1 8.4 24.0 23.9 ..
Source: UNCTAD 2005
97COMPETING FROM AUSTRALIA
REFERENCES
Borga, M. and Mann, M. (2003) ‘US international services: Cross-border trade in 2002 andsales through affiliates in 2001,’ Survey of Current Business, 83(10), pp58–118.
Borga, M. and Mann, M. (2004) US International Services: Cross-Border Trade in 2003 andSales Through Affiliates in 2002, Department of Commerce, Washington DC.
Carlsson, B. (2005) ‘Internationalization of innovation systems: A survey of the literature,’Research Policy 35(1), February 2006, pp56–67.
Dahman, E. (1950) Entrepreneurial Activity and the Development of Swedish Industry1991–9, American Economic Association Translation (1970).
DeBresson, C. and Hu, X. (1999) ‘Identifying Clusters and Innovative Activity: A NewApproach and a Toolbox,’ in Boosting Innovation: The Cluster Approach, OECD, Paris.
Department of Commerce (2005) US Goods Trade: Imports and Exports by Related Parties,2004, Department of Commerce, Washington DC.
Dossani, R. and Kenney, M. (2003) ‘Went for Cost, Stayed for Quality?: Moving the BackOffice to India,’ Berkeley Roundtable on the International Economy (BRIE) Working Paper156, University of California at Berkeley, August 2003.
E-business Watch (2003) ICT and e-business in the Electrical Machinery and ElectronicsSector, European Commission, Sector Report 11/II, p14.
Edquist, C. (ed.) (1997) Systems of Innovation: Technologies, Institutions and Organizations,London: Pinter.
Edquist, C. (2001) ‘The Systems of Innovation Approach and Innovation Policy: An accountof the state of the art,’ Paper presented at DRUID Conference, Aalborg, June 12–15, 2001.
Hemerling, J. et al. (2005) Navigating the Five Currents of Globalisation, Boston ConsultingGroup,
Hobday, M., Rush, H. and Tidd, J. (2000) ‘Innovation in complex products and systems’,Research Policy 29 (2000), pp793–804.
Houghton, J.W. (2003) Online Delivery of Business Services, OECD, Paris.
Houghton, J.W. with Thorburn, L. (2004) The Victorian Electronics Industry Cluster,Prepared for the Victorian Department of Industry, Innovation and Regional Development onBehalf of the Australian Electrical and Electronic Manufacturers Association, August 2004.
Houghton, J.W. (2005a) Online Delivery in Distribution and Logistics, OECD, Paris.
Houghton, J.W. (2005b) Online Delivery in Travel and Tourism, OECD, Paris.
Howells, J. (2006) ‘Where to from here for services innovations,’ Paper presented at theKnowledge Intensive Services Activities (KISA) Conference, Sydney, March 2006.
Jacobs, D. and de Man, A.-P. (1996) ‘Clusters, Industrial Policy and Firm Strategy: A MenuApproach,’ Technology Analysis and Strategic Management, 8(4), 1996, pp425–437.
Kaplinsky, R. (2000) ‘Spreading the gains from globalisation: what can be learned fromvalue chain analysis?’ Journal of Development Studies 37(2), pp117–146.
Kaplinsky, R. and Morris, M. (2003) A Handbook For Value Chain Research, Institute forDevelopment Studies, Sussex University.
Kletzer, L. and Litan, R. ‘A prescription to relieve worker anxiety,’ Institute for InternationalEconomics, Policy Brief 01–2, February 2001.
Liu, X. and White, S. (2001) ‘Comparing Innovation Systems: A Framework and Applicationto China’s Transitional Context,’ Research Policy 30(7), pp1091–1114.
McKinsey Global Institute (2003) Offshoring: Is It a Win–Win Game? McKinsey GlobalInstitute, San Francisco, August 2003.
Morris, P. (2000) World Wide Work: Globally Distributed Expert Business Services, EmergingIndustries Occasional Paper 4, Department of Industry, Science and Resources, Canberra.
National Association of Software and Service Companies (NASSCOM) (2004) Indian I.T.Software and Services Directory 2003, NASSCOM, New Delhi.
NEMI (2003) Technology Roadmaps: December 2003, NEMI, p11.
OECD (1999) Boosting Innovation: The Cluster Approach, OECD, Paris.
OECD (2004) Information Technology Outlook 2004, OECD, Paris.
OECD (2005a) OECD Handbook on Economic Globalisation Indicators, OECD, Paris.
OECD (2005b) OECD Economic Globalisation Indicators, 2005, OECD, Paris.
OECD (2006) Information Technology Outlook 2006, OECD, Paris.
Patel, P. and Pavitt, K. (1991) ‘Large firms in the production of the Worlds technology: animportant case of non-globalization,’ Journal of International Business Studies 22(1),pp1–21.
Pavitt, K. (2001) ‘Managing global innovation: uncovering the secrets of future competi-tiveness,’ Research Policy 30(1), pp176–177.
Pavitt, K. (2002) ‘The globalizing learning economy,’ Academy of Management Review27(1), pp125–127.
Piore, M.J. and Sabel, C.F. (1984) The Second Industrial Divide: Possibilities for Prosperity,Basic Books, New York.
Porter, M.E. (1985) Competitive Advantage, The Free Press, New York.
Porter, M.E. (1990) The Competitive Advantage of Nations, The Free Press, New York.
Porter, M.E. (1998) ‘Clusters and the New Economics of Competition,’ Harvard BusinessReview, November-December 1998, pp77–90.
PricewaterhouseCoopers (2004) Electronics Manufacturing: EMS at a Crossroads, PWCGlobal Technology Centre.
Rittel, H. and Webber, M. (1973) ‘Dilemmas in a General Theory of Planning,’ Policy Studies4(1), 155–169.
Roberts, P. (2005) ‘At last, a level Playford field for SMEs,’ Australian Financial Review, 6December 2005, p51.
Roelandt, T. and den Hertog, P. (1998) ‘Cluster analysis and Cluster-based Policy in OECDCountries,’ OECD Workshop, Vienna, May 1998.
Roelandt, T.J.A., den Hertog, P. and van Sinderen, J. (1999) ‘Cluster Analysis and ClusterPolicy in the Netherlands,’ in OECD Boosting Innovation: The Cluster Approach, OECD,Paris.
Rosenfield, S. (1995) Overachievers: Business Clusters that Work, Regional TechnologyStrategies Inc.
Ryan, C. (2006) ‘Seeing Red: China’s profits walk away,’ Australian Financial Review, No11872, 27 February 2006, p11.
Saxenian, A. (1994) Regional Advantage: Culture and Competition in Silicon Valley andRoute 128, Harvard University Press, Boston MA.
SIA (2005) Semiconductor Industry Sees Globalization as Growth Opportunity,Semiconductor Industry Association, July 2005.
Spielkamp, A. and Vopel, K. (1999) ‘Mapping Innovative Clusters in National InnovationSystems,' in OECD Boosting Innovation: The Cluster Approach, OECD, Paris.
Taylor, R. and Morone, P. (2005) Innovation networks and proximity: An applied EvolutionaryModel, Fourth European Meeting on Applied Evolutionary Economics (EMAEE), Utrecht, TheNetherlands, 19–21 May 2005.
The Information Network (2005) US Capture 50 percent of Global SemiconductorProcessing Equipment in 2005, TIN, October 2005.
UNCTAD (2002) World Investment Report 2002: Transnational Corporations and ExportCompetitiveness, United Nations, New York and Geneva.
UNCTAD (2004) World Investment Report 2004: The Shift Towards Services, United Nations,New York and Geneva.
UNCTAD (2005) World Investment Report 2005: Transnational Corporations and theInternationalisation of R&D, United Nations, New York and Geneva.
van Welsum, D. (2004) ‘In search of outsourcing: evidence from US imports of services,’Birkbeck College, London, mimeo.
van Welsum, D. and Rief, X. (2006) The share of employment potentially affected by off-shoring: An empirical investigation, OECD, Paris.
WSTS (2005) World Semiconductor Trade Statistics, WSTS.
WTO (2004) International Trade Statistics 2003, World Trade Organization, Geneva.
WTO (2005a) International Trade Statistics, 2005, World Trade Organization, Geneva.
WTO (2005b) World Trade Report 2005: Exploring the links between trade, standards andthe WTO, World Trade Organisation, Geneva.
Zeile, W.J. (2005) US Affiliates of Foreign Companies: Operations in 2003, Department ofCommerce, Washington DC. per cent per cent per cent per cent
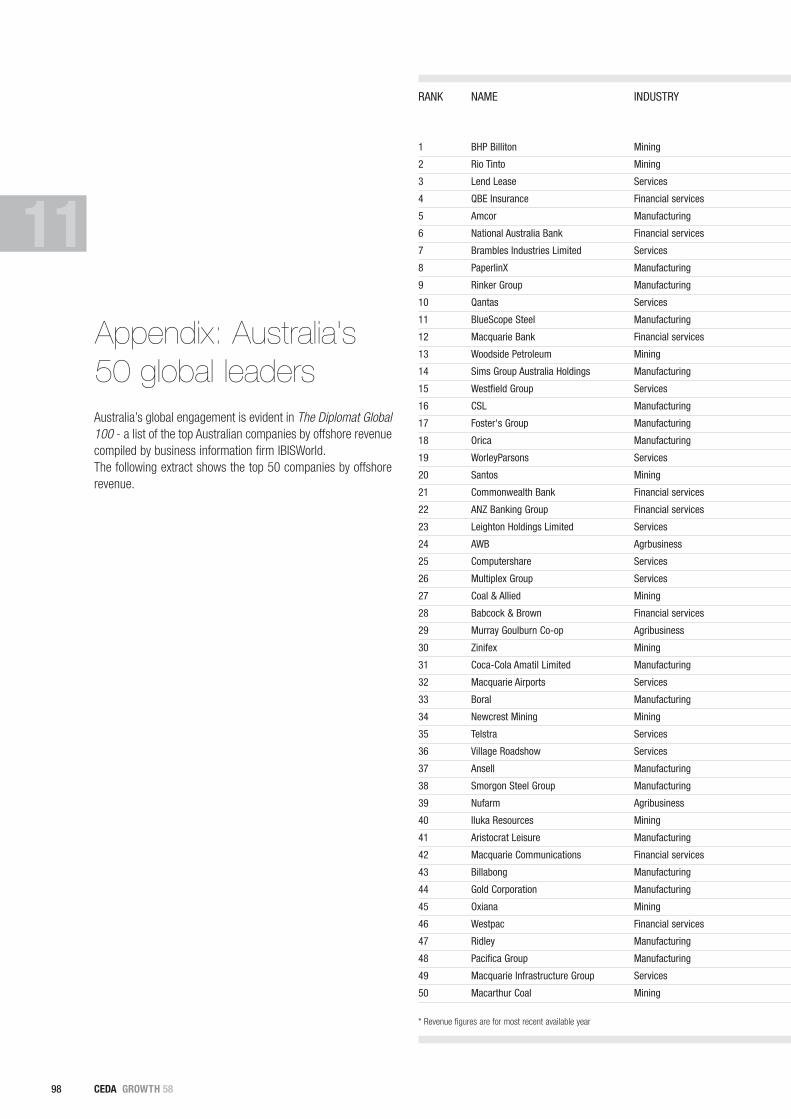
D
98 CEDA GROWTH 58
Appendix: Australia's50 global leaders Australia’s global engagement is evident in The Diplomat Global100 - a list of the top Australian companies by offshore revenuecompiled by business information firm IBISWorld.The following extract shows the top 50 companies by offshorerevenue.
11
RANK NAME INDUSTRY
1 BHP Billiton Mining
2 Rio Tinto Mining
3 Lend Lease Services
4 QBE Insurance Financial services
5 Amcor Manufacturing
6 National Australia Bank Financial services
7 Brambles Industries Limited Services
8 PaperlinX Manufacturing
9 Rinker Group Manufacturing
10 Qantas Services
11 BlueScope Steel Manufacturing
12 Macquarie Bank Financial services
13 Woodside Petroleum Mining
14 Sims Group Australia Holdings Manufacturing
15 Westfield Group Services
16 CSL Manufacturing
17 Foster's Group Manufacturing
18 Orica Manufacturing
19 WorleyParsons Services
20 Santos Mining
21 Commonwealth Bank Financial services
22 ANZ Banking Group Financial services
23 Leighton Holdings Limited Services
24 AWB Agrbusiness
25 Computershare Services
26 Multiplex Group Services
27 Coal & Allied Mining
28 Babcock & Brown Financial services
29 Murray Goulburn Co-op Agribusiness
30 Zinifex Mining
31 Coca-Cola Amatil Limited Manufacturing
32 Macquarie Airports Services
33 Boral Manufacturing
34 Newcrest Mining Mining
35 Telstra Services
36 Village Roadshow Services
37 Ansell Manufacturing
38 Smorgon Steel Group Manufacturing
39 Nufarm Agribusiness
40 Iluka Resources Mining
41 Aristocrat Leisure Manufacturing
42 Macquarie Communications Financial services
43 Billabong Manufacturing
44 Gold Corporation Manufacturing
45 Oxiana Mining
46 Westpac Financial services
47 Ridley Manufacturing
48 Pacifica Group Manufacturing
49 Macquarie Infrastructure Group Services
50 Macarthur Coal Mining
* Revenue figures are for most recent available year

99COMPETING FROM AUSTRALIA
OFFSHORE SHARE OF TOTAL MAJOR LOCATIONSREVENUE, OFFSHORE REVENUE,
$BN* REVENUE $BN*
39.25 73.3% 53.57 China, Europe, Japan, North America, Other Asia, Rest of the World, South America, South Korea, Southern Africa
23.96 94.2% 25.44 Africa, Europe & Other Countries, Indonesia, North America, South America
9.56 78.8% 12.13 Americas, Europe
9.01 74.1% 12.17 Americas, Asia/Pacific, Europe, Other
8.48 75.6% 11.22 Asia, Europe, Latin America, North America
7.85 20.5% 38.24 Asia, Europe, United States
6.79 82.8% 8.21 Europe, Americas, Rest of the World
6.06 81.7% 7.42 Asia, Europe, North America
5.71 77.8% 7.33 United States of America
5.51 40.4% 13.65 Japan, Other Regions, South East Asia & North East Asia, The Americas & the Pacific, United Kingdom & Europe
3.90 48.6% 8.03 Asia, North America, Other
3.80 48.0% 7.92 Asia Pacific, Europe, North America, Other
3.38 88.8% 3.81 Africa, Asia, Other, United States
2.53 67.4% 3.76 Europe, North America
2.36 58.4% 4.05 United Kingdom, United States
2.33 80.2% 2.90 Americas, Europe, Middle East & Africa
2.17 42.3% 5.12 Americas, Asia & Pacific, Europe
2.14 44.6% 4.80 Americas, Asia, Other
1.81 75.5% 2.40 Americas, Asia & Middle East, Europe
1.81 66.2% 2.74 International
1.74 6.1% 28.56 Other Countries
1.69 6.6% 25.51 Overseas Markets
1.68 16.8% 10.03 Asia
1.57 32.3% 4.85 Other, Switzerland
1.44 88.1% 1.64 Asia Pacific, North America, UK, Ireland, Germany & South Africa
1.40 36.9% 3.80 Europe & Middle East
1.33 94.8% 1.40 Asia, Europe, Other
1.32 60.4% 2.18 Asia Pacific, Europe, North America
1.22 60.3% 2.03 Asia, Middle East & Africa, Other, The Americas
1.20 39.3% 3.06 Europe, USA
1.19 26.9% 4.42 South Korea, Indonesia & PNG
1.16 93.5% 1.24 Bermuda, UK & Europe, Other
1.14 24.0% 4.77 Asia, Other, USA
1.14 78.9% 1.45 Europe, Japan, Korea, Other Asia
1.14 4.9% 23.17 Non Australian Countries
1.11 73.2% 1.51 Asia, British Virgin Islands, Europe, USA
1.06 91.9% 1.15 Americas, Asia Pacific, Europe
0.93 29.1% 3.21 Asia, Other Regions
0.93 55.0% 1.69 Americas, Europe
0.88 87.6% 1.00 Asia, Europe, North America
0.82 74.8% 1.09 Japan, North America, Other, South America
0.82 81.2% 1.01 United Kingdom
0.73 71.0% 1.03 Americas, Europe, Rest of the World
0.72 76.3% 0.94 Asia, Europe, Other Countries, USA
0.71 55.4% 1.28 Europe, Laos
0.69 3.2% 21.67 Other
0.68 53.8% 1.27 European Union, North America
0.66 78.0% 0.84 Asia, Europe, United States of America
0.54 51.3% 1.06 Europe, North America
0.53 100.0% 0.53 Americas, Asia, Europe, Other

NATIONAL OFFICELevel 5, 136 Exhibition StreetMelbourne Vic 3000GPO Box 2117TMelbourne Vic 3001Tel (61 3) 9662 3544Fax (61 3) 9663 7271Email [email protected]
NEW SOUTH WALES and the ACTLevel 14, The John Hunter Building9 Hunter StreetSydney NSW 2000GPO Box 2100Sydney NSW 1043Tel (61 2) 9299 7022Fax (61 2) 9299 7020
QUEENSLAND and theNORTHERN TERRITORYLevel 10, 175 Eagle StreetBrisbane Qld 4000GPO Box 2900Brisbane Qld 4001Tel (61 7) 3229 9955Fax (61 7) 3229 8166
SOUTH AUSTRALIA Level 7, Qantas House144 North TerraceAdelaide SA 5000PO Box 8248, Station ArcadeAdelaide SA 5000Tel (61 8) 8211 7222Fax (61 8) 8211 8222
VICTORIA and TASMANIALevel 5, 136 Exhibition StreetMelbourne Vic 3000GPO Box 2117TMelbourne Vic 3001Tel (61 3) 9662 3544Fax (61 3) 9663 7271
WESTERN AUSTRALIASuite 1, 25 Gladstone StreetPerth WA 6000PO Box 8623Perth Business Centre WA 6849Tel (61 8) 9228 2155Fax (61 8) 9228 2166
CEDA on the Web ceda.com.au
PP 381712/02249