Growth Chart Manual – Proposed Framework loss in babies following birth 11 3.2.4 Supporting...
48
October 2012
Transcript of Growth Chart Manual – Proposed Framework loss in babies following birth 11 3.2.4 Supporting...

October 2012

Training Programme for Public Health Nurses and Doctors Growth Monitoring Module ‐ updated October 2012
Working Group Membership (2005) Professor Hilary Hoey, Department of Paediatrics, Trinity Centre for Health Sciences, National Children’s Hospital Dr Christine McMaster, Reg Child & Adol Health Dev Officer, NWHB Dr Edna Roche, Lecturer in Paediatrics, Trinity Centre for Health Sciences (chair), National Children’s Hospital Ms Breda Ryan, Reg Child & Adol Health Dev Officer, MWHB
Updated by National Growth Charts Implementation Group (2012) Ms. Barbara Bolger Regional Specialist Primary Care
HSE 1st Floor Mill House, Ashtown Gate, Navan Road, Dublin 15
Ms. Jennifer Bollard Director of Public Health Nursing
HSE Tivoli Road, Dun Laoghaire, Co. Dublin
Ms. Bríd Brady Child Health Development Officer
Primary Care Centre, Barrack Street, Sligo
Ms. Teresa Cawley Regional Training and Development Officer (Child Health)
2nd Floor, JFK House, JFK Parade, HSE West, Sligo
Ms. Anna Delahunt Senior Paediatric Dietitian
AMNCH, Tallaght, Dublin 24
Dr. Sean Denyer Director of Public Health and Head of Childhood Screening
Children and Young People's Team, HSE Population Health Directorate, 3rd Floor, Bridgewater House, Rockwood Parade, Sligo
Mr. Fergal Flynn Local Health Manager
Lead Emergency Management, HSE West, Feoras St. Joseph’s Hospital, Ennis, Co. Clare
Dr. Mary Flynn Chief Specialist Public Health Nutrition
Food Safety Authority of Ireland, Abbey Court, Lower Abbey Street, Dublin 1
Ms. Marie Gleeson Child & Adolescent Health Development Officer
HSE Oak House, Millennium Park, Naas, Co. Kildare
Dr. Davina Healy
DML East Coast, Block B Civic Building, Main Street, Bray,
1
Principal Medical Officer Co. Wicklow Ms. Siobhan Hourigan National Breastfeeding Co‐Ordinator
Health Promotion HSE, Block 4 Central Business Park, Clonminch, Tullamore, Co. Offaly
Dr. Johanna Joyce Cooney Principal Medical Officer
Longford/Westmeath & Laois/Offaly, HSE Dublin Mid‐Leinster, Health Centre, Longford Road Mullingar, Co. Westmeath
Dr. Jacqueline McBrien Consultant Paediatrician
Paediatric Department, Midland Regional Hospital, Portlaoise, Co. Laois
Dr. Ciara McDonnell Consultant Paediatrician s.i. Endocrinology and Diabetes
AMNCH,Tallaght Hospital,Dublin 24 and Children’s University Hospital, Temple Street, Dublin 1
Ms. Raphael McMullin A/Project Officer
NMPDU Dublin Mid‐Leinster, Stewart’s Hospital, Mill Lane, Palmerstown, Dublin 20
Ms. Grace O’Neill Regional Child Health Training and Development Officer
HSE South (East), Lacken, Kilkenny
Ms. Moira O’Reilly A/Assistant Director of PHN
HSE Dublin North East Area, LHO (NWD), Rathdown Road, Dublin 7
Ms. Mary Roche Project Manager
Population Health, Children and Young People’s Team, 3rd Floor Bridgewater House, Rockwood Parade, Sligo
Ms. Ita Saul Dietitian Manager
Dept. of Clinical Nutrition Dietetics, Our Lady’s Children’s Hospital, Dublin 12
Ms. Siobhan Sinnott Senior Community Dietitian
Gorey Primary Care, HSE South, The Avenue, Gorey, Co. Wexford
Ms. Anne Sweeney Public Health Nurse
HSE West, Letterkenny, Co. Donegal
Ms Anne‐Marie Tully Senior Community Dietitian
HSE Health Promotion Office, St. Catherine’s Hall, Waterside, Waterford
2

Contents Page
1. Introduction 5
2. Growth Charts
2.1 National launch of new charts 6
2.2 What does a growth chart measure? 7 2.3 Description of the UK‐WHO Growth Charts 7
2.4 Development of the UK‐WHO Growth Charts 7
2.4.1 Growth reference versus standard 8
2.4.2 UK 1990 growth reference 8
2.5 How do the UK‐WHO charts differ from the WHO MGRS
standards? 8
3. Growth and Growth Monitoring 9
3.1 Growth Monitoring 9 3.1.1 Growth assessment 9
3.1.2 Growth velocity 9
3.2 Optimal Growth 10
3.2.1 Breastfeeding and growth 10
3.2.2 What is the normal rate of growth? 10
3.2.3 Weight loss in babies following birth 11
3.2.4 Supporting optimal growth – working with parents and caregivers 11
3.3 Problematic Growth 12
3.3.1 Slow or faltering weight gain or growth 12
3.3.2 Slow or faltering weight gain or growth – supporting parents and caregivers 13 3.3.3 Overweight and Obesity 14
3.3.4 Overweight and Obesity – supporting parents and caregivers 15
3.4 Stature 16
3.4.1 Short stature 16
3.4.2 Tall stature 17
3.4.3 Parental influence on stature 17
4. Measurement 18
4.1 Issues in Measurement 18
4.1.1 Accuracy 18
4.1.2 Measuring technique and equipment 19
4.1.3 Training in growth measurement 19
4.2 Measuring 19
4.2.1 Measuring weight 19
4.2.2 When to weigh infants 19
4.2.3 Weight Loss 20
4.2.4 Measuring head circumference 20
4.2.5 Measuring length and height 21
5. Plotting on Growth Charts 22
5.1 Centile charts 22
3

5.1.1 What do the centiles show? 22
5.1.2 Recording on the chart 22
5.2 Plotting 22
5.2.1 Plotting full‐term infants using the new charts 22
5.2.2 Plotting pre‐term infants using the new charts 23 5.2.3 What is gestational correction? 23
5.2.4 Plotting with gestational correction 23
5.2.5 Transfer pre‐term to infancy section 24
5.2.6 Specialised growth charts 24
6. Interpreting Growth Charts 25
6.1 What is normal? 25
6.1.1 What is normal rate of weight gain? 6.1.2 Length measurements commonly show wide variation 25
6.1.3 Length and Height changes at 2 years 25
6.2 Adult height prediction 25
6.3 Body Mass Index (BMI) 26
6.3.1 Body mass index [BMI] look‐up 26
6.3.2 Instructions for BMI look‐up 26
6.3.3 Interpreting Body Mass Index (BMI) 26
6.3.4 Serial measurements of BMI 26
6.4 Interpreting possible problems –examples 27
6.4.1 When should a single measurement trigger assessment? 27
6.4.2 Other possible problems 27
7. Referral Criteria 28
7.1 Screening and referral 28
7.2 Referral Criteria 29
7.3 Referral Pathway 29
8. Summary of National Standards in Growth Monitoring 30
8.1 Rationale 30
8.2 Recommendations 30
8.3 Equipment 30
8.4 Referral Criteria 30
8.5 Recommendations for referral 30
References 31
Appendix A Standard for Good Clinical Practice in Growth Monitoring 34
Appendix B Health Practitioners ‐ Working with Parents to support Optimal Growth 35 Appendix C Guidelines for Physical Activity for Children 38
Appendix D Personal Health Record and UK‐WHO Growth Charts 39
Appendix E Fact Sheet for parents or care‐givers 40
Appendix F Health Professionals ‐10 things to know about the new growth charts 42
Appendix G Resources for parents and professionals 44
4

1. Introduction Health professionals accept routine growth monitoring in children as a standard component of community child health services throughout the world. Normal growth is a good indicator of well being. All programmes aim at detecting abnormal growth patterns as early as possible, so that appropriate nutritional or social interventions can be put in place as necessary or so that further investigations for serious diseases can be carried out. The statutory national core health programme as set out under Best Health for children (Denyer et al, 1999, HSE, 2005) included recommendations for growth monitoring of all children aged 0‐12 years in Ireland. However, due to inequalities in the resourcing and delivery of this programme, no systematic universally available growth monitoring system has existed for children in Ireland to date. A national policy decision by the (then) Department of Health and Children to adopt the World Health Organisation Child Growth Standards (WHO 2006) and integrate them into child health programming in Ireland was made on October 20th, 2010. It is planned that these growth standards and routine use of the suite of growth charts developed in conjunction with them will be implemented across all child health and paediatric services in all areas of the country from 1st January 2013. The Working Group established to oversee their implementation has revised the Growth Module training document originally written in 2005 to take account of developments in the intervening period. There is an awareness that information sharing between child health service providers needs to be improved, especially in relation to children considered to be at risk of growth disorders. Introduction of the Personal Health Record (PHR) in all areas of the country to facilitate information sharing with parents and between service providers continues to be strongly recommended. Information for and communication with parents is essential, including the provision of support and education for healthy nutrition, growth and development, especially in light of increasing evidence of the effectiveness of health promotion. The development of any screening programme can create false reassurance for parents and practitioners. This is a particular issue in growth monitoring, especially where growth is systematically measured at 2 or 3 time points, namely birth, at 6 to 8 weeks of age and at school entry with statistically determined cut‐off points for referral for further assessment. Parental and professional concern always needs to be heeded and acted upon.
5

2. Growth Charts 2.1 National Launch of New Growth Charts A national policy decision by the (then) Department of Health and Children to adopt the World Health Organisation Child Growth Standards (WHO 2006) and integrate them into child health programming in Ireland was made on October 20th, 2010. The decision specifies the adoption of a suite of new 9‐centile growth charts for children in Ireland consisting of three components:
Age group / gestation
Decision
Status
1. For pre‐term babies
Adopt the revised UK Pre‐Terms Growth Charts that form part of the UK‐WHO charts suite .
For implementation from 1st January 2013
2. For full‐term babies, infants and children from birth to 4 years
Adopt the new UK‐WHO charts developed by the Royal College of Paediatrics and Child Health and the UK Department of Health.
For implementation from 1st January 2013
3. For children over 4 years old
• New growth charts will be constructed
based on data‐generated centiles derived from Irish reference data of the 1980s to merge with younger child charts (see 2 above) Ref: Hoey H, Tanner J and Cox L, 1987. Clinical growth standards for Irish
children. Acta Paediatrica Scandinavica
Supplement: 388; 1‐31
• As an interim measure until these new charts are available, the UK growth charts 2‐18yrs will be used to assess growth in children over 4 years up to 18 years old.
• When transitioning to the new growth charts for this age group, parents will be appropriately advised on why their child’s growth assessment changes.
Pending implementation by 1st January 2017
The UK‐WHO growth charts 0‐4 years will be used for babies born on or after 1st January 2013.
6
2.2 What does a growth chart measure? A growth chart will provide information on the following:
Length‐for‐age: Indicates whether an infant is an appropriate length for their age
Weight‐for‐age: Indicates whether an infant is an appropriate weight for their age
Weight‐for‐length: Indicates whether the weight and length of an infant are in
proportion
Head circumference‐for‐age: Provides information about brain development
2.3 Description of the new UK‐WHO Growth Charts The new charts consist of new A4 charts (Boy and Girl) and new A5 PHR charts (Boy and Girl) both covering 32 weeks gestation to 4 years. In addition there is a new Neonatal and Infant Close Monitoring (NICM) low birth‐weight chart (23 weeks gestation to 2 years corrected age) for very preterm (less than 32 weeks) and sick neonates. These charts are based on combined WHO and UK 90 data. UK‐WHO Growth Chart 0‐4 years are used for: • Infants born at term (37 weeks gestation or later) • Healthy infants born preterm from 32 weeks and before 37 weeks gestation – use the
Preterm section on the left of the chart until baby has reached EDD plus two weeks, and then move over to plot on the main 0-4 year section, with gestation age correction. The 0‐4 years charts are also available in A5 size for the Parent Held Record
UK‐WHO NICM Growth Chart 23 weeks gestation to 2 years corrected age are used for: • Infants of less than 32 weeks gestation • Any other infant requiring detailed assessment/ close monitoring. After 2 years corrected age UK‐WHO 0‐4 years charts can be used.
2.4 Development of the UK‐WHO Growth Charts In the 1990’s the WHO Department on Nutrition established a working group to assess the growth patterns of breastfed infants. In 1995, a WHO interdisciplinary working group on a growth reference protocol was established. The Multi‐centre Growth Reference Study (MGRS) set breastfeeding as the norm and provided a growth standard that establishes “how children should grow”, compared to “how children are growing”(SACN/RCPCH, 2007). The (WHO) Child Growth Standards for infants and children up to the age of 5 years were published in April 2006. They are based on the growth of healthy breastfed infants in optimal conditions from six different countries (USA, Norway, India, Ghana, Brazil, Oman). Data was collected from 8,500 children who were born at term, were living in a well‐supported healthy environment, exclusively breastfed for the first 4 months of life, and continued partial breastfeeding for a year and weaning solids started by 6 months of age. Mothers were non‐smokers and living in comfortable economic circumstances. The WHO MGRS excluded pre‐terms from their study sample so no WHO pre‐term charts are available yet, though they are being developed in the Intergrowth 21 Study 2008‐2012. The WHO growth standards, from the MGRS study have been developed into age‐based charts for height, weight and body mass index (BMI).
7
One important finding from the MGRS study was that despite the difference in racial and ethnic background, there were minimal differences in rates of growth patterns observed among the 6 countries. This allows the growth charts to be applicable worldwide representing a national standard.
2.4.1 Growth reference versus standard A growth standard describes the growth of a “healthy” population and suggests the norm. A growth reference describes the growth of a sample of individuals without making any association with health;
2.4.2 UK 1990 growth reference In 1990 new UK growth charts were produced based on recent UK data from 17 British sources including a combination of breastfed and formula fed infants. Because the WHO charts do not include preterm data, the UK 1990 data has been used to make the NICM low birth weight chart and the preterm and birth section of the UK‐WHO charts, as well as growth charts for use after the age of 4. They are a description of typical, but not necessarily healthy, growth in UK children from 1980‐90. The WHO charts were adopted in the UK in 2007. It was decided to adopt from age 2 weeks as it would allow continued use of the UK 1990 preterm and term data. The Royal College of Paediatrics and Child Health (RCPCH) designed the new charts and supporting educational materials (www.rcpch.ac.uk).
2.5 How do the UK‐WHO charts differ from the WHO MGRS standards? 1 The UK‐WHO charts did not adopt the WHO birth weight standard (mean of 3.3 kg). Instead
a new birth weight reference was created using UK 1990 data for all term births (37‐43 weeks) (mean of 3.6 kg).
2 The UK‐WHO charts incorporate MGRS data centiles for children from 2 weeks to 4 years old.
WHO MGRS standards data are only based on a global sample of children up to 5 years old. Work is underway in the UK on updating the UK90 2‐18 years charts.
3 The UK‐WHO suite of charts does not include separate BMI‐for‐age charts, as presented in
the WHO MGRS standards. Instead, UK/WHO charts display a BMI conversion chart on weight/height charts for children 2‐4 years old.
8

3. Growth and Growth Monitoring
3.1 Growth monitoring Growth is a sensitive indicator of health in childhood, as normal growth can only occur if a child is healthy, adequately nourished and emotionally secure. We are concerned with child growth on a number of levels, namely: Growth monitoring on a national level to ensure the appropriate identification of
children and adolescents with growth problems, at the earliest possible opportunity. The ultimate aim being early identification, prompt investigation and early treatment as appropriate. Prognosis for those with growth disorders is improved by early treatment.
Investigation and management of those children and adolescents with growth disorders or tall or short stature.
Under or over‐nutrition
3.1.1 Growth assessment Growth assessment is, therefore, an essential part of the examination or investigation of any child (Hoey et al, 1987). It should be performed as part of good routine clinical care. Assessment of growth and wellbeing in childhood and adolescence requires: A thorough history Complete physical examination to include pubertal assessment where appropriate. Growth assessment should include:
o standing height for those who can weightbear independently, from approximately 2years of age and supine length in the under 2’s
o an assessment of body proportions and sitting height o weight o skin‐fold thickness o measured parental height
It is considered good practice to include assessments of growth at routine child health visits like immunisation visits and developmental assessments. Measurements taken as part of a universal growth monitoring programme aimed at all children are intended to be additional to those of routine care. Any interpretation of growth data must be taken in the overall clinical context of the individual child. This is particularly so when considering growth data on the child aged less than two years, where both length and weight are influenced by a wide range of transitory external factors, such as the timing of the last feed and micturition. In the community accurate growth measurement and accurate plotting on the appropriate centile chart is vital.
3.1.2 Growth Velocity In growth monitoring, height velocity remains a useful tool. However, in the assessment of height velocity the need for accurate measurement is even more important. In the assessment of height velocity 2 measurements are required separated by time, ideally 1 year. The average pre‐pubertal child will grow between 4‐6 cm per year between 3 and 8‐9 years. A child who appears to have grown 4 cm in 1 year may in fact have grown between 3.3 cm and 4.7 cm (Voss et al. 1990). The former is a very low height velocity and the latter normal. Thus, while height velocity is an invaluable tool in growth clinics due to measurement variability it is not recommended for community based screening.
9
3.2 Optimal Growth
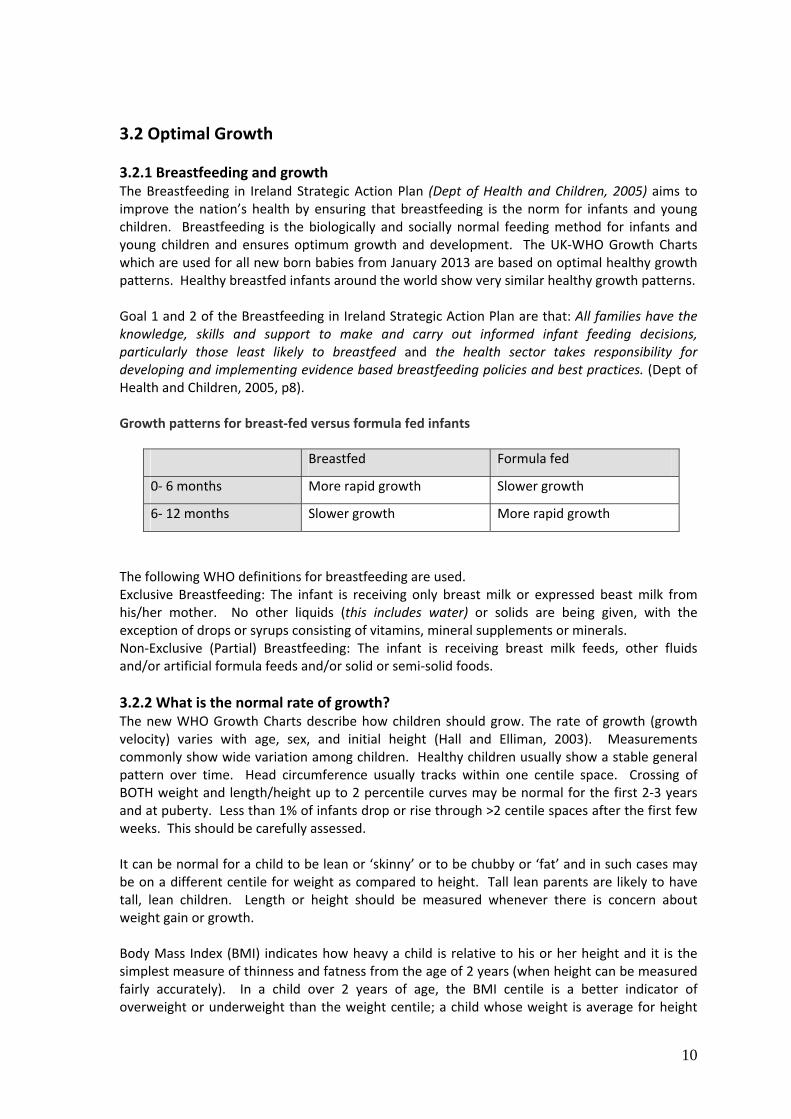
3.2.1 Breastfeeding and growth The Breastfeeding in Ireland Strategic Action Plan (Dept of Health and Children, 2005) aims to improve the nation’s health by ensuring that breastfeeding is the norm for infants and young children. Breastfeeding is the biologically and socially normal feeding method for infants and young children and ensures optimum growth and development. The UK‐WHO Growth Charts which are used for all new born babies from January 2013 are based on optimal healthy growth patterns. Healthy breastfed infants around the world show very similar healthy growth patterns. Goal 1 and 2 of the Breastfeeding in Ireland Strategic Action Plan are that: All families have the knowledge, skills and support to make and carry out informed infant feeding decisions, particularly those least likely to breastfeed and the health sector takes responsibility for developing and implementing evidence based breastfeeding policies and best practices. (Dept of Health and Children, 2005, p8). Growth patterns for breast‐fed versus formula fed infants
Breastfed Formula fed
0‐ 6 months More rapid growth Slower growth
6‐ 12 months Slower growth More rapid growth
The following WHO definitions for breastfeeding are used. Exclusive Breastfeeding: The infant is receiving only breast milk or expressed beast milk from his/her mother. No other liquids (this includes water) or solids are being given, with the exception of drops or syrups consisting of vitamins, mineral supplements or minerals. Non‐Exclusive (Partial) Breastfeeding: The infant is receiving breast milk feeds, other fluids and/or artificial formula feeds and/or solid or semi‐solid foods.
3.2.2 What is the normal rate of growth? The new WHO Growth Charts describe how children should grow. The rate of growth (growth velocity) varies with age, sex, and initial height (Hall and Elliman, 2003). Measurements commonly show wide variation among children. Healthy children usually show a stable general pattern over time. Head circumference usually tracks within one centile space. Crossing of BOTH weight and length/height up to 2 percentile curves may be normal for the first 2‐3 years and at puberty. Less than 1% of infants drop or rise through >2 centile spaces after the first few weeks. This should be carefully assessed. It can be normal for a child to be lean or ‘skinny’ or to be chubby or ‘fat’ and in such cases may be on a different centile for weight as compared to height. Tall lean parents are likely to have tall, lean children. Length or height should be measured whenever there is concern about weight gain or growth. Body Mass Index (BMI) indicates how heavy a child is relative to his or her height and it is the simplest measure of thinness and fatness from the age of 2 years (when height can be measured fairly accurately). In a child over 2 years of age, the BMI centile is a better indicator of overweight or underweight than the weight centile; a child whose weight is average for height
10

will have a BMI between the 25th and 75th centile (whatever their height centile). It is calculated as follows: BMI = weight (kg) ÷ height (m)2. BMI needs to be interpreted in the context of the individual child, taking into account age, body build and pubertal stage.
3.2.3 Weight Loss in babies following birth Some degree of weight loss is common after birth. Calculating the percentage weight loss is a useful way to identify babies who need assessment. Newborn infants should be regaining weight by day 3 to 5. It is expected that infants will regain their birth weight by day 10‐ 14. To gain weight and thrive, breastfed newborns need to feed regularly in response to early feeding cues. Factors that can contribute to slow weight gain include:
• Breastfeeding dynamics o Shallow latch o Insufficient active suckling at the breast o Less than optimal early breastfeeding o Feeding liquids which can delay or replace breastfeeding
• Factors relating to the baby’s anatomy and health • Factors relating to mother’s anatomy and health (Mohrbacher, 2010)
Feeding assessment, information and support can help to address these factors. For formula fed infants, feeding assessment should include assessment of the volume and frequency of feeding and the preparation of formula feeds.
A short period of weight loss, followed by rapid catch‐up, happens quite often if the baby has a viral illness, gastroenteritis or respiratory infection. If the baby is continuing to lose weight, as opposed to simply gaining weight more slowly than the centile lines suggest is normal, further investigation is needed as there are many possible causes.
3.2.4 Supporting optimal growth – working with parents and caregivers (See Appendix B for Summary information sheet)
In the majority of cases infants and children will be growing well. It is good practice to commend and reinforce the parent and care‐giver when the child is growing well. Examples of such reinforcement maybe:
‘’It is great that you are going for walks 3 times a week’’ ‘’It is great that you are protecting your baby’s health by breastfeeding–is there any support that you need to continue breastfeeding?’’ ‘’It is great to be eating dinner together most days’’ (www.dietitians.ca)
For parents of babies and young children ask about infant feeding and if breastfeeding is exclusive or partial. Enquire if the parent is responding to the child’s feeding cues. Assess any specific infant feeding needs and develop an individual care plan. Provide practical, informational and appraisal support, and information on other community resources.
For older children get information about food types, regularity of meals, physical activity and sedentary behaviours. It might be useful to go through a typical day.
Anticipatory guidance on topics such as readiness for solids, food types, normal developmental milestones etc. may be opportune.
When the weaned child is feeding there should be a division of responsibility between child and caregiver. The caregiver decides when and what, the child decides what and how much. This way the child learns to respond to their own hunger and satiety cues.
11

Bribing, coaxing or forcing a child to eat is never recommended, nor is the use of food as reward or punishment.
Research indicates that it is better for children, when families eat together at the table
Encourage parents to be aware of the advertising messages relating to food and activity or sedentary behaviour that their child/ren may be exposed to. The media is powerful in influencing food selection and health behaviours (Goldberg and Hellwig, 1997, in DoHC, 2005).
Active play is essential for normal growth and development. It is likely that Ireland will adopt similar physical activity and sedentary guidelines, which have been developed in Canada for the 0‐4years as follows:
o Infants should be physically active several times daily‐ particularly through interactive floor based play (tummy time, crawling, reaching for toys, playing on the floor).
o Toddlers and preschoolers should accumulate at least 180 minutes of a variety of physical activities that develop movement skills throughout the day. More is better and helps progression towards at least 60 minutes energetic play by 5yrs.
For healthy growth and development, caregivers should minimise the time infants, toddlers, pre‐schoolers (in fact all children) spend being sedentary during waking hours. This includes prolonged sitting or being restrained (e.g. stroller/highchair/car‐seat) for more than one hour at a time.
Screen time (TV, computers) is not recommended for under 2s and no more than 1 hour/day for pre‐schoolers.
For detailed infant and child feeding information, please refer to the Food and Nutrition Manual Unit 7 of the Training Programme for Public Health Nurses and Community Medical Officers in Child Health Screening, Surveillance and Health Promotion, available at: http://www.hse.ie/eng/services/Publications/services/Children/Unit_7_Food_and_Nutrition_2007. pdf
For information on physical activity guidelines see Appendix C.
3.3 Problematic Growth 3.3.1 Slow or faltering weight gain or growth Slow weight gain is weakly associated with social or medical ills, but more commonly occurs in isolation. Under‐nutrition is strongly implicated. The term “failure to thrive” tends to be seen as pejorative and there is an argument for relying instead on the more specific terms “slow weight gain” and “under‐nutrition” (Wright, 2000). Relative under‐nutrition may occur in many situations such as weaning difficulties, late weaning, minor illness, and family disturbances and this may be associated with short periods of slow weight gain or temporary weight loss (Hall and Elliman, 2003). Many of the babies who gain weight slowly, or whose weight graph gradually crosses centile lines downwards in the first year of life, may simply be adopting a growth trajectory, which is normal for them. The term should only be used when there is evidence that the slow weight gain is abnormal for that baby (Hall and Elliman, 2003). Children showing early slow weight gain in infancy catch up in weight by 2 years. Infants with late slow weight gains catch up slowly in weight through childhood but remain lighter and shorter than their peers at 13 years (Blair et al, 2004). Growth faltering or restriction during infancy has been linked with adverse health outcomes, so it is important that it is corrected early to reduce these health risks. The presence of an organic
12

cause for a slowing of growth should be ruled out, and an infant with slow growth, may need to be referred to the paediatrician or dietician if growth does not improve (FSAI, 2011). Identification of children who are growing poorly because of under‐nutrition combined with adverse social circumstances is more likely to be achieved by alert observation (by community staff or teachers) than by routine height monitoring. Where there are such combined concerns, referral to social work services may be indicated. Under nutrition also occurs when parents develop fixed ideas about food allergies or when health food enthusiasts offer their children highly unsuitable diets. Occasionally, children respond to chronic distress in the home with a characteristic behavioural syndrome, involving hyperphagia and polydipsia, together with growth failure, abnormal BMI and impaired hormone deficiency (Hall et al, 2009).
3.3.2 Slow or faltering weight gain or growth – supporting parents and caregivers (See Appendix B for Summary information sheet)
Infants have much higher energy needs per kilo than adults. Early weight faltering can happen for all sorts and combinations of factors that limit or interrupt intake.
Where they are unnecessarily worried, (or unworried in some cases) parents will need the child’s growth rates sensitively explained to them, along with support around management of feeding.
To assess faltering weight gain or growth in early infancy: o Take a detailed infant feeding history and assess the child’s growth chart. o When taking the infant feeding history, use empathy, open questions and
reflective feedback; ‘’Can you tell me how feeding is going for you and your baby?’’ “How often is your baby feeding?” ‘’Are there any things that you are concerned about?’’
o Ensure that the infant’s intake is adequate. o For breastfed babies, assess a feed and adequacy of milk transfer. Increase the
frequency of breastfeeds and supplement if necessary with mother’s expressed milk or donor milk.
o It is important to assess the adequacy of artificial infant feeding, the frequency and volumes, and rule out the possibility of feed under concentration.
o Assess any specific infant feeding needs and develop an individual care plan. Provide practical, informational and appraisal support.
o Refer as appropriate, for example to GP, Medical Officer, Paediatrician or Lactation Consultant.
No matter how much food infants appear to be consuming, it has to be balanced with their needs for growth, stores, activity as well as metabolism. They won’t achieve catch up growth if their subsequent intake meets immediate needs only.
Attention should also be paid to how parents are responding to and interpreting their infants hunger cues, as well as their food choices for their babies and toddlers.
Breastfeeding provides complete nutrition for around the first six months of life. However, by 6 months of age an infant’s stores of nutrients such as iron, zinc and some fat soluble vitamins (A and D) are decreasing and nutritional requirements are increasing. Therefore, to support continued growth and development throughout infancy, the introduction of solid foods to the diet is essential (FSAI, 2011).
Infants should be introduced to complementary foods close to 6 months of age. Some infants may require the introduction of complementary foods slightly before 6 months of age to support optimal growth and development. No infant should be introduced to complementary foods before 4 months (17 weeks) of age, unless otherwise specified by a healthcare professional (FSAI, 2011).
13

For toddlers who are faddy eaters or gaining weight slowly the following is often advised: o small meals [x 3 with a savoury and a sweet course] o regular nutritional snacks. o small portions, with second helpings o an encouraging positive approach by parents/care‐giver rather than fussing or
forcing. o limiting distractions o eating together as a family
Please refer to the Food and Nutrition Manual, available at: http://www.hse.ie/eng/services/Publications/services/Children/Unit_7_Food_and_Nutrition_2007.pdf
3.3.3 Overweight and Obesity Obesity in childhood has become a significant public health concern in Ireland as in many other countries. 19% of nine year olds participating in a national longitudinal study (Growing up in Ireland, 2009) were defined as overweight and 7% were obese. One in every four infants aged 3 years and under was overweight or obese, (Growing up in Ireland, 2011). 61.9% of the Irish population is overweight and 25.2% obese (WHO, 2010). One in four children and one in two adults in Ireland is overweight or obese (HSE, 2006) Being overweight or obese contributes significantly to the impairment of health, reduction in the quality of life and increased health care costs. • It is linked to many serious illnesses including type 2 diabetes, heart disease, stroke, high
blood pressure, respiratory disease and certain types of cancer.
• There is a worse prognosis for health when obesity starts in childhood or adolescence (Dept of Health and Children, 2005, HSE, 2006, 2008).
• Other reasons why the issue of childhood obesity is so important are found in studies indicating substantial psychosocial consequences such as: depression, anxiety, lack of self‐esteem and issues with body image. Obese children can be stereotyped as unhealthy, academically unsuccessful, socially inept, unhygienic, lazy and lacking in self control or self restraint (www.dietitians.ca).
The pattern of growth through early life contributes to the risk of excess weight. A baby’s growth rate is in part determined by parental factors, with the period immediately after birth of particular importance. Whether a child is breastfed or not, and at what stage weaning begins, has also been shown to affect the risk of excess weight later in life (HM Government, 2008, p3). Prevention of childhood obesity begins prior to conception. Many factors including a healthy maternal diet and lifestyle during pregnancy depend on parental knowledge, skills and choices about food and physical activity for themselves and their families. Maternal obesity at the point of conception is associated with a 4‐fold greater risk of childhood obesity by the age of four (Whitaker, 2004 in HSE, 2008 p.9). Childhood is a critical period for developing obesity as well as an opportune time to prevent or intervene on it, as eating and activity patterns develop during this period’ (Harper, 2006 in HSE, 2008 p9). Referral should be based on BMI centiles (<2nd or >91st) and/or clinical or parental concern and is indicated for Children with severe obesity in combination with short stature or developmental delay Suspected underlying endocrine and genetic conditions Ill‐health related to overweight and obesity [http://www.hse.ie/eng/services/Publications/services/Children/National_Guidelines_for_Community_Based_Practitioners_on_Prevention_and_Management_of_Childhood_Overweight_and_Obesity.pdf]
14

Parents and guardians are important role models. Interventions that involve parents in a significant way may be particularly effective and can improve parental engagement in active play with children and in their children’s dietary intake (Mc Garvey et al, 2004 in HSE, 2008 p17). Sustained health professional‐led interventions in primary care or community settings, focusing on diet and physical activity, or general health counselling, can support maintenance of a healthy weight (Simkin et al, 2003 in HSE, 2008). Single issue health promotion does not work (HSE, 2006). There is some evidence that primary care staff may hold negative views on the ability of patients to change behaviours, and on their own ability to encourage change (Fuller et al, 2003 in HSE, 2008). Interventions, which provide support and advice on physical activity and diet, are more likely to be effective for weight outcomes than interventions which focus on physical activity alone. Interventions with a greater number of components are more likely to be effective.
3.3.4 Overweight and Obesity – supporting parents and caregivers (See Appendix B for Summary information sheet)
Weight is a very sensitive issue, especially for parents who understandably fear their child being stigmatised at an early age and being judged as bad parents.
Evidence suggests that many parents: o struggle to assess their children’s weight status accurately – research found only
17 per cent of parents with an obese child were able to correctly gauge their child’s weight status (Carnell et al 2005)
o overestimate activity levels and underestimate the amount of high‐fat, high‐sugar foods the family eats
o make no connection between poor diet and low activity levels in their children and long‐term health problems (He and Evans, 2007, HM Government ,2008, p3).
The discussion of a child’s weight might surprise a parent or caregiver, who may not be aware of any growth issues in their child. (www.dietitians.ca).
Even when weight is recognised as an issue by individuals and families, there are many factors which mean it is often ignored. A very significant determinant of obesity is the environment in which we live, which often makes the unhealthy choices more accessible. This environment was termed obesogenic by the World Health Organisation in 1998. Food commercialism, technology, urban and socioeconomic development contribute to the creation of this obesogenic environment, which nurtures over‐eating and inactive lifestyles (HSE, 2008). There are many competing health claims and quick fixes that can be found in the media daily, which can make it difficult and confusing to make a healthy choice. Repetition of everyday behaviours over time can become habits that are very difficult to change later in life. This is of crucial importance when considering the impact of parental behaviour on their children. In a longitudinal cohort study in the UK, only 3% of eight‐year‐old children were found to be overweight/obese when neither parent was, compared to 29% when both parents were obese. A relationship between parental level of obesity and that of their same‐sex offspring was also found (Perez et al, 2009).
Whether you are talking about a child’s underweight or overweight issues, the responses might vary. Some may be glad you brought it up, others upset, in denial, offended or overwhelmed. Examples of conversations to help to started on a non‐judgemental way:
‘’Growth pattern is changing…’’ ‘’It looks like weight is getting ahead of height…’’ ‘’Let’s look at the relationship between his weight and his height…’’
15

Many parents see healthcare professionals as child care authorities. Thus, these professionals have an important opportunity to make parents aware of their child’s excess weight early on to allow time for intervention and prevention. After determining the child's weight status, health‐care professionals have a responsibility to carefully communicate the results to parents and, in an age‐appropriate manner, to the children themselves; provide the information that the families need to make informed decision about physical activity and nutrition; and explain the risks associated with childhood overweight and obesity.
At the individual level, most secondary prevention strategies for childhood obesity include at least a component of: breastfeeding support, dietary changes, age appropriate physical activity, behaviour and social modifications and family participation. The promotion of age‐appropriate sleep durations among children was included as a recommendation in recent Early Child hood Obesity Prevention Policy in the USA. Mounting epidemiologic evidence indicates that short duration of sleep is a risk factor for obesity among all age groups, including infants and children under the age of five (Institute of Medicine, 2011, Cappuccio et al, 2008, Van Cauter and Knutson, 2008).
Behaviours that can be targeted for preventing overweight and obesity include: o breastfeeding o appropriate weaning o enabling child to develop own hunger and satiety response o providing varied and nutrient‐rich food choices o encouraging the drinking of water instead of sugary drinks or juices o ensuring varied and age appropriate physical activity o having family meals together o limiting sedentary behaviour o allowing no more than 1 hour screen time for over 2s [none before] o encouraging good sleeping habits
Careful attention should be paid to minimizing the stigmatization of obesity (Institute of Medicine, 2004). Parents need help to understand that their negative comments and gestures can impact negatively on children and their healthy eating.
Research by Golan et al (1998, 2004, 2006) has shown that a family based approach, with the parents as the sole agents of change, was more effective in treating obesity than the traditional approach where children were the main focus of change.
3.4 Stature
3.4.1 Short Stature A commonly used definition for short stature is where height is below the 3rd centile for the population. However in certain circumstances different definitions may be used. Height below the genetic potential for the family and height falling to lower centiles also warrants investigation (Hindmarsh, 1996). Parents are more likely to worry about short stature than about excessive growth in height. Children with hormonal deficiencies and other disorders affecting growth need these to be diagnosed and treated as early as possible, to minimize potential deficits. Height and weight should be measured, and plotted on a chart whenever a question is raised by parents or professionals about the child’s general health or growth and this should be a routine procedure in the follow up of children with chronic disorders or disabilities. A single measurement will identify children who are extremely short or tall – outside the limits of the 0.4 and 99.6 centiles. Every child should have their height measured and plotted at school entry. A single measurement however, cannot identify those who are within the normal range for height, but are growing more slowly than normal. This could be due to:
16

Genetic and familial influences
Intrauterine growth retardation
Neglect, abuse
Under‐nutrition
Other causes e.g. coeliac disease, inflammatory bowel disorder or chronic renal failure
Hypothyroidism
Growth hormone insufficiency
Cranial or total body irradiation and intracranial tumours
Syndromes e.g. Russell‐Silver
Bone dysplasia
Serial measurements as a way of detecting children with occult growth problems are difficult because children do not grow at the same rate all the time and precision of each measurement is crucial.
3.4.2 Tall Stature Tallness or excessively fast growth is a rare complaint before puberty. Tall stature may occur in thyrotoxicosis, congenital adrenal hyperplasia, premature sexual maturation, Marfan’s Syndrome, etc (Hall and Elliman, 2003).
3.4.3 Parental influence on stature Common sense suggests that one might reasonably be more worried about the short child who has tall siblings and tall parents. If parents themselves raise this issue they should be taken seriously. There are several ways of adjusting a child’s height measurement to take account of the parent’s and /or siblings’ heights; however there are several points that must be taken into consideration: This calculation is only relevant when the parents are the biological parents A parent’s estimate of their own height is unreliable, and estimates of their partner’s
height even more so. Their heights must be checked. The relationship between a child’s height and the heights of his or her parents are not
constant for all members of every population at all times. Parents may be short because of deprivation and poverty in childhood, or one or both of them may have a condition that is also affecting the child.
The child’s growth may need to be monitored for at least a year if there is significant concern, even if the parental height correction is reassuring. Correcting the heights of short children for their parents’ heights may result in not referring several children who, in fact, have a growth disorder.
Correcting for parental height is useful but it is not considered that it provides sufficient evidence to dismiss concerns about short or tall stature in the child. If the primary care team or the parents are concerned about a child’s growth, the child should be referred for further assessment (Hall et al 2009).
Note that when plotting parental heights on a child’s chart a correction is required to account for the gender difference of 12.5cm between the genders. This means that a father’s height should be reduced by 12.5cm when plotted on a daughter’s chart and a mother’s height should be increased by 12.5cm when plotted on a son’s chart for consideration.
17

4. Measurement
4.1 Issues in Measurement
4.1.1 Accuracy In assessing growth, accuracy is a key consideration. An accurate measurement is one, which is precise and unbiased (Daly et al, 1991). “Bias is a result of a systematic error which tends to make the actual recording of a measurement consistently above (or below) the true value, (call it error if the true value of the measurement is known otherwise its called variation)”. An accurate measurement is one, which can vary very little (precise) around the true value (unbiased) of what is being measured.
Accuracy of Results
Observer variation
Instrument variation
Subject variation
Within observer ‐precision
Response, sensitivity ‐ precision
Random, biological ‐ precision
Between observer ‐bias
Incorrect calibration, Faulty mechanism ‐ bias
Systematic, temporal ‐ bias
(Daly et al, 1991) Observer variation: has a major impact on measurement accuracy. Intra‐observer (within the observer) variation reflects the differences by a single measurer on different occasions. It does not cause bias but does affect precision e.g. misreading. The variation within observers is assumed to be random. Inter‐observer variation, that is, variation between observers can bias results. It can be due to: Different criteria for making a measurement Different techniques – lying/standing Different observational methods Different methods of recording e.g. digit preference, rounding up/down and also errors
in plotting or interpreting measurements (Cooney et al, 1994 ) These errors can be reduced by standardisation of methods and training.
Instrument variation – bias often due to faulty equipment or calibration. This is avoided by proper installation and careful maintenance of equipment. Equipment should be tested regularly, maintained and calibrated in accordance with manufacturer’s recommendations. Subject variation – this is random or biological subject variation. Height varies within the same child during the course of the day with height decreasing as the day progresses. Measurements should be taken at approximately the same time of day under the same conditions. An experienced measurer can expect to have a small degree of variation of 0.25 cm, but if different measurers are measuring the same child the difference can be up to 1.5 cm (Voss et al, 1990). These errors can be reduced by standardisation of methods and training.
4.1.2 Measuring Technique and Equipment Accuracy in growth measurement is essential. The major sources of variation shown above, affect the accuracy of growth measurements. Accuracy can be improved in the following ways:
18
Instrument variation is minimised by the use of appropriate equipment that is regularly
calibrated and maintained. Subject Variation is minimised by taking measurements at approximately the same time
of day under the same conditions. These errors can be reduced by standardisation of methods and training.
Observer variation can be reduced by standardisation of methods and training. The appropriate measuring equipment should be used. The recommended Equipment is: Electronic self zeroing scales, Grade 3 clinical electronic scales in metric setting Supine length measure (infantometer or baby mat) Leicester height measure (self calibrating)/ stadiometer
Non‐stretchable/ lassoo 0.5cm tape for head circumference 4.1.3 Training in growth measurement Measurements must be taken by a trained measurer. Training in accurate measurement is fundamental and should be provided by those with expertise in growth monitoring. Training must include training in the use of the recommended equipment. This ideally requires an interactive workshop training and practice session on all aspects from equipment assembly, to positioning the child, taking a measurement, calculating age, plotting the data on a centile chart and interpreting the end result. In addition those who will undertake measurement require background training on normal growth and its influencers, calculation of mid parental height, growth disorders, growth interpretation, the importance of accurate measurements, the basis and limitations of centile charts, the use of centile charts and when to request further referral.
4.2 Measuring
4.2.1 Measuring Weight Babies should be weighed without any clothes or nappy with the scales placed on a hard surface. A baby’s true weight may fluctuate by several hundred grams, depending on the contents of the bowel, bladder and stomach as well as minor fluctuations due to intercurrent illness (Hall and Elliman, 2003). As far as possible, babies should be weighed at the same time on each occasion and consistently before or after a feed. Children older than two years can be weighed in vest and pants, but no shoes, footwear, dolls or teddies in hand. Self‐zeroing electronic scales are the BHFC standard. Where Grade 3 clinical electronic scales in metric setting are used they should have a green sticker with background letter M (approved for medical use). Scales should meet EC standards (Directive 90/384/EEC). Scales should be calibrated and maintained annually.
4.2.2 When to weigh infants Babies usually need to be weighed at:
– Birth and 6‐8 weeks – opportunistic times include: immunisations and surveillance checks
After the first 2 weeks, if well, weights are required only at time of routine reviews. Too frequent weighing is often considered counterproductive, and may lead to unnecessary worry among parents. If weights are recorded at intervals too close together, natural variability and measurement error will be greater than potential weight gain in that period, and can therefore be misleading. This should be taken into account when closer monitoring is required. Where
19
there is a concern about growth, the following is a guide to the appropriate time interval to allow between measurements: 2 weeks apart under 3 months of age, 4 weeks apart over 3 months of age, 3 months apart over 1 year of age. Weighing in the neonatal period Weigh within the first week as part of the assessment of feeding.
– Early weighing does not discourage breast‐feeders and may help identify problems in a timely manner
– Weigh thereafter as needed Assess early weight gain relevant to birth weight.
– Most babies lose some weight after birth – Recovery of birth weight indicates that feeding is effective and that the child is
well – If large weight loss or still below birth weight at 2 weeks, calculate % weight loss
4.2.3 Weight Loss Calculating Percentage Weight Loss It is good practice to calculate percentage weight loss in order to check exactly how much weight an infant has lost. Weight loss can be calculated as follows. Weight Change/ loss = current weight – birth weight e.g. (2.700 kg – 2.900kg) = −200kg. This is a fall of 200g.in weight. Percentage Weight Loss = Weight loss ÷ Birth weight x 100% For example:› A child born at 3.500kg who drops to 3.150kg at 5 days has lost 350g or 10% (0.35 ÷ 3.5 x 100).› In a baby born at 3.000kg, a 150g loss is 5% (0.15 ÷ 3.0 x 100).
Assessing neonatal weight loss A weight loss of 10% or more at any stage needs careful assessment for feeding problems or unrecognised illness. Most babies lose some weight after birth but more than 80% will have regained this by 2 weeks of age. Recovery of birth weight by 2 weeks suggests that feeding is effective and that the child is well. Fewer than 5% of babies lose more than 10% of their weight at any stage, and only 1 in 50 is 10% or more lighter than birth weight at 2 weeks.
4.2.4 Measuring Head Circumference Head circumference should be measured using a narrow non‐ stretchable plastic or disposable paper tape. If plastic, clean the tape with soapy water between children. Measurement should be taken at the maximal occipito‐circumference where the head circumference is widest (See figure below) and using the largest of three measurements. Record measurement to the nearest 0.1 cm.
20

4.2.5 Measuring Length and Height
ord measurement to the nearest 0.1 cm. ideally; btain 3 separate measurements for accuracy.
measurement to the nearest 0.1cm. Ideally; obtain 3 separate measurements for ccuracy. Measure length or heig , whenever concerned
about weight gain, growth or development.
Length Measure length before age 2 years of age if concerned. Use proper equipment (length board or mat) as any other method is too inaccurate. Length should be measured without nappy or footwear. To measure an infant’s supine length, one trained person and a caregiver, must use calibrated length board with fixed head piece and a movable foot piece. Infant should be placed on his back and lying flat. Both legs should be extended and toes pointing upwards with feet flat against the foot piece of the length board. Reco
Height Height should be measured from ages 2 years when a child can weightbear independently, using a stadiometer (e.g Leicester Height measure). It takes one measurer and one other adult to measure. The child should be standing with his or her back against the stadiometer, ensuring the 4 points of contact are touching the piece (heels, bottom, back and head) without shoes. He or she should have their heels together, legs straight, arms at sides, shoulders relaxed and eyes looking straight ahead. Ensure the child does not try to stretch up. Measure on expiration. Record thea
ht and head circumference along with weight
21

5. Plotting on Growth Charts
5.1 Centile Charts
5.1.1 What do the centiles show? The lines on a growth chart are called centile lines, and are based on the measurements from
many children. Centile lines show the optimum range for weight and heights. It describes the percentage of children expected to be below that line; 50% below 50th centile, 91% below the 91st centile and 1 in 250 below the 0.4th centile. Half of all children should be between 25‐75th centile.
Centile terminology If the point is exactly on the centile line, or within ¼ of a space of the centile line, the child is described as being ‘on the X centile’ (see A below) e.g. on the 91st centile. If not they should be described as being ‘between centile X and Y’ (see B below) e.g. between the 75th ‐91st centile.
Centile spaces A ‘centile space’ is the distance between two centile lines (e.g. C). Two measurements can be described as a centile space apart if they are both midway between centiles (e.g. D). Falls or rises should be expressed as multiples of centile spaces (e.g. a fall through 2 ½ centile spaces).
5.1.2 Recording on the chart Record the measurement and the date in ink and then plot in pencil. When plotting on the chart use a dot and do not join up. Age errors are the commonest source of plotting mistakes so use a calendar to calculate age: age is to be recorded in weeks for first 6‐12 months and calendar months thereafter.
5.2 Plotting
5.2.1 Plotting full‐term infants using the new UK‐WHO growth charts The birth weight centiles are based on UK 1990 data. WHO charts start from 2 weeks. There are no centile lines between birth (0 weeks) and 2 weeks of age. This allows for weight loss and regain during this period. Length and head circumference centiles have the same gap.
22
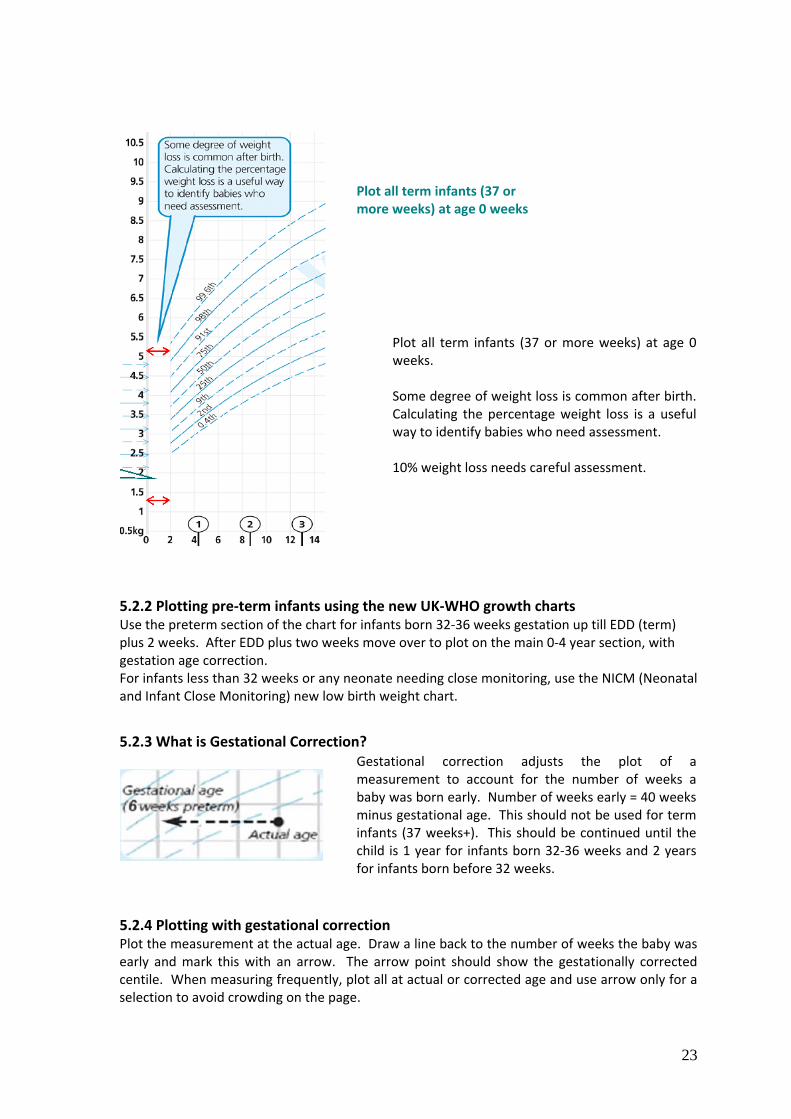
Plot all term infants (37 or more weeks) at age 0 weeks
Plot all term infants (37 or more weeks) at age 0 weeks. Some degree of weight loss is common after birth. Calculating the percentage weight loss is a useful way to identify babies who need assessment. 10% weight loss needs careful assessment.
5.2.2 Plotting pre‐term infants using the new UK‐WHO growth charts Use the preterm section of the chart for infants born 32‐36 weeks gestation up till EDD (term) plus 2 weeks. After EDD plus two weeks move over to plot on the main 0‐4 year section, with gestation age correction. For infants less than 32 weeks or any neonate needing close monitoring, use the NICM (Neonatal and Infant Close Monitoring) new low birth weight chart.
5.2.3 What is Gestational Correction? Gestational correction adjusts the plot of a measurement to account for the number of weeks a baby was born early. Number of weeks early = 40 weeks minus gestational age. This should not be used for term infants (37 weeks+). This should be continued until the child is 1 year for infants born 32‐36 weeks and 2 years for infants born before 32 weeks.
5.2.4 Plotting with gestational correction Plot the measurement at the actual age. Draw a line back to the number of weeks the baby was early and mark this with an arrow. The arrow point should show the gestationally corrected centile. When measuring frequently, plot all at actual or corrected age and use arrow only for a selection to avoid crowding on the page.
23

5.2.5 Transfer preterm to infancy section
For babies born 6 weeks preterm, plot on preterm section of chart until 42 weeks (EDD +2).
tion can confuse these issues. It needs to be made clear which plots are adjusted
charts alone, or in conjunction with specific growth curves that exist for some of the disorders.
Then plot on infancy section using gestational correction.
Weight faltering in infant born at 34 weeks? Or are the plots in the wrong place? Failure to allow for gestafor gestation.
5.2.6 Specialised growth charts The only specialised growth charts currently available as part of the UK suite of charts are those for infants with Down syndrome and new versions of these charts [derived from UK and Irish data] are now available from www.rcpch.ac.uk, and are recommended for use. Other specific charts may exist for children with intellectual, developmental, genetic or other disorders or condition and they may show growth patterns different from healthy children. It is recommended that children’s growth be monitored by using either the UK‐WHO growth
24

6. Interpreting Growth Charts
6.1 What is normal?
6.1.1 What is the normal rate of weight gain? Weight usually tracks within one centile. If there is large weight loss at any time, calculate percentage weight loss. 10% weight loss needs careful assessment. In acute illness weight loss and weight centile fall and a child’s weight usually returns to its normal centile within 2 to 3 weeks. Less than 2% of children will show a sustained drop through two or more weight centile spaces on the new WHO charts. These children should be assessed by the primary care team, including measuring length/height.
6.1.2 Length measurements commonly show wide variation Measured length will vary in same child depending on mood of child and style of measurer
6.1.3 Length & Height Changes at 2 years When a child is measured standing up, the spine is squashed a little so the child may appear shorter. The UK/WHO charts shift down slightly to account for this when measuring height standing for the first time.
6.2 Adult height prediction Parents like to know how tall their child will be as an adult. The child’s most recent height centile (aged 2–4 years) gives a good idea of this for healthy children. Plot this centile on the adult height predictor to the right of the height chart to find the average adult height for children on this centile.
Four out of five children will have adult heights that are within 6cm above or below this value (Ref UK‐WHO 0‐4 year growth charts).
For example:
If a child is on the 75th centile for height, the Adult Height Predictor suggests they may reach an adult height of 181cm (+‐ 6) cm
25
6.3 Body Mass Index (BMI) BMI can be used as a measure of overweight / underweight and to assess weight relative to height in children over 2 years. BMI = weight (kg) divided by height (m) squared.
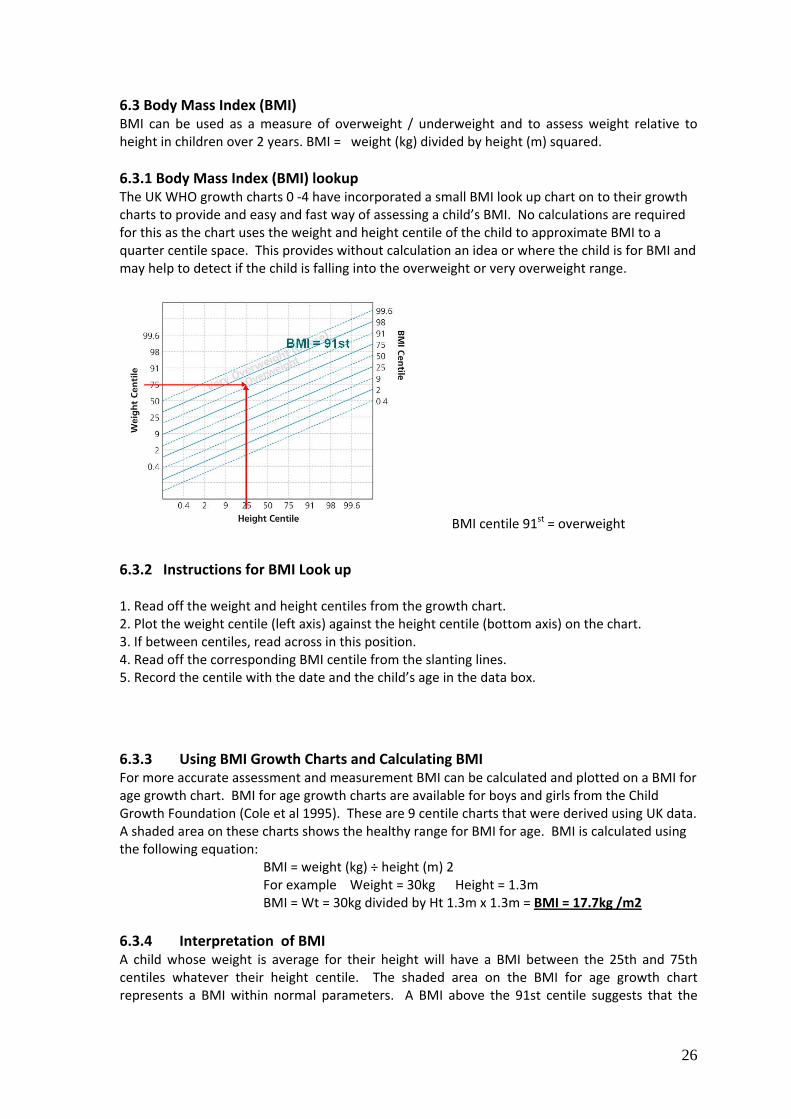
6.3.1 Body Mass Index (BMI) lookup The UK WHO growth charts 0 ‐4 have incorporated a small BMI look up chart on to their growth charts to provide and easy and fast way of assessing a child’s BMI. No calculations are required for this as the chart uses the weight and height centile of the child to approximate BMI to a quarter centile space. This provides without calculation an idea or where the child is for BMI and may help to detect if the child is falling into the overweight or very overweight range.
BMI centile 91st = overweight
6.3.2 Instructions for BMI Look up 1. Read off the weight and height centiles from the growth chart. 2. Plot the weight centile (left axis) against the height centile (bottom axis) on the chart. 3. If between centiles, read across in this position. 4. Read off the corresponding BMI centile from the slanting lines. 5. Record the centile with the date and the child’s age in the data box.
6.3.3 Using BMI Growth Charts and Calculating BMI For more accurate assessment and measurement BMI can be calculated and plotted on a BMI for age growth chart. BMI for age growth charts are available for boys and girls from the Child Growth Foundation (Cole et al 1995). These are 9 centile charts that were derived using UK data. A shaded area on these charts shows the healthy range for BMI for age. BMI is calculated using the following equation:
BMI = weight (kg) ÷ height (m) 2 For example Weight = 30kg Height = 1.3m BMI = Wt = 30kg divided by Ht 1.3m x 1.3m = BMI = 17.7kg /m2
6.3.4 Interpretation of BMI A child whose weight is average for their height will have a BMI between the 25th and 75th centiles whatever their height centile. The shaded area on the BMI for age growth chart represents a BMI within normal parameters. A BMI above the 91st centile suggests that the
26

child is overweight. A BMI above the 98th centile is very overweight (clinically obese). A BMI below the 2nd centile is unusual and may reflect under‐nutrition.
6.4 Interpreting possible problems 6.4.1 When should a single measurement trigger assessment? There is no single threshold below or above which a child’ weight or height is abnormal. Further assessment is needed for a child with measurements below 0.4th centile or a child weight is above 99.6th centile plus other concern. If a child’s weight is above 99.6th centile after the age of 2, look‐up BMI centile. If a child’s height is above 99.6th centile plus other concerns.
6.4.2 Other possible problems (A) A Flat line A flat growth line indicates a possible growth concern.
(B) Surfing away from the 50th centile A gradual surfing away from the 50th centile for weight, with height increasing steadily along the same percentile range also indicates a need for further assessment, unless these changes are clearly justified by parental size. These trends should be red flagged for further investigation and follow‐up.
(C) Sharp or gradual incline A sudden or gradual incline on BMI for age may indicate excessive weight gain and warrants investigation.
(D) Sharp decline A sharp decline on the growth chart indicates a need for further investigation.
27

7. Referral criteria
7.1 Screening and referral Setting the “reaction points” or “cut‐off points” in the growth monitoring programme dictates the sensitivity and specificity of screening. That is, to apply the 0.4th centile as the cut‐off point for short stature will increase the likelihood of a child who is below the 0.4th centile having a growth abnormality, but will increase the risk of missing a child with disordered growth (number of false negative or missed cases). It would be expected that 1 child in 260 will be below the 0.4th centile (2.67 SD) line. Setting the 3rd centile as the cut‐off reduces the likelihood of missing or delaying the presentation of those with short stature, but will increase the number of false positives, that is, children referred as having a possible growth disorder whose growth is normal (Hindmarsh,1996). Centile based “cut‐offs” for referral criteria are arbitrarily chosen statistical reference points, which aim to balance optimal detection of true positive cases (growth disorders) while minimising false positives thereby avoiding unnecessary investigation of normal children within the limited capacity of the healthcare system. Additional information such as height velocity or measured parental heights would improve the sensitivity and specificity of the programme (Hindmarsh and Cole, 2004). The inclusion of such data was discussed but was not thought feasible at this time. The choice of referral criteria is controversial in all screening programmes. The endocrinologists participating in the growth symposium (2005) developing the referral criteria had strong views suggesting the 3rd percentile be selected as the cut‐off point to improve early detection and referral for those with growth disorders. There is concern that choosing the 0.4th centile will result in missing some children with pathological causes of short stature including Turner syndrome, celiac or thyroid disease etc. Concern has also been raised in the UK that this cut‐off is too strict also (Agwu et al, 2004). However, the consensus view was that the 0.4th percentile be chosen in the first instance. The effect of monitoring using this cut point is to be systematically audited with commitment to revision of the cut‐off if children are being missed and presenting late. This programme is to be welcomed as providing the national evidence base on which we can evaluate the appropriate referral criteria. In addition, it must be recognised that other factors influence growth such as, familial growth potential using parental heights and tempo of puberty which are not systematically part of the monitoring programme. As a result it has been agreed that children must be referred at any time if there is clinical concern or parental concern about their growth irrespective of their centile line. Communication of growth concerns to family and GP is a vital component of the programme. Continuing evaluation and audit of the programme is vital to ensure that this programme continues to be appropriate to Irish children The referral criteria are drawn from a number of sources and updated accordingly. They include the original referral criteria as outlined in the Growth Monitoring Training Module, 2005 edition along with additional indicators suggested by the UK‐WHO 0‐4years growth chart information and by The HSE National Guidelines for Community Based Practitioners on Prevention and Management of Childhood Overweight and Obesity (2006).
28

7.2 Referral Criteria
Below 0.4th centile for weight, length and height
Sustained weight drop over 2 or more centile spaces.
Below 0.4th centile or above 99.6th centile for head circumference, or a drop or rise through 2 or more centile spaces after first few weeks of life
Above 99th centile for height plus other concerns
Below 2nd centile or above 91st centile for BMI (over 2 years of age)
Parental or professional concern Any child whose measurements are outside the projected centiles should be considered for further evaluation and/or specialist referral. NB Referrals should be considered only when there are two or more readings of concern with an appropriate time interval between measurements e.g. 2 weeks apart under 3 months of age, 4 weeks apart over 3 months of age, 3 months apart over 1 year of age.
In some cases, unusual height or weight patterns may be suggestive of underlying conditions and might prompt early referral e.g. Severe obesity with short stature or development delay Ill health associated with weight gain or obesity
7.3 Referral Pathway Pending the development of nationally agreed referral guidelines ,referrals should be made in the first instance to the Community Medical Officer or GP, then to the local paediatric service if no clear cause for the problem is identified. The only exception would be direct referral of children to a local primary care service for obesity when those services are available.
29

8. Summary of National Standards in Growth Monitoring
8.1 Rationale The potential benefits of growth monitoring are:
Health Promotion
Early intervention in growth disorders
Identification of and early intervention in chronic disorders associated with abnormal growth
Reassurance to parents
Epidemiological data collection There is insufficient evidence to recommend screening for overweight and obesity, but growth monitoring data can be used to establish prevalence rates.
8.2 Recommendations
Reduced number of mandatory growth monitoring assessments (birth, 6 to 8 week check and school entry), but children should be weighed at opportunistic times including birth, at immunisations and during child health surveillance checks.
Focus on accuracy of measurement, documentation and interpretation of findings.
8.3 Equipment
Electronic self zeroing scales Supine length measure (infantometer or baby mat)
Thin non stretchable tape measure
Leicester height measure (self calibrating)
Nine centile charts
8.4 Referral Criteria and pathway
Below 0.4th centile for weight, length and height
Sustained weight drop over 2 or more centile spaces.
Below 0.4th centile or above 99.6th centile for head circumference, or a drop or rise through 2 or more centile spaces after first few weeks of life
Above 99th centile for height plus other concerns
Below 2nd centile or above 91st centile for BMI (over 2 years of age)
Parental or professional concern Any child whose measurements are outside the projected centiles should be considered for further evaluation and/or specialist referral. NB Referrals should be considered only when there are two or more readings of concern with an appropriate time interval between measurements e.g. 2 weeks apart under 3 months of age, 4 weeks apart over 3 months of age, 3 months apart over 1 year of age. In some cases, unusual height or weight patterns may be suggestive of underlying conditions and might prompt early referral e.g.
- Severe obesity with short stature or development delay
- Ill health associated with weight gain or obesity Pending the development of nationally agreed referral guidelines, referrals should be made in the first instance to the Community Medical Officer or GP, then to the local paediatric service if no clear cause for the problem is identified. The only exception would be direct referral of children to a local primary care service for obesity when those services are available.
30
References
Agwu, J., Leishenring, A. and Darnley,I. (2004) Community growth monitoring in practice. Archive of Disease in Childhood, 89:394‐395.
Blair,P., Drewett, R.,Emmettt, P., Ness, A. and Emond, A.(2004), Family, socioeconomic and prenatal factors associated with failure to thrive in the Avon Longitudinal Study of Parents and Children (ALSPAC) International Journal of Epidemiology, 33 (4): 839‐847. Cappuccio, F.,Taggart, F., Ngiana‐Bakwin, K., Currie, A., Peile, E., Stranges, S. and Miller, M. (2008) Meta‐Analysis of Short Sleep Duration and Obesity in Children and Adults. Sleep, 31(5): 619–626.
Carnell, S., Edwards, C., Croker, H., Boniface, D. and Wardle, J.( 2005) Parental Perceptions of overweight in 3‐5year olds. International Journal of Obesity, 29, 353–355.
Cooney, K., Pathak, U. and Watson, A. (1994) Infant growth charts. Archive of Disease in Childhood, 71: 159‐160. Daly, l., Bourke, G. and McGilvray, J. (1991) Interpretation and use of Medical Statistics, Oxford: Blackwell.
Denyer, S., Thornton, L and Pelly, H. (1999) Best Health for Children: developing a partnership with Families (1999). Manorhamilton: National Conjoint Child Health Committee, Health Board Chief Executive Officers.
Department of Health and Children (2005) Breastfeeding in Ireland; a five‐year strategic action plan‐National Committee of Breastfeeding, DOHC. http://www.dohc.ie/publications/pdf/Bfeed_actionplan.pdf Department of Health and Children (2005) Obesity: The Policy Challenges. The Report of the National Taskforce on Obesity. Dublin: Government Stationary Office. FSAI, (2011) Scientific Recommendations for a National Infant Feeding Policy, (2nd Edition). Dublin, Food Safety Authority. Fuller, T., Baskett‐Milburn,K. and Hopton J.(2003) Healthy eating: the views of general practitioners and patients in Scotland. American Journal of Clinical Nutrition, 77(suppl), cited in HSE (2008) Framework for Action on Obesity 2008‐12. Golan,M., Kaufman, V., Fainaru,M. (2006) Childhood obesity treatment: targeting parents exclusively v. parents and children. The British Journal of Nutrition, 95: 5: 1008‐1015.
Golan, M. and Crow, S. (2004) Targeting parents exclusively in the treatment of childhood obesity: long‐
term results. Obesity Research, 12(2): 357‐361.
Golan,M., Weizman,A., Apter, A. amd Fainaru, M (1998) Parents as the exclusive agents of change in childhood obesity The American Journal of Clinical Nutrition, 67(6) : 1130‐1135. Goldberg. J. and Hellwig, J. (1997) Nutrition Research in the media: The challenge facing scientists. Journal of American College of Nutrition, 16(6): 544 550, in DoHC 2005 Obesity Report. Growing Up in Ireland (2009) Key findings from the Child Cohort 2009. http://www.growingup.ie/fileadmin/user_upload/documents/Update_Key_Findings/Key_Findings_4.pdf. accessed June 2012. Growing Up in Ireland (2011); Key findings from the Infant Cohort [at three years]
31

http://www.growingup.ie/fileadmin/user_upload/documents/Conference/2011/Growing_Up_in_Ireland_‐_The_Health_of_3‐Year‐Olds.pdf accessed June 2012. Hall, D. and Elliman, D. (2003) Health for All Children, (4thEdition), Oxford: Medical Publications. Hall, D., Williams, J. and Elliman, D. (2009) The Child Surveillance Handbook (3rd ed.). London: Radcliffe Publishing. Harper M. (2006) Childhood obesity: strategies for prevention. Family Community Health, 29: 288‐298, cited in HSE (2008) Framework for Action on Obesity 2008 – 2012. He, M. and Evans, A. (2007) Are parents aware that their children are overweight or obese: do they care? Canadian Family Physician, 53 (9): 1493–1499. Hindmarsh, P. (1996) Monitoring Children’s Growth, British Medical Journal, 312:122. Hindmarsh, P. and Cole, T. (2004) Height monitoring as a diagnostic test. Archive of Diseases in Childhood, 89: 296‐ 297. HM Government (2008) Healthy Weight, Healthy Lives: A cross governmental strategy for England. UK, Department of Health. Hoey, H., Tanner, J. and Cox, L. (1987) Clinical growth standards for Irish children. Acta Paediatrica Scandinavica: Suppl, 338: 3‐31. HSE (2008) Framework for Action on Obesity 2008 ‐ 2012 http://www.getirelandactive.ie/content/wp‐content/uploads/2011/12/HSE‐Framework‐for‐Action‐on‐Obesity.pdf, accessed June 2012. HSE (2007) Training Programme for Public Health Nurses and Doctors in Child Health Screening, Surveillance and Health Promotion, Unit 7: Food and Nutrition [Training Manual]. http://www.hse.ie/eng/services/Publications/services/Children/Unit_7_Food_and_Nutrition_2007. pdf HSE (2006) National Guidelines for Community Based Practitioners on Prevention and Management of Childhood Overweight and Obesity: Evidence review and recommendations for good practice. Health Service Executive.
HSE(2005) Best health for children revisited: report from the National Core Child Health Programme Review Group to the Health Service Executive. Institute of Medicine, 2011: www.iom.edu/reports2011/Early‐Childhood‐Obesity‐Prevention‐policies.aspx accessed 2012‐06‐20. Lucas,P., Arai, L., Baird, J., Kleijnen, J., Law, C. and Roberts, H. (2007) A systematic review of lay views about infant size and growth. Archive of Disease in Childhood, 92:120‐127. Mc Garvey, E., Keller, A., Forrester, M.(2004) Feasibility and benefits of a parent focused preschool child obesity intervention, American Journal of Public Health, 94(9):1490‐95, cited in HSE, (2008) Framework for Action on Obesity 2008‐12. Mohrbacher, N.(2010) Breastfeeding Answers Made Simple: A Guide for Helping Mothers. Amarillo, TX: Hale Publishing.
National Research Council (2005). Preventing Childhood Obesity: Health in the Balance. Washington, DC: The National Academies Press.
32

Perez‐Pastor, E., Metcalf, B., Hosking, J., Jeffery, A., Voss, L. and Wilkin, T.(2009) Assortative weight gain in mother–daughter and father–son pairs: an emerging source of childhood obesity. Longitudinal study of trios International Journal of Obesity, 33: 727‐35. RCPCH (Royal College of Paediatrics and Child Health) http://www.rcpch.ac.uk/growthcharts SACN (Scientific Advisory Committee on Nutrition) and RCPCH (Royal College of Paediatric and Child Health) (2007) Application of the New Growth Standards in the UK, London: TSO. SACN/RCPCH (2012) Consideration of issues around the use of BMI centile thresholds for defining underweight, overweight and obesity in children aged 2‐18 years in the UK. Position Statement. Simkin‐Silverman LR, Wing RR, Boraz MA et al. 2003. Lifestyle intervention can prevent weight gain during menopause ‐ results from a 5‐tier randomized clinical trial. Annals of Behavioural Medicine 26: 212‐20 cited in HSE (2008) Framework for Action on Obesity, 2008 – 2012. Van Cauter, E. and Knutson, K. (2008) Sleep and the epidemic of obesity in children and adults European Journal of Endocrinology, 159 Suppl 1:S59‐66. Voss et al. (1990) The reliability of height measurement (The Wessex Growth Study) Arch DisChild, 65:1340‐1344. Whitaker ,R. (2004). Predicting preschooler obesity at birth: the role of maternal obesity in early pregnancy. Pediatrics,.114 (1):e29‐36, cited in HSE (2008) Framework for Action on Obesity, 2008 ‐ 2012 WHO (2006) WHO Child Growth Standards. Acta Pædiatrica, 2006; 450: 1-101. http://www.who.int/childgrowth/standards/en accessed on 30.6.12. World Health Organisation NCD country profiles 2011, http://www.who.int/nmh/countries/irl_en.pdf Wright, C. (2000) Identification and Management of Failure to Thrive: a community perspective. Archive of Disease in Childhood, 82: 5–9. Wright, C. and Weaver, L. (2007) Image or reality: why do infant size and growth matter to parents. Archive of Disease in Childhood, 92: 98‐100. www.dietitians.ca: http://www.dietitians.ca/Knowledge‐Center/Events‐and‐Learning/Online‐Courses/WHO‐Growth‐Chart‐Training.aspx
33

Appendix A Standard for Good Clinical Practice in Growth Monitoring
(Mandatory growth assessments highlighted in bold) Timing History Examination Equipment Health Education
Birth Gestational age Low birth weight (LBW) Dysmorphic features Major medical problems Parental concerns Professional concerns
Weight (naked) in kg Length in cm Head circumference in cm
Electronic self‐ zeroing scales Supine length measure (infantometer or baby mat) Thin non stretchable measure tape UK‐WHO Growth charts
Breastfeeding support* Nutritional advice Infant care
Postnatal visit within 48 hours of hospital discharge
Gestational age LBW Dysmorphic features Major medical problems Parental concerns Professional concerns
Weight (naked) in kg Length in cm Head circumference in cm
Electronic self‐ zeroing scales Supine length measure Thin non stretchable measure tape Age calculator to correct for prematurity (infants born before 36 weeks gestation) UK‐WHO Growth charts
Breastfeeding support Nutritional advice Infant care Floor play
6 to 8 weeks As for postnatal visit Weight (naked) in kg Length in cm Head circumference in cm
As for postnatal visit Breastfeeding support Nutritional advice Infant care Floor play
3 months As for postnatal visit Weight (naked) in kg Head circumference in cm Length in cm
As for postnatal visit Breastfeeding support Nutritional advice Infant care Weaning Floor play
7 to 9 months As for postnatal visit Weight (naked) in kg Head circumference in cm Length in cm
As for postnatal visit Breastfeeding support Nutritional advice Infant care Weaning Physical activity guidelines
18 to 24 months As for postnatal visit Weight (light clothing) in kg Height in cm
Leicester Height Measure (self calibrating) Electronic self‐ zeroing scales UK‐WHO Growth charts
Breastfeeding support Nutritional advice Active play
3.25 to 3.5 years Medical history Parental concern Professional concern
Weight (light clothing) in kg Height in cm
Leicester Height Measure (self calibrating) Electronic self‐ zeroing scales UK‐WHO Growth charts
Nutritional advice Active play
School entry (Junior Infants)
Parental concern Professional concern Health questionnaire to elicit underlying chronic illness
Weight in kg (light clothing) Height in cm BMI for epidemiological purposes
Leicester Height Measure (self calibrating) Electronic self‐ zeroing scales Growth charts"
Nutritional advice Active play
Italics indicate non mandatory growth assessments for healthy infants and children, However it is accepted good clinical practice for infants and children to be weighed and measured at these opportunistic times.
34

Appendix B
Health Practitioners: Summary actions when working with Parents/Care‐givers to support Optimal Growth
Share health promotion messages regarding growth of children at the earliest possible time and opportunistically at developmental assessments/ immunisation contacts.
Interpret growth charts and growth patterns and explain the child’s growth rates sensitively to parents.
Commend parents when a child is growing well and reinforce the actions they are taking that are supporting this.
Counsel parents about growth patterns that may indicate a risk and how to change behaviours that may lead to unhealthy growth patterns (see Appendix B Nutrition and Appendix C Activity Factsheets).
Support exclusive breastfeeding of infants for the first 6 months, and continuation of breastfeeding, in combination with suitably nutritious and safe complementary foods – semi‐solid and solid foods – until children are 2 years of age or beyond (Dept of Health and Children, 2005).
All infants, regardless of how they are fed, should be weaned onto solids at about six months of age unless otherwise medically indicated. No infant should be introduced to solids before 4 months of age.(FSAI, 2011 (‘Scientific Recommendations for a National Infant Feeding Policy, 2nd Edition’)).
Advise parents to remember that a child signals when they have had enough to eat. A child should not be bribed, coaxed or forced to ‘clean their plate’.
Advise parents that foods primarily based on added fat and sugar and/or contain added salt e.g. fried foods, crisps, confectionary, sauces/gravies and processed meats are unsuitable for infants and children. Additionally, a child’s stomach has a small capacity for food and empty calorie snacks will displace nutritious savoury and plain foods in a child’s diet.
Highlight to parents that food should not be used as a reward. Offering a pudding or sweet course as a reward will make these foods more desirable.
Discuss the child’s feeding pattern and food behaviour, food and drink types, family meals and a typical day. (Refer to the HSE(2007) Unit 7 Nutrition Manual and resources section)
Support eating together as a family. Parents can set a good example by eating with their child as often as possible and providing nutritious meals low in salt, fat and sugar. Advise parents that food labels can be helpful when choosing healthy options for family meals.
Discuss floor play (babies), physical activity (toddlers and older children), sedentary behaviours (TV, computer games), family physical activities and a typical day (Appendix C)
35

Communicate the physical activity guidelines for children: at least 60 minutes moderate activity daily (Appendix C).
Encourage parents to be aware of the advertising messages relating to food and activity or sedentary behaviour that their child/ren may be exposed to. The media is powerful in influencing food selection and health behaviours .
Support family being active together; getting out‐and‐about, having a ‘turn‐off‐the‐TV’ day, taking a walk or cycle together.
Encourage parents to seek information on the nutrition, and the opportunities to be physically active, provided for at their child’s childcare, pre‐school or school.
Also…….when a child has slow or faltering weight gain or growth
Explain the child’s growth rates sensitively to parents, and provide support around management of feeding. Children showing early slow weight gain in infancy usually catch up in weight by 2 years. Infants with late slow weight gains usually catch up slowly in weight through childhood but remain lighter and shorter than their peers at 13 years.
Support an encouraging, positive, ‘no‐fuss’ approach to child feeding by parent/care‐giver
Take a detailed infant feeding history
Reiterate advice from child’s doctor/ paediatrician. Note: weight faltering infants need their food intake to be balanced with their growth, stores, activity and metabolism. When weaned small regular 2 course meals and nutritious snacks are recommended.
Also……when a child is overweight or obese Explain the child’s growth rates sensitively to parents, and provide support around management of overweight or obesity.
Be aware that parents may be surprised about a discussion on the child's weight and may not be aware of the potential growth issue.
Be conscious that discussing a child's weight may, for all sorts of reasons, bring up a variety of feelings or be a sensitive issue for parents (e.g. experience of breastfeeding, family’s ability to provide adequate food, reluctance to admit a weight problem, desensitization to excess weight or preference for plumper babies).
Focus on the child's overall health when beginning conversations about a child’s weight concern – parents may feel more comfortable talking about healthy eating and physical activity, rather than the weight itself.
Try conversation starters – for example "growth pattern is changing...." or "let’s look at the growth chart". For infants and younger children ask about breastfeeding and frequency, duration and amounts and discuss the evidence around breastfeeding etc.
Remain non‐judgemental and supportive in discussions about weight concerns.
36

Focus on nutrient rich foods of moderate portion sizes as opposed to a prescriptive structured meal plan. (Please refer to HSE (2007) UNIT 7 Food and Nutrition, and FSAI forthcoming National Infant Feeding Policy).
Support parents in helping their child to ‘grow into their weight’
Assess motivation and readiness to change and barriers to change and discuss small gradual changes to support management of the eating and physical activity behaviours and guidelines.
Support the advice parents have received from the doctor /dietician /other specialist involved in the child’s care.
Encourage parents to be good role models for their child; making healthy eating and regular physical activity a family affair.
37

Appendix C
Guidelines for Physical Activity for Children The early years 0‐ 4yrs Adapted from Canadian Physical Activity Guidelines
Infants (aged less than 1 year) should be physically active several times daily – particularly through interactive floor‐based play.
Toddlers (aged 1–2 years) and preschoolers (aged 3–4 years) should accumulate at least 180 minutes of physical activity at any intensity spread throughout the day, including:
o A variety of activities in different environments; o Activities that develop movement skills; o Progression toward at least 60 minutes of energetic play by 5 years of age.
More daily physical activity provides greater benefits.
Being active as an infant means: Being active as a toddler or pre‐schooler means: • Tummy time • Reaching for or grasping balls or other
toys • Playing or rolling on the floor • Crawling around the home
• Any activity that gets kids moving • Climbing stairs and moving around the home • Playing outside and exploring their environment • Crawling, brisk walking, running or dancing • As children get older they need more energetic play,
such as hopping, jumping, skipping and cycling.
Being active can help young children: All activity counts. Tips to get young children moving:
• Maintain a healthy body • Improve movement skills • Increase fitness • Build healthy hearts • Have fun and feel happy • Improve/ develop self‐confidence • Learning and attention.
• Create safe places to play • Play music and learn action songs together • Dress for the weather and explore the outdoors • Make time for play with other children • Get where you’re going by walking or cycling
http://files.participaction.com/physicalactivityguidelines/Early‐Years Guidelines/CSEP%20PAC%20Physical%20Activity%20Guidelines%200‐4%20FINAL.pdf
Children From The Report of the National Taskforce on Obesity (2005) Children should be involved in at least 60 minutes per day of moderate physical activity.
Lifestyle activities – as often as possible: Aerobic activities – every day: • Playing outside • Taking the stairs instead of the lift • Helping around the house or yard • Walking the dog, washing the dog • Picking up toys • Walking to the shop
• Cycling, roller blading, skateboarding • Swimming • Running • Skipping • Football/ other ball games • Basketball/ Volleyball
Muscle strengthening activities – 3 times per week Inactivity – cut down • Martial arts • Dancing • Climbing • Gymnastics • Push‐ups and pull‐ups
• TV watching • Video and computer games • Sitting more than 30 minutes at a time
Table adapted from Children’s Activity Pyramid 1993 to 2011 University of Missouri. Published by MU Extension‐ http://extension.missouri.edu/publications/copy.aspx
38

Appendix D
Personal Health Record and UK‐WHO Growth Charts
The Personal Health Record (PHR) is a record of child’s health and development held by parents/carers. The UK version has been in use for approximately 30 years (Red book). In Ireland the PHR is an A5 orange book with a giraffe logo and was first piloted in the former Midwest area in 2000. An external evaluation of the pilot demonstrated an improvement in service quality – through provision of accurate, timely information. Parents felt empowered in the care of their child. It is currently in use in the former Midwest, North East and North West areas. Resource and national policy constraints have impeded its rollout across all areas. The national implementation of a shared electronic child data collection tool is awaited and it has yet to be decided if this will be PHR or another system. The new UK‐WHO growth charts (PHR version) are being introduced into PHR from Sept 2012 onwards in time for their use with newborns form January 2013. Philosophy of PHR Parents are the main carers of their children’s health, and as such should have access to as much knowledge as health professionals. Knowledge empowers and enables consumers to make better use of services. PHR: Use of the record The PHR is distributed at the primary visit to parents after the birth of their baby (postnatal visit). The Public Health Nursing service has responsibility to explain to parents the purpose, use and content of record. CHISP materials (Caring for your Baby/Child) are used to support and augment health promotion material in the PHR. Parents are encouraged to record information about their child’s health and development and to take the PHR with them to every contact with health professionals UK‐WHO 0‐4 years growth charts (PHR version) • The Information section of the charts was written for, and tested with, parents. • The measurement record folds out so it lies alongside the relevant chart • There are 6 charts:
– Birth weight and head circumference – Weight 0‐1 year – Weight 1‐4 years – Length 0‐2 years – Height 2‐4 years – Head circumference 0‐2 years
39

Appendix E
Growth Chart Fact Sheet for Parents or Care‐givers
The notes on this page give information about new growth charts, which are being used in Ireland from 01.01.2013. The Department of Health decided in 2010 that we in Ireland should adopt the same growth charts that are being used in the UK. The UK‐WHO growth charts, launched in 2009, are based on measurements collected by the World Health Organization in six different countries. Healthy breastfed babies whose mothers did not smoke and were not deprived were measured over time. The centile curves drawn using these measurements show how all healthy children are expected to grow, wherever they come from and however they are fed. What do regular measurements tell us? Weighing and measuring helps us to check that your child is growing and developing as expected. It also helps us to tell if your child may have a problem that is affecting their development. Why do we use growth charts? By plotting a child’s growth on the chart, we can see whether it is following the expected pattern. The lines on a growth chart are called centile lines, and are based on the measurements from many children. They show the range of normal weights and heights, and how one child compares with other children of the same age and sex. For example, if your child’s height is on the 25th centile, it means that if you lined up 100 children of the same age and sex in order of height, your child would probably be number 25; 75 children would be taller than your child, and 24 would be shorter. Weights and heights that are anywhere within the centile lines on the chart are considered normal. Every child is different, so no two filled‐in charts will look the same. Even twins may have different growth patterns. If a child’s pattern looks unusual, your health visitor or doctor may want to have a closer look to see what may be going on. This may involve taking more measurements, looking closely at feeding, or investigating other things. Most children who have such investigations are found to be perfectly normal; however, it is important to check an unusual pattern on the chart to make sure of this. Frequently asked questions: I didn’t breastfeed or I stopped early – are these charts still right for my baby? The charts show how breastfed babies grow if they are healthy and there are no problems. Babies grow most naturally when fed on breastmilk. If you use formula milk you want to know that your baby is still growing in the same healthy pattern that they would on breast milk. This chart helps you see if that is happening. What are the preterm charts in my book? These charts show the weights of babies born more than 3 weeks early (before 37 weeks). If your baby was born early, weight and head circumference will be plotted on these charts until they are 2 weeks past your due date. This will help you and the health professionals tell how your baby is doing compared with other preterm babies. After this, weights and other measurements will be plotted on the main chart. On this chart they should be plotted at your child’s actual age but with an arrow drawn back the number of weeks your baby was early. Why are there no centile lines on the charts between birth and 2 weeks? Most babies lose some weight and then regain it during the 2 weeks after birth, and growth patterns vary widely during this time; the growth chart cannot show this. Your baby’s weight at about 2 weeks of age should be compared with their birth weight. How do I know my baby’s weight is OK in the first 2 weeks? Weighing in the early days is important. Babies usually lose some weight to start with but then put it back on. This regain of weight helps to show that your baby is well and that feeding is going well. If your baby loses quite a lot of weight or is slow to get back to their birth weight, this is a sign to look a little closer. If the weight loss seems a lot, your midwife or public health nurse will calculate this as a percentage. If your baby has lost 10% or more of their birth weight, your midwife or public health nurse will probably check how your baby is feeding. If you
40

are breastfeeding, your midwife or nurse will look at what you are doing to see that the baby is attaching to the breast properly. They may suggest some changes to the way you hold your baby, or that you feed more often. If you are giving formula milk, they may suggest that you hold your baby or the bottle differently, or that you feed more often. nurse may also suggest that your baby has a medical examination. If you make a change to how you feed your baby, it may take a little time for their weight to improve. Your nurse may want to weigh them again to follow their progress. How often should my baby be weighed? After the early days, your baby only needs to be weighed at the time of routine checks and injections, as long as all is well. Many mothers like to have their babies weighed more often than this. However, this is not always helpful, and can cause unnecessary worry. For example, if one week your baby was weighed just after a big feed but the next week they were weighed after a big nap and before a feed, this could make it look as if they had not gained weight. Weights measured over a longer time are more likely to show the true weight change. This is why it is recommended that babies should not be weighed frequently unless there are special reasons. The time between weighing is longer for older babies because they are growing less quickly. Your health visitor may suggest that your child is weighed more often than this if there are concerns about their health or growth. My baby’s weight was on one centile and now it is nearly down to the next line – is this normal? It is normal for the dots of your child’s weight to ‘wiggle’ up and down a bit, or to move gradually from being near one centile to the next one (up or down). It is less common for a child’s weight to cross two lines; if this happens your nurse may want to keep a closer eye on your child for a while. My child was ill and lost some weight, what should I do? Children often lose some weight when they are not well. Once your child recovers from the illness, their weight should go back to the centile it was on before the illness within 2–3 weeks. If this does not happen, speak to your nurse or doctor. S/he may measure your child’s length or height or investigate other issues. When should length or height be measured? For babies and children under 2 years, length rather than height is measured. This can be helpful if there is any concern about weight gain. However, it is quite difficult to measure length accurately, so this will not be done every time your child is seen. It is not usually necessary to measure length or height if your child is growing as expected. Can I tell how tall my child will be as an adult? Once your child is between 2 and 4 years old, you can use a height measurement to find their height centile. You can then put this on the ‘Adult Height Predictor’ on the height chart page in your Personal Health Record to get an idea of how tall your child will be. This reading is only accurate to within 6cm (2½”). So if, for example, the predicted height is 160cm (5’3”), that means as an adult your child’s height is likely to be between 154 and 166cm ( 5’½” and 5’5½”). Why is it recommended that only a trained health professional plots on the chart? It takes some practice to plot accurately on a centile chart. Any mistake can make your child’s growth pattern look as if they have a problem when they don’t. Or it can look as if they don’t have a problem when they do. All health professionals using the chart have had training so that they plot on the chart and read it accurately. If you want to weigh your baby for other reasons – to get an idea of the nappy size, for example ‐‐ you can do this, but should remember that this may not be a medically accurate weight. If you do weigh your baby and are concerned about their weight, speak to your nurse before making a change to how you feed or care for your baby. How do I make sure my child is not overweight? Your nurse can discuss any concerns you have about this with you. After the age of 2 years, your child’s weight and height can be used to calculate your child’s centile for body mass index (BMI). If the BMI shows that your child is overweight or obese, you will be able to discuss diet and physical activity so that your child loses some weight in a healthy way.
41

Appendix F
Health Professionals ‐Ten things you need to know about the new UK‐WHO growth charts now for use in Ireland.
1. New UK‐WHO growth charts are being introduced using the WHO standard for children from birth to four years.
o They should be used for all babies born in Ireland after January 1st 2013
o The existing growth charts (Child Growth Foundation/Other) will continue to be used for children born before January 1st 2013. New charts for children 4 years and older will be introduced at a later date.
o The new charts, adopted by the Department of Health and originally developed by the WHO and RCPCH for the Department of Health in the UK, are available in both A5 (personal health record) and A4 format and can currently be downloaded free of charge from www.growthcharts.rcpch.ac.uk.
o Once a procurement contract has been agreed you will be notified of the supplier’s contact details.
2. The WHO charts for the first time describe optimal rather than average growth and set breastfeeding as the norm.
o The new charts were constructed using data on healthy breastfed children from around the world who had no known health or environmental constraints to growth.
o They should be used for all infants however they are fed.
3. The charts can be used for all ethnic groups.
o The WHO has shown that infants worldwide show very similar patterns of linear growth. 4. The new charts will make weight patterns look different from age 6 months.
o On the new charts only 1/200 children will be below 2nd centile for weight after the age of 6 months and there will be twice as many children above the 98th centile.
o Length and height show a very good fit to UK children.
5. All health professionals who use charts should receive some training.
o The National Growth Chart Implementation Group recommends 2 hours training for users.
o Materials suitable for both experienced staff and students are downloadable for free from www.growthcharts.rcpch.ac.uk and adapted materials will soon be available on the HSE website.
6. The new charts are going to look different and chart users need to familiarise themselves with the changes.
o The new charts and chart instructions were developed using focus groups of parents and professionals.
o Though unfamiliar at first they should be clearer and easier to use in the long term.
7. The charts have no lines between 0 and 2 weeks.
42

o Children show highly variable weight loss and gain in the early days after birth, so users are encouraged to assess percentage weight loss rather than plot before 2 weeks.
o At the age of two weeks, for the first time, the charts allow for slower neonatal weight gain so a drop sustained to 2 weeks will no longer be normal.
8. The 50th percentile is no longer emphasised.
o Parents tend to expect all healthy children to be on the 50th centile.
o To help plotting there are centile labels at both ends of each curve and more subtle indicators of the 50th percentile.
9. Preterm infants
o The new 0‐4 years charts have a preterm section for babies born from 32 weeks to term, and clear instructions on gestational correction.
o A new separate Neonatal Infant Close Monitoring low birth weight chart will also be available for use for any preterm infant below 32 weeks.
10. The instructions draw on research evidence and policy on screening and referral and should be relevant to the majority of users.
o They define when a measurement or growth pattern is outside range of normality and advise when further assessment is advisable.
o The information on growth charts in the personal health record (PHR) is now aimed at parents.
43

Appendix G
Resources for parents and professionals Food and Nutrition
1. “Feeding your Baby” and “Breastfeeding your Baby” HSE a. Information on Infant Feeding and Breastfeeding b. Includes information on attachment and positioning c. Information on Support options included d. Further Information & support available on www.breastfeeding.ie e. Further copies can be ordered at www.healthpromotion.ie
2. “Starting to Spoonfeeding your Baby” HSE a. Information on when to start spoonfeeds and suitable foods at different stages b. Includes information on iron, caring for babies teeth & frequently asked questions c. Recipe section d. Further copies can be ordered at www.healthpromotion.ie
3. ‘’Best Practice for infant feeding in Ireland – From pre‐conception to the first year of an infant’s
life. A guide for healthcare professionals based on the Scientific Recommendations for a National Infant Feeding Policy 2011’’
a. This document provides practical guidance on best practice infant feeding for healthcare professionals. The topics covered in this document include nutrition for per‐conception and pregnancy, the milk feeding phase and the weaning phase
b. 120 pages c. The FSAI practical guidance document and full report “Scientific Recommendations for a
National Infant Feeding Policy, 2nd Edition” are available from www.fsai.ie
4. “Food for the growing years‐advice for feeding 1‐5 years” a. This is a sample resource on information on all the food levels e.g. dairy, fruit and
vegetable, meat. It includes tips on how to include all the food groups in a child’s diet and ideas for healthy eating.
b. 2 pages c. Pdf sample foldable leaflet available from NDR‐UK http://www.ndr‐uk.org/Child/View‐
all‐products/Page‐2‐20.html
5. 1 “Little steps for healthy eating booklet” a. Resource provides information on healthy eating, physical activity, buying food, snacks
and treats, TV and sample meals. b. 24 pages c. HSE publication available from www.littlestep.eu
6. “Food and nutrition guidelines for pre school services (2004)” a. Publication on guidelines that are relevant to pre‐school children aged 0‐5 years and a
resource and guide for all relevant stakeholders; carers, parents and pre‐school inspectors.
b. 27 pages c. Health promotion publication available from
www.dohc.ie/publications/preschool_guidelines.html
7. “3 week menu planner‐a resource for pre‐schools” a. This resource was developed for pre‐school providers to assist them in implementing the
food and nutrition guidelines for pre‐school services published in April 2004. It aims to
44

provide a practical guide for you to implement the guidelines to provide balanced, nutritious meal ideas to help grow children. Recipes for children are from 1 year onwards. Portion sizes are based for children aged one and half to three years.
b. 61 pages c. pdf available from Health Promotion.ie.
8. “Food for young children (2006)” HSE a. Practical tips and suggestions about food for your child aged 1‐5 years. If you are
wondering what foods your child should be eating, how to cope with a fussy eater or looking for meal and snack ideas for your child, you will find this information useful.
b. 24 pages c. Pdf Available from www.healthpromotion.ie
9. “Portion sizes for toddlers 1‐3 years” a. Resource to learn all the required portion sizes essential with the food groups. b. 10 pages c. Pdf available from https://www.infantandtoddlerforum.org/toddler‐portion‐sizes
10. “Help my child won’t eat‐a guide for families” a. This is also a sample guide on how to get your child to eat food provided to him/her. It
included tips on how to help and suggested meals. b. 8 pages c. Pdf sample available from NDR‐UKhttp://www.ndr‐uk.org/Child/View‐all‐products/Page‐
2‐20.html
11. “Healthy Eating” a. Tips to keep healthy and active, snacks example, constipation, additives, food refusal,
iron, b. 8 pages (colour) c. Available on Irish Nutrition and Dietetic Institute:
http://www.indi.ie/docs/242_INDI_healthy_eating_children_leaflet.pdf
Physical activity
12. “Canadian 0‐4 year old physical activity recommendations”
a. Canadian Physical activity guidelines for the early years (0‐4 years). Guidelines for healthy growth and development. Benefits of activity. Types of activity.
b. 1 page c. Pdf available from http://www.csep.ca/CMFiles/Guidelines/CSEP‐InfoSheets‐early‐years‐
ENG.pdf
13. “A guide for you and your child on increasing physical activity” a. Resource on tips to increase physical activity for your child b. 4 pages c. NDR‐UK available from http://www.ndr‐uk.org/Child/View‐all‐products/Page‐2‐20.html
14. Physical Activity guidelines for early years (under five’s)‐for infants who are not walking yet
a. Includes examples of physical activity activities, benefits of movement and how to reduce sedentary behaviours.
b. 1 page (factsheet) c. Pdf available from British Heart Foundation:
http://www.bhfactive.org.uk/userfiles/Documents/factsheetearlyyearsnotwalking.pdf
45

15. Good for kids‐The Physical Activity Handbook (2009)” a. Handbook on how to get infants active. Includes physical activity methods‐opportunistic
times e.g. changing nappy time and planned development physical activity e.g. stability and locomotors skills, rhymes/songs for under 3s,
b. 14 pages (colour) c. Pdf available from Good for Kids:
http://www.goodforkids.nsw.gov.au/sitefiles/GoodForKids/documents/Children's%20Services/Final%20version_I%20Move%20We%20Move_PA%20Handbook_Babies.pdf
16. “Get Ireland Active‐Fact sheet for parents and guardians”
a. How much activity should children get? b. 1 page factsheet c. Pdf available from Get Ireland Active: http://www.getirelandactive.ie/content/wp‐
content/uploads/2011/08/Childrens‐Factsheet‐GIA.pdf
General 17. “How to build a healthy preschooler”
a. A to Z tips on how to build a healthy preschooler. How much of the food groups should my child eat, smart snacks examples.
b. 4 pages (colour) c. Pdf available on Eat Right Ontario:
http://www.eatrightontario.ca/CentralAttachments/nutristep_build‐healthy‐preschooler‐eng‐4pg.pdf
18. ? Information sheet for parents on diet and physical activity for children outside parameters for
healthy growth (Maybe info resources)
19. “Step by step‐your guide to a healthy and active family” a. Child friendly resource b. Resource on portion control, what happens to your body when eat too much, tips to
make food fun, storage tips, problem page. c. 16 pages d. Pdf available from www.nhs.uk/change4life
Problem growth 20. “Advice for parents‐how to help your overweight child”
a. Includes information on: 1. How can I tell if my child is overweight?
ii. Why is my child overweight? iii. What can I do to help? iv. Active and healthy eating advice
b. Compiled by the Community Nutrition and Dietetic Service, HSE Southern Area c. 4 pages
21. “Nutrition & Dietetics Tallaght info” a. High protein high calorie advice for slow weight gain (4 pages) b. Healthy eating making better choices‐ information on the food groups, portion control,
physical activity, sample menu for healthy eating, (11 pages) c. Healthy eating‐making the better choice – getting started, less fat/sugar, more fruit and
vegetables, low fat dairy products, exercise (2 pages)
46

47
d. These are examples of dietetic support resources and not generally available. [Contact your local community dietician or dietetic service]
22. “Eat smart move more‐could my child be overweight?” a. Contains information on the food pyramid, food groups, question and answers, meal
planner, exercise pyramid and guidelines. b. 17 pages c. Pdf available from Irish Nutrition & Dietetic Institute www.eatsmartmovemore.ie
23. National Guidelines for Community Based Practitioners on Prevention and Management of Childhood Overweight and Obesity (HSE 2006) http://www.hse.ie/eng/services/Publications/services/Children/National_Guidelines_for_Community_Based_Practitioners_on_Prevention_and_Management_of_Childhood_Overweight_andObesity.pdf