Growth and yield of soybean cultivars as affected by …Sarwar, 2002). Ground water depth of 70 cm...
12
81 AJCS 6(1):81-92 (2012) ISSN:1835-2707 Growth and yield of soybean cultivars as affected by ground water levels and phosphorus rates grown under greenhouse and field conditions Rattiyaporn Jaidee 1 , Anan Polthanee 1* , Patcharee Saenjan 1 1 Department of Plant Science and Agricultural Resources, Faculty of Agriculture, Khon Kaen University, 40002, Thailand * Corresponding author: [email protected] Abstract Experiments were conducted under greenhouse and field conditions to investigate the effects of P application rates and the responses of soybean cultivars to different ground water levels. The results of the greenhouse experiment showed that ground water level recession reduced root dry weight, root length density, shoot growth, yield components, and consequently, the grain yields of KKU74 and SJ5cultivars. Rapid ground water recession affected soybean yield reduction more than slow recession. P application increased both root and shoots growth, and tended to produce higher grain yields than the absence of P application. With P application, KKU74 had a higher grain yield than SJ5. The results of field conditions showed that P application rates had no significant effect on leaf area, LAI, shoot dry weight and the grain yields of the three soybean cultivars. However, KKU74 with P applications at the maximum rate of 58 kg p 2 o 5 ha -1 tended to produce the highest grain yields. Under both greenhouse and field conditions, KKU74 with P application had the highest grain yields, shoot growth and root length density (lower than the 75-cm depth from the soil ’s surface) with ground water level recession. These results indicate that this cultivar is better adapted to water stress and appropriate to growing after rice in a paddy field without irrigation. However, it is suggested that the ground water level before planting should be higher than 80 cm depth from the soil ’s surface. Keywords: Ground water level, phosphorus, root length density, leaf water potential, stomatal resistance, soybean, yield. Abbreviations: DAP-day after planting, DAE-day after emergence, LWP-leaf water potential, RLD-root length density, RWC- relative leaf water content. Introduction Soybean has a high protein and fat content, so it is widely used for both food and forage. It also has industrial uses. Thus, its worldwide production and consumption are increasing every year. However, in Thailand, its production is not sufficient to meet human and animal needs. In 2009, about 1.5 million tons of soybeans were imported (OAE, 2010). Therefore, increasing soybean production is an important priority in Thailand, and growing soybean after rice can be one way to increase production. In many rain-fed lowland rice-growing areas with shallow water tables, the production of a post-rice crop offers an alternative way for farmers to increase income. Late rains can be used to grow a short-maturing upland crop successfully (Polthanee, 1989). Soybean is a legume crop that can be grown after rice without irrigation by using residual soil moisture at the end of the rainy season and additional soil moisture is made available by capillary rising from a shallow water table. However, the plants may be subjected to drought at the grain-filling stage, especially during years in which rainfall stops early at the end of the rainy season. Drought is important to growth and yield reduction, especially drought stress occurring at reproductive stages, such as water stress at R1 (initial flowering), R3 (initial pod), R5 (beginning seed), and R6 (full seed) stages, resulting in substantial yield reduction as compared to full irrigation (Dogan et al., 2007; Desclaux et al., 2000; Frederick et al., 2001). Water stress during early pod formation causes the greatest reduction in the number of pods and seeds at harvest. The yield is reduced most by stress during early formation and pod filling (Sionit and Kramer, 1977). Ground water level depth in paddy fields before planting may differ from year to year depending on rainfall in the latter part of the rainy season. Ground water depth has effects on the growth and yield of soybean after rice without irrigation. Photosynthetic rates, stomatal conductance, and yield were higher when ground water was at 60 cm depth below the surface as compared to depths lower than 60 cm (Sarwar, 2002). Ground water depth of 70 cm below the soil surface had higher grain yields and yield components as compared to depths of 40 cm (Shimada et al., 1995). However, ground water at 75 cm depth increased grain yields more than ground water did at 50 cm depth (Mejia, 2000). Several researchers have found that ground water maintained at different depths had effects on the growth and yield of soybean. However, previous researches maintained the particular ground water depth and kept constantly until harvest stage. Nevertheless, the ground water level in the farmer’s field decrease continuously but influence of ground water level recession on growth and yield of soybean was not clearly understood. Phosphorus is an essential element for the general health and vigor of all plants. Phosphorus stimulates root development, improves flower formation and seed production, promotes more uniform and earlier crop maturity, increases the nitrogen N-fixing capacity of legumes, improves seed quality, and increases resistance to plant
Transcript of Growth and yield of soybean cultivars as affected by …Sarwar, 2002). Ground water depth of 70 cm...
81
AJCS 6(1):81-92 (2012) ISSN:1835-2707
Growth and yield of soybean cultivars as affected by ground water levels and phosphorus
rates grown under greenhouse and field conditions
Rattiyaporn Jaidee
1, Anan Polthanee
1*, Patcharee Saenjan
1
1Department of Plant Science and Agricultural Resources, Faculty of Agriculture, Khon Kaen University, 40002,
Thailand
* Corresponding author: [email protected]
Abstract
Experiments were conducted under greenhouse and field conditions to investigate the effects of P application rates and the responses
of soybean cultivars to different ground water levels. The results of the greenhouse experiment showed that ground water level recession reduced root dry weight, root length density, shoot growth, yield components, and consequently, the grain yields of KKU74
and SJ5cultivars. Rapid ground water recession affected soybean yield reduction more than slow recession. P application increased
both root and shoots growth, and tended to produce higher grain yields than the absence of P application. With P application, KKU74
had a higher grain yield than SJ5. The results of field conditions showed that P application rates had no significant effect on leaf area, LAI, shoot dry weight and the grain yields of the three soybean cultivars. However, KKU74 with P applications at the maximum rate
of 58 kg p2o5ha-1 tended to produce the highest grain yields. Under both greenhouse and field conditions, KKU74 with P application
had the highest grain yields, shoot growth and root length density (lower than the 75-cm depth from the soil’s surface) with ground
water level recession. These results indicate that this cultivar is better adapted to water stress and appropriate to growing after rice in a paddy field without irrigation. However, it is suggested that the ground water level before planting should be higher than 80 cm
depth from the soil’s surface.
Keywords: Ground water level, phosphorus, root length density, leaf water potential, stomatal resistance, soybean, yield. Abbreviations: DAP-day after planting, DAE-day after emergence, LWP-leaf water potential, RLD-root length density, RWC-
relative leaf water content.
Introduction
Soybean has a high protein and fat content, so it is widely
used for both food and forage. It also has industrial uses. Thus, its worldwide production and consumption are
increasing every year. However, in Thailand, its production is
not sufficient to meet human and animal needs. In 2009,
about 1.5 million tons of soybeans were imported (OAE, 2010). Therefore, increasing soybean production is an
important priority in Thailand, and growing soybean after
rice can be one way to increase production. In many rain-fed
lowland rice-growing areas with shallow water tables, the production of a post-rice crop offers an alternative way for
farmers to increase income. Late rains can be used to grow a
short-maturing upland crop successfully (Polthanee, 1989).
Soybean is a legume crop that can be grown after rice without irrigation by using residual soil moisture at the end of the
rainy season and additional soil moisture is made available by
capillary rising from a shallow water table. However, the
plants may be subjected to drought at the grain-filling stage, especially during years in which rainfall stops early at the end
of the rainy season. Drought is important to growth and yield
reduction, especially drought stress occurring at reproductive
stages, such as water stress at R1 (initial flowering), R3 (initial pod), R5 (beginning seed), and R6 (full seed) stages,
resulting in substantial yield reduction as compared to full
irrigation (Dogan et al., 2007; Desclaux et al., 2000;
Frederick et al., 2001). Water stress during early pod formation causes the greatest reduction in the number of pods
and seeds at harvest. The yield is reduced most by stress
during early formation and pod filling (Sionit and Kramer, 1977). Ground water level depth in paddy fields before
planting may differ from year to year depending on rainfall in
the latter part of the rainy season. Ground water depth has
effects on the growth and yield of soybean after rice without irrigation. Photosynthetic rates, stomatal conductance, and
yield were higher when ground water was at 60 cm depth
below the surface as compared to depths lower than 60 cm
(Sarwar, 2002). Ground water depth of 70 cm below the soil surface had higher grain yields and yield components as
compared to depths of 40 cm (Shimada et al., 1995).
However, ground water at 75 cm depth increased grain yields
more than ground water did at 50 cm depth (Mejia, 2000). Several researchers have found that ground water maintained
at different depths had effects on the growth and yield of
soybean. However, previous researches maintained the
particular ground water depth and kept constantly until harvest stage. Nevertheless, the ground water level in the
farmer’s field decrease continuously but influence of ground
water level recession on growth and yield of soybean was not
clearly understood. Phosphorus is an essential element for the general health and vigor of all plants. Phosphorus stimulates
root development, improves flower formation and seed
production, promotes more uniform and earlier crop maturity,
increases the nitrogen N-fixing capacity of legumes, improves seed quality, and increases resistance to plant

82
diseases (Marshner, 1995). The development of a deep and
vigorous root system is a key strategy for mitigating the effects of water stresses because of its essential role as a soil-
plant interface (Vamerali et al., 2003; Jin et al., 2005). Root
architecture is closely linked to the plant’s uptake of water
and nutrients that move with the water. Total root biomass, root length and surface area have been found to influence the
nutrient uptake (Raper et al., 1978; Jin et al., 2002). Most
paddy fields in rain-fed areas in the northeast of Thailand
have low soil fertility and most of the soil texture is sandy (Bell and Seng, 2004). Therefore, P application could
increase P availability in the soil and increase crop yield and
development of the root system, which is one of the key
factors for interpreting the effects of water stresses. The objective of this study was to investigate the effects of P
application rates and the responses of soybean cultivars
grown under greenhouse and field conditions to different
ground water levels.
Results
Soil moisture content
In the greenhouse pot experiment, soil moisture content
decreased after initiating ground water level treatments. The
soil moisture content of the W0 treatment was maintained with available water (defined as the water content between
field capacity and the permanent wilting point) at all growth
stages (Fig. 2a). Soil moisture content of the W1 treatment
decreased below the permanent wilting point (PWP) at the 40 and 60 cm soil depths at the R6 and R8 stages, respectively
(Fig. 2b). The soil moisture content of the W2 treatment
decreased below the PWP at the 60 and 80 cm soil depths at
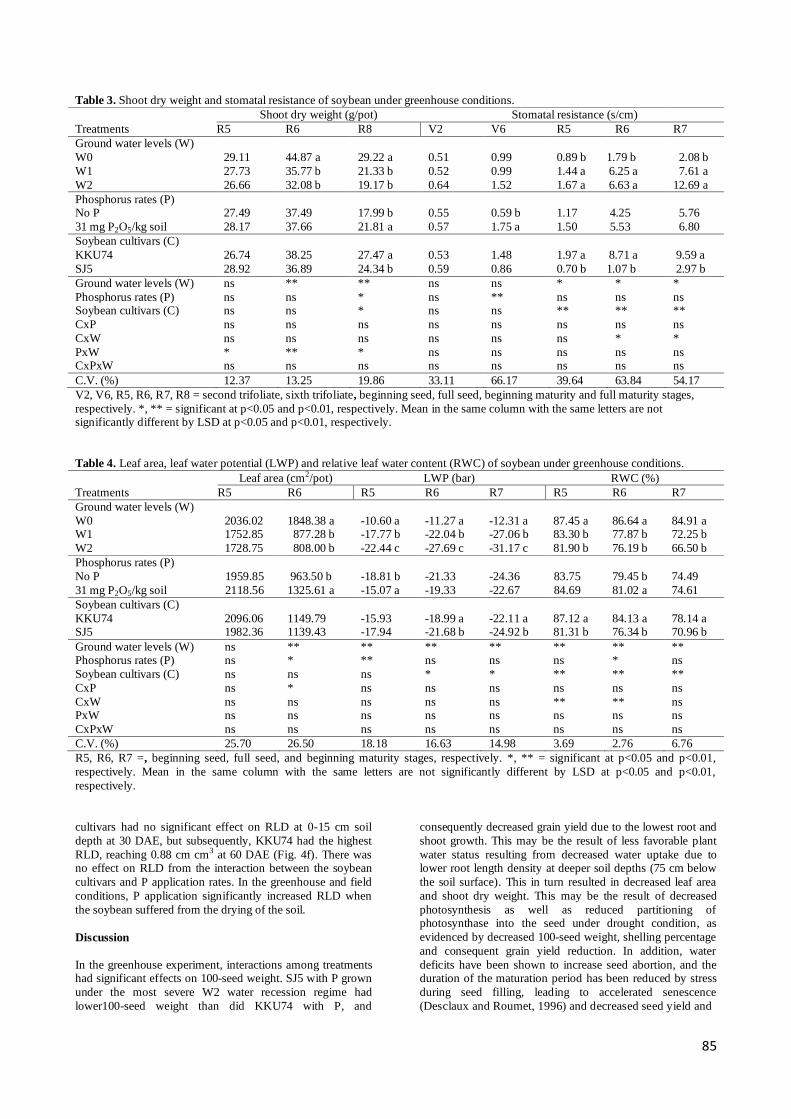
the R6 and R8 stages, respectively (Fig. 2c). Under field conditions, soil moisture content at the depths of 0-15 cm and
15-30 cm was mostly maintained in the available range
during the entire growing period (Fig. 3a). Soil moisture
content at depths of 0-15 cm and 15-30 cm declined until 13 weeks after planting, and had values close to PWP during
the12th and 13th weeks after planting. Measured ground water
depths ranged from 82 cm to 126 cm below ground surface
during the growing period (Fig. 3b). The crops received 30.6 mm and 25.3 mm of rainfall at the 13th and 16th weeks after
planting (Fig. 3b). Thus, the water available to crops was
supplied mainly by the upward movement of water from
shallow ground water and from residual soil moisture in the soil profile.
Yield and yield components
In the greenhouse experiment, ground water level recession
significantly decreased grain yield, number of pods per plant,
100-seed weight, and harvest index (Table 1). The W2 water
regime had the lowest number of pods per plant, 100-seed weight, harvest index, and grain yield (Table 2). P application
had a significant effect on the harvest index, but it had no
effect on yield and yield components. However, P application
tended to have higher grain yield and yield components than without P application. There were significant differences
between the two soybean cultivars for both yield and yield
components. KKU74 had the highest yield, number of seeds
per pod, 100-seed weight, harvest index, and shelling percentage, while SJ5 had the highest number of pods per
plant (Table2). There were significant interactions among
treatments for 100-seed weight. KKU74 with P fertilizer had
the highest 100-seed weight. Under P fertilizer, KKU74 had a higher 100- seed weight under three ground water levels than
SJ5 (Table 5, left-hand side). In the field experiment, P
application rates had significant effects on the number of pods per plant, harvest index, and shelling percentage, but it
had no effect on the number of seeds per pod, 100-seed
weight and grain yield (Table 1). The highest number of pods
per plant was obtained when soybean received P applied at the rate of 58 kg P2O5 ha-1. The highest harvest index and
shelling percentage were obtained when soybean received P
applied at the rate of 29 kg P2O5 ha-1. Soybean receiving P
fertilizer at the rate 58 kg P2O5 ha-1 tended to have the highest grain yield and number of seeds per pod. Soybean receiving P
fertilizer at the rate 29 kg P2O5 ha-1 tended to have the highest
100-seed weight. There were significant differences between
the three soybean cultivars in grain yield and number of seeds per pod. KKU74 had the highest grain yield and number of
seeds per pod (Table 2). There were no significant interaction
effects between soybean cultivars and P application at any
stage.
Shoot dry weight
In greenhouse conditions, shoot dry weight was affected by the interaction of phosphorus rates with ground water levels
at the R5, R6 and R8 stages (Table 3). Under the W0 water
regime, the soybeans receiving P fertilizer had the highest
shoot dry weight. The P application achieved higher shoot dry weight than without the P application under three water
regimes (Table 5, left-hand side). Groundwater level
recession had significant effects on shoot dry weight at the
R6 and R8 stages. The W2 treatment had the lowest shoot dry weight. Application of P had no effect on shoot dry weight at
the R5 and R6 stages, except for at the R8 stage. Soybean
cultivars were significantly different in shoot dry weight at
the R8 stages. KKU74 had a higher shoot dry weight than SJ5 at the R8 stage (Table 3). In field conditions, shoot dry
weight was affected by the interaction of soybean cultivars
and P application rates at 45 DAE (Table 6). CM60 and
KKU74 had higher shoot dry weight than SJ5 when receiving P fertilizer at the rate of 29 kg P2O5 ha-1 (Table 7). P
application had no significant effects on shoot dry weight at
30, 45 and 60 DAE, although P application at the highest rate
of 58 kg P2O5 ha-1 tended to produce the highest shoot dry weight. There were significant differences between soybean
cultivars in shoot dry weight at 30, 45 and 60 DAE. The
highest shoot dry weight was obtained with KKU74.
Leaf area and leaf area index (LAI)
In greenhouse conditions, leaf area was affected by the
interaction of soybean cultivars and phosphorus rates at the R6 stage (Table 4). KKU74 with P had a higher leaf area than
SJ5 with P (Table 5). Ground water level recession
significantly decreased leaf area at the R6 stage. The W2
water regime had the lowest leaf area. P application at 31 mg P2O5 kg-1soil increased leaf area significantly at the R6 stage.
There were no significant differences in leaf area between
soybean cultivars at the R5 and R6 stages, although KKU74
tended to have higher leaf area than SJ5 (Table 4). In field conditions, leaf area and LAI were affected by the interaction
of the soybean cultivars with P application rates at 45 DAE
(Table 6). The highest leaf area was obtained in CM60 at P
rate of 29 kg p2o5ha-1. Without P application, KKU74 and CM60 had higher leaf areas and higher LAI than did SJ5
(Table 7). P application had no significant effects on leaf area
and LAI at 30 or 45, 60 DAE, but P application at the rate of
58 kg p2o5ha-1 tended to produce the highest leaf area. Soybean cultivars differed significantly in leaf area and LAI

83
Table 1. Mean squares from analysis of variance (ANOVA) for yield and yield components of soybean cultivars under greenhouse
and field conditions.
Greenhouse condition
Grain yield Seed per 100 seeds Pod per Harvest Shelling
Source of variation DF (g/pot) pod (no.) weight (g) plant (no.) Index (HI) (%)
Rep 2 2.22 0.08 1.01 1.44 0.002 11.82
Soybean cultivars (C) 1 183.60** 4.00** 253.18** 1308.03** 0.235** 2476.56** Phosphorus rates (P) 1 0.61 0.11 3.91 34.03 0.021* 57.58
Ground water levels (W) 2 128.25** 0.25 59.88** 840.11** 0.015* 33.13
CxP 1 3.42 0.44 24.42* 0.25 0.016 65.26
CxW 2 10.77 0.08 4.09 122.11 0.004 38.44 PxW 2 11.83 0.19 7.08 56.78 0.007 291.75
CxPxW 2 1.94 0.03 19.15* 36.00 0.002 34.14
Error 22 11.08 0.24 3.41 79.72 0.004 126.27
Total 35
Field condition
Grain yield Seed per 100 seeds Pod per Harvest Shelling
Source of variation DF (kg/ha) pod (no.) weight (g) plant (no.) Index (HI) (%)
Rep 3 32394 0.18 2.23 207.88 0.020 292.56 Soybean cultivars (C) 2 111500* 4.53** 4.27 44.19 0.019 509.71
Error 6 18469 0.23 1.35 117.60 0.008 243.26
Phosphorus rates (P) 2 13212 0.11 0.22 106.36** 0.056** 535.37*
CxP 4 2055 0.28 0.29 29.61 0.005 23.63 Error 18 10353 0.19 0.16 8.86 0.005 123.59
Total 35
*,** = significant at p<0.05 and p<0.01, respectively.
Table 2. Yield and yield components of soybean under greenhouse and field conditions.
Greenhouse condition
Grain yield Seed per 100 seeds Pod per Harvest Shelling
Treatments (g/pot) pod (no.) weight (g) plant (no.) Index (HI) (%)
Ground water levels (W)
W0 14.18 a 1.33 15.30 a 40.08 a 0.30 a 51.30
W1 10.55 ab 1.58 12.03 b 29.42 b 0.27 ab 48.85 W2 7.65 b 1.58 11.03 b 23.58 b 0.23 b 48.13
Phosphorus rates (P)
No P 10.66 1.44 12.46 30.06 0.24 b 48.16
31 mg P2O5/kg soil 10.92 1.56 13.18 32.00 0.29 a 50.69
Soybean cultivars (C)
KKU74 13.05 a 1.83 a 15.44 a 25.00 b 0.34 a 57.72 a
SJ5 8.53 b 1.17 b 10.14 b 37.06 a 0.18 b 41.13 b
Field condition
Grain yield Seed per 100 seeds Pod per Harvest Shelling
(kg/ha) pod (no.) weight (g) plant (no.) Index (HI) (%)
Phosphorus rates (P) No P 273.34 2.25 12.60 13.75 b 0.16 b 36.58 b
29 kg P2O5/ha 287.82 2.25 12.85 18.33 a 0.29 a 49.41 a
58 kg P2O5/ha 336.67 2.42 12.80 19.33 a 0.24 a 39.76 b
Soybean cultivars (C)
CM60 258.63 b 2.08 b 12.42 19.00 0.19 34.60
KKU74 409.33 a 3.00 a 13.44 15.17 0.27 44.05 SJ5 229.86 b 1.83 b 12.39 17.25 0.24 47.10
Mean in the same column with the same letters are not significantly different by LSD at p<0.05 and p<0.01, respectively.
at 30 and 45 DAE. The highest leaf area was obtained with
KKU74.
Relative leaf water potential (LWP) and relative leaf water
content (RWC) under greenhouse condition
Ground water level recession significantly decreased LWP at
the R5, R6 and R7 stages (Table 4). The W2 water regime had the lowest LWP. P application had significant effect on
LWP
at the R5 stage only. There were significant difference in
LWP among soybean cultivars at the R6, and R7 stages.
KKU74 had the highest LWP. Interactions among treatments had no significant effects on LWP at R5, R6 and R7. RWC
was affected by the interactions of the soybean cultivars with
ground water levels at the R5 and R6 stages. KKU74 had a
higher RWC than did SJ5 under the W1 and W2 water regimes (Table 5, right-hand side).

84
Ground water level
maintained at 80 cm below
the soil surface (W0)
145 cm height of PVC column
ground water level
beginning at 80 cm and receding about 10 cm every
2 week (W2) after 15 DAE until water in plastic pot
dried out
ground water level
beginning at 80 cm and receding about 5 cm
every 2 week (W1) after 15 DAE until water in
plastic pot dried out
soil surface
25 cm diameter
10 cm
56 cm height of plastic pot
soil
water
Covered cling film
Fig 1. Diagram of the soil column and pot water holding
containers in the greenhouse experiment.
FC
PWP
(a)
02468
101214161820222426
- - - - - -
Soil m
oistu
re c
on
ten
t (
%w
/w
)
Soil depth (cm)
W0R5
R6
R8
FC
PWP
(b)
02468
101214161820222426
- - - - - -
Soil m
oistu
re c
on
ten
t (
%w
/w
)
Soil depth (cm)
W1R5
R6
R8
FC
PWP
(C)
02468
101214161820222426
- - - - - -
Soil m
oistu
re c
on
ten
t (
%w
/w
)
Soil depth (cm)
W2R5
R6
R8
Fig 2. Average soil moisture content of three water table
levels: (a) W0, (b) W1 and (c) W2 at 0-20 cm, 20-40 cm, 40-
60 cm, 60-80 cm, 80-100 cm and 100-135 cm of soil depths
at the R5, R6 and R8 stages in the greenhouse experiment.
Ground water level recession significantly decreased RWC at
R5, R6 and R7 stages. The W2 water regime had the lowest RWC. P application significantly increased RWC only at the
R6 stage. KKU74 had higher RWC than did SJ5.
Stomatal resistance
Under greenhouse conditions, the stomatal resistance was
affected by the interactions of soybean cultivars with ground
water levels at the R6, and R7stages (Table 3). Under the W1 and W2 water regimes, KKU74 had the highest stomatal
resistance as compared to SJ5 (Table 5, right-hand side).
Ground water level recession significantly increased stomatal
resistance at the R5, R6 and R7 stages. The W2 water regime had the highest stomatal resistance. P application
significantly increased stomatal resistance at the V6 stage.
Stomatal resistance differed significantly between the two
soybean cultivars at the R5, R6 and R7 stages. KKU74 had the highest stomatal resistance. Under field conditions,
stomatal resistance was affected by the interaction of P
fertilizer rates with the soybean cultivars at 45 DAE (Table
6). P application at the rate 58 kg P2O5 ha-1, KKU74 had a higher stomatal resistance than CM60 and SJ5 (Table 7). P
application rates significantly increased stomatal resistance at
45 DAE. Soybean cultivars had significant effects on
stomatal resistance at 45 DAE. KKU74 had the highest
stomatal resistance.
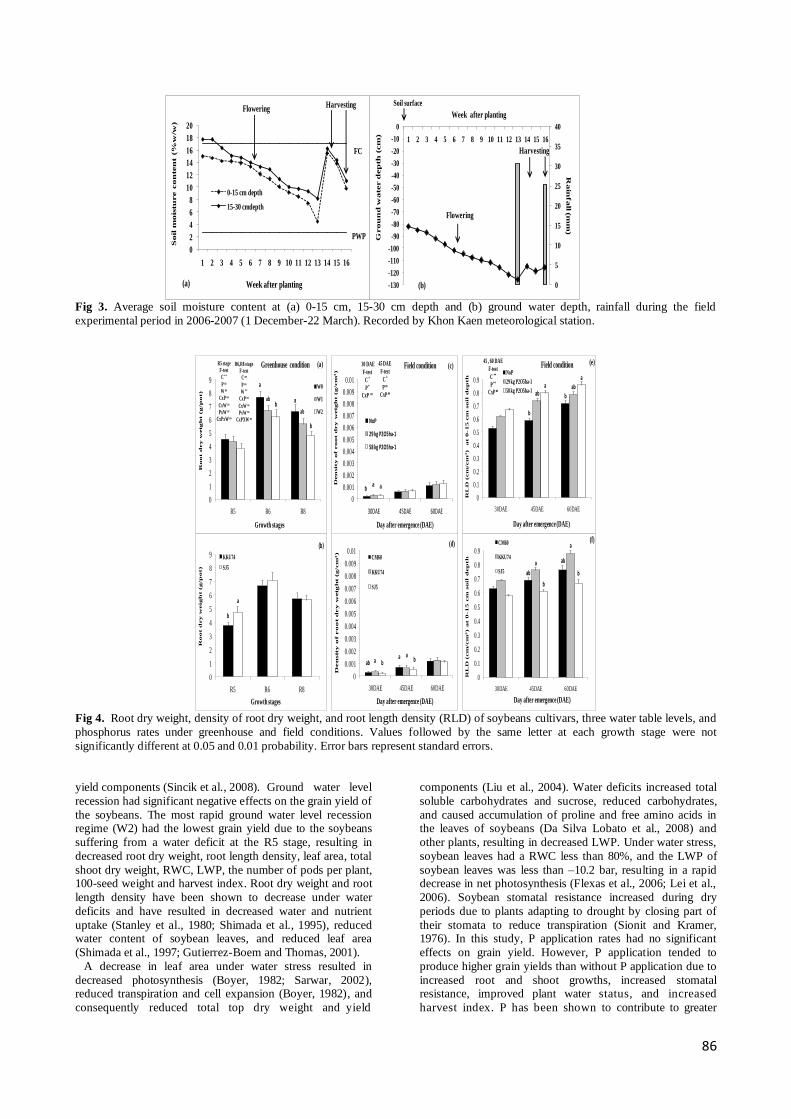
Root dry weight
In the greenhouse experiment, ground water level recession had significant effects on root dry weights at the R6 and R8
stages. The W2 water regime had the lowest root dry weight
(Fig. 4a). P application at a rate of 31 mg P2O5 kg-1 soil had
no significant effect on root dry weight at the R5, R6 and R8 stages. Soybean cultivars had significantly different root dry
weights at the R5 stage. SJ5 had the highest root dry weight
(Fig. 4b). The interaction among the three factors of ground
water levels, P rates and soybean cultivars had no significant effects on root dry weight at the R5, R6 and R8 stages. Under
field conditions, the density of the root dry weight was
significantly affected by P application rates at 30 DAE. The
highest density of root dry weight was obtained with 58 kg p2o5ha-1 (Fig. 4c). Soybean cultivars had significant effects
on the density of the root dry weight at 30 and 45 DAE.
Among the three cultivars used in this study, the highest
density of the root dry weight was obtained in KKU74, while SJ5 had the lowest density (Fig. 4d). No interaction was
found between the soybean cultivars and P application rates.
Root growth was not detected at the soil depths of15-30 cm
and 30-45 cm, due to inhibition of root penetration by a soil hardpan.
Root length density (RLD)
In greenhouse conditions, the RLD was affected by the
interaction of ground water levels and the soybean cultivars
at soil depths of 45-75 cm at the R5 and R8 stages (Table 8).
At the R5 stage, SJ5 had a higher RLD than did KKU74 under the W0 and W1 water regimes. KKU74 had the highest
RLD under the W2 water regime. At the R8 stage, SJ5 had
higher RLD than did KKU74 at all water regimes (Table 9).
Interactions among ground water levels, P rates and soybean cultivars had significant effects on RLD at 45-75 cm soil
depth at the R8 stage. At the W1 and W2 water regimes,
SJ5with P had higher RLD than KKU74 with P, while SJ5
with P had lower RLD than KKU74 with P under the W0 water regime (Table 9). P application significantly increased
RLD of both KKU74 and SJ5 cultivars under the three water
regimes. Ground water level recession significantly reduced
RLD at the R5, R6 and R8 stages (Table 8). At the W2 water regime, the RLD was lower than W0, and the W1 water
regime at soil depths of 0-45 cm and 45-75 cm, while the
highest RLD was obtained with the W2 water regime at 75-
135 cm soil depth. P application significantly increased RLD at the R6 and R8 stages. P application had higher RLD than
did the absence of P application. There were significant
differences in RLD between the two soybean cultivars at the
R5, R6 and R8 stages. At the three water regimes, SJ5 had higher RLD than did KKU74 at soil depths of 0-45 cm and
45-75 cm, while KKU74 had the highest RLD at 75-135 cm
soil depth (Fig. 5). RLD distribution with depth of two
soybean cultivars at R8 stage, SJ5 with P had higher RLD than did KKU74 with P at 0-75 cm depth from soil surface at
all water regimes. KKU74 with P had higher RLD than did
SJ5 with P at 75-135 cm depth from soil surface under W2
water regime (Fig.5). In field conditions, P application had no effect on RLD at 30 DAE, but RLD significantly increased
with P application at the rate of 58 kg P2O5 ha-1 at 45 and 60
DAE, resulting in a RLD of 0.086 cm/ cm3 (Fig. 4d).
Soybean
85
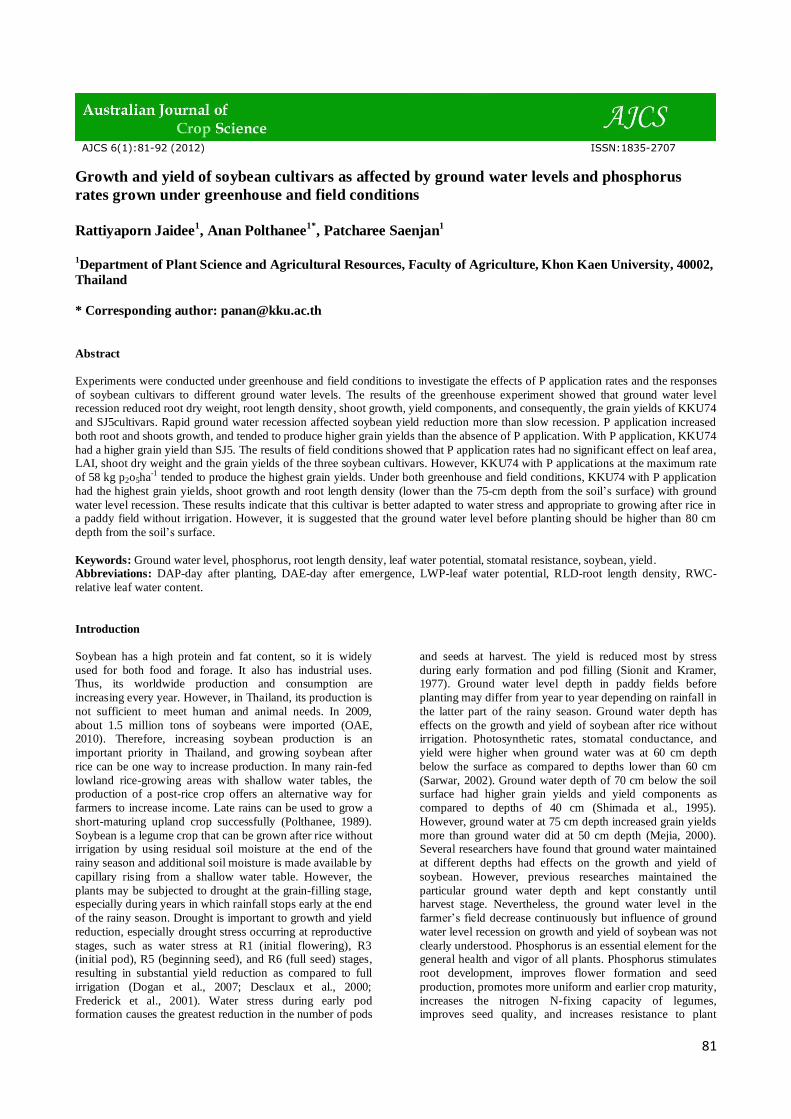
Table 3. Shoot dry weight and stomatal resistance of soybean under greenhouse conditions.
Shoot dry weight (g/pot) Stomatal resistance (s/cm)
Treatments R5 R6 R8 V2 V6 R5 R6 R7
Ground water levels (W)
W0 29.11 44.87 a 29.22 a 0.51 0.99 0.89 b 1.79 b 2.08 b
W1 27.73 35.77 b 21.33 b 0.52 0.99 1.44 a 6.25 a 7.61 a
W2 26.66 32.08 b 19.17 b 0.64 1.52 1.67 a 6.63 a 12.69 a
Phosphorus rates (P) No P 27.49 37.49 17.99 b 0.55 0.59 b 1.17 4.25 5.76
31 mg P2O5/kg soil 28.17 37.66 21.81 a 0.57 1.75 a 1.50 5.53 6.80
Soybean cultivars (C)
KKU74 26.74 38.25 27.47 a 0.53 1.48 1.97 a 8.71 a 9.59 a
SJ5 28.92 36.89 24.34 b 0.59 0.86 0.70 b 1.07 b 2.97 b
Ground water levels (W) ns ** ** ns ns * * *
Phosphorus rates (P) ns ns * ns ** ns ns ns Soybean cultivars (C) ns ns * ns ns ** ** **
CxP ns ns ns ns ns ns ns ns
CxW ns ns ns ns ns ns * *
PxW * ** * ns ns ns ns ns CxPxW ns ns ns ns ns ns ns ns
C.V. (%) 12.37 13.25 19.86 33.11 66.17 39.64 63.84 54.17
V2, V6, R5, R6, R7, R8 = second trifoliate, sixth trifoliate, beginning seed, full seed, beginning maturity and full maturity stages,
respectively. *, ** = significant at p<0.05 and p<0.01, respectively. Mean in the same column with the same letters are not significantly different by LSD at p<0.05 and p<0.01, respectively.
Table 4. Leaf area, leaf water potential (LWP) and relative leaf water content (RWC) of soybean under greenhouse conditions.
Leaf area (cm2/pot) LWP (bar) RWC (%)
Treatments R5 R6 R5 R6 R7 R5 R6 R7
Ground water levels (W)
W0 2036.02 1848.38 a -10.60 a -11.27 a -12.31 a 87.45 a 86.64 a 84.91 a W1 1752.85 877.28 b -17.77 b -22.04 b -27.06 b 83.30 b 77.87 b 72.25 b
W2 1728.75 808.00 b -22.44 c -27.69 c -31.17 c 81.90 b 76.19 b 66.50 b
Phosphorus rates (P)
No P 1959.85 963.50 b -18.81 b -21.33 -24.36 83.75 79.45 b 74.49
31 mg P2O5/kg soil 2118.56 1325.61 a -15.07 a -19.33 -22.67 84.69 81.02 a 74.61
Soybean cultivars (C)
KKU74 2096.06 1149.79 -15.93 -18.99 a -22.11 a 87.12 a 84.13 a 78.14 a SJ5 1982.36 1139.43 -17.94 -21.68 b -24.92 b 81.31 b 76.34 b 70.96 b
Ground water levels (W) ns ** ** ** ** ** ** ** Phosphorus rates (P) ns * ** ns ns ns * ns
Soybean cultivars (C) ns ns ns * * ** ** **
CxP ns * ns ns ns ns ns ns
CxW ns ns ns ns ns ** ** ns PxW ns ns ns ns ns ns ns ns
CxPxW ns ns ns ns ns ns ns ns
C.V. (%) 25.70 26.50 18.18 16.63 14.98 3.69 2.76 6.76
R5, R6, R7 =, beginning seed, full seed, and beginning maturity stages, respectively. *, ** = significant at p<0.05 and p<0.01,
respectively. Mean in the same column with the same letters are not significantly different by LSD at p<0.05 and p<0.01,
respectively.
cultivars had no significant effect on RLD at 0-15 cm soil
depth at 30 DAE, but subsequently, KKU74 had the highest
RLD, reaching 0.88 cm cm3 at 60 DAE (Fig. 4f). There was no effect on RLD from the interaction between the soybean
cultivars and P application rates. In the greenhouse and field
conditions, P application significantly increased RLD when
the soybean suffered from the drying of the soil.
Discussion
In the greenhouse experiment, interactions among treatments had significant effects on 100-seed weight. SJ5 with P grown
under the most severe W2 water recession regime had
lower100-seed weight than did KKU74 with P, and
consequently decreased grain yield due to the lowest root and
shoot growth. This may be the result of less favorable plant
water status resulting from decreased water uptake due to lower root length density at deeper soil depths (75 cm below
the soil surface). This in turn resulted in decreased leaf area
and shoot dry weight. This may be the result of decreased
photosynthesis as well as reduced partitioning of photosynthase into the seed under drought condition, as
evidenced by decreased 100-seed weight, shelling percentage
and consequent grain yield reduction. In addition, water
deficits have been shown to increase seed abortion, and the duration of the maturation period has been reduced by stress
during seed filling, leading to accelerated senescence
(Desclaux and Roumet, 1996) and decreased seed yield and
86
FC
PWP
(a)
0
2
4
6
8
10
12
14
16
18
20
1 2 3 4 5 6 7 8 9 10 11 12 13 14 15 16
0-15 cm depth
15-30 cmdepth
Soil m
ois
tu
re con
ten
t (%
w/w
)
Week after planting
Flowering Harvesting
Flowering
Harvesting
0
5
10
15
20
25
30
35
40
-130
-120
-110
-100
-90
-80
-70
-60
-50
-40
-30
-20
-10
0
1 2 3 4 5 6 7 8 9 10 11 12 13 14 15 16
Ra
infa
ll (m
m)
Gro
un
d w
ater d
ep
th
(cm
)
Week after planting
Soil surface
(b)
Fig 3. Average soil moisture content at (a) 0-15 cm, 15-30 cm depth and (b) ground water depth, rainfall during the field
experimental period in 2006-2007 (1 December-22 March). Recorded by Khon Kaen meteorological station.
b
a
(b)
0
1
2
3
4
5
6
7
8
9
R5 R6 R8
Growth stages
KKU74
SJ5
Ro
ot
dry
weig
ht (
g/p
ot)
R6,R8 stageF-test
C ns
P ns
W **
CxP ns
CxW ns
PxW ns
CxPXW ns
a
a
R5 stageF-testC **
P ns
W ns
CxP ns
CxW ns
PxW ns
CxPxW ns
ab
abb
b
0
1
2
3
4
5
6
7
8
9
R5 R6 R8
Growth stages
Greenhouse condition
W0
W1
W2
(a)
Ro
ot
dry
weig
ht (
g/p
ot)
aba
(d)
aa
b b
0
0.001
0.002
0.003
0.004
0.005
0.006
0.007
0.008
0.009
0.01
30DAE 45DAE 60DAE
Day after emergence (DAE)
CM60
KKU74
SJ5
Den
sity
of r
oo
t d
ry
weig
ht
(g
/cm
3)
b
30 DAE
F-test
C *
P *
CxP ns
(c)45 DAE
F-test
C *
P ns
CxP ns
a a
0
0.001
0.002
0.003
0.004
0.005
0.006
0.007
0.008
0.009
0.01
30DAE 45DAE 60DAE
Day after emergence (DAE)
Field condition
NoP
29 kg P2O5ha-1
58 kg P2O5ha-1
Den
sity
of r
oo
t d
ry
weig
ht
(g
/cm
3)
ab
aba
a(f)
b
b
0
0.1
0.2
0.3
0.4
0.5
0.6
0.7
0.8
0.9
30DAE 45DAE 60DAE
Day after emergence (DAE)
CM60
KKU74
SJ5
RL
D (
cm
/cm
3) a
t 0
-1
5 cm
so
il d
ep
th
45 , 60 DAE
F-test
C **
P **
CxP ns
b
babab
(e)
aa
0
0.1
0.2
0.3
0.4
0.5
0.6
0.7
0.8
0.9
30DAE 45DAE 60DAE
Day after emergence (DAE)
Field conditionNoP
29 kg P2O5ha-1
58 kg P2O5ha-1
RL
D(cm
/cm
3) a
t 0
-1
5 c
m so
il d
ep
th
Fig 4. Root dry weight, density of root dry weight, and root length density (RLD) of soybeans cultivars, three water table levels, and
phosphorus rates under greenhouse and field conditions. Values followed by the same letter at each growth stage were not
significantly different at 0.05 and 0.01 probability. Error bars represent standard errors.
yield components (Sincik et al., 2008). Ground water level
recession had significant negative effects on the grain yield of
the soybeans. The most rapid ground water level recession regime (W2) had the lowest grain yield due to the soybeans
suffering from a water deficit at the R5 stage, resulting in
decreased root dry weight, root length density, leaf area, total
shoot dry weight, RWC, LWP, the number of pods per plant, 100-seed weight and harvest index. Root dry weight and root
length density have been shown to decrease under water
deficits and have resulted in decreased water and nutrient
uptake (Stanley et al., 1980; Shimada et al., 1995), reduced water content of soybean leaves, and reduced leaf area
(Shimada et al., 1997; Gutierrez-Boem and Thomas, 2001).
A decrease in leaf area under water stress resulted in
decreased photosynthesis (Boyer, 1982; Sarwar, 2002), reduced transpiration and cell expansion (Boyer, 1982), and
consequently reduced total top dry weight and yield
components (Liu et al., 2004). Water deficits increased total
soluble carbohydrates and sucrose, reduced carbohydrates,
and caused accumulation of proline and free amino acids in the leaves of soybeans (Da Silva Lobato et al., 2008) and
other plants, resulting in decreased LWP. Under water stress,
soybean leaves had a RWC less than 80%, and the LWP of
soybean leaves was less than –10.2 bar, resulting in a rapid decrease in net photosynthesis (Flexas et al., 2006; Lei et al.,
2006). Soybean stomatal resistance increased during dry
periods due to plants adapting to drought by closing part of
their stomata to reduce transpiration (Sionit and Kramer, 1976). In this study, P application rates had no significant
effects on grain yield. However, P application tended to
produce higher grain yields than without P application due to
increased root and shoot growths, increased stomatal resistance, improved plant water status, and increased
harvest index. P has been shown to contribute to greater

87
Table 5. The interaction among treatments of 100-seed weight, shoot dry weight, stomatal resistance, leaf area and relative leaf water
content (RWC) under greenhouse conditions.
100-seeds weight (g) Stomatal resistance (s/cm)
Cultivars No P 31 mg P2O5 /kg soil R6 stage
KKU74 14.29 a 16.59 a Cultivars W0 W1 W2
SJ5 9.64 b 10.63 b KKU74 2.76 a 11.29 a 12.08 a
Mean 11.97 13.61 SJ5 0.82 b 1.22 b 1.27 b
Mean 1.79 6.26 6.68
R7 stage
100-seeds weight (g) KKU74 2.38 12.22 14.18 a
Cultivar*Phosphorus W0 W1 W2 SJ5 1.77 5.66 6.47 b
KKU74 without P 17.01 ab 12.10 ab 12.31 a Mean 2.08 8.94 10.33
KKU74 with P 19.83 a 17.64 a 13.74 a
SJ5 without P 10.48 c 8.86 b 8.48 b SJ5 with P 13.87 bc 9.53 b 9.58 ab Leaf area (cm2/pot)
Mean 15.30 12.03 11.03 R6 stage
Cultivars No P 31 mg P2O5 /kg soil
KKU74 726.80 1572.5 a
Shoot dry weight (g/pot) SJ5 1078.70 1200.2 b
R5 stage Mean 902.75 1386.35
Phosphorus rates W0 W1 W2 No P 26.60 b 27.28 25.60
31 mg P2O5 /kg soil 31.62 a 28.17 27.72 RWC (%)
Mean 29.11 27.73 26.66 R5 stage
R6 stage Cultivars W0 W1 W2
No P 40.85 b 35.07 29.02 KKU74 87.80 86.88 a 86.89 a
31 mg P2O5 /kg soil 48.88 a 36.47 35.15 SJ5 87.10 79.72 b 77.12 b
Mean 44.87 35.77 32.09 Mean 87.45 83.30 82.01
R8 stage R6 stage
No P 42.45 b 39.58 34.32 KKU74 87.71 83.15 a 81.53 a
31 mg P2O5 /kg soil 57.52 a 43.05 35.20 SJ5 85.52 72.59 b 70.85 b
Mean 49.99 41.32 34.76 Mean 86.62 77.87 76.19
W0, W1, W2 = ground water level maintained at 80 cm depth, ground water level recession at 5 cm, and 10 cm every 2 weeks,
respectively. R5, R6, R7, R8 =beginning seed, full seed, beginning maturity and full maturity stages, respectively. Mean in the same
column with the same letters are not significantly different by LSD at p<0.05 and p<0.01, respectively.
root dry weight and root length density, resulting in increased
water and nutrient uptake (Jin et al., 2005; Jin et al., 2004).
Stomatal resistance increased when soybean received P fertilizer due to the soybean plant closing part of its stomata
to keep water from leaving the plant and thereby maintaining
plant water status. The fact that P fertilizer contributed to
stomatal closure may be due to increased abscisic acid (ABA) translocation into guard cells. ABA levels rose rapidly to 20
times greater than non-stressed plants when plants were
subjected to water stress for 120 minutes (Beardsell and
Cohen, 1975). Phosphorus deficiency in plants resulted in reduced leaf conductance and inhibited import and transport
in the xylem (Jeschke et al., 1997). LWP and RWC were
higher when the soybeans received P than when they had not
as the P application stimulated root growth, and thereby increasing water and nutrient uptake, enabling the plant to
maintain plant water status under drought conditions. The
harvest index increased with P application due to higher root
and shoot growths, and greater LWP and RWC. These results suggest that the soybean partitioned more photosynthase into
the soybean seed, as evidenced by greater 100-seed weight
with P application. This is similar to the results of Desclaux
and Roumet (1996), in which P fertilizer increased root growth, shoot growth, plant water status and harvest index.
These results are also similar to Jin et al. (2005) and Jin et al.
(2004). Soybean cultivars differed in grain yield. KKU74 had
higher grain yield than did SJ5, due to its higher root length
density, leaf area, shoot dry weight, LWP, RWC, stomatal
resistance, number of seeds per pod, 100-seed weight, harvest
index and shelling percentage. KKU74 adapted to drought by producing roots at deeper soil depth (75 cm below the soil
surface), enabling it to increase water and nutrient uptake,
and maintain plant water status. This was evidenced in
increased LWP, RWC, leaf area, shoot dry weight, and yield components. KKU74 appeared to keep more water in the
plant by closing some parts of its stomata, resulting in
increased stomatal resistance. Other studies have also found
differences in the ability of different cultivars to partition photosynthase into roots, main stems, branches and seeds
(Desclaux and Roumet, 1996), and differences in shoot-root
ratios, reflecting different partitioning into biomass of stems,
leaves and seed yield in soybean (Jin et al., 2006; Zhang et al., 2004). Some soybean cultivars produce fewer roots but
may have a greater proportion of their roots deeper in the
profile, enabling greater water and nutrient uptake under
water stress (Brown and Scott, 1984). Taken as a whole, the above results showed that KKU74 was better adapted to
drought than was SJ5. Under field conditions, the maximum
grain yield, number of pods per plant, and number of seeds
per pod were obtained when the soybean received fertilizer at the rate of 58 kg p2o5 ha-1. This was likely due to the crop
having a higher leaf area per plant, LAI, total shoot dry
weight, plant height, density of root dry weight, and root

88
(a)
KKU74
without P
0 0.5 1 1.5 2 2.5 3 3.5 4
-
-
-
-
-
-
-
-
-
RLD (cm/cm3)
So
il d
ep
th f
ro
m s
oil
su
rfa
ce (
cm
)
W0 (b)
KKU74
without P
0 0.5 1 1.5 2 2.5 3 3.5 4
-
-
-
-
-
-
-
-
-
RLD (cm/cm3)
So
il d
ep
th f
ro
m s
oil
su
rfa
ce (
cm
)
W1 (c)
KKU74
without P
0 0.5 1 1.5 2 2.5 3 3.5 4
-
-
-
-
-
-
-
-
-
RLD (cm/cm3)
So
il d
ep
th f
ro
m s
oil
su
rfa
ce (
cm
)
W2
(g)
KKU74
with P
0 0.5 1 1.5 2 2.5 3 3.5 4
-
-
-
-
-
-
-
-
-
RLD (cm/cm3)
So
il d
ep
th f
ro
m s
oil
su
rfa
ce (
cm
)
W0 (h)
KKU74
with P
0 0.5 1 1.5 2 2.5 3 3.5 4
-
-
-
-
-
-
-
-
-
RLD (cm/cm3)
So
il d
ep
th f
ro
m s
oil
su
rfa
ce (
cm
)
W1 (i)
KKU74
with P
0 0.5 1 1.5 2 2.5 3 3.5 4
-
-
-
-
-
-
-
-
-
RLD (cm/cm3)
So
il d
ep
th f
ro
m s
oil
su
rfa
ce (
cm
)
W2
(d)
SJ5
without P
0 0.5 1 1.5 2 2.5 3 3.5 4
-
-
-
-
-
-
-
-
-
RLD (cm/cm3)
So
il d
ep
th f
ro
m s
oil
su
rfa
ce (
cm
)
W0 (e)
SJ5
without P
0 0.5 1 1.5 2 2.5 3 3.5 4
-
-
-
-
-
-
-
-
-
RLD (cm/cm3)
So
il d
ep
th f
ro
m s
oil
su
rfa
ce (
cm
)
W1 (f)
SJ5
without P
0 0.5 1 1.5 2 2.5 3 3.5 4
-
-
-
-
-
-
-
-
-
RLD (cm/cm3)
So
il d
ep
th f
ro
m s
oil
su
rfa
ce (
cm
)
W2
(j)
SJ5 with P
0 0.5 1 1.5 2 2.5 3 3.5 4
-
-
-
-
-
-
-
-
-
RLD (cm/cm3)
So
il d
ep
th f
ro
m s
oil
su
rfa
ce (
cm
)
W0 (k)
SJ5 with P
0 0.5 1 1.5 2 2.5 3 3.5 4
-
-
-
-
-
-
-
-
-
RLD (cm/cm3)
So
il d
ep
th f
ro
m s
oil
su
rfa
ce (
cm
)
W1 (l)
SJ5 with P
0 0.5 1 1.5 2 2.5 3 3.5 4
-
-
-
-
-
-
-
-
-
RLD (cm/cm3)
So
il d
ep
th f
ro
m s
oil
su
rfa
ce (
cm
)
W2
Fig 5. Root length density distribution with depth of soybean cultivars grown with three ground water levels at R8 stage under
greenhouse condition. Error bars represent standard errors.
length density. Soybean yield was very low (229 to 409 kg
ha-1) due to the plants having suffered from drought and consequently having reduced root and shoot growth. This was
indicated by soil moisture content reduced close to PWP in
the 12th and 13th weeks at 0- cm depth from the soil’s
surface. The root could not also penetrate to deeper soil layer by soil hardpan for water uptake. P application at the rate of
58 kg P2O5 ha-1 significantly increased the density of root dry
weight and root length density over the control. This
indicated that P contributed to root growth. However, in this experiment, root growth did not extend below15 cm soil
depth due to root growth having been inhibited by a soil
hardpan. This result is similar to the result of Grecu et al.
(1988), who reported that a clay pan soil inhibited root growth and water uptake. Sub-soiling tends to produce higher
root growth of soybean than no-sub soiling. Application of P
at any rate had no significant effect on leaf area per plant,
LAI, and total shoot dry weight compared to the control of no
P application. This was probably due to the presence of sufficient amounts of phosphorus (13 ppm) in the soil for
soybean growth. The critical level of available P in soil for
soybeans is 12 ppm (Rattanarat, 1999). In general, farmers
applied 16-16-8 (N, P2O5, K2O) fertilizer at a rate of 94 kg ha-1 to rice at the panicle initiation growth stage. Some P
remains in the soil after rice harvesting. Kirchhof et al.
(2000) reported that residual fertilizer effects from the
previous rice crop could limit the response of soybean to P fertilizer. Suwanarit et al. (1978) reported that the addition of
P of 11.3 ppm in the soil did not affect soybean growth.
However, in the present experiment, P application at the rate
of 58 kg p2o5ha-1 resulted in better growth than P application at the rate of 29 kg p2o5ha-1. This was probably due to an
increased quantity of P in the soil. Under both greenhouse
and field conditions, KKU74 with P fertilizer had the highest

89
Table 6. Mean squares from analysis of variance (ANOVA) for shoot dry weight, stomatal resistance leaf area, and leaf area index
(LAI) under field conditions.
Shoot dry weight (g/plant) Stomatal resistance (s/cm)
Source of variation DF 30 DAE 45 DAE 60 DAE 30 DAE 45 DAE 60 DAE
Rep 3 0.10 3.27 19.16 1.29 0.14 0.36
Soybean cultivars (C) 2 0.25** 2.10* 15.15* 5.21 4.35** 0.69
Error 6 0.01 0.34 2.77 2.42 0.23 0.59 Phosphorus rates (P) 2 0.02 0.22 0.91 0.64 1.85** 0.71
CxP 4 0.01 0.99* 0.35 0.06 0.69* 0.04
Error 18 0.02 0.30 1.28 0.74 0.19 0.36
Total 35
Source of variation
Leaf area (cm2/plant) LAI
DF 30 DAE 45 DAE 60 DAE 30 DAE 45 DAE 60 DAE
Rep 3 2547 42329 139492 0.010 0.169 0.552
Soybean cultivars (C) 2 4997** 18792* 67657 0.019** 0.076* 0.271 Error 6 217 3905 19124 0.001 0.016 0.076
Phosphorus rates (P) 2 720 2857 11944 0.003 0.011 0.050
CxP 4 295 13590* 5689 0.001 0.054* 0.023
Error 18 288 4615 11730 0.001 0.019 0.047 Total 35
DF, DAE = degrees of freedom and days after emergence, respectively. *, ** = significant at p<0.05 and p<0.01, respectively.
Table 7. Shoot dry weight, stomatal resistance, leaf area, and LAI of three soybean cultivars at 45 DAE grown under different
phosphorus rates under field conditions.
Shoot dry weight (g/plant) Stomatal resistance (s/cm)
Cultivars No P 29 kg P2O5/ha 58 kg P2O5/ha No P 29 kg P2O5/ha 58 kg P2O5/ha
CM60 2.73 ab 3.41 a 2.36 0.74 0.86 1.07 ab
KKU74 2.80 a 2.56 ab 2.69 0.85 0.86 1.16 a
SJ5 1.60 b 1.95 b 2.59 0.91 0.73 0.83 b
Mean 2.38 2.64 2.55 0.83 0.82 1.02
Leaf area (cm2/plant) Leaf area index (LAI)
CM60 299.6 ab 360.99 a 260.07 0.60 ab 0.72 a 0.52
KKU74 329.07 a 295.74 ab 332.79 0.66 ab 0.59 ab 0.67
SJ5 193.49 b 221.35 b 321.17 0.39 b 0.45 b 0.64
Mean 274.05 292.69 304.68 0.55 0.59 0.61
Mean in the same column with the same letters are not significantly different by DMRT at p<0.05.
grain yield and was better adapted to drought. This was due
to higher root growth, shoot growth, RWC, LWP, leaf area, and LAI than the other cultivars with P application. Shoot
and root growth and yield decreased when soybean subjected
to water stress of the both conditions. The results of these
experiments indicated that ground water level beginning before planting at lower than 80 cm depth below soil surface
could not appropriate to growing soybean after rice. Ground
water level recession rapidly reduced growth and yield
significantly at all soybean cultivars due to the plants subjected to water deficit at the reproductive stage under
greenhouse and field conditions. These results overall
indicate that not only a shallow water table, but also gradual
depletion of the water table and adequate P in the soil are essential conditions for good post-rice soybean production.
Soil mulching may help retard rapid water table reduction,
and so, may be a useful and important strategy to improve the
growth and yield of soybeans after rice harvesting.
Materials and methods
Greenhouse experiment
Experimental design and treatments
A pot experiment was conducted from March to June 2009 in the greenhouse of the Department of Plant Science and
Agricultural Resources, Faculty of Agriculture, Khon Kaen
University, Thailand, under natural sunlight and photoperiods. The experimental design was a randomized
complete block design (RCBD) with 3 replications of a
2x2x3 factorial arrangement of treatments. Each experimental
unit contained 3 sets of plants, for destructive sampling at different stages. The experimental conditions constituted:
two soybean cultivars, KKU74 (an improved cultivar by
Khon Kaen University of Thailand) and SJ5 (a traditional
Thai variety); two P rates, 0 and 31 mg P2O5 kg -1 soil; and three ground water level regimes, ground water level at 80
cm depth below soil surface maintained during the entire
growing period (control or W0), ground water level
beginning at 80 cm depth and receding about 5 cm every 2 weeks (W1), and ground water level beginning at 80 cm
depth and receding about 10 cm every 2 weeks (W2).
Plant materials and culture
The containers used in the experiment were columns made of
PVC plastic, 145 cm in height and 25 cm in diameter. A hole
was drilled at the bottom of each PVC column to permit water diffusion up through the soil profile. Each PVC column
was put in a plastic pot (56 cm height and 42 cm diameter)
for ground water level control. In the W1 and W2 treatments,
ground water levels were reduced by using a hand water pump to remove water from the plastic pot, while in the W0
90
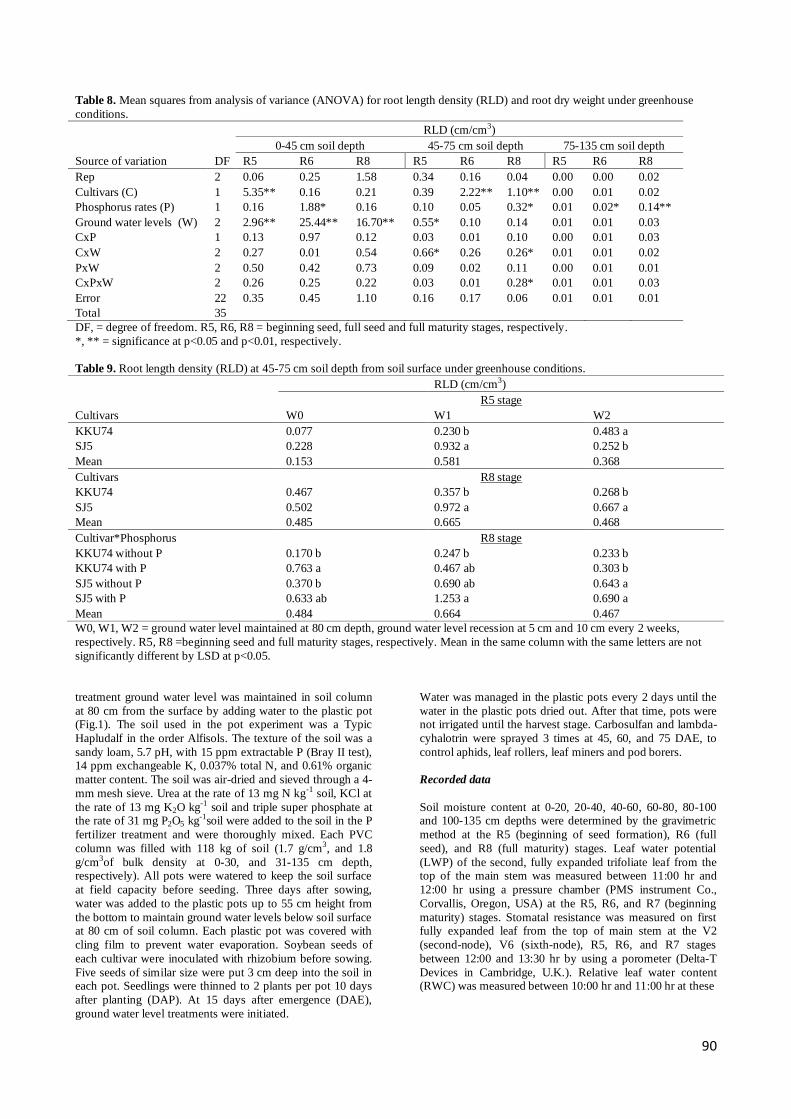
Table 8. Mean squares from analysis of variance (ANOVA) for root length density (RLD) and root dry weight under greenhouse
conditions.
RLD (cm/cm3)
0-45 cm soil depth 45-75 cm soil depth 75-135 cm soil depth
Source of variation DF R5 R6 R8 R5 R6 R8 R5 R6 R8
Rep 2 0.06 0.25 1.58 0.34 0.16 0.04 0.00 0.00 0.02
Cultivars (C) 1 5.35** 0.16 0.21 0.39 2.22** 1.10** 0.00 0.01 0.02
Phosphorus rates (P) 1 0.16 1.88* 0.16 0.10 0.05 0.32* 0.01 0.02* 0.14**
Ground water levels (W) 2 2.96** 25.44** 16.70** 0.55* 0.10 0.14 0.01 0.01 0.03
CxP 1 0.13 0.97 0.12 0.03 0.01 0.10 0.00 0.01 0.03
CxW 2 0.27 0.01 0.54 0.66* 0.26 0.26* 0.01 0.01 0.02
PxW 2 0.50 0.42 0.73 0.09 0.02 0.11 0.00 0.01 0.01
CxPxW 2 0.26 0.25 0.22 0.03 0.01 0.28* 0.01 0.01 0.03
Error 22 0.35 0.45 1.10 0.16 0.17 0.06 0.01 0.01 0.01
Total 35
DF, = degree of freedom. R5, R6, R8 = beginning seed, full seed and full maturity stages, respectively.
*, ** = significance at p<0.05 and p<0.01, respectively.
Table 9. Root length density (RLD) at 45-75 cm soil depth from soil surface under greenhouse conditions.
RLD (cm/cm3)
R5 stage
Cultivars W0 W1 W2
KKU74 0.077 0.230 b 0.483 a
SJ5 0.228 0.932 a 0.252 b
Mean 0.153 0.581 0.368
Cultivars R8 stage
KKU74 0.467 0.357 b 0.268 b
SJ5 0.502 0.972 a 0.667 a
Mean 0.485 0.665 0.468
Cultivar*Phosphorus R8 stage
KKU74 without P 0.170 b 0.247 b 0.233 b
KKU74 with P 0.763 a 0.467 ab 0.303 b
SJ5 without P 0.370 b 0.690 ab 0.643 a
SJ5 with P 0.633 ab 1.253 a 0.690 a
Mean 0.484 0.664 0.467
W0, W1, W2 = ground water level maintained at 80 cm depth, ground water level recession at 5 cm and 10 cm every 2 weeks,
respectively. R5, R8 =beginning seed and full maturity stages, respectively. Mean in the same column with the same letters are not
significantly different by LSD at p<0.05.
treatment ground water level was maintained in soil column
at 80 cm from the surface by adding water to the plastic pot (Fig.1). The soil used in the pot experiment was a Typic
Hapludalf in the order Alfisols. The texture of the soil was a
sandy loam, 5.7 pH, with 15 ppm extractable P (Bray II test), 14 ppm exchangeable K, 0.037% total N, and 0.61% organic
matter content. The soil was air-dried and sieved through a 4-
mm mesh sieve. Urea at the rate of 13 mg N kg-1 soil, KCl at
the rate of 13 mg K2O kg-1 soil and triple super phosphate at the rate of 31 mg P2O5 kg-1soil were added to the soil in the P
fertilizer treatment and were thoroughly mixed. Each PVC
column was filled with 118 kg of soil (1.7 g/cm3, and 1.8
g/cm3of bulk density at 0-30, and 31-135 cm depth, respectively). All pots were watered to keep the soil surface
at field capacity before seeding. Three days after sowing,
water was added to the plastic pots up to 55 cm height from
the bottom to maintain ground water levels below soil surface at 80 cm of soil column. Each plastic pot was covered with
cling film to prevent water evaporation. Soybean seeds of
each cultivar were inoculated with rhizobium before sowing.
Five seeds of similar size were put 3 cm deep into the soil in each pot. Seedlings were thinned to 2 plants per pot 10 days
after planting (DAP). At 15 days after emergence (DAE),
ground water level treatments were initiated.
Water was managed in the plastic pots every 2 days until the
water in the plastic pots dried out. After that time, pots were not irrigated until the harvest stage. Carbosulfan and lambda-
cyhalotrin were sprayed 3 times at 45, 60, and 75 DAE, to
control aphids, leaf rollers, leaf miners and pod borers.
Recorded data
Soil moisture content at 0-20, 20-40, 40-60, 60-80, 80-100 and 100-135 cm depths were determined by the gravimetric
method at the R5 (beginning of seed formation), R6 (full
seed), and R8 (full maturity) stages. Leaf water potential
(LWP) of the second, fully expanded trifoliate leaf from the top of the main stem was measured between 11:00 hr and
12:00 hr using a pressure chamber (PMS instrument Co.,
Corvallis, Oregon, USA) at the R5, R6, and R7 (beginning
maturity) stages. Stomatal resistance was measured on first fully expanded leaf from the top of main stem at the V2
(second-node), V6 (sixth-node), R5, R6, and R7 stages
between 12:00 and 13:30 hr by using a porometer (Delta-T
Devices in Cambridge, U.K.). Relative leaf water content (RWC) was measured between 10:00 hr and 11:00 hr at these
91
same stages using three leaflets of the first fully expanded
trifoliate leaf from the top of the main stem of one plant in
each pot. Relative leaf water content was calculated
according to Barr and Weatherley’s method (1962). Shoot dry weight was also determined at the R5, R6 and R8 stages.
Each plant was carefully removed from its column by cutting
off its stem above the soil surface. Each plant was separated
into leaves, stems and pods. Leaf area was measured using a Li-COR 3100 leaf area meter (Lincoln, NE, USA). Plant
parts were dried in an oven at 800C for 48 hours before dry-
weight measurements were made. For root sampling, each
soil column was divided into 15-cm depth intervals. Roots were extracted from each segment by washing them with
water until they were free of soil. During the washing, a sieve
with a mesh size of 1 mm was used to recover fine roots.
Roots were scanned and total root length was measured by analyzing pictures taken with a WinRHIZO pro V2004a
(Reagent Instruments Inc. Canadian company, Que, Canada).
Root length density was calculated by dividing total root
length (cm) by soil volume (cm3). Root dry weight was determined by drying the roots at 800C for 48 hours. Plant
samples were taken at the R8 stage for measurement of
numbers of pods and branches per plant. Ten pods were taken
at random to determine the number of seeds per pod. Hundred seeds weight was determined from two plants in
each pot. Grain yield was calculated as the seed dry weight
obtained from two plants in each pot. Harvest index was
calculated by dividing seed dry weight by shoot dry weight. Shelling percentage was calculated by dividing the seed dry
weight by the pod dry weight and multiplied by one hundred.
Statistical analysis
Analysis of variance (ANOVA) for all data was performed
using Statistix 8 software (Analytical Software, Tallahassee,
Florida, USA). The significance of mean differences was determined at the 0.05 and 0.01 probability levels. The Least
Significant D (LSD) was used to compare means.
Field experiment
Plant culture and treatments
The field experiment was conducted from December 2006 to March 7 in a farmer’s field in Ban Fang district, Khon
Kaen province. The soil was a Typic Hapludalf of the order
Alfisols. The texture of soil was a sandy loam, 5.9 pH, with
0.033% total N, 13 ppm available P (Bray II test), 15 ppm exchangeable K, 0.72% organic matter content, 17.02% field
capacity, and 2.61% permanent wilting point. A randomized
complete block design with three replications of a split plot
arrangement of treatments was used. Three soybean cultivars (high yield, widely used cultivar in northeast of Thailand and
recommended by the Department of Agriculture), Chiangmai
60 (CM60), KKU74, and SJ5 were assigned as main plots,
with three levels of P application: 0, 29, and 58 kg P2O5 ha-1 as sub plots. Plot size was 5 m × 4 m with spacing of 50 cm
between rows and 20 cm between each plant in a row. The
entire experimental area was ploughed twice and harrowed
prior to planting. Urea at the rate of 19 kg N ha-1 and KCl at the rate of 19 kg K2O ha-1 were applied into the soil before
seeding in all treatments. The three rates of P were also
applied into the soil before seeding. The seeds
of all cultivars were inoculated with rhizobium before
seeding. Four to five seeds were dropped in the furrows and
covered using a Planet Junior hand-pushed seeder. Plants
were thinned to 2 plants per hill at 15 days after planting (DAP) with plant population of 200,000 plants ha-1. Plants
were not irrigated throughout growing season. Hand weeding
was done at 15 and 30 DAP. For insect control, triazophos
and carbosulfan were sprayed 4 times at 30, 45, 60 and 75 DAE to control leaf rollers, leaf miners and pod borers.
Recorded data
The moisture content of soil samples from 0-15 cm and 15-30
cm depths was determined by using the gravimetric
procedure at 7 DAP and at weekly intervals thereafter until
harvesting. Ground water depth was measured at 7 DAP and weekly intervals thereafter until harvesting by using an
observation well of perforated PVC tube 2 m long installed to
a 1.50 m depth in each replication. Rainfall was recorded at
weekly intervals thereafter until harvest at the Khon Kaen meteorological station. Four plants from each plot were taken
at 30, 45 and 60 days after emergence (DAE) for shoot dry
weight and leaf area measurements. LAI was calculated as
the ratio between leaf area and the corresponding ground surface area. Stomatal resistance, yield, yield components, HI
and Percentage of shelling were measured as in the
greenhouse experiment. The harvesting area in each plot was
3 m2. Root samples were taken by using soil cores at 0-15 cm, 15-30 cm and 30-45 cm soil depths. Root growth was
also measured as in the greenhouse experiment.
Statistical analysis
Analysis of variance (ANOVA) for all data was performed
using MSTAT-C software (Analytical Software, Michigan
State University, Michigan, USA). Duncan’s Multiple Range Test (DMRT) was used to compare treatment means when
the F-test was significant. Density of root dry weight was
calculated by dividing total root dry weight (g) by soil
volume (cm3).
Acknowledgements
This research was financially supported by the Royal Golden Jubilee Program of the Thailand Research Fund (Grant no.
PHD/0083/2548). The authors thank Prof. Dr. Mary Beth
Kirkham, Department of Agronomy, Kansas State University,
for reviewing this manuscript and making useful suggestions.
References
Barr HD, Weatherley PE (1962) A re-examination of the relative turgidity technique for estimating water deficit in
leaves. Aust J Biol Sci 15:413-428
Beardsell MF, Cohen D (1975) Relationships between leaf
water status, abscisic acid levels, and stomatal resistance in maize and sorghum. Plant Physiol 56:207-212
Bell RW, Seng V (2004) Rainfed lowland rice-growing soils
of Cambodia, Laos, and Northeast Thailand. In: Seng V,
Craswell E, Fuikai S, Fischer K (eds) Water in Agriculture. ACIAR Proceedings No.116e, p 161-173
Boyer JS (1982) Plant productivity and environment. Science
218:443-448
91
Brown DA, Scott HD (1984) Dependence of crop growth and
yield on root development and activity. In: Roots, nutrient and water influx, and plant growth, publication No. 49.
American Society of Agronomy, Madison, Wisconsin. 101-
136
Da Silva Lobato AK, De Oliveira Neto CF, Dos Santos Filho BG, Da Costa RCL, Cruz FJR, Neves HKB, Dos Santos
Lopes MJ (2008) Physiological and biochemical behavior
in soybean (Glycine max cv. Sambaiba) plants under water
deficit. Aust J of Crop Sci 2(1):25-32 Desclaux D, Huynh TT, Roumet P (2000) Identification of
soybean plant characteristics that indicate the timing of
drought stress. Crop Sci 40: 716-722
Desclaux D, Roumet P (1996) Impact of drought stress on the phenology of two soybean (Glycine max L. Merr.)
cultivars. Field Crops Res 46:61-70
Dogan E, Kirnak H, Copur O (2007) Deficit irrigations
during soybean reproductive stages and CROPGRO-soybean simulations under semi-arid climatic conditions.
Field Crops Res 103:154-159
Flexas J, Ribas-Carbo M, Bota J, Galmes J, Henkle M,
Martinez-Canellas S, Medrano H (2006) Decreased Rubisco activity during water stress is not induced by
decreased relative water content but related to conditions of
low stomatal conductance and chloroplast CO2
concentration. New Phytol 127: 73-82 Frederick JR, Camp CR, Bauer PJ (2001) Drought-stress
effects on branch and main stem seed yield and
components of determinate soybean. Crop Sci 41: 759-763
Grecu SJ, Kirkham MB, Kanemasu ET, Sweeney DW, Stone LR, Milliken GA (1988) Penetration resistance, root
growth and water content in a subsoiled claypan. J Agron
Crop Sci 161:195-206
Gutierrez-Boem FH, Thomas GW (2001) Leaf area development in soybean as affected by phosphorus
nutrition and water deficit. J of Plant Nutr 24: 1711-1729
Jeschke WD, Peuke AD, Pate JS, Hartung W (1997)
Transport, synthesis and catabolism of abscisic acid (ABA) in intact plants of castor bean (Ricinus communis L.) under
phosphate deficiency and moderate salinity. J of Exp Bot
48 (314):1737-1747
Jin J, Liu XB, Wang GH (2002) Advance in root research of soybean [Glycine max (L.) Merrilt]. Soybean Sci 21: 223-
228
Jin J, Wang G, Liu X (2004) Phosphorus nutrient affects root
morphology response to water deficit at different reproductive stages in an early soybean cultivar.
Proceedings of the International Crop Science Congress,
Brisbane, Australia, 26 Sep.-1Oct. 2004 (Cited July 21,
2006). www. cropscience.org.au Jin J, Wang G, Liu X, Pan X, Herbert SJ (2005) Phosphorus
application affects the soybean root response to water
deficit at the initial flowering and full pod stages. Soil Sci
Plant Nutr 51 (7): 953-960 Jin J, Wang G, Liu X, Pan X, Herbert SJ, Tang C (2006)
Interaction between phosphorus nutrition and drought on
grain yield, and assimilation of phosphorus and nitrogen in
two soybean cultivars differing in protein concentration in grains. J of Plant Nutr 29: 1433–1449
Kirchhof G, So HB, Adisarwanto T, Utomo WH, Priyono S,
Prastowo B, Basir M, Lando TM, Subandi, Dacanay EV,
Tan-Elicano D, Sanidad WB (2000) Growth and yield response of grain legumes to different soil management
practices after rain-fed lowland rice. Soil & Tillage Res
56:51-66
Lei W, Tong Z, Shengyan D (2006) Effect of drought and rewatering on photosynthetic physioecological
characteristics of soybean. Acta Ecologica Sinica 26:2073-
2078 Liu F, Jensen CR, Andersen MN (2004) Drought stress effect
on carbohydrate concentration in soybean leaves and pods
during early reproductive development: its implication in
altering pod set. Field Crops Res 86:1-13 Marschner H (1995) Mineral nutrition of higher plants. 2nd
ed. Academic Press, New York. 312-104
Mejia MN, Madramootoo CA, Broughton RS (2000)
Influence of water table management on corn and soybean yields. Agric Water Mang 46:73-89
Office of Agricultural Economics (2010) Thailand foreign
agricultural trade statistics 2009. (Cited January 7, 2011).
Available at http://www.oae.go.th/statistic/ Polthanee A (1989) Field-level drainage requirement of pre-
rice mungbean crop in a waterlogged prone environment.
Ph.D. thesis, Graduate School University of the
Philippines, Los Banos, Philippines Raper CDJ, Osmond DL, Wann M, Weeks WW (1978)
Interdependence of root and shoot activities in determining
nitrogen uptake rate of roots. Bot Gaz (Chicago) 139: 289-
294 Rattanarat S (1999) Guidelines to improve soil and fertilizer
for soybean and peanut. Report of the conference, soil
management and fertilizer application to improve crop
yield. Department of Agriculture, Bangkok, Thailand. 55-79
Sarwar T (2002) Physiological response of soybean to
shallow water table depths. Pakistan J of Biol Sci 5:1300-
1308 Shimada S, Kokubun M, Matsui S (1995) Effects of water
table on physiological traits and yield of soybean: I. Effects
of water table and rainfall on leaf chlorophyll content, root
growth and yield. Jpn J Crop Sci 66:294-303 Shimada S, Kokubun M, Matsui S (1997) Effects of water
table on physiological traits and yield of soybean: II.
Effects of water table and rainfall on leaf water potential
and photosynthesis. Jpn J Crop Sci 66:108-117 Sincik M, Candogan BN, Demirtas C, Buyukcangas H,
Yazan S, Goksoy AT (2008) Deficit irrigation of soya bean
[Glycine max (L.) Merr.] in a sub-humid climate. J Agron
Crop Sci 194(3):200-205 Sionit N, Kramer PJ (1976) Water potential and stomatal
resistance of sunflower and soybean subjected to water
stress during various growth stages. Plant Physiol 58:537-
540 Sionit N, Kramer PJ (1977) Effect of water stress during
different stages of growth of soybean. Agron J 69:274-278
Stanley CD, Kaspar TC, Taylor HM (1980) Soybean top and
root response to temporary water tables imposed at three different stages of growth. Agron J 72:341-346
Suwanarit A, Potichan A, Quadir M, Suwanarit C (1978) Soil
factors limiting growth and yield of soybean growth on
Korat and Roi-et soil. Thai J Agri Sci 11:273-286 Vamerali T, Saccomani M, Bona S, Mosca G, Guarise M,
Ganis A (2003) A comparison of root characteristics in
relation to nutrient and water stress in two maize hybrids.
Plant Soil 255: 157-167 Zhang M, Duan L, Zhai Z, Li J, Tian X, Wang B, He Z, Li Z
(2004) Effect of plant growth regulators on water deficit-
induced yield loss in soybean. Proceedings of the
International Crop Science Congress, Brisbane, Australia, 26 Sep.–1 Oct. 2004 (Cited July 21, 2006). www.
cropscience.org.au
92