Growth and the Business Cycle at Boeing
34
© 2009 Prentice Hall Business Publishing Economics Hubbard/O’Brien UPDATE EDITION. Fernando & Yvonn Quijano Prepared by: Chapter 21 Economic Growth, the Financial System, and Business Cycles
-
Upload
bernadine-wolf -
Category
Documents
-
view
45 -
download
0
description
Growth and the Business Cycle at Boeing. Learning Objectives. In this chapter, we will provide an overview of long-run growth and the business cycle and discuss their importance for individual firms, for consumers, and for the economy as a whole. - PowerPoint PPT Presentation
Transcript of Growth and the Business Cycle at Boeing

© 2009 Prentice Hall Business Publishing Economics Hubbard/O’Brien UPDATE EDITION.
Fernando & Yvonn Quijano
Prepared by:
Chapter
21
Economic Growth, the Financial System, and Business Cycles
© 2009 Prentice Hall Business Publishing Economics Hubbard/O’Brien UPDATE EDITION. 2 of 34
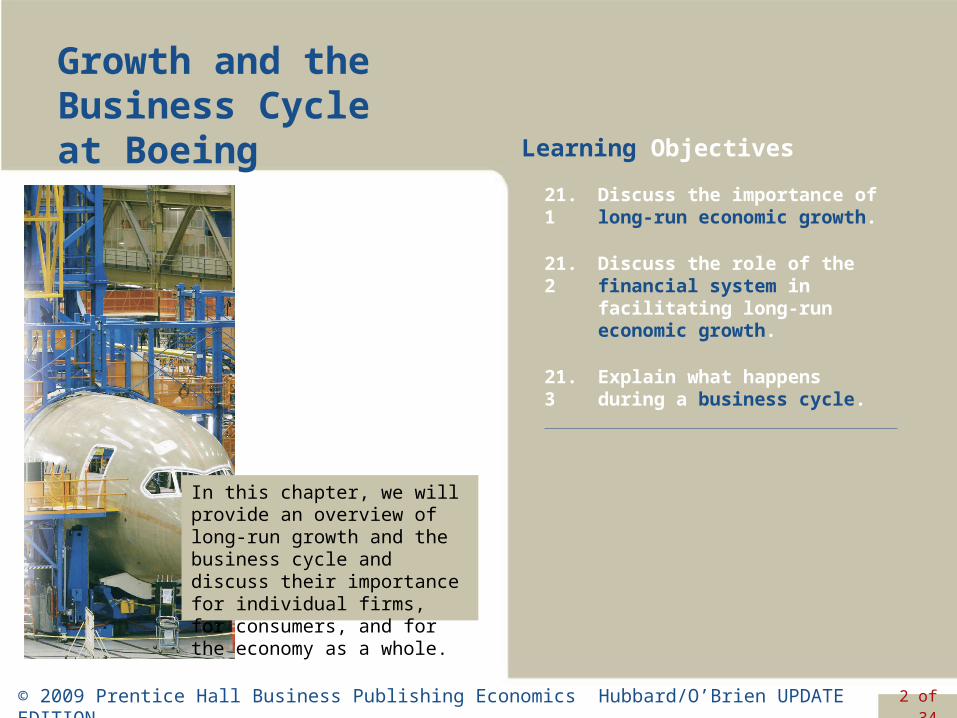
Growth and the Business Cycle at Boeing
21.1 Discuss the importance of long-run economic growth.
21.2 Discuss the role of the financial system in facilitating long-run economic growth.
21.3 Explain what happens during a business cycle.
Learning Objectives
In this chapter, we will provide an overview of long-run growth and the business cycle and discuss their importance for individual firms, for consumers, and for the economy as a whole.

Ch
apte
r 21
: E
con
om
ic G
row
th,
the
Fin
anci
al S
yste
m,
and
Bu
sin
ess
Cyc
les
© 2009 Prentice Hall Business Publishing Economics Hubbard/O’Brien UPDATE EDITION. 3 of 34
Recession 2 quarters negative growth
The Annual Unemployment Rate in the United States, 1950–2007

Ch
apte
r 21
: E
con
om
ic G
row
th,
the
Fin
anci
al S
yste
m,
and
Bu
sin
ess
Cyc
les
© 2009 Prentice Hall Business Publishing Economics Hubbard/O’Brien UPDATE EDITION. 4 of 34
The Growth in Real GDP per Capita, 1900–2007

Ch
apte
r 21
: E
con
om
ic G
row
th,
the
Fin
anci
al S
yste
m,
and
Bu
sin
ess
Cyc
les
© 2009 Prentice Hall Business Publishing Economics Hubbard/O’Brien UPDATE EDITION. 5 of 34
Learning Objective 21.1
The Connection between Economic Prosperity and Health
Makingthe
Connection

Ch
apte
r 21
: E
con
om
ic G
row
th,
the
Fin
anci
al S
yste
m,
and
Bu
sin
ess
Cyc
les
© 2009 Prentice Hall Business Publishing Economics Hubbard/O’Brien UPDATE EDITION. 6 of 34
rateGrowth
70 double toyears ofNumber
Growth equation
Calculating Growth Rates and the Rule of 70
€
y t = y0(1+ g)t
€
y t / y0 = (1+ g)t
ln(2) = t ln(1+ g)

Ch
apte
r 21
: E
con
om
ic G
row
th,
the
Fin
anci
al S
yste
m,
and
Bu
sin
ess
Cyc
les
© 2009 Prentice Hall Business Publishing Economics Hubbard/O’Brien UPDATE EDITION. 7 of 34
Productivity: y output per worker
Increases in capital per unit of labor (hour worked) k
Technological Change: A
What Determines the Rate of Long-Run Growth?
€
y = Ak β
Savings less depreciation and population growth
€
Δk = sy − (δ + n)k

Ch
apte
r 21
: E
con
om
ic G
row
th,
the
Fin
anci
al S
yste
m,
and
Bu
sin
ess
Cyc
les
© 2009 Prentice Hall Business Publishing Economics Hubbard/O’Brien UPDATE EDITION. 8 of 34
Solved Problem 21-1The Role of Technological Change in Growth
1960-1995, y-hat in Singapore 6.2% percent
Double about every 11.5 years.
Singapore’s growth depended more on increases in capital per hour worked
increases in the labor force participation rate,
transfer of workers from agricultural to nonagricultural jobs than on technological change.

Ch
apte
r 21
: E
con
om
ic G
row
th,
the
Fin
anci
al S
yste
m,
and
Bu
sin
ess
Cyc
les
© 2009 Prentice Hall Business Publishing Economics Hubbard/O’Brien UPDATE EDITION. 9 of 34
Learning Objective 21.1
What Explains Rapid Economic Growth in Botswana?
Makingthe
Connection
Ch
apte
r 21
: E
con
om
ic G
row
th,
the
Fin
anci
al S
yste
m,
and
Bu
sin
ess
Cyc
les
© 2009 Prentice Hall Business Publishing Economics Hubbard/O’Brien UPDATE EDITION. 10 of 34
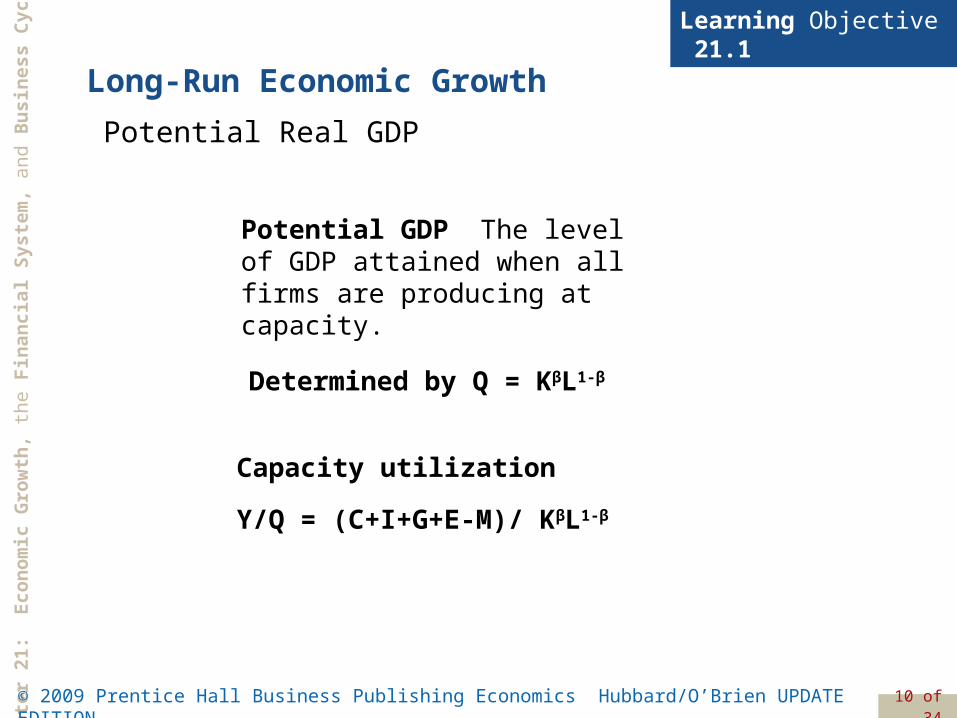
Long-Run Economic Growth
Learning Objective 21.1
Potential Real GDP
Potential GDP The level of GDP attained when all firms are producing at capacity.
Determined by Q = KβL1-β
Capacity utilization
Y/Q = (C+I+G+E-M)/ KβL1-β

Ch
apte
r 21
: E
con
om
ic G
row
th,
the
Fin
anci
al S
yste
m,
and
Bu
sin
ess
Cyc
les
© 2009 Prentice Hall Business Publishing Economics Hubbard/O’Brien UPDATE EDITION. 11 of 34
Potential Real GDP
Actual and Potential Real GDP

Ch
apte
r 21
: E
con
om
ic G
row
th,
the
Fin
anci
al S
yste
m,
and
Bu
sin
ess
Cyc
les
© 2009 Prentice Hall Business Publishing Economics Hubbard/O’Brien UPDATE EDITION. 12 of 34
Saving, Investment, and the Financial System
Learning Objective 21.2
An Overview of the Financial System
Financial markets Markets where financial securities, such as stocks and bonds, are bought and sold.
Financial intermediaries Firms, such as banks, mutual funds, pension funds, and insurance companies, that borrow funds from savers and lend them to borrowers.
Financial system The system of financial markets and financial intermediaries through which firms acquire funds from households.

Ch
apte
r 21
: E
con
om
ic G
row
th,
the
Fin
anci
al S
yste
m,
and
Bu
sin
ess
Cyc
les
© 2009 Prentice Hall Business Publishing Economics Hubbard/O’Brien UPDATE EDITION. 13 of 34
Saving, Investment, and the Financial System
Learning Objective 21.2
The Macroeconomics of Saving and Investment
Y = C + I + G + NX
Y = C + I + G
I = Y − C − G
privateS = Y + TR − C − T
publicS = T − G − TR

Ch
apte
r 21
: E
con
om
ic G
row
th,
the
Fin
anci
al S
yste
m,
and
Bu
sin
ess
Cyc
les
© 2009 Prentice Hall Business Publishing Economics Hubbard/O’Brien UPDATE EDITION. 14 of 34
Learning Objective 21.2
S = (Y + TR − C − T) + (T − G − TR)
S = Y − C − G
S = I
privateS publicSS = +
or
or
So, we can conclude that total saving must equal total investment:
Saving, Investment, and the Financial System
The Macroeconomics of Saving and Investment

Ch
apte
r 21
: E
con
om
ic G
row
th,
the
Fin
anci
al S
yste
m,
and
Bu
sin
ess
Cyc
les
© 2009 Prentice Hall Business Publishing Economics Hubbard/O’Brien UPDATE EDITION. 15 of 34
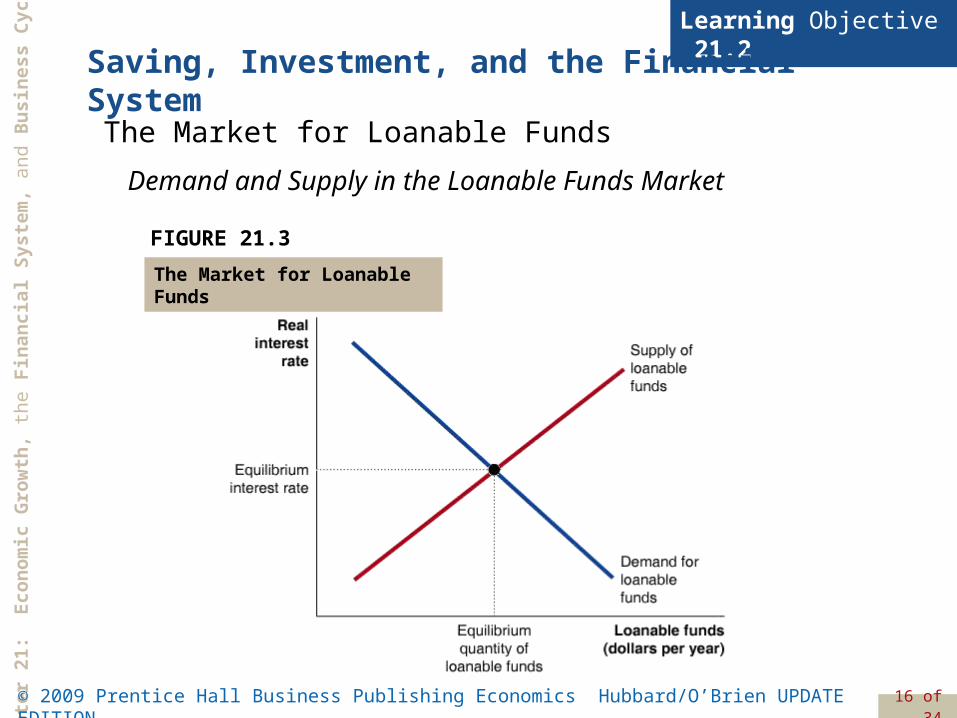
Saving, Investment, and the Financial System
Learning Objective 21.2
The Market for Loanable Funds
Market for loanable funds The interaction of borrowers and lenders that determines the market interest rate and the quantity of loanable funds exchanged.
Ch
apte
r 21
: E
con
om
ic G
row
th,
the
Fin
anci
al S
yste
m,
and
Bu
sin
ess
Cyc
les
© 2009 Prentice Hall Business Publishing Economics Hubbard/O’Brien UPDATE EDITION. 16 of 34
Learning Objective 21.2
Demand and Supply in the Loanable Funds Market
FIGURE 21.3
The Market for Loanable Funds
Saving, Investment, and the Financial System
The Market for Loanable Funds

Ch
apte
r 21
: E
con
om
ic G
row
th,
the
Fin
anci
al S
yste
m,
and
Bu
sin
ess
Cyc
les
© 2009 Prentice Hall Business Publishing Economics Hubbard/O’Brien UPDATE EDITION. 17 of 34
Learning Objective 21.2
Ebenezer Scrooge: Accidental Promoter of Economic Growth?
Makingthe
Connection
Who was better for economic growth: Scrooge the saver or Scrooge the spender?
Ch
apte
r 21
: E
con
om
ic G
row
th,
the
Fin
anci
al S
yste
m,
and
Bu
sin
ess
Cyc
les
© 2009 Prentice Hall Business Publishing Economics Hubbard/O’Brien UPDATE EDITION. 18 of 34
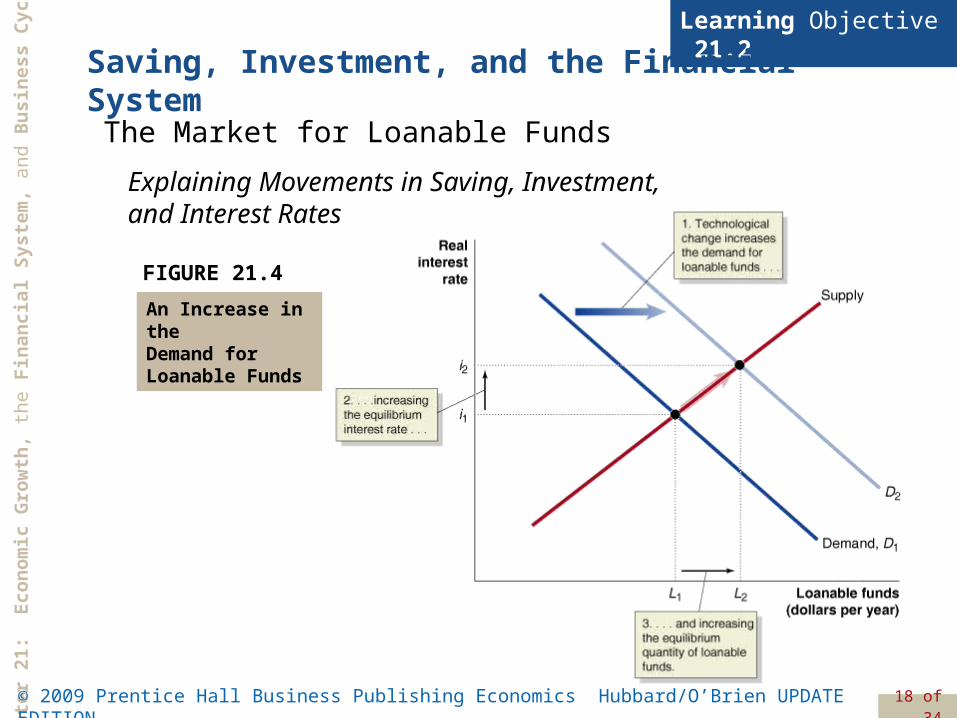
Learning Objective 21.2
Explaining Movements in Saving, Investment, and Interest Rates
FIGURE 21.4
An Increase in the Demand for Loanable Funds
Saving, Investment, and the Financial System
The Market for Loanable Funds

Ch
apte
r 21
: E
con
om
ic G
row
th,
the
Fin
anci
al S
yste
m,
and
Bu
sin
ess
Cyc
les
© 2009 Prentice Hall Business Publishing Economics Hubbard/O’Brien UPDATE EDITION. 19 of 34
Learning Objective 21.2
Crowding out A decline in private expenditures as a result of an increase in government purchases.
Explaining Movements in Saving, Investment, and Interest Rates
Saving, Investment, and the Financial System
The Market for Loanable Funds

Ch
apte
r 21
: E
con
om
ic G
row
th,
the
Fin
anci
al S
yste
m,
and
Bu
sin
ess
Cyc
les
© 2009 Prentice Hall Business Publishing Economics Hubbard/O’Brien UPDATE EDITION. 20 of 34
Learning Objective 21.2
Explaining Movements in Saving, Investment, and Interest Rates
FIGURE 21.5
The Effect of a Budget Deficit on the Market for Loanable Funds
Saving, Investment, and the Financial System
The Market for Loanable Funds
Ch
apte
r 21
: E
con
om
ic G
row
th,
the
Fin
anci
al S
yste
m,
and
Bu
sin
ess
Cyc
les
© 2009 Prentice Hall Business Publishing Economics Hubbard/O’Brien UPDATE EDITION. 21 of 34
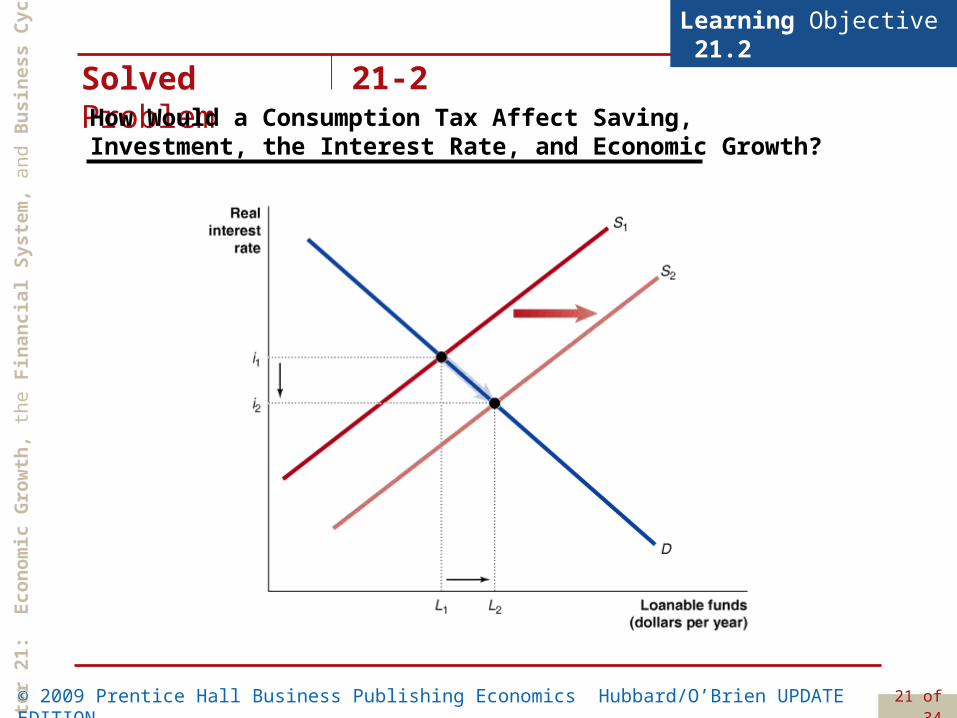
Solved Problem 21-2How Would a Consumption Tax Affect Saving, Investment, the Interest Rate, and Economic Growth?
Learning Objective 21.2

Ch
apte
r 21
: E
con
om
ic G
row
th,
the
Fin
anci
al S
yste
m,
and
Bu
sin
ess
Cyc
les
© 2009 Prentice Hall Business Publishing Economics Hubbard/O’Brien UPDATE EDITION. 22 of 34
The Business Cycle
Learning Objective 21.3
FIGURE 21.6
The Business Cycle
Some Basic Business Cycle Definitions

Ch
apte
r 21
: E
con
om
ic G
row
th,
the
Fin
anci
al S
yste
m,
and
Bu
sin
ess
Cyc
les
© 2009 Prentice Hall Business Publishing Economics Hubbard/O’Brien UPDATE EDITION. 23 of 34
Learning Objective 21.3
The Business Cycle and the 2008 Election
Makingthe
Connection
The state of the U.S. economy was one factor that helped Barack Obama win the presidency in 2008.
The National Bureau of Economic Research (NBER) has the following broader definition: “A recession is a significant decline in activity spread across the economy, lasting more than a few months, visible in industrial production, employment, real income, and wholesale-retail trade.”
There is substantial evidence that in some elections, the state of the economy can be of decisive importance.
As real GDP began to decline and unemployment began to rise, Barack Obama ultimately won the election by a margin in the popular vote of 52 percent to 46 percent.

Ch
apte
r 21
: E
con
om
ic G
row
th,
the
Fin
anci
al S
yste
m,
and
Bu
sin
ess
Cyc
les
© 2009 Prentice Hall Business Publishing Economics Hubbard/O’Brien UPDATE EDITION. 24 of 34
The Business Cycle
Learning Objective 21.3
What Happens during a Business Cycle?
The Effect of the Business Cycle on BoeingFigure 21-7
The Effect of the Business Cycle on Boeing

Ch
apte
r 21
: E
con
om
ic G
row
th,
the
Fin
anci
al S
yste
m,
and
Bu
sin
ess
Cyc
les
© 2009 Prentice Hall Business Publishing Economics Hubbard/O’Brien UPDATE EDITION. 25 of 34
Learning Objective 21.3
FIGURE 21.8
The Effect of the 2001
Recession on the Inflation Rate
The Effect of the Business Cycle on the Inflation Rate
The Business Cycle
What Happens during a Business Cycle?
Ch
apte
r 21
: E
con
om
ic G
row
th,
the
Fin
anci
al S
yste
m,
and
Bu
sin
ess
Cyc
les
© 2009 Prentice Hall Business Publishing Economics Hubbard/O’Brien UPDATE EDITION. 26 of 34
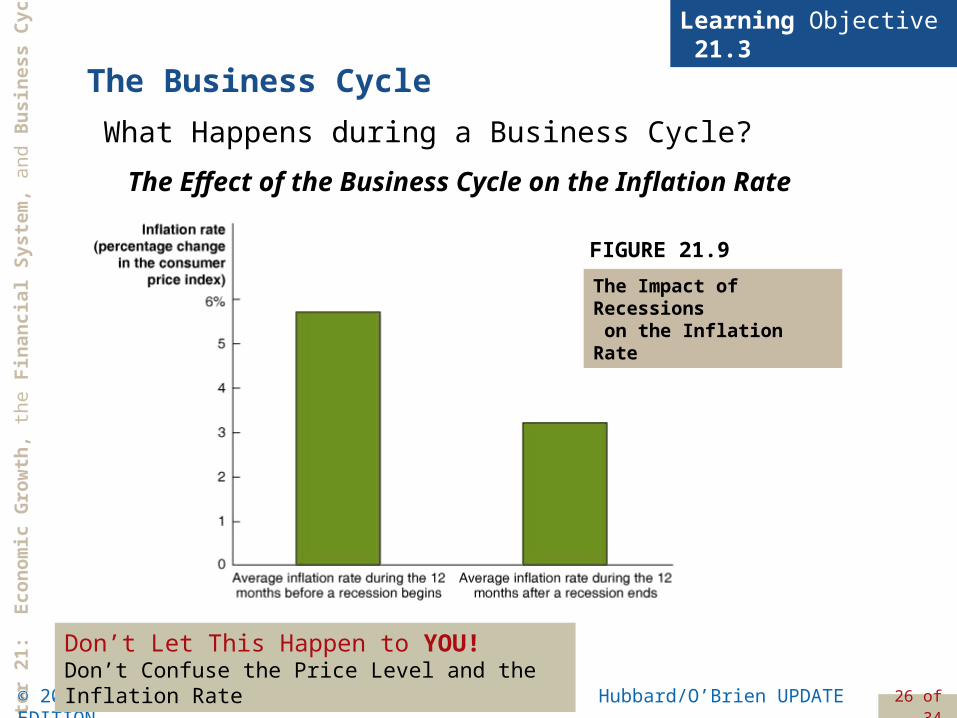
Learning Objective 21.3
FIGURE 21.9
The Impact of Recessions on the Inflation Rate
The Effect of the Business Cycle on the Inflation Rate
Don’t Let This Happen to YOU!Don’t Confuse the Price Level and the Inflation Rate
The Business Cycle
What Happens during a Business Cycle?

Ch
apte
r 21
: E
con
om
ic G
row
th,
the
Fin
anci
al S
yste
m,
and
Bu
sin
ess
Cyc
les
© 2009 Prentice Hall Business Publishing Economics Hubbard/O’Brien UPDATE EDITION. 27 of 34
Learning Objective 21.3
FIGURE 21.10
How the Recession of 2001 Affected the Unemployment Rate
The Effect of the Business Cycle on the Unemployment Rate
The Business Cycle
What Happens during a Business Cycle?
Ch
apte
r 21
: E
con
om
ic G
row
th,
the
Fin
anci
al S
yste
m,
and
Bu
sin
ess
Cyc
les
© 2009 Prentice Hall Business Publishing Economics Hubbard/O’Brien UPDATE EDITION. 28 of 34
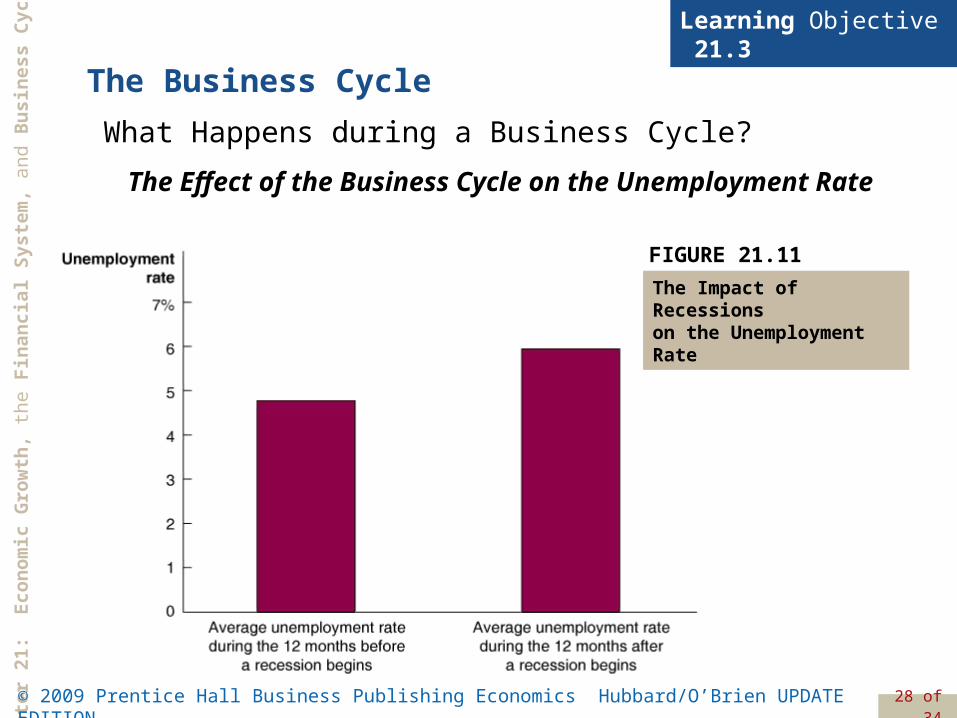
Learning Objective 21.3
FIGURE 21.11
The Impact of Recessions on the Unemployment Rate
The Effect of the Business Cycle on the Unemployment Rate
The Business Cycle
What Happens during a Business Cycle?

Ch
apte
r 21
: E
con
om
ic G
row
th,
the
Fin
anci
al S
yste
m,
and
Bu
sin
ess
Cyc
les
© 2009 Prentice Hall Business Publishing Economics Hubbard/O’Brien UPDATE EDITION. 29 of 34
Learning Objective 21.3
Recessions Have Been Milder and the Economy Has Been More Stable Since 1950
The Business Cycle
What Happens during a Business Cycle?
FIGURE 21.12
Fluctuations in Real GDP, 1900–2007

Ch
apte
r 21
: E
con
om
ic G
row
th,
the
Fin
anci
al S
yste
m,
and
Bu
sin
ess
Cyc
les
© 2009 Prentice Hall Business Publishing Economics Hubbard/O’Brien UPDATE EDITION. 30 of 34
Learning Objective 21.3
Recessions Have Been Milder and the Economy Has Been More Stable Since 1950
Table 21-1
The Business Cycle Has Become Milder
PERIODAVERAGE LENGTH OF EXPANSIONS
AVERAGE LENGTH OF RECESSIONS
1870-1900 26 months 26 months
1900-1950 25 months 19 months
1950-2001 61 months 9 months
The Business Cycle
What Happens during a Business Cycle?

Ch
apte
r 21
: E
con
om
ic G
row
th,
the
Fin
anci
al S
yste
m,
and
Bu
sin
ess
Cyc
les
© 2009 Prentice Hall Business Publishing Economics Hubbard/O’Brien UPDATE EDITION. 31 of 34
Learning Objective 21.3
• The increasing importance of services and the declining importance of goods.
• The establishment of unemployment insurance and other government transfer programs that provide funds to the unemployed.
• Active federal government policies to stabilize the economy.
The Business Cycle
Why Is the Economy More Stable?

Ch
apte
r 21
: E
con
om
ic G
row
th,
the
Fin
anci
al S
yste
m,
and
Bu
sin
ess
Cyc
les
© 2009 Prentice Hall Business Publishing Economics Hubbard/O’Brien UPDATE EDITION. 32 of 34
An Inside LOOK China’s Airlines Are Failing to Translate Rapid Growth into Profits
Chinese Aviation: On a Wing and a Prayer

Ch
apte
r 21
: E
con
om
ic G
row
th,
the
Fin
anci
al S
yste
m,
and
Bu
sin
ess
Cyc
les
© 2009 Prentice Hall Business Publishing Economics Hubbard/O’Brien UPDATE EDITION. 33 of 34
An Inside LOOK China’s Airlines Are Failing to Translate Rapid Growth into Profits
Chinese Aviation: On a Wing and a Prayer (continued)

Ch
apte
r 21
: E
con
om
ic G
row
th,
the
Fin
anci
al S
yste
m,
and
Bu
sin
ess
Cyc
les
© 2009 Prentice Hall Business Publishing Economics Hubbard/O’Brien UPDATE EDITION. 34 of 34
Business cycle
Capital
Crowding out
Financial intermediaries
Financial markets
Financial system
Labor productivity
Long-run economic growth
Market for loanable funds
Potential GDP
K e y T e r m s