
Global Inequalities Classifying Countries The North-South Gap.

Growth and Inequalities across Countries: A Data Analysis
Growth and Inequalities across Countries:A Data Analysis
F. Collard

Growth and Inequalities across Countries: A Data Analysis
Objective
Objective
Very simple question:
“Why are the riches rich and the poors poor?”
Seems to be a very simple question!
Very complicated issue: Economists have been struggling withthis issue since Smith [1776]!!

Growth and Inequalities across Countries: A Data Analysis
Objective
Objective
Various ways of approaching the problem
Understand inequalities across individuals within a countryand make international comparisons (largely dealt with in theliterature, ex: Sala–i–Martin)
Understand cross–countries inequalities in growthperformances (less studied but Quah [1997], Jones [1997])
Growth and Inequalities across Countries: A Data Analysis
Basic Observations
Basic ObservationsWhat data?
Data: output per worker available in the World–Penn Table6.0 over the period 1960 to 1998.
Output: real GDP at constant world prices =⇒ Avoid priceand exchange rate effects;Labor: # of individuals aged between 15 and 64.
Build log of output per worker.
Restrict to Non Sub–Saharan African countries: Why?
Assess inequalities in output: yi − yus (does this matter?)

Growth and Inequalities across Countries: A Data Analysis
Basic Observations
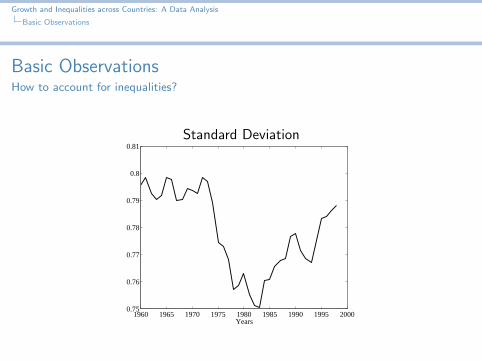
Basic ObservationsHow to account for inequalities?
Think of simple descriptive statistics
Standard deviation:
σt =
√√√√ 1
N
N∑i=1
(yit − y t)2
with y t = 1N
∑Ni=1 yit .
Plot of these quantities
Growth and Inequalities across Countries: A Data Analysis
Basic Observations
Basic ObservationsHow to account for inequalities?
Standard Deviation
1960 1965 1970 1975 1980 1985 1990 1995 20000.75
0.76
0.77
0.78
0.79
0.8
0.81
Years

Growth and Inequalities across Countries: A Data Analysis
Basic Observations
Basic ObservationsHow to account for inequalities?
Lorenz Curve
Cumulative % of Total Population
Cum
ula
tive
%ofTota
lO
utp
ut
A
B
Gini Index=B/(A+B)

Growth and Inequalities across Countries: A Data Analysis
Basic Observations
Basic ObservationsHow to account for inequalities?
Gini Index
1960 1965 1970 1975 1980 1985 1990 1995 20000.33
0.34
0.35
0.36
0.37
0.38
0.39
Years

Growth and Inequalities across Countries: A Data Analysis
Basic Observations
Basic ObservationsHow to account for inequalities?
Problem: Does not locate where the phenomenon takes place
Why is it important?
In the lower tail: the poors get poorer =⇒ Essentially aproblem of development economicsAround the mean: The gap occurs among developed countries=⇒ Essentially a problem of growth theory
We would like to plot the whole distribution

Growth and Inequalities across Countries: A Data Analysis
Basic Observations
Basic ObservationsHow to account for inequalities?
How to estimate it? Non parametric methods
Kernel density estimator: Rosenblatt–Parzen kernel densityestimator
f (y) =1
Nh
N∑i=1
K
(y − yi
h
)where the kernel, K (.), is a continuous, bounded, symmetricreal–valued function that integrates to 1.
Gaussian kernel: K (ω) = exp(−ω2/2)/√
2π,
Bandwidth parameter: h = 1.0592σN−1/5 where σ is thestandard deviation of the data and N is the number ofobservations.

Growth and Inequalities across Countries: A Data Analysis
Basic Observations
Basic ObservationsHow to account for inequalities?
Kernel Estimates of Distribution
−4 −3.5 −3 −2.5 −2 −1.5 −1 −0.5 0 0.5 10
0.05
0.1
0.15
0.2
0.25
0.3
0.35
0.4
0.45
0.5196019781998

Growth and Inequalities across Countries: A Data Analysis
Basic Observations
Basic ObservationsHow to account for inequalities?
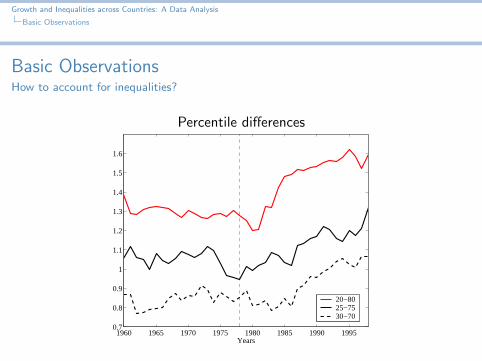
Locating the breaking point
Think of more sophisticated (but simple!) descriptive statistics
Percentile differences
Sort the data yiNi=1 and the cdf i/N
Interpolate to find the percentileCompute differences
Plot of the time series
Growth and Inequalities across Countries: A Data Analysis
Basic Observations
Basic ObservationsHow to account for inequalities?
Percentile differences
1960 1965 1970 1975 1980 1985 1990 19950.7
0.8
0.9
1
1.1
1.2
1.3
1.4
1.5
1.6
Years
20−8025−7530−70

Growth and Inequalities across Countries: A Data Analysis
Basic Observations
Basic ObservationsSummary
Drastic change in the shape of the distribution of (log–)output–per–worker between 1960 and 1998:
In 1960: clearly uni–modal and close to normal (Quah [1997],Jones [1997])Over time, the middle of distribution hollowed–out quitesubstantially;In 1998: Bi–modal distribution (Twin–Peaks)

Growth and Inequalities across Countries: A Data Analysis
Standard theory
Standard Theory
What theory to explain cross countries differences in growthperformances?
Standard growth theory!
Extremely powerful theory in general to account for thelong–run
Can it explain what we observed?

Growth and Inequalities across Countries: A Data Analysis
Standard theory
Standard Theory
What can the basic Solow growth model say about that?
Very standard and basic framework
Technology: Yi ,t = Kαi ,t(ΩiΓtLi ,t)
1−α with 0 6 α 6 1
Ωi : country specific labor augmenting knowledge,Γt : common time varying component (Γt+1 = (1 + γ)Γt ,Γ0 > 0 given).
Population: Li ,t+1 = (1 + ni )Li ,t , Li ,0 given.
Accumulation: Ki ,t+1 = siYi ,t + (1− δ)Ki ,t , Ki ,0 > 0 given.

Growth and Inequalities across Countries: A Data Analysis
Standard theory
Standard Theory
Denote yi ,t = Yi ,t/(ΓtLi ,t) and ki ,t = Ki ,t/(ΓtLi ,t), we have
yi ,t = kαi ,tΩ
1−αi
(1 + γ)(1 + ni )ki ,t+1 = siyi ,t + (1− δ)ki ,t

Growth and Inequalities across Countries: A Data Analysis
Standard theory
Standard Theory
Steady State
Along the steady state growth path, we have thatyi = log(yit)− log(y0t) satisfies the following relationship
yi =α
1− ανi
with νi = si(1+ni )(1+γ)−(1−δ) and νi = log(νi )− log(ν0).

Growth and Inequalities across Countries: A Data Analysis
Standard theory
Standard Theory
Change of Variable Formula
Let a random variable y be a function of another random variablex with distribution µx(x). y and x are related by the continuouslydifferentiable function f (·), such that y = f (x). Then
µy(y) =µx(x)
|f ′(x)|

Growth and Inequalities across Countries: A Data Analysis
Standard theory
Standard Theory
Distribution of Output
The steady state distribution of (log–) output–per–worker relativeto a reference economy (y0), is given by
µy(y) =1− α
αµν (ν)
where µν(·) denotes the distribution of ν.
Hence if ν is unimodal, so is output.
Growth and Inequalities across Countries: A Data Analysis
Standard theory
Standard Theory
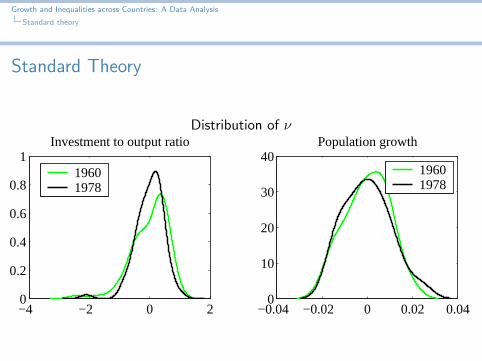
Distribution of ν
−4 −2 0 20
0.2
0.4
0.6
0.8
1Investment to output ratio
19601978
−0.04 −0.02 0 0.02 0.040
10
20
30
40Population growth
19601978

Growth and Inequalities across Countries: A Data Analysis
Standard theory
Standard Theory
The distribution of ν is unimodal, so is that of output,
The Standard Model just Fails to Account for the Facts!
Need to go beyond the standard model
Will use Econometrics to put some structure on the data andgrasp some intuition to setup a model.

Growth and Inequalities across Countries: A Data Analysis
Structuring the Data
Putting some Structure on the Data
What can be learnt from Econometrics?
More than what you think!
Econometrics enables the Ceteris Paribus assumption.
Need to setup a strategy!

Growth and Inequalities across Countries: A Data Analysis
Structuring the Data
Putting some Structure on the Data
Methodology borrowed from the Labor literature:Juhn, Murphy and Pierce [JPE, 1993]
Where can changes come from?
Build counterfactuals
Recall that
y98 = y60 + 18×∆y60−78i + 20×∆y78−98
i
Understanding output level amounts to understand the growthprocess!

Growth and Inequalities across Countries: A Data Analysis
Structuring the Data
Putting some Structure on the Data
Split the sample in two periods and estimate a growthregression for each
∆y0i = x0
i β0 + ε0i (1)
∆y1i = x1
i β1 + ε1i (2)
Change in the distribution of variables:
∆yd
i = x0i β1 + ε1
i
Change in the magnitude of these mechanisms:
∆ym
i = x1i β0 + ε1
i
Change in the residual factors:
∆yε
i = x1i β1 + ε1
i
plot the distributions

Growth and Inequalities across Countries: A Data Analysis
Structuring the Data
Putting some Structure on the DataStrategy
1 Find a good way to approach the data (which model to use,need for theory)
2 Find a good representation of the data (which DGP to use)
3 Setup the counterfactual analysis

Growth and Inequalities across Countries: A Data Analysis
Structuring the Data
Putting some Structure on the DataStep 1: Which theory?
Standard Growth theory =⇒ Huge literature on the empiricsof growth;
Use β–convergence type of regressions

Growth and Inequalities across Countries: A Data Analysis
Structuring the Data
Putting some Structure on the DataStep 1: Which theory?
Basic idea: Use Solow growth model
k(t)
k(t)= sAk(t)α−1 − (n + γ + δ)
Steady state (k(t) = 0): k? =(
αAn+γ+δ
) 11−α
Log–linear representation:
k(t)
k(t)=s(α− 1)Ak?α−1(log(k(t))− log(k?))
=− s(1− α)(n + γ + δ)(log(k(t))− log(k?))
=− λ(log(k(t))− log(k?))

Growth and Inequalities across Countries: A Data Analysis
Structuring the Data
Putting some Structure on the DataStep 1: Which theory?
Solution
(log(k(t))− log(k?)) = e−λt(log(k(0))− log(k?))
orlog(k(t)) = e−λt log(k(0)) + (1− e−λt) log(k?))

Growth and Inequalities across Countries: A Data Analysis
Structuring the Data
Putting some Structure on the DataStep 1: Which theory?
Use the production function
log(y(t)) = log(A) + α(e−λt log(k(0)) + (1− e−λt) log(k?))
)= e−λt log(y(0)) + (1− e−λt) log(A) + α(1− e−λt) log(k?)
Finally, one gets
log(y(t))− log(y(0))
t=
(e−λt − 1)
tlog(y(0)) +
(1− e−λt)
t
log(A)
1− α
+α
1− α
(1− e−λt)
t[log(s)− log(n + γ + δ)]
Growth and Inequalities across Countries: A Data Analysis
Structuring the Data
Putting some Structure on the DataStep 1: Which theory?
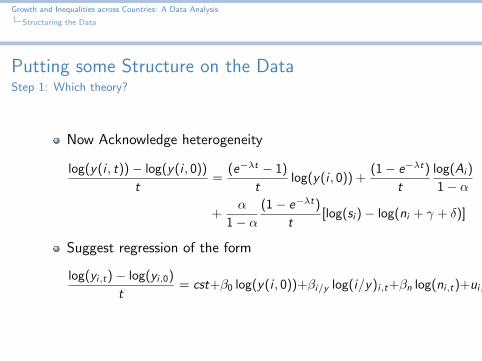
Now Acknowledge heterogeneity
log(y(i , t))− log(y(i , 0))
t=
(e−λt − 1)
tlog(y(i , 0)) +
(1− e−λt)
t
log(Ai )
1− α
+α
1− α
(1− e−λt)
t[log(si )− log(ni + γ + δ)]
Suggest regression of the form
log(yi,t)− log(yi,0)
t= cst+β0 log(y(i , 0))+βi/y log(i/y)i,t+βn log(ni,t)+ui,t

Growth and Inequalities across Countries: A Data Analysis
Structuring the Data
Putting some Structure on the DataStep 1: Which theory?
All this work for . . . Nothing!Still need to estimate everything
Go to Step 2

Growth and Inequalities across Countries: A Data Analysis
Structuring the Data
Putting some Structure on the DataStep 2: Which DGP?
What tool?
Econometrics! (Basic Econometrics)
Split the sample into 2: 1960–1978 ; 1978–1998

Growth and Inequalities across Countries: A Data Analysis
Structuring the Data
Putting some Structure on the DataStep 2: Which DGP?
OLS Estimates:
60− 78 : ∆yi = 0.185(0.025)
− 0.013(0.002)
yi0 − 0.137(0.164)
ni + 0.016(0.003)
(i
y
)i
78− 98 : ∆yi = 0.208(0.026)
− 0.014(0.002)
yi0 − 0.606(0.163)
ni + 0.027(0.004)
(i
y
)i
Test for global stability: 14.64, p–value: 0.002!
Test for convergence stability: 0.03, p–value: 0.855
Test for stability of n and i/y: 12.02, p–value: 0.002!

Growth and Inequalities across Countries: A Data Analysis
Structuring the Data
Putting some Structure on the DataStep 2: Which DGP?
Should we be happy with that work?
Clearly: NO!
Several problems: weighting of countries, endogeneity biases,specification biases may account for the facts!
Need to work harder!

Growth and Inequalities across Countries: A Data Analysis
Structuring the Data
Putting some Structure on the DataStep 2: Which DGP?The weighting
Weighting scheme: All countries are assigned the sameweight! what about India and China!
Weighted regressions: β solves min(Y − Xβ)′W (Y − Xβ)where W is the weighting matrix.

Growth and Inequalities across Countries: A Data Analysis
Structuring the Data
Putting some Structure on the DataStep 2: Which DGP?The weighting
Weight: log(POP)
60− 78 : ∆yi = 0.161(0.023)
− 0.010(0.002)
yi0 − 0.118(0.173)
ni + 0.018(0.003)
(i
y
)i
78− 98 : ∆yi = 0.213(0.021)
− 0.015(0.002)
yi0 − 0.623(0.161)
ni + 0.025(0.004)
(i
y
)i
Weight: log(Y )
60− 78 : ∆yi = 0.180(0.024)
− 0.013(0.002)
yi0 − 0.133(0.162)
ni + 0.017(0.003)
(i
y
)i
78− 98 : ∆yi = 0.211(0.025)
− 0.014(0.002)
yi0 − 0.618(0.161)
ni + 0.026(0.004)
(i
y
)i

Growth and Inequalities across Countries: A Data Analysis
Structuring the Data
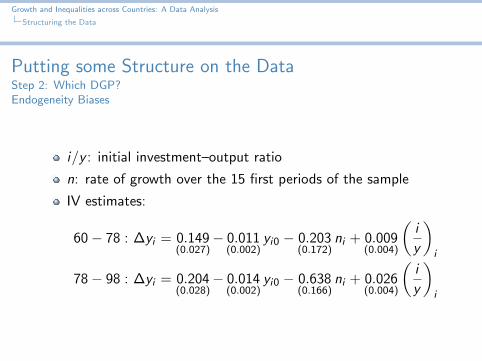
Putting some Structure on the DataStep 2: Which DGP?Endogeneity Biases
Both the investment–output ratio and population growthought to be endogenous
i/y : That’s what optimal growth models suggest!n: That’s what endogenous fertility models suggest!
Instrumental variables: Set of instruments, Z , such that Z isexogenous and highly correlated with he variable we want tocorrect
β = (XPZX ′)−1X ′PZY with PZ = Z (Z ′Z )−1Z ′
Growth and Inequalities across Countries: A Data Analysis
Structuring the Data
Putting some Structure on the DataStep 2: Which DGP?Endogeneity Biases
i/y : initial investment–output ratio
n: rate of growth over the 15 first periods of the sample
IV estimates:
60− 78 : ∆yi = 0.149(0.027)
− 0.011(0.002)
yi0 − 0.203(0.172)
ni + 0.009(0.004)
(i
y
)i
78− 98 : ∆yi = 0.204(0.028)
− 0.014(0.002)
yi0 − 0.638(0.166)
ni + 0.026(0.004)
(i
y
)i

Growth and Inequalities across Countries: A Data Analysis
Structuring the Data
Putting some Structure on the DataStep 2: Which DGP?Specification Biases
Essentially a problem of omitted variables!
Human CapitalNon–linear dynamicsInstitutions
Introduce each type of variable

Growth and Inequalities across Countries: A Data Analysis
Structuring the Data
Putting some Structure on the DataStep 2: Which DGP?Specification Biases: Education
Huge amount of work on that topic: Mankiw, Romer andWeil (1991), Barro and Lee (1993), Klenow andRodrıguez-Clare [1997], Durlauf and Quah (1999)
No clear conclusions! (measurement problem)
Enrollment rate
Use both OLS and IV estimates (education instrumented bythe stock (years))

Growth and Inequalities across Countries: A Data Analysis
Structuring the Data
Putting some Structure on the DataStep 2: Which DGP?Specification Biases: Education
OLS IV1 IV260–78 78–98 60–78 78–98 60–78 78–98
Const. 0.218 0.216 0.197 0.218 0.197 0.249( 0.032) ( 0.036) ( 0.033) ( 0.036) ( 0.036) ( 0.046)
y0 -0.017 -0.014 -0.015 -0.014 -0.015 -0.017( 0.003) ( 0.003) ( 0.003) ( 0.003) ( 0.003) ( 0.004)
n -0.082 -0.710 -0.117 -0.736 -0.117 -0.709( 0.164) ( 0.159) ( 0.171) ( 0.161) ( 0.171) ( 0.164)
i/y 0.014 0.029 0.006 0.030 0.006 0.028( 0.003) ( 0.004) ( 0.004) ( 0.005) ( 0.004) ( 0.005)
Educ. 0.010 -0.002 0.015 -0.004 0.015 0.008( 0.006) ( 0.009) ( 0.006) ( 0.009) ( 0.008) ( 0.014)
Q(Total) 24.275 [0.000] 28.970 [0.000] 28.844 [0.000]Q(y0) 0.342 [0.559] 0.053 [0.818] 0.152 [0.697]Q(n, i/y) 18.934 [0.000] 24.660 [0.000] 19.879 [0.000]Q(Educ.) 1.488 [0.223] 3.100 [0.078] 0.220 [0.639]

Growth and Inequalities across Countries: A Data Analysis
Structuring the Data
Putting some Structure on the DataStep 2: Which DGP?Specification Biases: Nonlinearities
Possibility of nonlinear convergence (Durlauf or Quah (1999))
Include powers of initial output per worker (up to degree 3)=⇒ non significant =⇒ No nonlinearities
Possibility of scale effects
Include powers of initial output and/or Total population=⇒ non significant =⇒ No scale effects

Growth and Inequalities across Countries: A Data Analysis
Structuring the Data
Putting some Structure on the DataStep 2: Which DGP?Specification Biases: Institutions
What is the role of institution?
Can it undo what we’ve found so far?
Include a measure of social infrastructure: Weighted averageof
An index of government anti–diversion policies created byPolitical Risk Services, a firm that specializes in riskassessments to international investors.An index of trade openness complied by Sachs and Warner(1995).
Non significant, does not affect the previous findings

Growth and Inequalities across Countries: A Data Analysis
Structuring the Data
Putting some Structure on the DataStep 2: Which DGP?
Here, we have not exhausted all the candidates;
But it has been done
What to conclude?

Growth and Inequalities across Countries: A Data Analysis
Structuring the Data
Putting some Structure on the DataStep 2: Which DGP?
Main Result
Differences in international output growth performances can beessentially accounted for by
The rate of investment in physical capital (or the savings rate)
The rate of population growth
=⇒ Traditional growth factors!
Go to Step 3

Growth and Inequalities across Countries: A Data Analysis
Structuring the Data
Putting some Structure on the DataStep 3: Counterfactual Analysis
Let us recall that we now have
∆y60−78i = β60−78
0 + β60−78y y60
i + X 60−78i β60−78
x + ε60−78i
∆y78−98i = β78−98
0 + β78−98y y78
i + X 78−98i β78−98
x + ε78−98i
It is then easy to build y98 as
y98i = y60
i + 18×∆y60−78i + 20×∆y78−98
i
Then build counterfactuals and associated distributions
This will help us to setup a model

Growth and Inequalities across Countries: A Data Analysis
Structuring the Data
Putting some Structure on the DataStep 3: Counterfactual Analysis: Interpreting the results
No effect of the change!
19601998corr.

Growth and Inequalities across Countries: A Data Analysis
Structuring the Data
Putting some Structure on the DataStep 3: Counterfactual Analysis: Interpreting the results
Big effect of the change!
19601998corr.

Growth and Inequalities across Countries: A Data Analysis
Structuring the Data
Putting some Structure on the DataStep 3: Counterfactual Analysis
Control Convergence:
∆y60−78i = β60−78
0 + β60−78y y60
i + X 60−78i β60−78
x + ε60−78i
∆y78−98i = β78−98
0 + β60−78y y78
i + X 78−98i β78−98
x + ε78−98i
−4 −2 0 2 40
0.1
0.2
0.3
0.4
0.5
(a) Observables (y0)
19601998Corr.
−4 −2 0 2 40
0.1
0.2
0.3
0.4
0.5
(b) Coefficients (β78−98y
=0)

Growth and Inequalities across Countries: A Data Analysis
Structuring the Data
Putting some Structure on the DataStep 3: Counterfactual Analysis
Control for changes in the residual factors:
∆y60−78i = β60−78
0 + β60−78y y60
i + X 60−78i β60−78
x + ε60−78i
∆y78−98i = β78−98
0 + β78−98y y78
i + X 78−98i β78−98
x + ε60−78i
−4 −2 0 2 40
0.1
0.2
0.3
0.4
0.5Unobservables

Growth and Inequalities across Countries: A Data Analysis
Structuring the Data
Putting some Structure on the DataStep 3: Counterfactual Analysis
Control for changes in the distribution of variables:
∆y60−78i = β60−78
0 + β60−78y y60
i + X 60−78i β60−78
x + ε60−78i
∆y78−98i = β78−98
0 + β78−98y y78
i + X 60−78i β78−98
x + ε78−98i
−4 −2 0 2 40
0.1
0.2
0.3
0.4
0.5(c) Distribution (n,i/y)

Growth and Inequalities across Countries: A Data Analysis
Structuring the Data
Putting some Structure on the DataStep 3: Counterfactual Analysis
Control for changes in the importance of variables:
∆y60−78i = β60−78
0 + β60−78y y60
i + X 60−78i β60−78
x + ε60−78i
∆y78−98i = β78−98
0 + β78−98y y78
i + X 78−98i β60−78
x + ε78−98i
−4 −2 0 2 40
0.2
0.4
0.6
0.8Coefficients (n,i/y)

Growth and Inequalities across Countries: A Data Analysis
Structuring the Data
Putting some Structure on the DataStep 3: Counterfactual Analysis
Conclusion
Changes in the distribution of output per worker can be essentiallyaccounted for by an increase in the impact of
The rate of investment in physical capital (or the savings rate)
The rate of population growth
=⇒ Traditional growth factors!

Growth and Inequalities across Countries: A Data Analysis
Structuring the Data
Putting some Structure on the DataStep 3: Counterfactual Analysis
Way more important than you may think!
the coefficient in front of (i/y) carries some information onthe returns to accumulation
Recall
log(y(t))− log(y(0))
t=
(e−λt − 1)
tlog(y(0)) +
(1− e−λt)
t
log(A)
1− α
+α
1− α
(1− e−λt)
t[log(s)− log(n + γ + δ)]

Growth and Inequalities across Countries: A Data Analysis
Structuring the Data
Putting some Structure on the DataUsing all this as a guide for a model
denote β ≡ (e−λt−1)t
∆y = β log(y(0))− βlog(A)
1− α− αβ
1− α[log(s)− log(n + γ + δ)]
implies that α ' 0.4 in the first sample, and α ' 0.65 in thesecond!
Suggest a model of technological change in which thetechnology became more capital intensive
Can we go a little bit further?
Yes!

Growth and Inequalities across Countries: A Data Analysis
Structuring the Data
Putting some Structure on the DataUsing all this as a guide for a model
Something else, very important, happened during that period
Opening of trade
Can it help understanding the data (I swear this is the lasttable!)
Growth and Inequalities across Countries: A Data Analysis
Structuring the Data
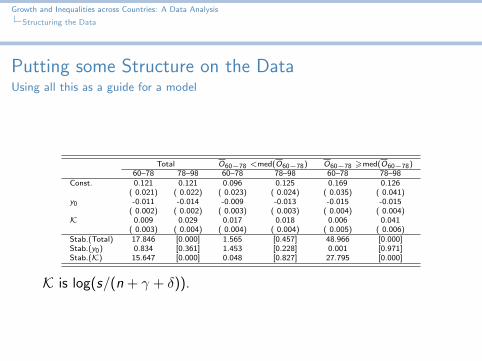
Putting some Structure on the DataUsing all this as a guide for a model
Total O60−78 <med(O60−78) O60−78 >med(O60−78)60–78 78–98 60–78 78–98 60–78 78–98
Const. 0.121 0.121 0.096 0.125 0.169 0.126( 0.021) ( 0.022) ( 0.023) ( 0.024) ( 0.035) ( 0.041)
y0 -0.011 -0.014 -0.009 -0.013 -0.015 -0.015( 0.002) ( 0.002) ( 0.003) ( 0.003) ( 0.004) ( 0.004)
K 0.009 0.029 0.017 0.018 0.006 0.041( 0.003) ( 0.004) ( 0.004) ( 0.004) ( 0.005) ( 0.006)
Stab.(Total) 17.846 [0.000] 1.565 [0.457] 48.966 [0.000]Stab.(y0) 0.834 [0.361] 1.453 [0.228] 0.001 [0.971]Stab.(K) 15.647 [0.000] 0.048 [0.827] 27.795 [0.000]
K is log(s/(n + γ + δ)).

Growth and Inequalities across Countries: A Data Analysis
Structuring the Data
Putting some Structure on the DataUsing all this as a guide for a model
Everything took place among open countries
Therefore suggests a model that features
Technological changeGlobalization


