Growth and Characterization of Nonlinear Optical...
67
Growth and Characterization of Nonlinear Optical Borate Crystals: CBO, SBO and BBO International School of Photonics A dissertation submitted to Cochin University of Science and Technology, Cochin, Kerala towards the partial fulfillment of award of degree of Master of Technology in Optoelectronics and Laser Technology by Pimpalwadkar Anand Darshan under the guidance of Work carried out at Crystal Growth Laboratory Laser Materials Development and Devices Division Raja Ramanna Centre for Advanced Technology, Indore Dr. Rajeev Bhatt Scientific Officer F LMDDD, RRCAT, Indore Dr. A K Karnal Scientific Officer H LMDDD, RRCAT, Indore
Transcript of Growth and Characterization of Nonlinear Optical...
Growth and Characterization of Nonlinear Optical
Borate Crystals: CBO, SBO and BBO
International School of Photonics
A dissertation submitted to
Cochin University of Science and Technology, Cochin, Kerala
towards the partial fulfillment of award of degree of
Master of Technology in Optoelectronics and Laser Technology
by
Pimpalwadkar Anand Darshan
under the guidance of
Work carried out at
Crystal Growth Laboratory Laser Materials Development and Devices Division
Raja Ramanna Centre for Advanced Technology, Indore
Dr. Rajeev Bhatt
Scientific Officer F
LMDDD, RRCAT, Indore
Dr. A K Karnal
Scientific Officer H
LMDDD, RRCAT, Indore

i
ACKNOWLEDGEMENT
Firstly, I am highly grateful to Dr. P. K. Gupta, Head, Laser Materials Development and
Devices Division (LMDDD), RRCAT for giving me the opportunity to work in the Crystal
Growth Lab. as a trainee. It has been truly an enlightening experience for me to work in the lab
at RRCAT. I am also grateful to Sh. P.K. Kush, Chairman, Project Placement Committee
for selecting me to carry out the project work at RRCAT.
I felt delighted that Dr. A.K. Karnal, Head, Crystal Growth Laboratory, LMDDD, accepted
me as his student for guiding me for my M.Tech. project work. I am highly obliged for his
constant inspiration, able guidance. I express my deep sense of acknowledgement to Dr. Rajeev
Bhatt, for the encouragement, support and guidance. I am thankful to Dr. Indranil Bhaumik
for his help and valuable suggestions throughout the project work.
I am thankful to Mr. M. Soharab and Mr. Amit Saxena for their significant contributions in
performing the experiments for the best results, having interesting discussions and for the many
light moments. I wish to acknowledge Dr. Gurvinderjit Singh and Mr. Prem Kumar, for
helping me to carry out the XRD experiments. I am grateful to Mr. B.K. Sajith, Mr. S.R.
Bagade and Mr. S.M. Sharma for setting up systems and troubleshooting. I would like to
thank all the members of Laser Materials Development & Devices Division (LMDDD) for
providing healthy working environment during the course of this project work.
I avail this opportunity to express my deep sense of gratitude towards Dr. M Kailasnath,
Director, ISP for allowing me to carry out project work at RRCAT Indore. The
acknowledgement is incomplete without mentioning Dr. P Radhakrishnan and Dr. V P N
Nampoori who will be constant source of inspiration for me throughout my life. I consider
myself lucky to have attended their lectures. I am also thankful to the all faculties and staff of
International School of Photonics for their support and concern.
I am thankful to Praveen, Durgesh, P. Rameshbabu for their help throughout the year in
carrying out experiments.
ii
ABSTRACT
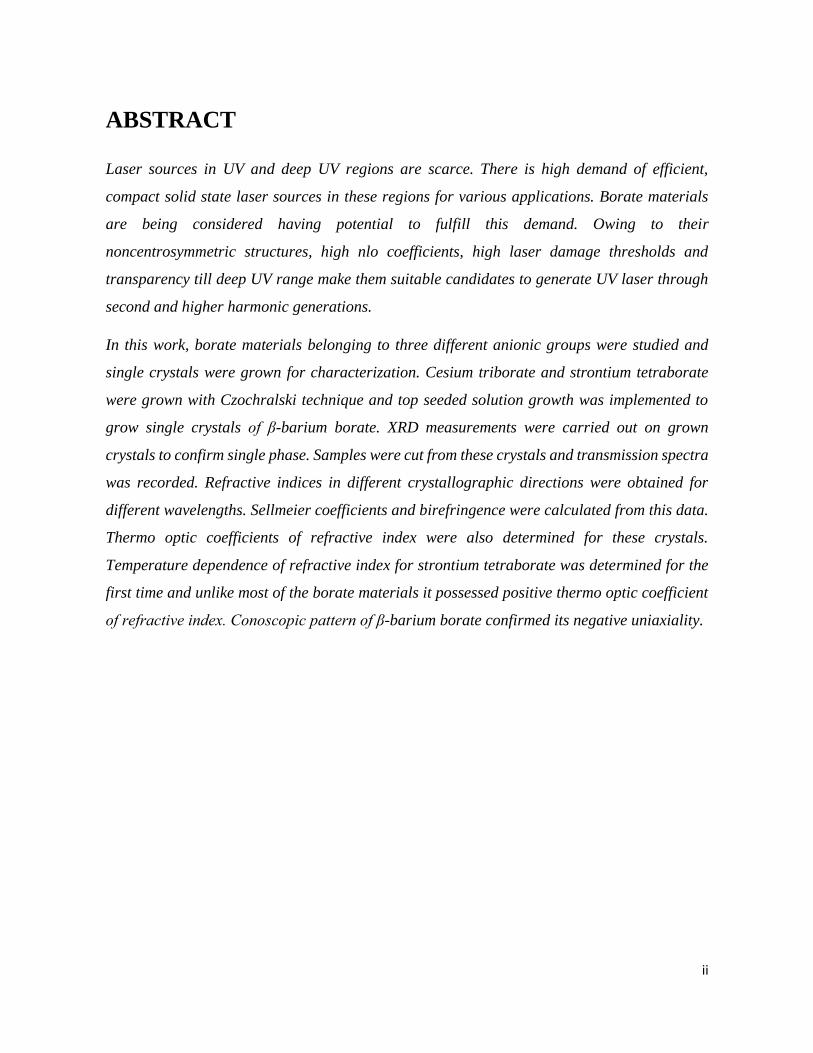
Laser sources in UV and deep UV regions are scarce. There is high demand of efficient,
compact solid state laser sources in these regions for various applications. Borate materials
are being considered having potential to fulfill this demand. Owing to their
noncentrosymmetric structures, high nlo coefficients, high laser damage thresholds and
transparency till deep UV range make them suitable candidates to generate UV laser through
second and higher harmonic generations.
In this work, borate materials belonging to three different anionic groups were studied and
single crystals were grown for characterization. Cesium triborate and strontium tetraborate
were grown with Czochralski technique and top seeded solution growth was implemented to
grow single crystals of β-barium borate. XRD measurements were carried out on grown
crystals to confirm single phase. Samples were cut from these crystals and transmission spectra
was recorded. Refractive indices in different crystallographic directions were obtained for
different wavelengths. Sellmeier coefficients and birefringence were calculated from this data.
Thermo optic coefficients of refractive index were also determined for these crystals.
Temperature dependence of refractive index for strontium tetraborate was determined for the
first time and unlike most of the borate materials it possessed positive thermo optic coefficient
of refractive index. Conoscopic pattern of β-barium borate confirmed its negative uniaxiality.
iii
CONTENTS
LIST OF FIGURES .................................................................................................................. v
1. INTRODUCTION ............................................................................................................. 1
1.1 What is a Crystal? ............................................................................................................. 1
1.2 Importance of Crystals ...................................................................................................... 2
1.3 Crystal Growth .................................................................................................................. 3
1.3.1 Supersaturated Solution ............................................................................................. 5
1.3.2 Supercooled Solution ................................................................................................. 6
1.3.3 Nucleation .................................................................................................................. 6
1.3.4 Critical Nucleus Size for a Spherical Embryo ........................................................... 7
1.4 Crystal Growth Techniques .............................................................................................. 9
1.4.1 Growth from Melt ...................................................................................................... 9
1.4.1.1 Czochralski Method ................................................................................................ 9
1.4.1.2 Kyropoulos Technique .......................................................................................... 10
1.4.1.3 Optical Floating Zone ........................................................................................... 11
1.4.3 Growth from Solution .............................................................................................. 12
1.4.3.1 Low Temperature Solution Growth ...................................................................... 13
1.4.3.2 Flux Growth .......................................................................................................... 13
2. LITERATURE SURVEY ............................................................................................... 15
2.1 Motive for Project Work ................................................................................................. 15
2.2 What are Borates? ........................................................................................................... 17
2.3 Important Anionic Groups in Borates ............................................................................. 18
2.4 Transparency of Borates in UV and deep UV Regions .................................................. 19
2.5 Cesium Triborate (CBO) ................................................................................................ 20
2.5.1 Structure of CBO ..................................................................................................... 21
2.5.2 Phase Diagram of CBO ............................................................................................ 22
2.5.3 CBO Crystal Growth History ................................................................................... 23
iv
2.6 Strontium Tetraborate (SBO) ......................................................................................... 25
2.6.2 SBO Crystal Growth History ................................................................................... 26
2.7 Barium Borate (BBO) ..................................................................................................... 27
3. CRYSTAL GROWTH .................................................................................................... 31
3.1 Growth of Cesium Triborate (CBO) ............................................................................... 31
3.1.1 Resistive Furnace Setup ........................................................................................... 31
3.1.2 Charge Synthesis ...................................................................................................... 33
3.1.3 Calculations .............................................................................................................. 33
3.1.4 Cleaning of crucible ................................................................................................. 34
3.1.5 Formation of Precursor ............................................................................................ 34
3.1.6 Growth Process ........................................................................................................ 35
3.2 Growth of Strontium Tetraborate (SBO) ........................................................................ 38
3.2.1 Charge Synthesis ...................................................................................................... 38
3.2.2 Growth Process ........................................................................................................ 38
3.3 Growth of Barium Borate (BBO) ................................................................................... 41
3.3.1 Charge Synthesis and Growth Process ..................................................................... 41
4. OPTICAL CHARACTERIZATIONS .......................................................................... 47
4.1 Refractive Index Measurement ....................................................................................... 47
4.2 Optical Transmission Measurement ............................................................................... 52
4.3 Study of Conoscopic Pattern .......................................................................................... 54
5. RESULTS AND DISCUSSION ..................................................................................... 56
6. CONCLUSIONS & FUTURE SCOPE ......................................................................... 59
v
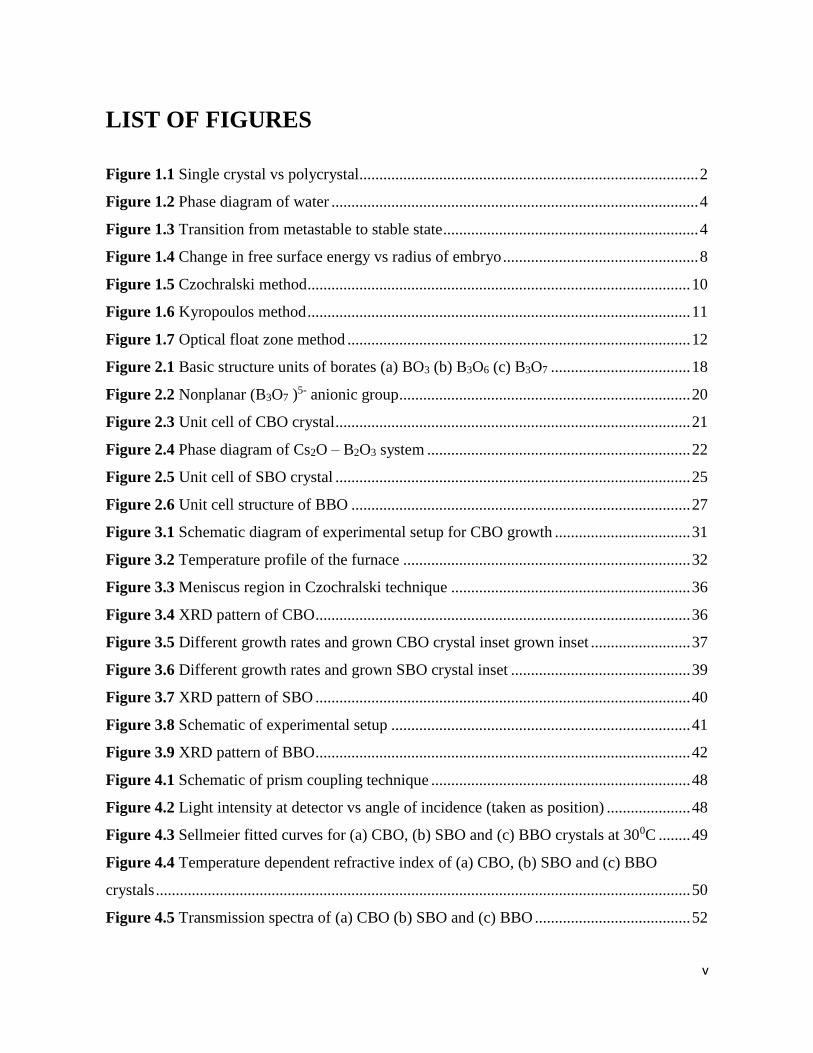
LIST OF FIGURES
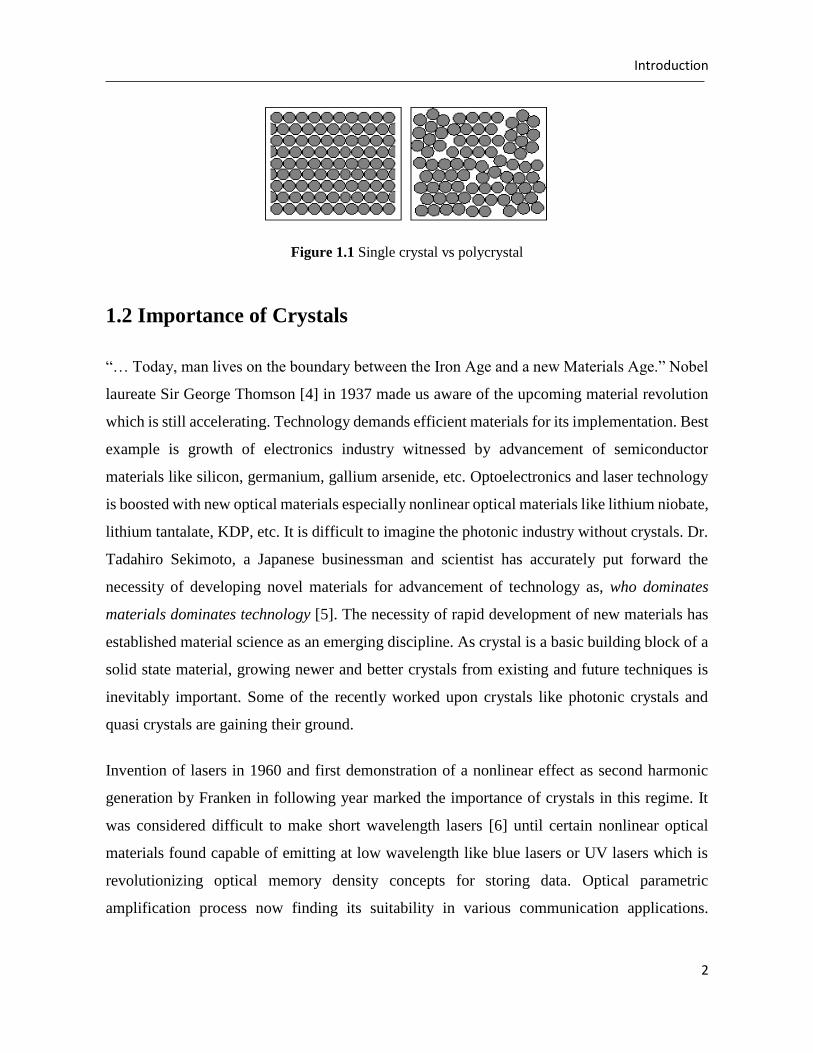
Figure 1.1 Single crystal vs polycrystal..................................................................................... 2
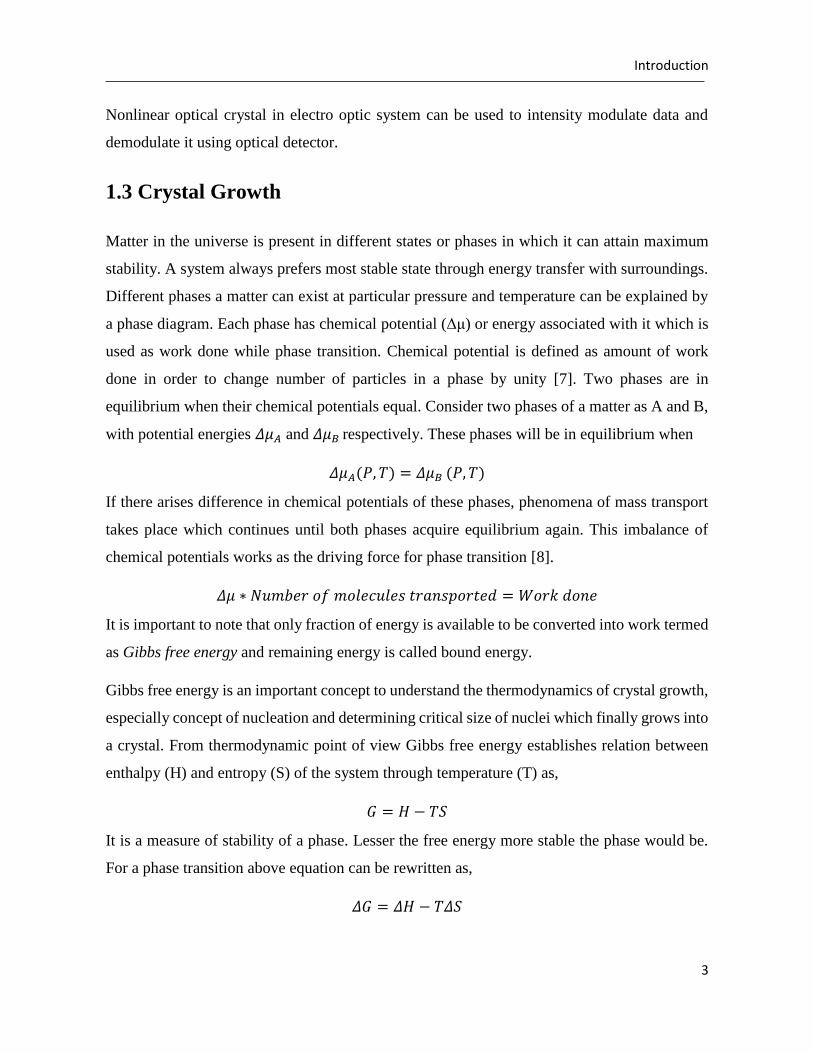
Figure 1.2 Phase diagram of water ............................................................................................ 4
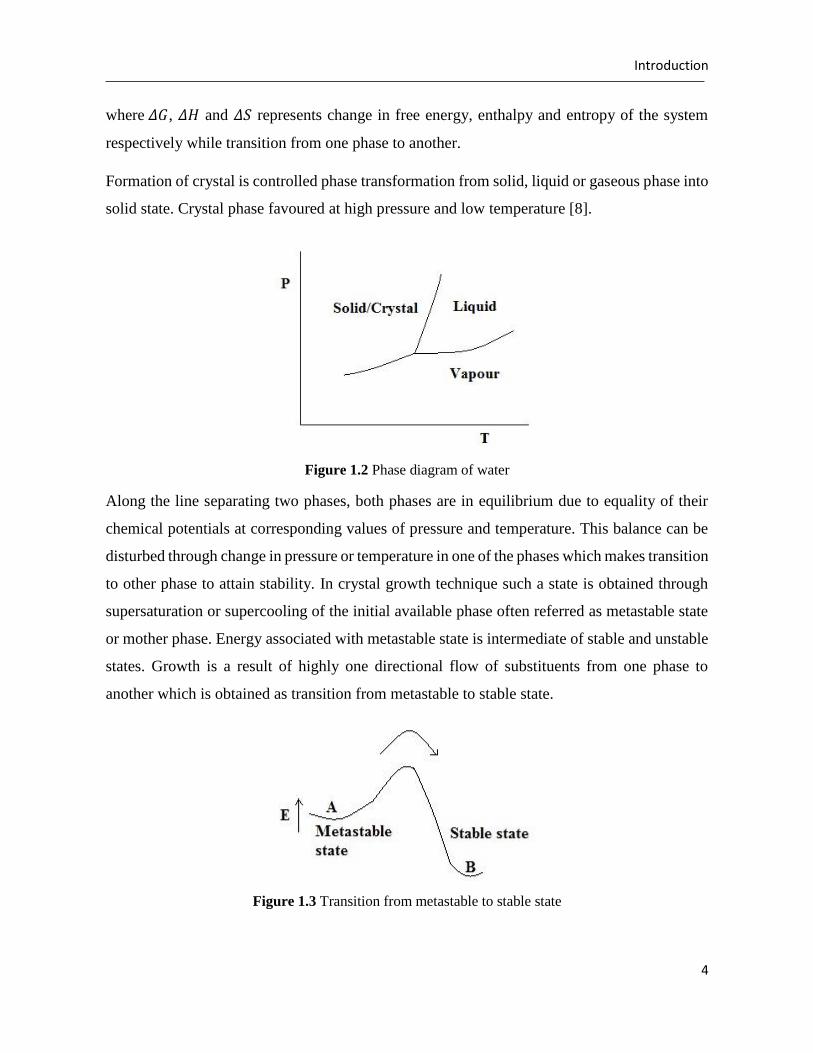
Figure 1.3 Transition from metastable to stable state ................................................................ 4
Figure 1.4 Change in free surface energy vs radius of embryo ................................................. 8
Figure 1.5 Czochralski method ................................................................................................ 10
Figure 1.6 Kyropoulos method ................................................................................................ 11
Figure 1.7 Optical float zone method ...................................................................................... 12
Figure 2.1 Basic structure units of borates (a) BO3 (b) B3O6 (c) B3O7 ................................... 18
Figure 2.2 Nonplanar (B3O7 )5- anionic group ......................................................................... 20
Figure 2.3 Unit cell of CBO crystal ......................................................................................... 21
Figure 2.4 Phase diagram of Cs2O – B2O3 system .................................................................. 22
Figure 2.5 Unit cell of SBO crystal ......................................................................................... 25
Figure 2.6 Unit cell structure of BBO ..................................................................................... 27
Figure 3.1 Schematic diagram of experimental setup for CBO growth .................................. 31
Figure 3.2 Temperature profile of the furnace ........................................................................ 32
Figure 3.3 Meniscus region in Czochralski technique ............................................................ 36
Figure 3.4 XRD pattern of CBO .............................................................................................. 36
Figure 3.5 Different growth rates and grown CBO crystal inset grown inset ......................... 37
Figure 3.6 Different growth rates and grown SBO crystal inset ............................................. 39
Figure 3.7 XRD pattern of SBO .............................................................................................. 40
Figure 3.8 Schematic of experimental setup ........................................................................... 41
Figure 3.9 XRD pattern of BBO .............................................................................................. 42
Figure 4.1 Schematic of prism coupling technique ................................................................. 48
Figure 4.2 Light intensity at detector vs angle of incidence (taken as position) ..................... 48
Figure 4.3 Sellmeier fitted curves for (a) CBO, (b) SBO and (c) BBO crystals at 300C ........ 49
Figure 4.4 Temperature dependent refractive index of (a) CBO, (b) SBO and (c) BBO
crystals ...................................................................................................................................... 50
Figure 4.5 Transmission spectra of (a) CBO (b) SBO and (c) BBO ....................................... 52

vi
Figure 4.6 Determination of band gap of BBO crystal ........................................................... 53
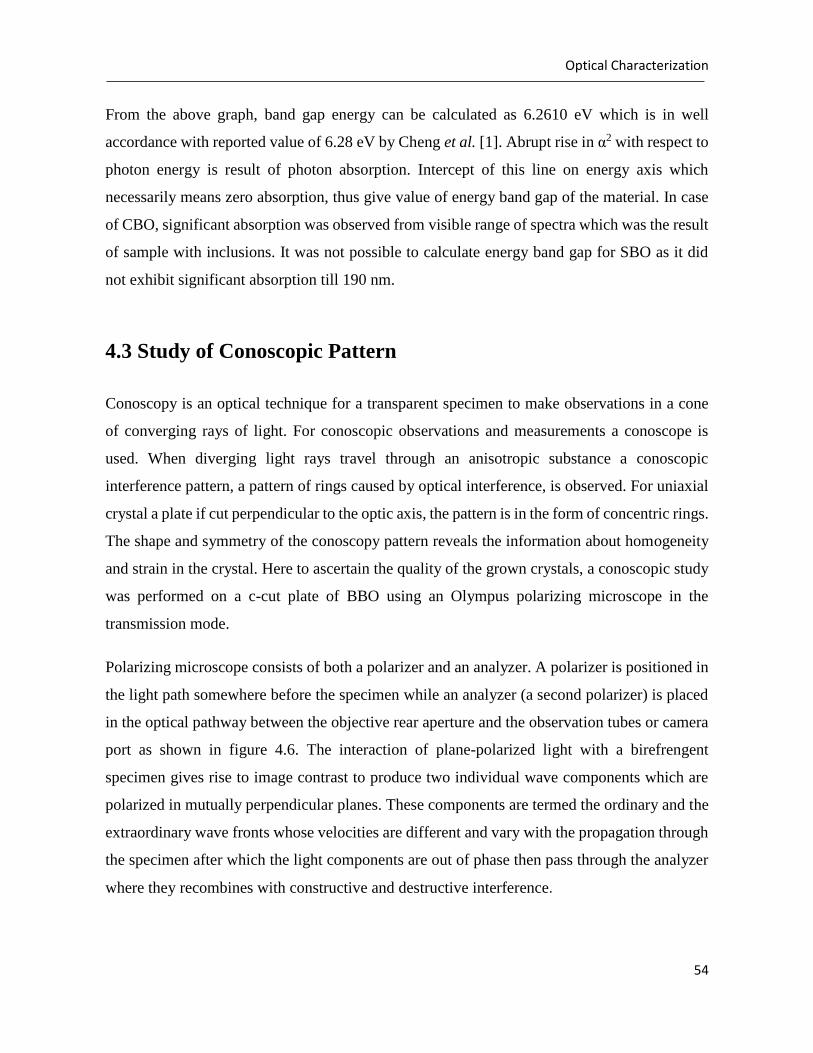
Figure 4.7 Conscopy pattern of c-cut BBO sample ................................................................. 55
Introduction
1
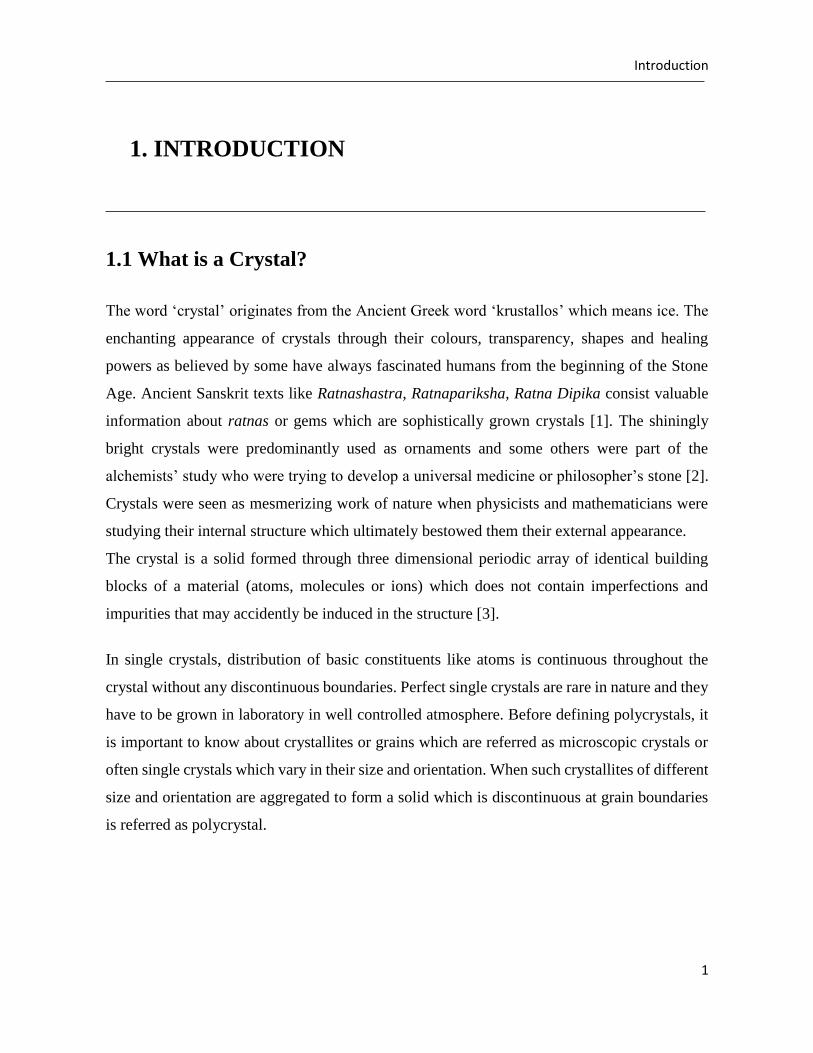
1. INTRODUCTION
1.1 What is a Crystal?
The word ‘crystal’ originates from the Ancient Greek word ‘krustallos’ which means ice. The
enchanting appearance of crystals through their colours, transparency, shapes and healing
powers as believed by some have always fascinated humans from the beginning of the Stone
Age. Ancient Sanskrit texts like Ratnashastra, Ratnapariksha, Ratna Dipika consist valuable
information about ratnas or gems which are sophistically grown crystals [1]. The shiningly
bright crystals were predominantly used as ornaments and some others were part of the
alchemists’ study who were trying to develop a universal medicine or philosopher’s stone [2].
Crystals were seen as mesmerizing work of nature when physicists and mathematicians were
studying their internal structure which ultimately bestowed them their external appearance.
The crystal is a solid formed through three dimensional periodic array of identical building
blocks of a material (atoms, molecules or ions) which does not contain imperfections and
impurities that may accidently be induced in the structure [3].
In single crystals, distribution of basic constituents like atoms is continuous throughout the
crystal without any discontinuous boundaries. Perfect single crystals are rare in nature and they
have to be grown in laboratory in well controlled atmosphere. Before defining polycrystals, it
is important to know about crystallites or grains which are referred as microscopic crystals or
often single crystals which vary in their size and orientation. When such crystallites of different
size and orientation are aggregated to form a solid which is discontinuous at grain boundaries
is referred as polycrystal.
Introduction
2
Figure 1.1 Single crystal vs polycrystal
1.2 Importance of Crystals
“… Today, man lives on the boundary between the Iron Age and a new Materials Age.” Nobel
laureate Sir George Thomson [4] in 1937 made us aware of the upcoming material revolution
which is still accelerating. Technology demands efficient materials for its implementation. Best
example is growth of electronics industry witnessed by advancement of semiconductor
materials like silicon, germanium, gallium arsenide, etc. Optoelectronics and laser technology
is boosted with new optical materials especially nonlinear optical materials like lithium niobate,
lithium tantalate, KDP, etc. It is difficult to imagine the photonic industry without crystals. Dr.
Tadahiro Sekimoto, a Japanese businessman and scientist has accurately put forward the
necessity of developing novel materials for advancement of technology as, who dominates
materials dominates technology [5]. The necessity of rapid development of new materials has
established material science as an emerging discipline. As crystal is a basic building block of a
solid state material, growing newer and better crystals from existing and future techniques is
inevitably important. Some of the recently worked upon crystals like photonic crystals and
quasi crystals are gaining their ground.
Invention of lasers in 1960 and first demonstration of a nonlinear effect as second harmonic
generation by Franken in following year marked the importance of crystals in this regime. It
was considered difficult to make short wavelength lasers [6] until certain nonlinear optical
materials found capable of emitting at low wavelength like blue lasers or UV lasers which is
revolutionizing optical memory density concepts for storing data. Optical parametric
amplification process now finding its suitability in various communication applications.
Introduction
3
Nonlinear optical crystal in electro optic system can be used to intensity modulate data and
demodulate it using optical detector.
1.3 Crystal Growth
Matter in the universe is present in different states or phases in which it can attain maximum
stability. A system always prefers most stable state through energy transfer with surroundings.
Different phases a matter can exist at particular pressure and temperature can be explained by
a phase diagram. Each phase has chemical potential (Δμ) or energy associated with it which is
used as work done while phase transition. Chemical potential is defined as amount of work
done in order to change number of particles in a phase by unity [7]. Two phases are in
equilibrium when their chemical potentials equal. Consider two phases of a matter as A and B,
with potential energies 𝛥𝜇𝐴 and 𝛥𝜇𝐵 respectively. These phases will be in equilibrium when
𝛥𝜇𝐴(𝑃, 𝑇) = 𝛥𝜇𝐵 (𝑃, 𝑇)
If there arises difference in chemical potentials of these phases, phenomena of mass transport
takes place which continues until both phases acquire equilibrium again. This imbalance of
chemical potentials works as the driving force for phase transition [8].
𝛥𝜇 ∗ 𝑁𝑢𝑚𝑏𝑒𝑟 𝑜𝑓 𝑚𝑜𝑙𝑒𝑐𝑢𝑙𝑒𝑠 𝑡𝑟𝑎𝑛𝑠𝑝𝑜𝑟𝑡𝑒𝑑 = 𝑊𝑜𝑟𝑘 𝑑𝑜𝑛𝑒
It is important to note that only fraction of energy is available to be converted into work termed
as Gibbs free energy and remaining energy is called bound energy.
Gibbs free energy is an important concept to understand the thermodynamics of crystal growth,
especially concept of nucleation and determining critical size of nuclei which finally grows into
a crystal. From thermodynamic point of view Gibbs free energy establishes relation between
enthalpy (H) and entropy (S) of the system through temperature (T) as,
𝐺 = 𝐻 − 𝑇𝑆
It is a measure of stability of a phase. Lesser the free energy more stable the phase would be.
For a phase transition above equation can be rewritten as,
𝛥𝐺 = 𝛥𝐻 − 𝑇𝛥𝑆
Introduction
4
where 𝛥𝐺, 𝛥𝐻 and 𝛥𝑆 represents change in free energy, enthalpy and entropy of the system
respectively while transition from one phase to another.
Formation of crystal is controlled phase transformation from solid, liquid or gaseous phase into
solid state. Crystal phase favoured at high pressure and low temperature [8].
Figure 1.2 Phase diagram of water
Along the line separating two phases, both phases are in equilibrium due to equality of their
chemical potentials at corresponding values of pressure and temperature. This balance can be
disturbed through change in pressure or temperature in one of the phases which makes transition
to other phase to attain stability. In crystal growth technique such a state is obtained through
supersaturation or supercooling of the initial available phase often referred as metastable state
or mother phase. Energy associated with metastable state is intermediate of stable and unstable
states. Growth is a result of highly one directional flow of substituents from one phase to
another which is obtained as transition from metastable to stable state.
Figure 1.3 Transition from metastable to stable state
Introduction
5
In figure 1.3, net growth from A to B is not obtained at equilibrium temperature as transition
from A to B is equal to transition from B to A. But at lower temperature, if B has lower free
energy than A, net growth from A to B is observed as transition from B to A puts higher energy
barrier to overcome [9].
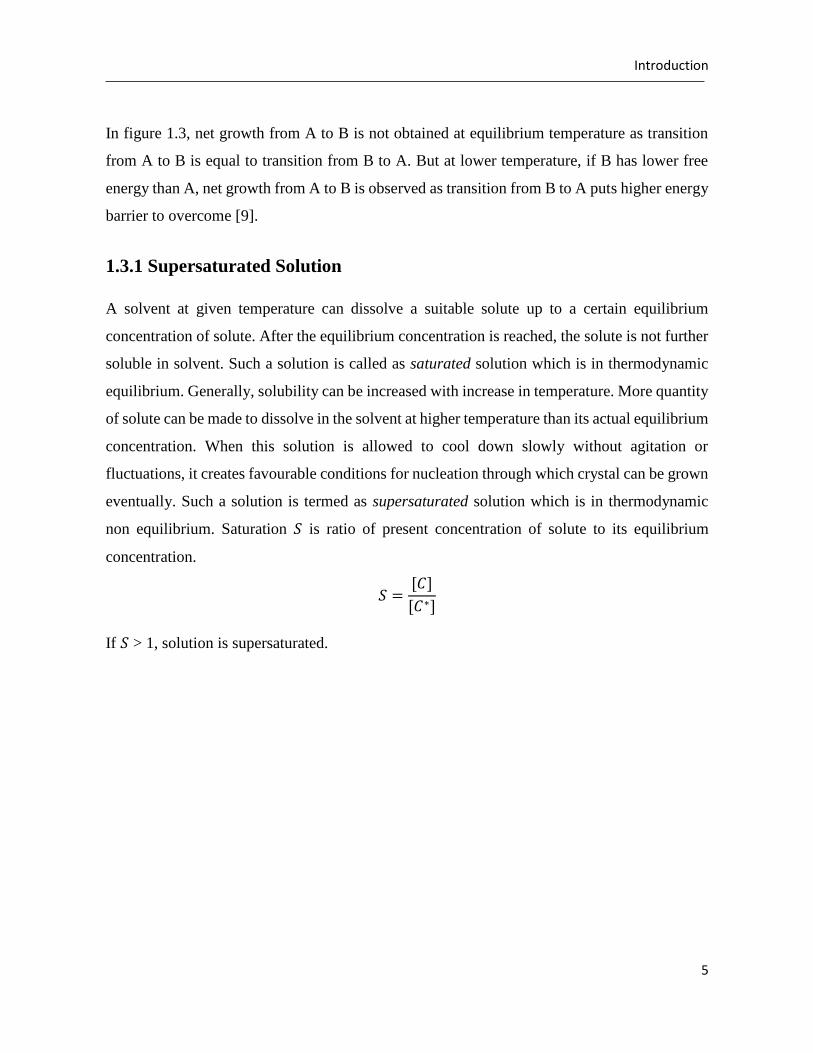
1.3.1 Supersaturated Solution
A solvent at given temperature can dissolve a suitable solute up to a certain equilibrium
concentration of solute. After the equilibrium concentration is reached, the solute is not further
soluble in solvent. Such a solution is called as saturated solution which is in thermodynamic
equilibrium. Generally, solubility can be increased with increase in temperature. More quantity
of solute can be made to dissolve in the solvent at higher temperature than its actual equilibrium
concentration. When this solution is allowed to cool down slowly without agitation or
fluctuations, it creates favourable conditions for nucleation through which crystal can be grown
eventually. Such a solution is termed as supersaturated solution which is in thermodynamic
non equilibrium. Saturation 𝑆 is ratio of present concentration of solute to its equilibrium
concentration.
𝑆 =[𝐶]
[𝐶∗]
If 𝑆 > 1, solution is supersaturated.
Introduction
6
1.3.2 Supercooled Solution
A liquid in its pure (without contamination) form can maintain liquid state even below the
freezing point due to absence of nucleation sites. Such a state is a metastable state which is
favourable for crystallization through provision of nucleation centre. Water freezes at 0o C. But
supercooled water can maintain liquid state even at low temperature like -40oC. Actual freezing
point of water is recently calculated as -48o C [10].
1.3.3 Nucleation
One of the definitions of nucleation states that it is a process of generating within metastable
mother phase initial fragments of new and more stable phase, capable of developing
spontaneously into gross fragments of stable phase [11].
The theory of formation of a nucleus (aggregating centre) was put forward by Volmer and
Gibbs. According to this theory fluctuations caused internally or externally in supersaturated or
supercooled systems, make few atoms or molecules to join and form clusters in the new
developing phase. Such cluster is often called as embryo or nucleation centre, etc. As it is a
phase transition, change in free energy takes place in this process. Not all clusters grow as a
stable nucleation centre but dissolve back into metastable mother phase as change in free energy
is not higher enough for phase transition to solid phase. In fact, probability of a cluster or
embryo growing into a stable nucleus which can support further growth increases with increase
in change in free energy associated with phase transition.
There always exists minimum size of embryo termed as critical nucleus, which can sustain in
mother phase and finally grow into product phase as crystal. Nucleation can occur in two ways.
If the embryo is formed within the mother phase without any external interference, it is termed
as spontaneous or homogeneous nucleation. On the other hand if embryo is formed around an
impurity or artificially induced nucleation site into metastable phase it is known as
heterogeneous nucleation. Use of seed in crystal growth is an example of such nucleation
process.
Introduction
7
1.3.4 Critical Nucleus Size for a Spherical Embryo
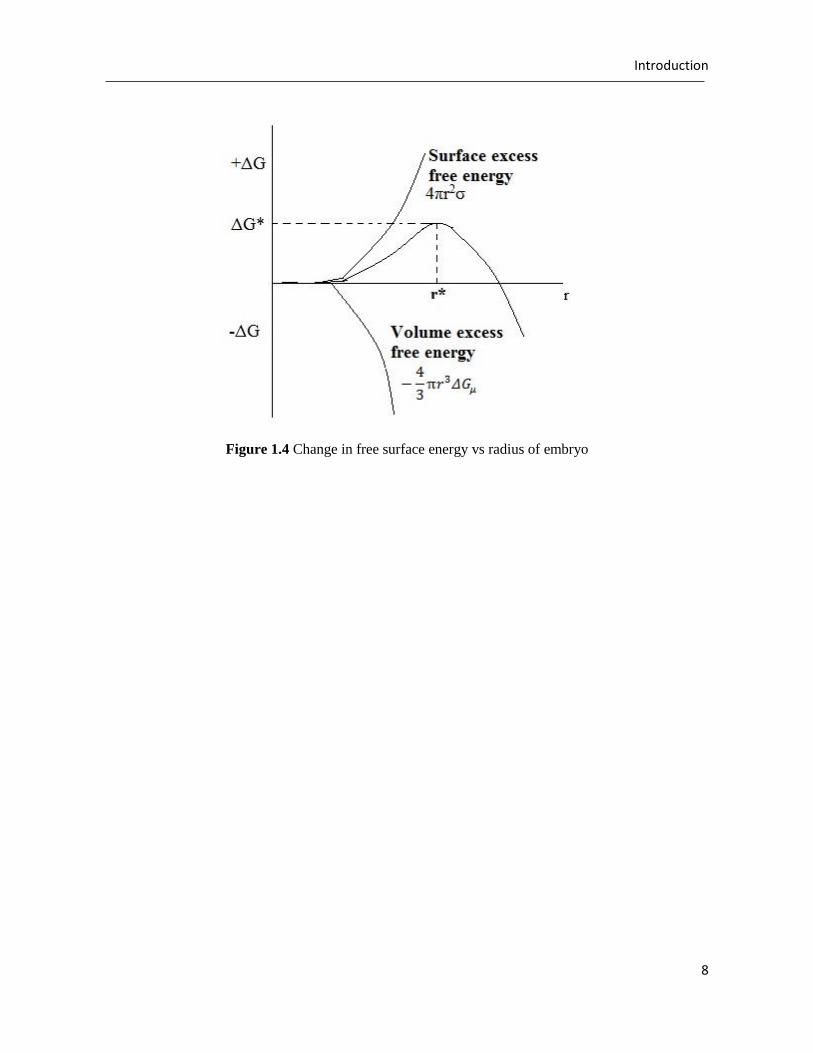
Change in Gibbs free energy is contributed through surface excess free energy (ΔGS) between
surface of particle and bulk of particles as well as volume excess free energy (ΔGV) between
bulk of particles and solute in solution.
𝛥𝐺 = 𝛥𝐺𝑆 + 𝛥𝐺𝑉
𝛥𝐺𝑆 for a spherical embryo of radius r is given as,
𝛥𝐺𝑆 = 4𝜋𝑟2𝜎
where 𝜎 is called interfacial tension between developing crystalline surface and mother phase.
𝛥𝐺𝑉 has negative value as,
𝛥𝐺𝑉 = −4
3𝜋𝑟3𝛥𝐺𝜇
where 𝛥𝐺𝜇 is free energy change of transformation per unit volume.
𝛥𝐺 = 4𝜋𝑟2𝜎 −4
3𝜋𝑟3𝛥𝐺𝜇
Maximum change in Gibbs free energy can be obtained by differentiation above equation with
respect to r and equating it to zero to get value of optimum r as,
𝑟∗ =2𝜎
3𝛥𝐺𝜇
𝑟∗ is the critical nucleus. A nucleus formed with lesser size than critical value does not sustain
growth and dissolves back. Free energy change at critical nucleus is given as
𝛥𝐺∗ =16𝜋𝜎3
3𝛥𝐺𝜇2
Size of the crystal is well affected by number of nucleation sites. Fewer nucleation sites result
into larger crystal size whereas many available nucleation sites result into smaller average sized
crystal.
Introduction
8
Figure 1.4 Change in free surface energy vs radius of embryo
Introduction
9
1.4 Crystal Growth Techniques
Based on the mother phase from which crystal is grown, crystal growth can be categorised on
the basis of phase transformation as
Solid to solid (Precipitation)
Liquid to solid (Solution and melt)
Vapour to solid (Sublimation)
1.4.1 Growth from Melt
Crystal growth from melt is directional solidification from the melt. It is the fastest process as
the growth rate does not depend upon mass transport process. Large single crystals of material
which melts congruently are obtained through this technique. Melted material is slowly cooled
down to obtain crystalline matter. Crystals of metals, semiconductors, laser materials can be
obtained by using melt technique.
Melt growth technique can be further classified into normal freezing and zone growth methods.
Normal freezing technique covers Bridgman and Czochralski methods whereas zone growth
covers optical and electrical floating zone methods.
1.4.1.1 Czochralski Method
Jan Czochralski accidently invented this method of crystal growing when he dipped nib of his
ink pen in molten tin pot instead of inkpot. Crystal growth in this method is accomplished with
the help of seed crystal. The molten charge is kept in crucible at temperature just above its
melting point. The seed crystal mounted on a rod is suspended vertically downwards. The seed
and charge are not in contact at the start of the process.
To initiate the process of crystal growth, rod is dipped into melt charge which starts nucleation
and then slowly pulled upwards to avoid remelting. One important characteristic of Czochralski
method lies in simultaneous pulling and rotating the seed crystal to maintain homogeneity in
grown crystal. This method requires controlled atmosphere in inert chamber. A typical
cylindrical ingot is obtained as final product of this method. This method is extensively used to
Introduction
10
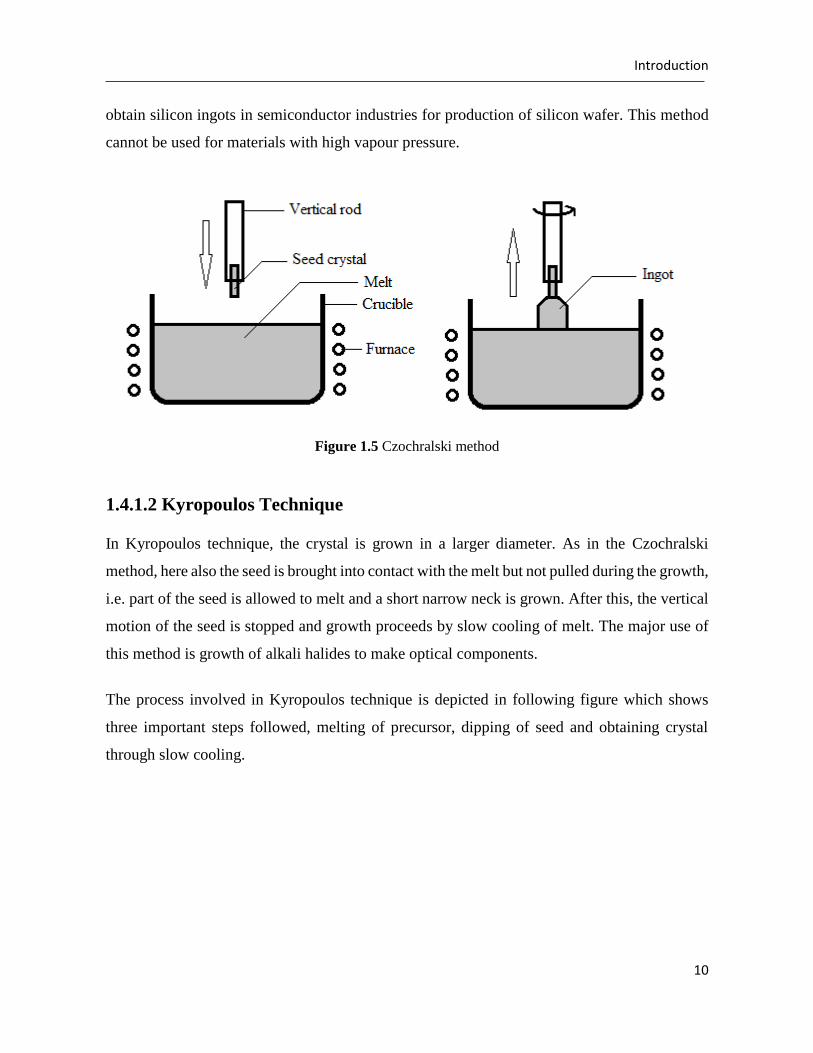
obtain silicon ingots in semiconductor industries for production of silicon wafer. This method
cannot be used for materials with high vapour pressure.
Figure 1.5 Czochralski method
1.4.1.2 Kyropoulos Technique
In Kyropoulos technique, the crystal is grown in a larger diameter. As in the Czochralski
method, here also the seed is brought into contact with the melt but not pulled during the growth,
i.e. part of the seed is allowed to melt and a short narrow neck is grown. After this, the vertical
motion of the seed is stopped and growth proceeds by slow cooling of melt. The major use of
this method is growth of alkali halides to make optical components.
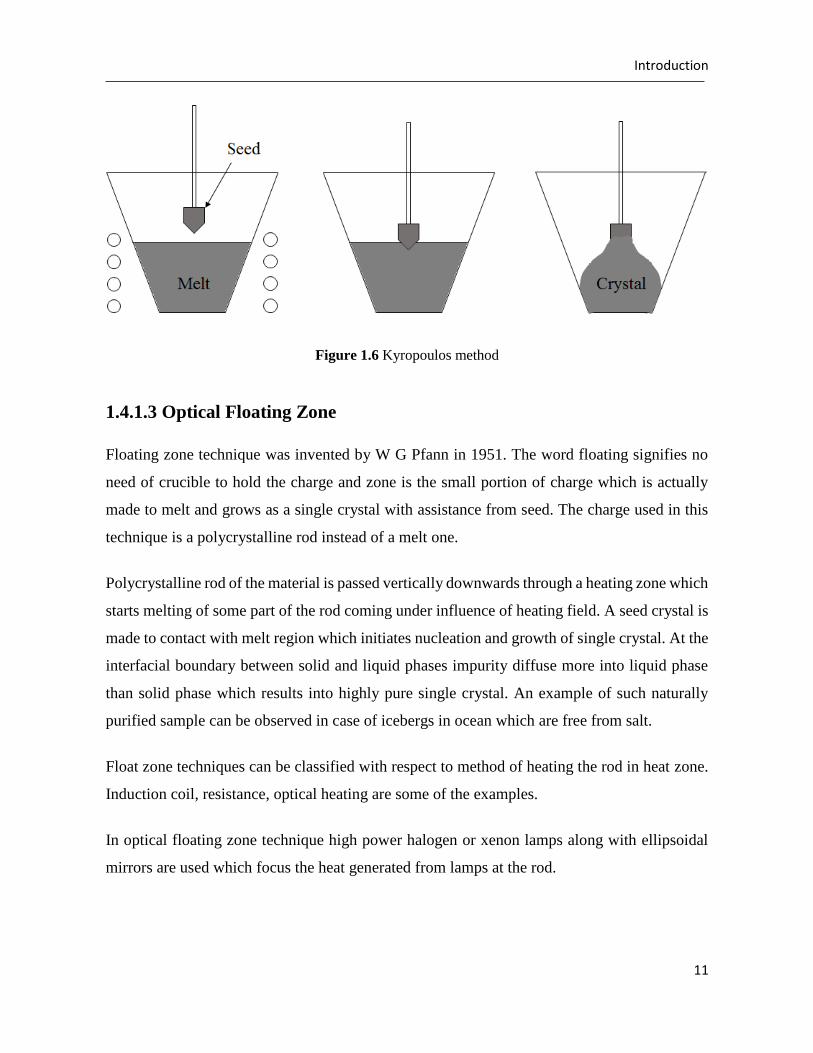
The process involved in Kyropoulos technique is depicted in following figure which shows
three important steps followed, melting of precursor, dipping of seed and obtaining crystal
through slow cooling.
Introduction
11
Figure 1.6 Kyropoulos method
1.4.1.3 Optical Floating Zone
Floating zone technique was invented by W G Pfann in 1951. The word floating signifies no
need of crucible to hold the charge and zone is the small portion of charge which is actually
made to melt and grows as a single crystal with assistance from seed. The charge used in this
technique is a polycrystalline rod instead of a melt one.
Polycrystalline rod of the material is passed vertically downwards through a heating zone which
starts melting of some part of the rod coming under influence of heating field. A seed crystal is
made to contact with melt region which initiates nucleation and growth of single crystal. At the
interfacial boundary between solid and liquid phases impurity diffuse more into liquid phase
than solid phase which results into highly pure single crystal. An example of such naturally
purified sample can be observed in case of icebergs in ocean which are free from salt.
Float zone techniques can be classified with respect to method of heating the rod in heat zone.
Induction coil, resistance, optical heating are some of the examples.
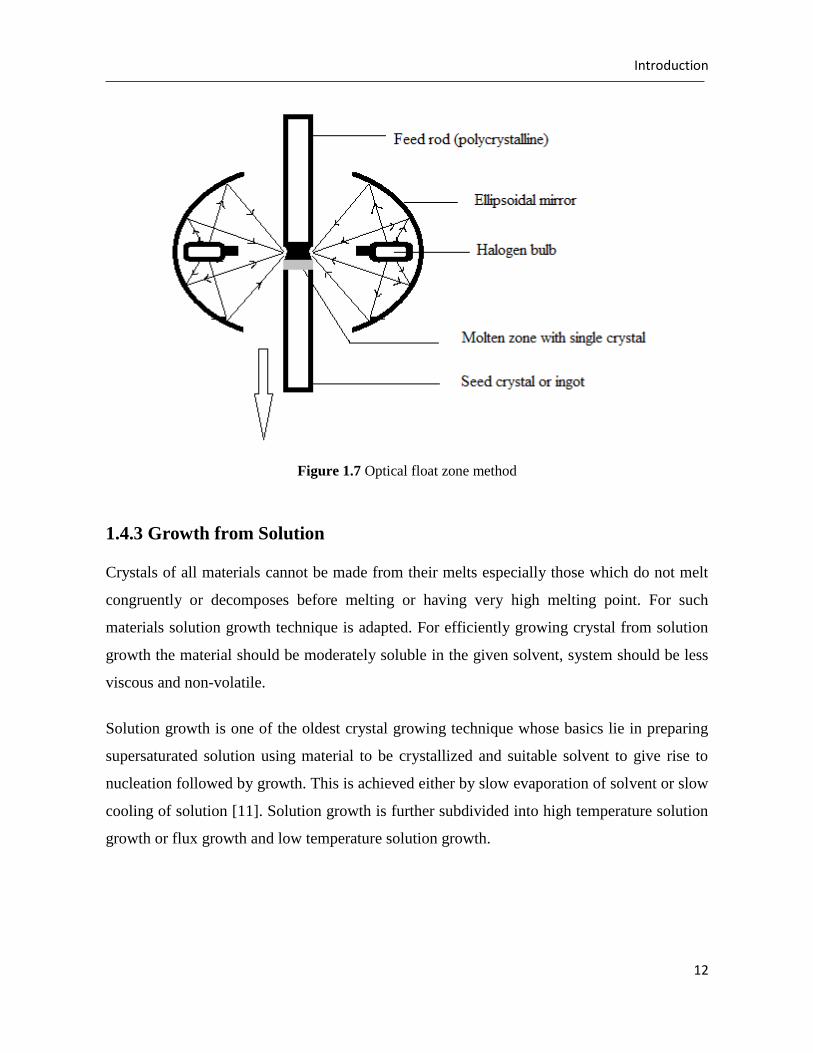
In optical floating zone technique high power halogen or xenon lamps along with ellipsoidal
mirrors are used which focus the heat generated from lamps at the rod.
Introduction
12
Figure 1.7 Optical float zone method
1.4.3 Growth from Solution
Crystals of all materials cannot be made from their melts especially those which do not melt
congruently or decomposes before melting or having very high melting point. For such
materials solution growth technique is adapted. For efficiently growing crystal from solution
growth the material should be moderately soluble in the given solvent, system should be less
viscous and non-volatile.
Solution growth is one of the oldest crystal growing technique whose basics lie in preparing
supersaturated solution using material to be crystallized and suitable solvent to give rise to
nucleation followed by growth. This is achieved either by slow evaporation of solvent or slow
cooling of solution [11]. Solution growth is further subdivided into high temperature solution
growth or flux growth and low temperature solution growth.
Introduction
13
Materials having moderate to high solubility from room temperature to 100oC at atmospheric
pressure can be grown by low temperature solution growth which may take weeks, months
sometimes years [12].
1.4.3.1 Low Temperature Solution Growth
This technique is mostly used for materials which are unstable and undergo phase
transformation at elevated temperatures. The alternative growth methods are solution growth at
room temperature or near to room temperature, close to equilibrium conditions. Material which
suffers from decomposition at or below its melting point, having moderate to high solubility in
the temperature range ambient to 100° C can be grown by the low temperature solution growth
method.
1.4.3.2 Flux Growth
Flux growth is popular name for high temperature solution growth where material is dissolved
into a suitable solvent called flux which has lower melting point. Flux can be defined as a liquid
reaction medium that dissolves reactants but do not participate in the reaction. This method is
very slow and crystals grown are often smaller in size. Typical solvents or molten salt fluxes
are PbO, Na2O, KF, NaF, SnF2, B2O3, etc.
Introduction
14
References
1. Krishnamurthy R. (1992). Gemmology in Ancient India. Indian Journal of History of
Science, 27 (3).
2. Scheel H. J. and Fukuda T. (2003). Crystal Growth Technology. John Wiley and Sons Ltd.
3. Kittel C. (2005). Introduction to Solid State Physics. John Wiley and Sons, Inc.
4. Elwell D. and Scheel H. J. (2011). Crystal Growth from High Temperature Solutions.
Academic Press.
5. Byrappa K. and Ohachi T. (2003). Crystal Growth Technology. William Andrew
Publishing.
6. Silfvast, W. T. (2004). Laser Fundamentals. Cambridge University Press.
7. Markov I. (2003). Crystal Growth for Beginners. World Scientific.
8. Hurley D. T. J. (1993). Handbook of Crystal Growth. Vol. 1, Elsevier.
9. Mullin J. W. (2001). Crystallization. 4th Ed, Butterwoth-Heineman.
10. Moore E. B. and Molinero V. (2011). Structural Tranformation in Supercooled Water
Controls the Crystallization Rate of Ice. Nature, 479, 506-508.
11. Sivakumar S. (2012). Cognition on Some Nonlinear Optical Crystals. Ph.D. Thesis, Periyar
University, India.
12. Sureshkumar P. (2011). Investigation on the Growth and Properties of Nonlinear Optical
Crystals. Ph.D. Thesis, Anna University, India.
Literature Survey
15
2. LITERATURE SURVEY
2.1 Motive for Project Work
Unlike IR and red solid state laser sources, blue and ultraviolet lasers are scarce. This fact is
well elaborated by W. Silfvast, a renowned physicist in the field of gas lasers. In his book Laser
Fundamentals, considered as one of the authoritative books in learning lasers, he quotes,
Considering strong wavelength dependence of stimulated emission cross section (𝜎𝑢𝑙), it is
difficult to make short wavelength lasers [1].
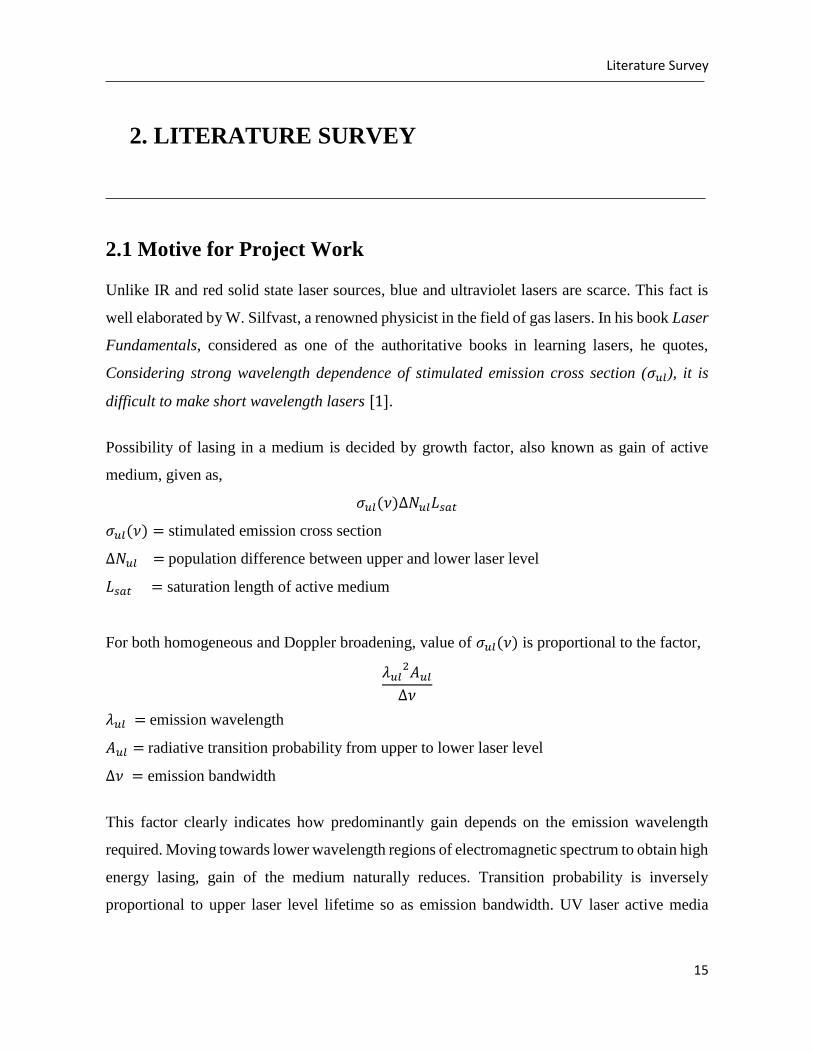
Possibility of lasing in a medium is decided by growth factor, also known as gain of active
medium, given as,
𝜎𝑢𝑙(𝜈)∆𝑁𝑢𝑙𝐿𝑠𝑎𝑡
𝜎𝑢𝑙(𝜈) = stimulated emission cross section
∆𝑁𝑢𝑙 = population difference between upper and lower laser level
𝐿𝑠𝑎𝑡 = saturation length of active medium
For both homogeneous and Doppler broadening, value of 𝜎𝑢𝑙(𝜈) is proportional to the factor,
𝜆𝑢𝑙2𝐴𝑢𝑙
Δ𝜈
𝜆𝑢𝑙 = emission wavelength
𝐴𝑢𝑙 = radiative transition probability from upper to lower laser level
Δ𝜈 = emission bandwidth
This factor clearly indicates how predominantly gain depends on the emission wavelength
required. Moving towards lower wavelength regions of electromagnetic spectrum to obtain high
energy lasing, gain of the medium naturally reduces. Transition probability is inversely
proportional to upper laser level lifetime so as emission bandwidth. UV laser active media
Literature Survey
16
generally have short upper laser level lifetime demanding more pumping [2] as well as
increasing denominator factor Δ𝜈 which invariably reduces gain.
Currently available UV laser sources are limited as rare-gas halide excimer lasers such as XeF
(353 nm), KrF (248 nm), ArF (193 nm), XeCl (308 nm) which are capable of producing high
average output power. GaN and InGaN based diode lasers are capable of producing near UV
laser emission. These lasers carry certain disadvantages like excimer lasers suffer from
bulkiness, demand of regular maintenance, use of corrosive gases, high voltage gaseous
discharges, etc. Disadvantage of diode lasers include divergence and short coherent lengths.
Subject to these shortcomings, new UV and deep UV laser sources are still in high demand for
medical surgeries, optical data storage devices to increase memory density, optical
communications and other industrial applications. 158 nm and 193 nm coherent light sources
are specifically required for semiconductor photolithography. Micromachining and material
processing also needs deep UV laser sources as high energy photon can induce bond braking
process in many materials. Need of UV and deep UV coherent light sources is well discussed
in review articles by Sasaki et al. [2] and R. Arun Kumar [3].
Borates have gain importance as popular nonlinear optical (NLO) materials due to their ability
to produce UV and deep UV laser through cascaded sum frequency generation using IR lasers
by second, third and higher harmonic generations [2]. These materials satisfy important
conditions to be a NLO crystal as high NLO coefficient, moderate birefringence, large laser
damage threshold, etc.
Literature Survey
17
2.2 What are Borates?
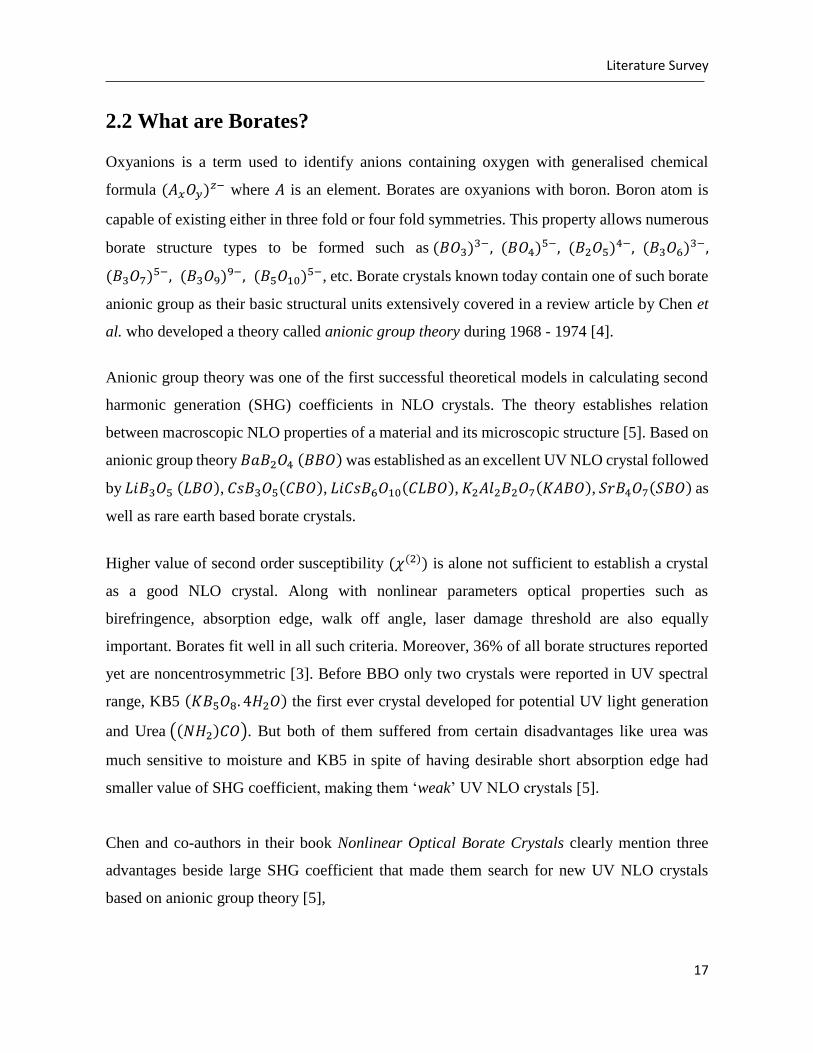
Oxyanions is a term used to identify anions containing oxygen with generalised chemical
formula (𝐴𝑥𝑂𝑦)𝑧− where 𝐴 is an element. Borates are oxyanions with boron. Boron atom is
capable of existing either in three fold or four fold symmetries. This property allows numerous
borate structure types to be formed such as (𝐵𝑂3)3−, (𝐵𝑂4)5−, (𝐵2𝑂5)4−, (𝐵3𝑂6)3−,
(𝐵3𝑂7)5−, (𝐵3𝑂9)9−, (𝐵5𝑂10)5−, etc. Borate crystals known today contain one of such borate
anionic group as their basic structural units extensively covered in a review article by Chen et
al. who developed a theory called anionic group theory during 1968 - 1974 [4].
Anionic group theory was one of the first successful theoretical models in calculating second
harmonic generation (SHG) coefficients in NLO crystals. The theory establishes relation
between macroscopic NLO properties of a material and its microscopic structure [5]. Based on
anionic group theory 𝐵𝑎𝐵2𝑂4 (𝐵𝐵𝑂) was established as an excellent UV NLO crystal followed
by 𝐿𝑖𝐵3𝑂5 (𝐿𝐵𝑂), 𝐶𝑠𝐵3𝑂5(𝐶𝐵𝑂), 𝐿𝑖𝐶𝑠𝐵6𝑂10(𝐶𝐿𝐵𝑂), 𝐾2𝐴𝑙2𝐵2𝑂7(𝐾𝐴𝐵𝑂), 𝑆𝑟𝐵4𝑂7(𝑆𝐵𝑂) as
well as rare earth based borate crystals.
Higher value of second order susceptibility (𝜒(2)) is alone not sufficient to establish a crystal
as a good NLO crystal. Along with nonlinear parameters optical properties such as
birefringence, absorption edge, walk off angle, laser damage threshold are also equally
important. Borates fit well in all such criteria. Moreover, 36% of all borate structures reported
yet are noncentrosymmetric [3]. Before BBO only two crystals were reported in UV spectral
range, KB5 (𝐾𝐵5𝑂8. 4𝐻2𝑂) the first ever crystal developed for potential UV light generation
and Urea ((𝑁𝐻2)𝐶𝑂). But both of them suffered from certain disadvantages like urea was
much sensitive to moisture and KB5 in spite of having desirable short absorption edge had
smaller value of SHG coefficient, making them ‘weak’ UV NLO crystals [5].
Chen and co-authors in their book Nonlinear Optical Borate Crystals clearly mention three
advantages beside large SHG coefficient that made them search for new UV NLO crystals
based on anionic group theory [5],
Literature Survey
18
1. Transparency of most of the borate crystals in UV and deep UV regions
2. Various structure types available in borate compounds
3. High laser damage threshold
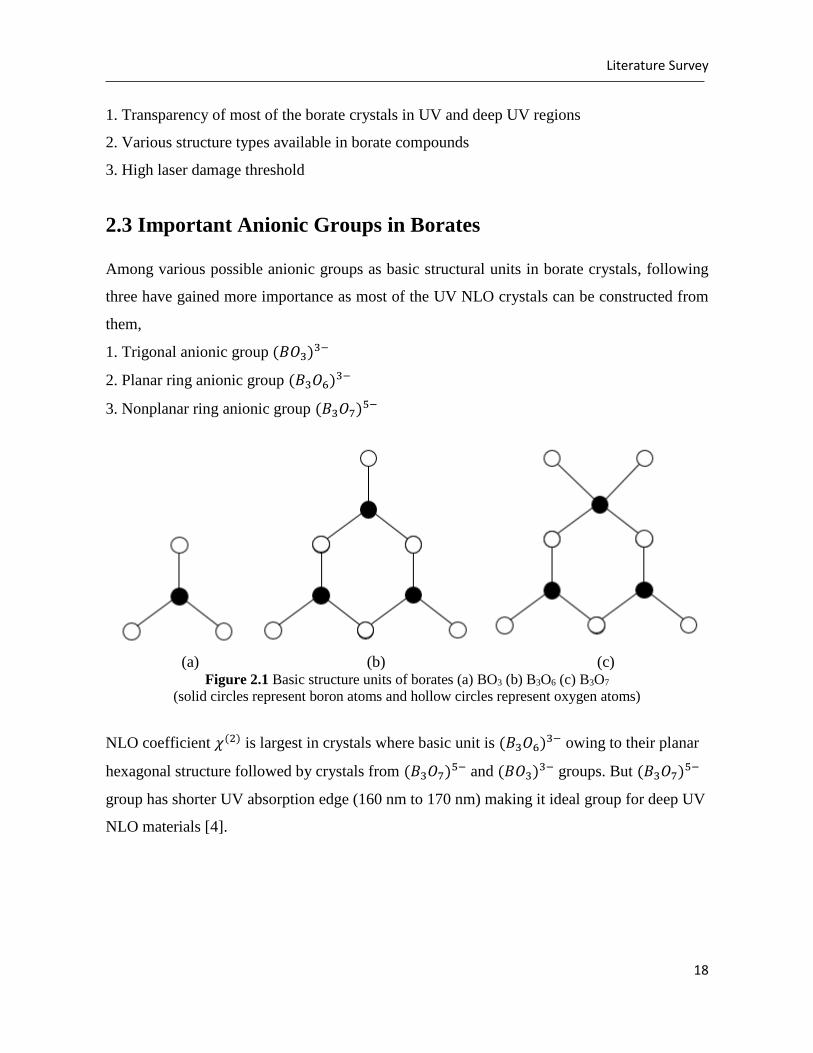
2.3 Important Anionic Groups in Borates Among various possible anionic groups as basic structural units in borate crystals, following
three have gained more importance as most of the UV NLO crystals can be constructed from
them,
1. Trigonal anionic group (𝐵𝑂3)3−
2. Planar ring anionic group (𝐵3𝑂6)3−
3. Nonplanar ring anionic group (𝐵3𝑂7)5−
(a) (b) (c)
Figure 2.1 Basic structure units of borates (a) BO3 (b) B3O6 (c) B3O7
(solid circles represent boron atoms and hollow circles represent oxygen atoms)
NLO coefficient 𝜒(2) is largest in crystals where basic unit is (𝐵3𝑂6)3− owing to their planar
hexagonal structure followed by crystals from (𝐵3𝑂7)5− and (𝐵𝑂3)3− groups. But (𝐵3𝑂7)5−
group has shorter UV absorption edge (160 nm to 170 nm) making it ideal group for deep UV
NLO materials [4].
Literature Survey
19
Some of the important borate crystals have been categorised according to their structural units
in following table,
Table 2.1 Borate crystals according to their structural units
Borate crystals Basic structure unit
SBBO, KBBF BO3
BBO B3O6
CBO, LBO, CLBO B3O7
SBO B3O9
2.4 Transparency of Borates in UV and deep UV Regions
Transparency of a material is decided by its energy band gap which can be attributed to the
strength and overlapping of bonds inside the material. Stronger the bond more will be the
energy to transfer electrons into conduction band and hence larger energy band gap (Eg).
Another important parameter which decides Eg is electronegativity of atoms (specifically ions)
taking part in bond formation as far as ionic bonds are considered. Greater the electronegativity
difference between ions, stronger will be the bond and larger Eg is obtained [6].
When a photon of energy hν is incident on a material, it can excite valence band electrons into
conduction band only if hν is greater than or equal to Eg, else material will not respond to
incoming photon. In other words the material will be transparent to the particular wavelength
of light incident upon it.
A material with band gap between 3.1 eV and 1.77 eV can be excited by a photon with
wavelength between 400 nm to 700 nm, which is visible region of the electromagnetic
spectrum. If band gap is greater than 3.1 eV, the material will be transparent to visible range of
spectrum as well as IR wavelengths. Generally a material will be transparent in UV and deep
UV region (200 nm), if the energy band gap is greater than 6.2 eV.
Borates have wide band gap energies owing to larger difference in electronegativities [4] of
boron (2.04) and oxygen (3.44) ions in different borate groups which make stronger B-O bonds.
Literature Survey
20
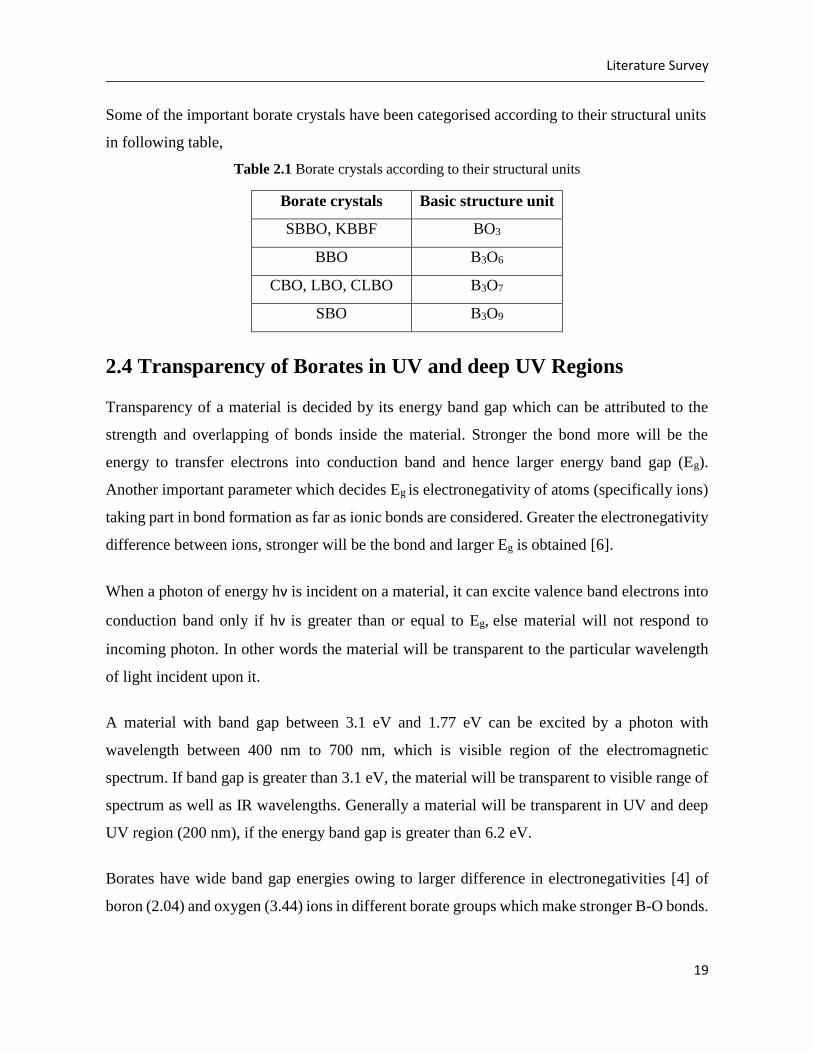
It is the reason borates show transparency in UV and deep UV region. Following are typical
values of Eg for some of the borate crystals [7].
Table 2.2 Energy band gap values of some borate crystals
Borates Energy band gap (Eg) in eV
BBO 6.28
CBO 7.3
LBO 8.01
SBO 8-10
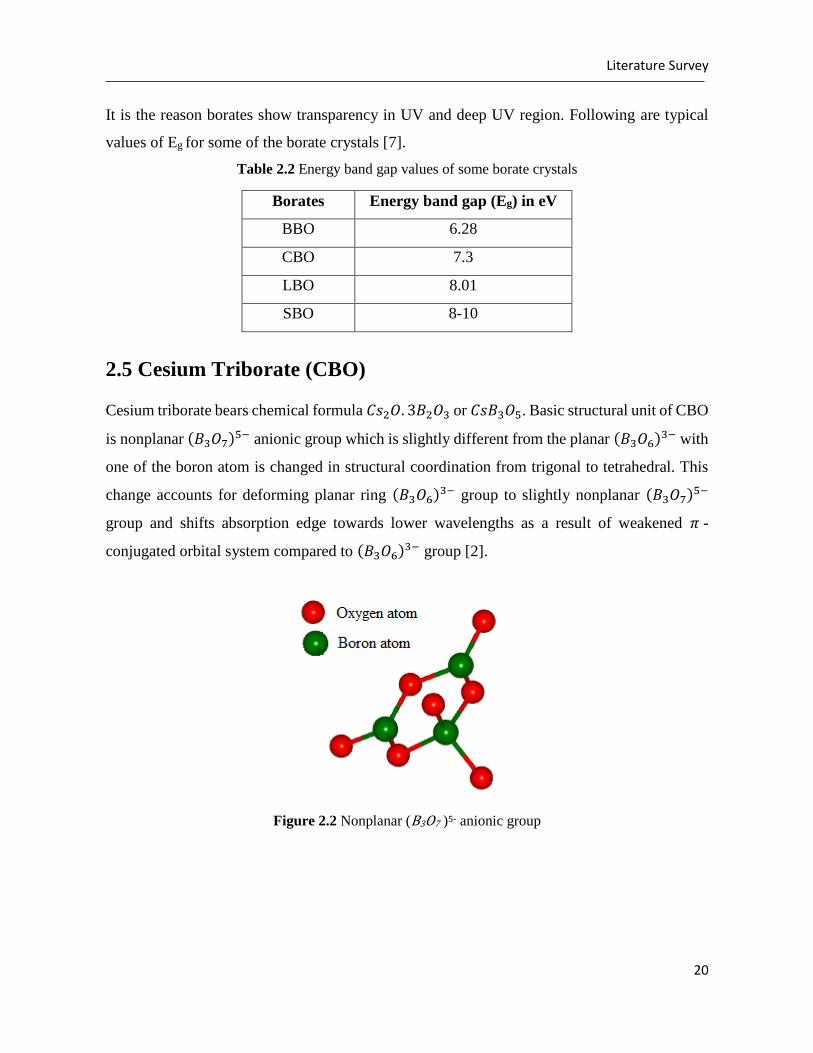
2.5 Cesium Triborate (CBO)
Cesium triborate bears chemical formula 𝐶𝑠2𝑂. 3𝐵2𝑂3 or 𝐶𝑠𝐵3𝑂5. Basic structural unit of CBO
is nonplanar (𝐵3𝑂7)5− anionic group which is slightly different from the planar (𝐵3𝑂6)3− with
one of the boron atom is changed in structural coordination from trigonal to tetrahedral. This
change accounts for deforming planar ring (𝐵3𝑂6)3− group to slightly nonplanar (𝐵3𝑂7)5−
group and shifts absorption edge towards lower wavelengths as a result of weakened 𝜋 -
conjugated orbital system compared to (𝐵3𝑂6)3− group [2].
Figure 2.2 Nonplanar (B3O7 )5- anionic group
Literature Survey
21
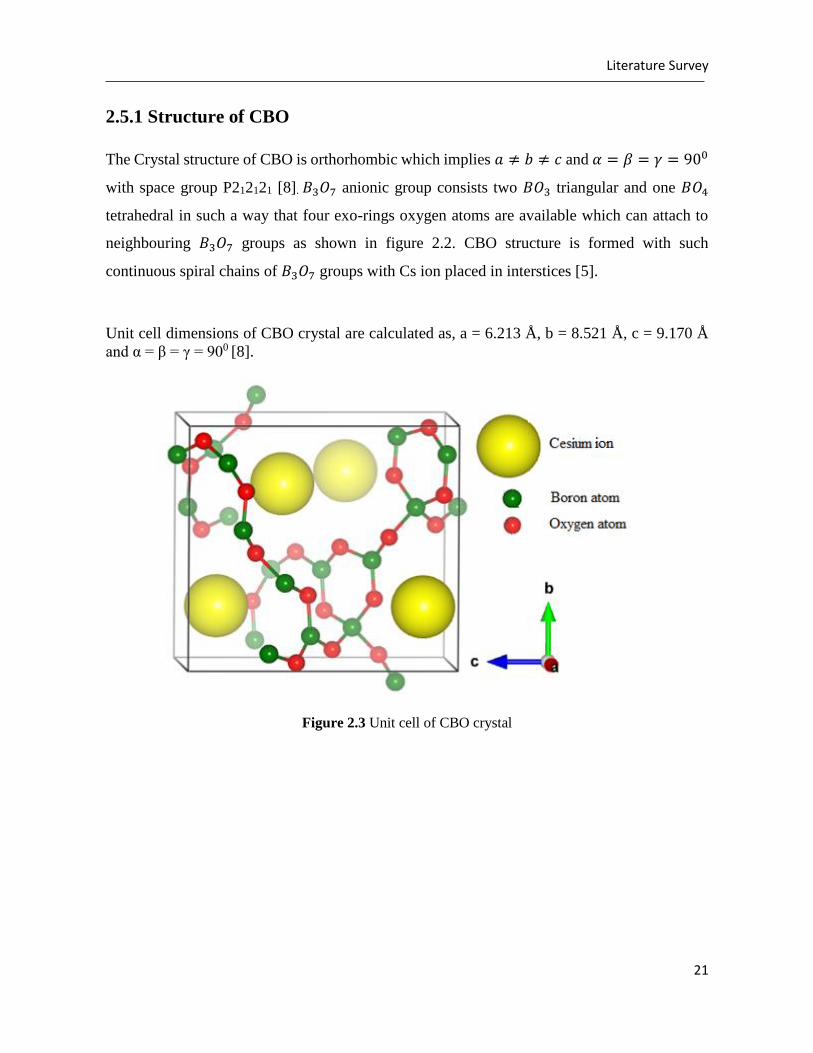
2.5.1 Structure of CBO
The Crystal structure of CBO is orthorhombic which implies 𝑎 ≠ 𝑏 ≠ 𝑐 and 𝛼 = 𝛽 = 𝛾 = 900
with space group P212121 [8]. 𝐵3𝑂7 anionic group consists two 𝐵𝑂3 triangular and one 𝐵𝑂4
tetrahedral in such a way that four exo-rings oxygen atoms are available which can attach to
neighbouring 𝐵3𝑂7 groups as shown in figure 2.2. CBO structure is formed with such
continuous spiral chains of 𝐵3𝑂7 groups with Cs ion placed in interstices [5].
Unit cell dimensions of CBO crystal are calculated as, a = 6.213 Å, b = 8.521 Å, c = 9.170 Å
and α = β = γ = 900 [8].
Figure 2.3 Unit cell of CBO crystal
Literature Survey
22
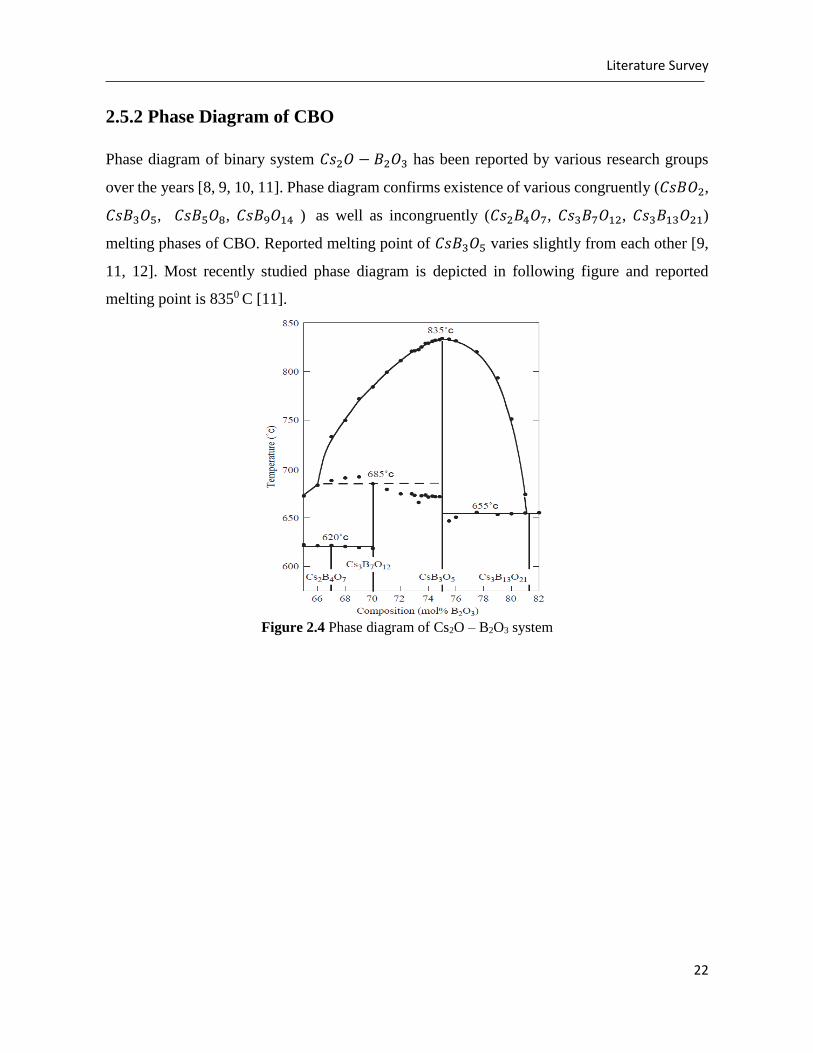
2.5.2 Phase Diagram of CBO
Phase diagram of binary system 𝐶𝑠2𝑂 − 𝐵2𝑂3 has been reported by various research groups
over the years [8, 9, 10, 11]. Phase diagram confirms existence of various congruently (𝐶𝑠𝐵𝑂2,
𝐶𝑠𝐵3𝑂5, 𝐶𝑠𝐵5𝑂8, 𝐶𝑠𝐵9𝑂14 ) as well as incongruently (𝐶𝑠2𝐵4𝑂7, 𝐶𝑠3𝐵7𝑂12, 𝐶𝑠3𝐵13𝑂21)
melting phases of CBO. Reported melting point of 𝐶𝑠𝐵3𝑂5 varies slightly from each other [9,
11, 12]. Most recently studied phase diagram is depicted in following figure and reported
melting point is 8350 C [11].
Figure 2.4 Phase diagram of Cs2O – B2O3 system
Literature Survey
23
2.5.3 CBO Crystal Growth History
Cesium oxide (𝐶𝑠2𝑂) - Boron oxide (𝐵2𝑂3) binary system was studied by J. Krogh Moe and
proposed the existence of congruently melting compound 𝐶𝑠𝐵3𝑂5 or 𝐶𝑠2𝑂. 3𝐵2𝑂3 in 1958 [8].
In1974, crystal structure of cesium triborate (CBO) was studied and unit cell dimensions were
calculated [8].
Anionic group theory developed by Chen et al. was utilized to calculate SHG coefficient of
CBO crystal Kinetic studies were performed by Marlor et al. in 1975 on CBO [5].
No report on single crystal growth of CBO came until 1993 when Wu et al. successfully grew
CBO single crystal through stoichiometric melt and measured its optical properties. Wide
transmission range (170 nm to 3000 nm), large NLO coefficient, high laser damage threshold
and type I, II phase matching for SHG and THG of 1.064um Nd:YAG made them to conclude
CBO as new NLO material [8].
Next successful growth of CBO was reported by Kagebayasghi et al. using Kyropoulos
technique in 1999. Through 𝐶𝑠2𝑂 enriched melt they obtained 45*41*44 mm3 CBO crystal free
of inclusions and cracks. Optical transparency range reported was wider than earlier as 167 nm
to 3400 nm [12].
Czochralski technique was used in 1999 by Peizhen et al. to grow single crystal of CBO. Axial
gradient of 60oC/cm with pulling rate of 8mm/day and 10rpm they obtained crystal of
dimensions 20mm diameter and 30mm height [13, 14]. On account of high viscosity contributed
by 𝐵2𝑂3 and volatility of 𝐶𝑠2𝑂, efforts were directed to grow CBO using TSSG (top seeded
solution growth).
Yoshimura et al. grew CBO single crystal with TSSG method in 2003 and successfully
demonstrated 355 nm light generation using grown crystal [15].
Literature Survey
24
During 2004, Saji et al. used various 𝐶𝑠2𝑂 and 𝐵2𝑂3 enriched solutions to grow CBO through
TSSG method with the help of phase diagram of 𝐶𝑠2𝑂 - 𝐵2𝑂3 binary system. They also
measured viscosity and volatility of the melt with respect to varying 𝐵2𝑂3 concentration [11].
Chang et al. reported seed submerged growth technique to obtain 65*44*49 mm3 single crystal
of CBO in 2004. They reported that similar morphology was existed with different seed
orientations [16].
The most recent paper on CBO growth appeared in November 2012 from Liu et al. who grew
47*45*41 mm3 size of CBO through TSSG method using 𝐶𝑠2𝑂 - 𝐵2𝑂3 – 𝑀𝑜𝑂3 system with
𝑀𝑜𝑂3 as flux [17].
Literature Survey
25
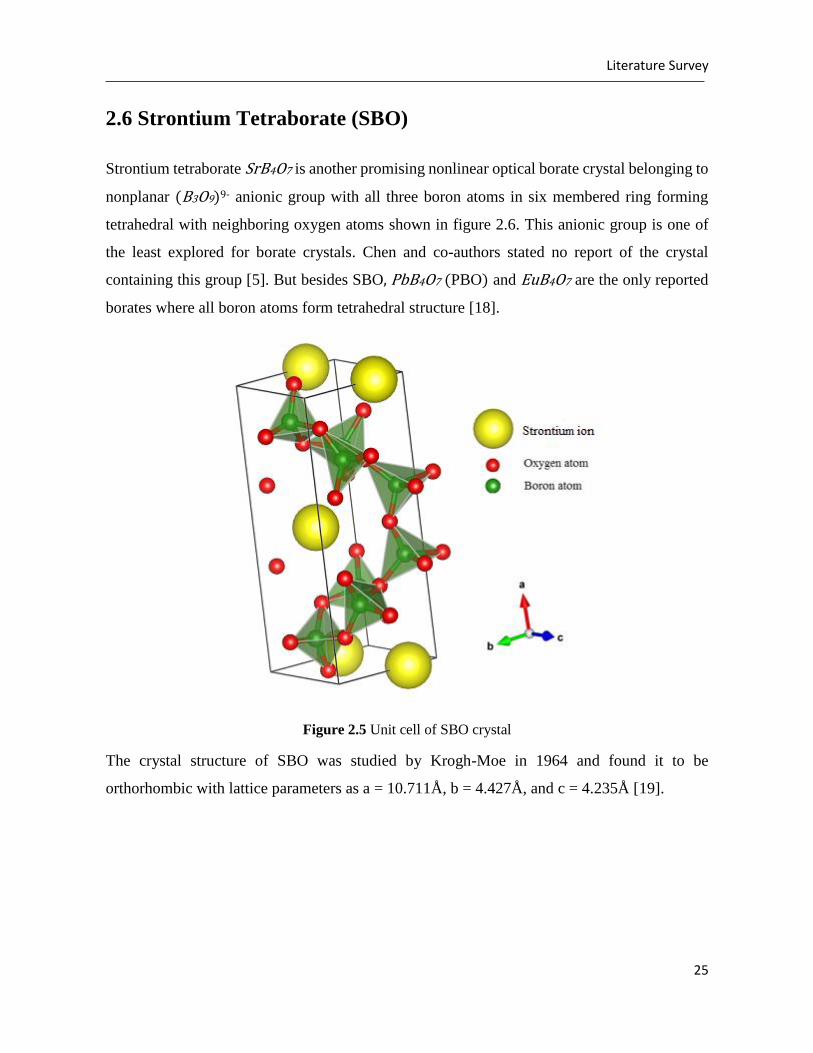
2.6 Strontium Tetraborate (SBO)
Strontium tetraborate SrB4O7 is another promising nonlinear optical borate crystal belonging to
nonplanar (B3O9)9- anionic group with all three boron atoms in six membered ring forming
tetrahedral with neighboring oxygen atoms shown in figure 2.6. This anionic group is one of
the least explored for borate crystals. Chen and co-authors stated no report of the crystal
containing this group [5]. But besides SBO, PbB4O7 (PBO) and EuB4O7 are the only reported
borates where all boron atoms form tetrahedral structure [18].
Figure 2.5 Unit cell of SBO crystal
The crystal structure of SBO was studied by Krogh-Moe in 1964 and found it to be
orthorhombic with lattice parameters as a = 10.711Å, b = 4.427Å, and c = 4.235Å [19].
Literature Survey
26
2.6.2 SBO Crystal Growth History
In 1993, Oseledchik et al. [20] implemented Czochralski method to grow SBO crystal for the
first time. Characteristics like excellent transparency range extending till vacuum UV (130 nm)
with high laser damage threshold, nonlinear optical coefficient, non hygroscopicity were
reported. SBO was found unable for SHG due to the absence of phase matching resulting from
small birefringence.
Comparitive studies between PBO and SBO were performed by Oseledchik et al. in 1996 [21].
In spite of absence of phase matching, non coherent SHG was observed in both crystals owing
to their high coherence length.
Pan et al. [22] grew SBO crystal using Kyropoulos technique and reported absorption edge in
vacuum UV below 120 nm. Non coherent SHG was observed using 1064 nm Nd:YAG laser as
source, producing green light at output.
SBO crystal was demonstrated to convert femtosecond UV pulses down to 125 nm with the use
of non phase matched SHG method by Petrov et al. [23].
Komatsu et al. [24] in 2005 reported to have grown pure and Samarium (Sm) doped SBO to
study transparency, dielectric properties and potential applications. Europium (Eu) doped SBO
was grown by Aleksandrovsky et al. [25] in 2006 to study various properties. Both groups used
Czochralski method to grow doped SBO crystals.
Atuchin et al. [26] studied electronic band structure of Czochralski grown SBO crystal. Zaitsev
et al. [27] observed partially ordered domain structure in SBO crystal for the first time.
Morphology and twinning in SBO crystal has been discussed by Zaitsev et al. [28] recently.
The idea to undertake growth of SBO was inspired by its vacuum UV transmission [21, 22]. As
per our knowledge, temperature dependent refractive index of SBO has been calculated for the
first time and it is shown that thermal coefficient of refractive index is positive. Recent studies
about SBO are focused on its potential applications. We tried to explore thermoluminescence
in SBO which can lead for its use in detectors for detecting xray, gamma ray radiation.
Literature Survey
27
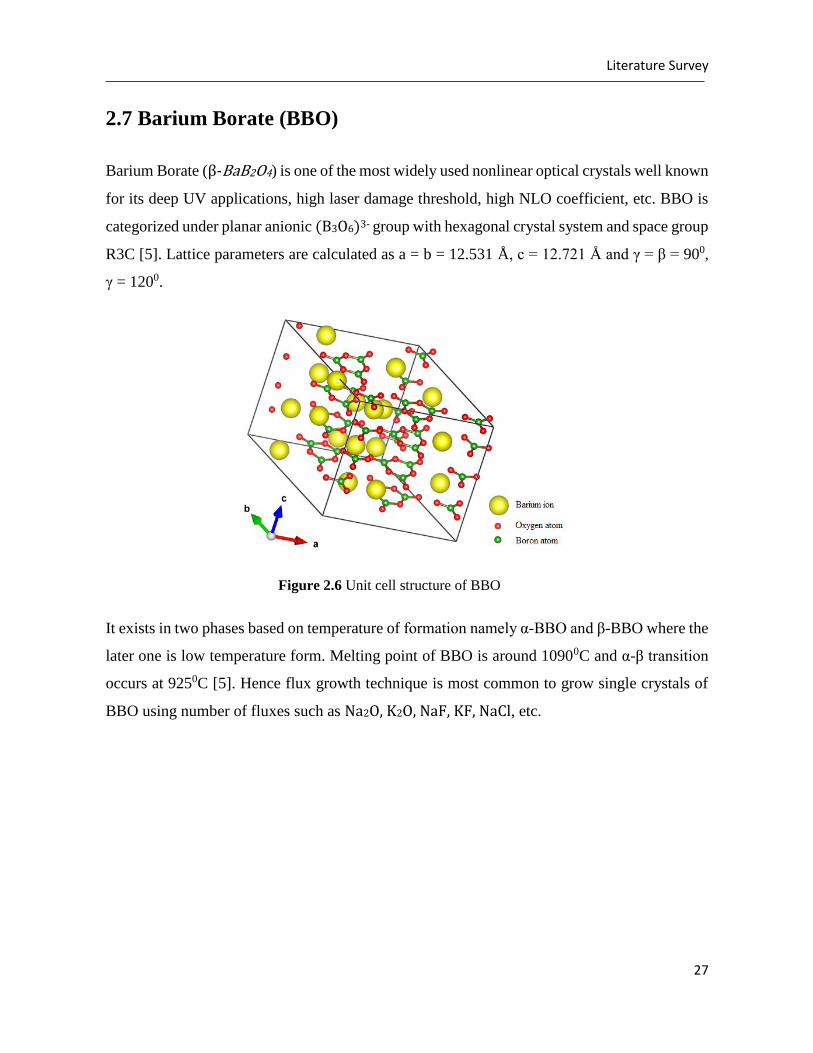
2.7 Barium Borate (BBO)
Barium Borate (β-BaB2O4) is one of the most widely used nonlinear optical crystals well known
for its deep UV applications, high laser damage threshold, high NLO coefficient, etc. BBO is
categorized under planar anionic (B3O6)3- group with hexagonal crystal system and space group
R3C [5]. Lattice parameters are calculated as a = b = 12.531 Å, c = 12.721 Å and γ = β = 900,
γ = 1200.
It exists in two phases based on temperature of formation namely α-BBO and β-BBO where the
later one is low temperature form. Melting point of BBO is around 10900C and α-β transition
occurs at 9250C [5]. Hence flux growth technique is most common to grow single crystals of
BBO using number of fluxes such as Na2O, K2O, NaF, KF, NaCl, etc.
Figure 2.6 Unit cell structure of BBO
Literature Survey
28
References
1. Sifvast, W. T. (2004). Laser Fundamentals. Cambridge University Press.
2. Sasaki, T., Mori, Y., Yoshimura, M., Yap, Y. K., & Kamimura, T. (2000). Recent
Development of Nonlinear Optical Borate Crystals : Key Materials for Generation of
Visible and UV Light. Materials Science and Engineering, 30, 1-54.
3. Kumar, R. A. (2012). Borate Crystals for Nonlinear Optical and Laser Appications : A
Review. Journal of Chemistry, 2013, 6.
4. Chen, C., Wu, Y., & Li, R. (1990). The Development of New NLO Crystals in the Borate
Series. Journal of Crystal Growth, 99, 790-798.
5. Chen, C., Sasaki, T., Li, R., Wu, Y., Lin, Z., Mori, Y., Hu, Z., Wang, J., Uda, S., Yoshimura,
M., & Kaneda, Y. (2012). Nonlinear Optical Borate Crystals Principles and Applications.
Wiley-VCH Verlag & Co. KGaA.
6. Duffey, J. A. (2001). Ultravioet Transparency of Glass : A Chemical Approach in terms of
Band Theory, Polarisability and Electronegativity. Phys. Chem. Glasses, 42(3), 151-157.
7. He, R., Lin, Z. S., Zheng, T., Huang, H., & Chen, C. T. (2012). Energy Band Gap
Enginerring in Borate Ultraviolet Nonlinear Optical Crystals : ab initio Studies. Journal of
Physics : Condensed Matter, 24(145503), 6.
8. Wu, Y., Sasaki, T., Tang, H., & Chen, C. (1993). CsB3O5 : A New Nonlinear Optical
Crystal. Appl. Phys. Lett., 62(21), 21.
9. Kaplun, A., & Meshalkin, A. (2000). Phase Equilibria in the Binary Systems Li2O-B2O3
and Cs2O-B2O3. Journal of Crystal Growth, 209, 890-894.
10. Penin, N., Touboul, M., & Nowogrocki, G. (2003). New Form of the Cs2O-B2O3 Phase
Diagram. Journal of Crystal Growth, 256, 334-340.
11. Saji, T., Hisaminato, N., Nishioka, M., Yoshimura, M., Mori, Y., & Sasaki, T. (2005).
Growth of Nonlinear Optical Crystal CsB3O5 from Self-Flux Solution. Journal of Crystal
Growth, 274, 183-190.
12. Kagebayashi, Y., Mori, Y., & Sasaki, T. (1999). Crystal Growth of Cesium Triborate
CsB3O5 by Kyropoulos Technique. Bull. Matter. Sci., 22(6), 971-973.
13. Fu, F., Wang, J., Hu, Z., Wu, Y., Yin, S., & Xu, Z. (1997). Growth and Properties of
Ultraviolet Nonlinear Optical Crystal Cesium Triborate.
Literature Survey
29
14. Wu, Y. (1997). Crystal Growth and Nonlinear Optical Properties of Cesium Triborate. In
T. Sasaki (Ed.), Proceedings of International Symposium on Laser and Nonlinear Optical
Materials, (pp. 120-125). Singapore.
15. Yoshimura, M., Mori, Y., Hu, Z., & Sasaki, T. (2004). Growth and Characterization of
Nonlinear Optical Borate Crystals CsLiB6O10, CsB3O5, and BaAlBO3F2. Optical Materials,
26, 421-423.
16. Cheng, F., Fu, P., Wu, Y., Chen, G., Xu, Z., & Chen, C. (2005). Growth of Large CsB3O5
Crystals. Journal of Crystal Growth, 277, 298-302.
17. Liu, S., Zhang, G., Feng, K., & Wu, Y. (2013). Growth, Thermophysical and Dielectric
Properties of the Nonlinear Optical Crystal CsB3O5. Journal of Crystal Growth, 364, 46-
50.
18. Zaitsev, A., Aleksandrovskii, A., Zamkov, A., Sysoev, A. (2006). Nonlinear Optical,
Piezoelectric, and Acoustic Properties of SrB4O7. Inorganic Materials, 42(12), 1360-1362.
19. Krogh-Moe, J. (1964). Crystal Structure of Strontium Diborate, SrO.2B2O3. Acta Chemica
Scandinavica, 18, 2055-2066.
20. Oseledchik, Yu., Prosvirnin, A., Starshenko, V., Osadchuk, V., Pisarevsky, A., Belokrys,
S., Korol, A., Svitanko, N., Selevich, T., Krikunov, S. (1994). Crystal Growth and
Properties of Strontium Tetraborate. Journal of Crystal Growth, 135, 373-376.
21. Oseledchik, Yu., Prosvirnin, A., Pisarevskiy, A., Starshenko, V., Osadchuk, V., Osadchuk,
V., Belokrys, S., Svitanko, N., Korol, A., Krikunov, S., Selevich, T. (1995). New Nonlinear
Optical Crystals: Strontium and Lead Tetraborates. Optical Materials, 4, 669-674.
22. Pan, F., Shen G., Wang, R., Wang, X., Shen, D. (2002). Growth, Characterization and
Nonlinear Optical Properties of SrB4O7 Crystals. Journal of Crystal Growth, 241, 108-114.
23. Petrov, V., Noack, F., Shen, D., Pan, F., Shen, G., Wang, X., Komatsu, R., Alex, V. (2004). Application of the Nonlinear Cystal SrB4O7 for Ultrafast Diagnostics Converting to
Wavelengths as short as 125 nm. Optics Letters, 29(4), 373.
24. Komatsu, R., Kawano, H., Oumaru, Z., Shinoda, K., Petrov, V. (2005). Growth of
Transparent SrB4O7 Single Crystal and its New Applications. Journal of Crystal Growth,
275, 843-847.
Literature Survey
30
25. Aleksandrovsk, A., Malakhovskii, A., Zabluda, V., Zaitsev, A., Zamkov, A. (2006). Optical
and Magneto-Optical Spectra of Europium-Doped Strontium Tetraborate Single Crystals.
Journal of Physics and Chemistry of Solids, 67, 1908-1912.
26. Atuchin, V., Kesler, V., Zaitsev, A., Molokeev, M., Aleksandrovsky, A., Kuzubov, A.,
Ignatova N. (2013). Electronic Structure of α-SrB4O7: Experiment and Theory. Journal of
Physics: Condensed Matter, 25, 085503.
27. Zaitsev, A., Aleksandrovsky, A., Vasiliev, A., Zamkov, A. (2008). Domain Structure in
Strontium Tetraborate Single Crystal. Journal of Crystal Growth, 310, 1-4.
28. Zaitsev, A., Radionov, N., Cherepakhin, A., Vasiliev, A., Zamkov, A. (2015). Morphology
of the Polar Twin Structure in Czochralski Grown α-SrB4O7 Crystals. Jouurnal of Crystal
Growth, 416, 17-20.
Crystal Growth
31
3. CRYSTAL GROWTH
3.1 Growth of Cesium Triborate (CBO)
It was decided to implement Czochralski method to grow single crystals of CBO as it was rarely
implemented before. Growth of CBO crystal was carried out with single zone resistive heating
furnace. Eurotherm PID programmable controller was used for temperature control. Pulling and
rotation control system with data logging software, developed in house was used.
3.1.1 Resistive Furnace Setup
Resistive furnace with low resistance (0.546 Ω) kanthal 1 (melting point 15000C) coil was used
to attain desired temperature which was measured using a thermocouple. Eurotherm 902P was
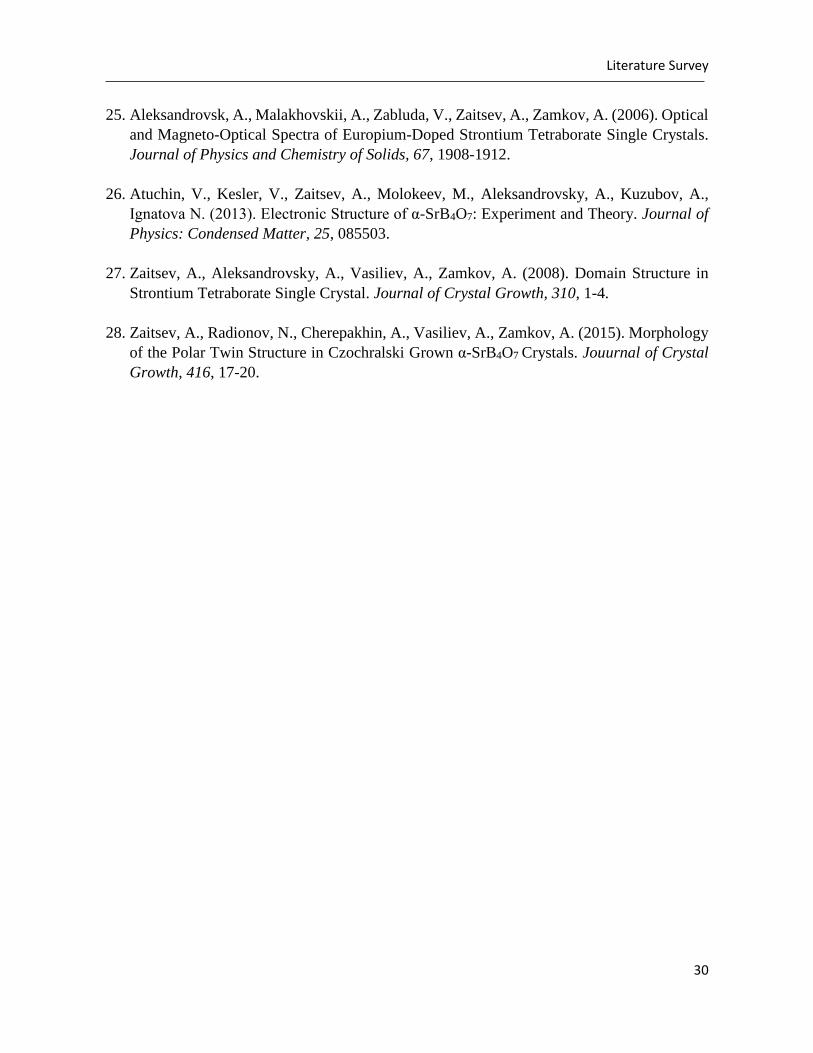
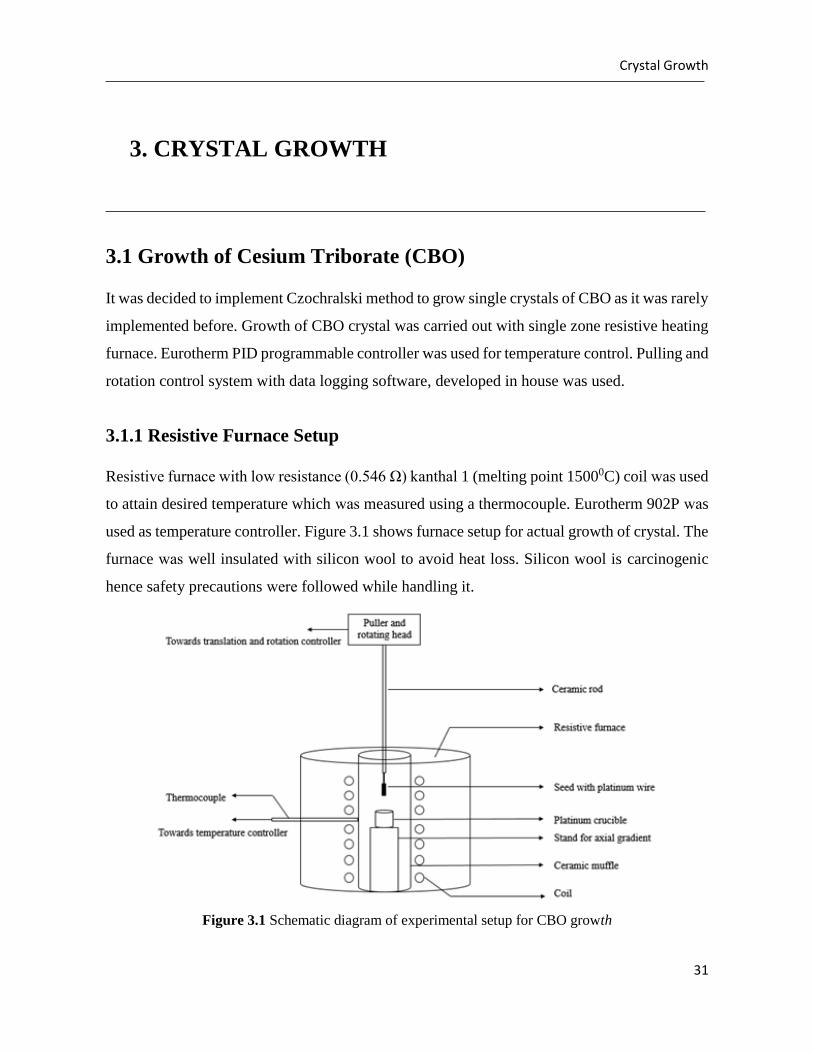
used as temperature controller. Figure 3.1 shows furnace setup for actual growth of crystal. The
furnace was well insulated with silicon wool to avoid heat loss. Silicon wool is carcinogenic
hence safety precautions were followed while handling it.
Figure 3.1 Schematic diagram of experimental setup for CBO growth
Crystal Growth
32
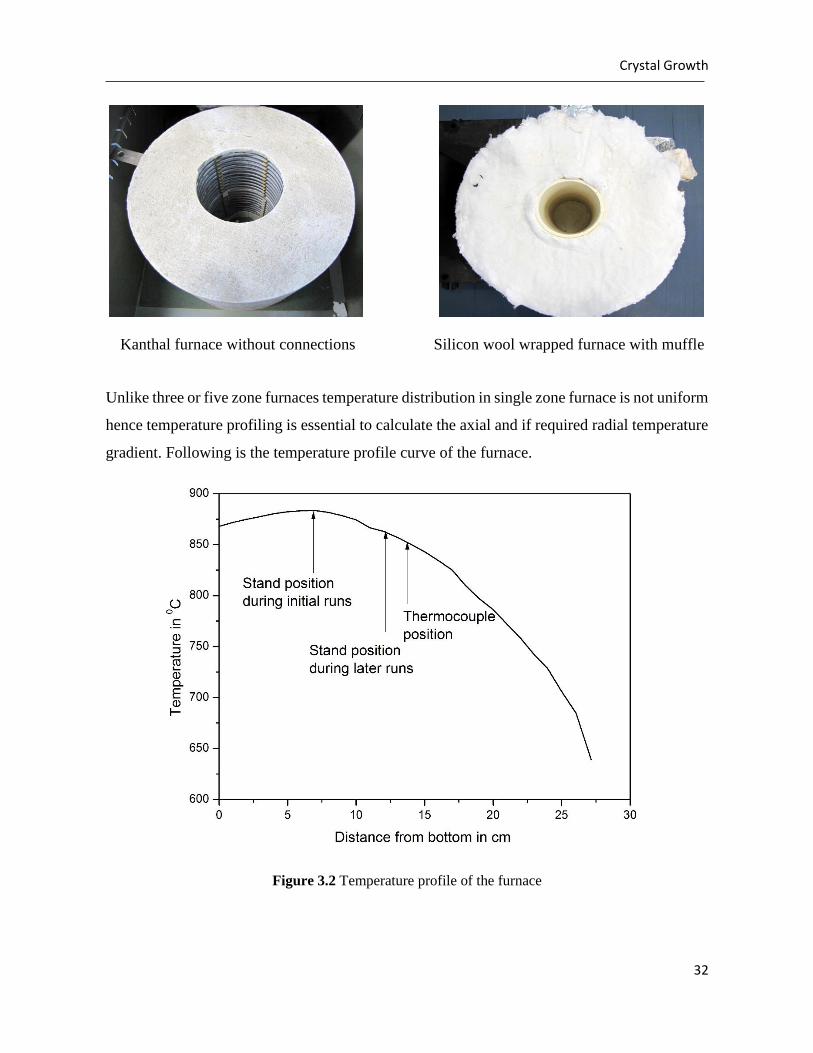
Unlike three or five zone furnaces temperature distribution in single zone furnace is not uniform
hence temperature profiling is essential to calculate the axial and if required radial temperature
gradient. Following is the temperature profile curve of the furnace.
Figure 3.2 Temperature profile of the furnace
Kanthal furnace without connections Silicon wool wrapped furnace with muffle
Crystal Growth
33
3.1.2 Charge Synthesis
Cesium triborate was prepared through reaction between cesium carbonate and boron oxide or
boric power as a liquid state chemical reaction. Cesium carbonate (𝐶𝑠2𝐶𝑂3) and boron oxide
(𝐵2𝑂3) were taken as reactants in purest (99.99%) form which forms CBO as,
𝐶𝑠2𝐶𝑂3 + 3𝐵2𝑂3
∆→ 2𝐶𝑠𝐵3𝑂5 + 𝐶𝑂2 ↑
Cesium carbonate is highly hygroscopic chemical which needs extra precaution at the time of
weighing to avoid inclusion of moisture. Handheld halogen lamp was used to keep surroundings
warmer, while taking it out of bottle as well as during weighing. It was immediately transferred
to a clean platinum crucible and kept in an oven around 1000 C. Boron oxide was weighed under
normal ambient conditions and transferred in a clean airtight plastic bottle. Preliminary safety
precautions were followed throughout the process as cesium carbonate is toxic and boron oxide
is irritant for skin.
3.1.3 Calculations
Reactants Formula weight (g/mol)
Cs2CO3 325.8198
B2O3 3 * 69.6021 = 208.8606
Products Formula weight (g/mol)
CsB3O5 2 * 245.3354 = 490.6709
CO2 44.0095
490.6709 gm of 𝐶𝑠𝐵3𝑂5 contains 1 mol of it, hence 1 gm of cesium triborate contains
(1
490.6709) = 0.0020380 mol of it.
Amount of Cs2CO3 required to obtain 1 gm of 𝐶𝑠𝐵3𝑂5 = 325 ∗ 0.0020380 = 0.664029 𝑔𝑚
Amount of 𝐵2𝑂3 required to obtain 1 gm of 𝐶𝑠𝐵3𝑂5 = 208.8606 ∗ 0.0020380 =
0.425663 𝑔𝑚.
Crystal Growth
34
Initial charge was prepared for 50 gm of CBO hence,
Amount of Cs2CO3 required = 50 ∗ 0.6640 = 33.2014 𝑔𝑚.
Amount of 𝐵2𝑂3 required = 50 ∗ 0.4256 = 21.2831 𝑔𝑚.
3.1.4 Cleaning of crucible
One of the biggest disadvantages of Czochralski method for growth of single crystal is charge
contamination through the crucible that is not cleaned properly. To avoid the contamination
from platinum crucible, it was dipped in hot nitric acid (800 C) for half an hour and washed with
plenty of water. This procedure was repeated until platinum crucible became completely clean.
Such a crucible (3.5 cm in diameter and 4 cm in height) was used to transfer cesium carbonate.
3.1.5 Formation of Precursor
Melting point of cesium carbonate is 6100 C and it decomposes around 6000 C as,
Cs2CO3
∆→ 𝐶𝑠2𝑂 + 𝐶𝑂2 ↑
After cesium carbonate completely melted, boron oxide was added into melt 2 gm each time.
Melting point of boron oxide is 4500 C and it forms highly viscous melt. As a result CO2 fumes
were trapped under the viscous layer of melted boron oxide and highly violent frothing was
observed and extra care was demanded to avoid spilling the charge out of crucible. This
problem was avoided by implementing batch melting process in which chemicals were mixed
initially and later allowed to melt in batches of 2-3 gm each time. The temperature was kept
around 8900C. Once compete charge was melted, temperature was brought down to 8550C and
kept overnight for homogenization.
Crystal Growth
35
3.1.6 Growth Process
Czochralski technique was adopted to grow CBO crystal. As CBO had to be grown for the first
time at crystal growth lab, RRCAT, seed crystal was unavailable. Initial runs were tried with
platinum wire as a seed which is a standard practice followed in absence of seed crystal. Once
a crystal is grown with platinum wire which is not of superior quality or even a single crystal,
seeds with different orientations can be cut from the obtained crystal. Growth temperature when
seed is attached varies from platinum seeded growth. Different growth parameters were set for
different runs. A general practice follows cutting the crystal obtained from each run and portion
of it is used as a seed for next run which improves the quality of crystal during each run.
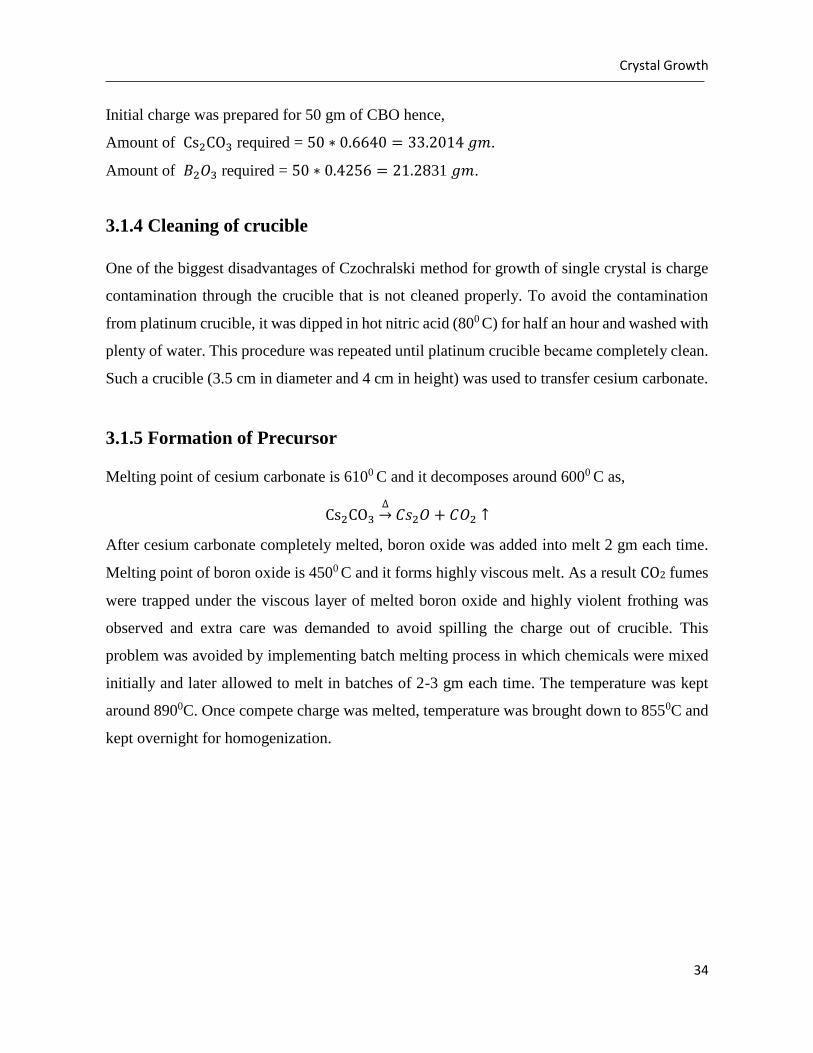
Following images show the grown polycrystalline disc and seeds obtained out of it.
Polycrystalline disc
After homogenization, temperature was reduced and kept around 50 C above the melting point
and melt was allowed to remain at same temperature for some time (15 – 20 minutes). Seed tied
to ceramic rod with platinum wire was then slowly dipped such that it should be at the centre
of crucible which increased chances of equal growth from all directions. After dipping, the seed
was pulled out 2 – 3 mm to form a meniscus. Meniscus region is considered the most important
regions in Czochralski technique. It is critical because the boundary between solid (crystal) and
liquid (melt), also called as interface, lies in this region where crystallization takes place through
releasing heat, as it is an exothermic reaction.
Circled seeds were used during
next runs
Disc taken out
of crucible
Crystal Growth
36
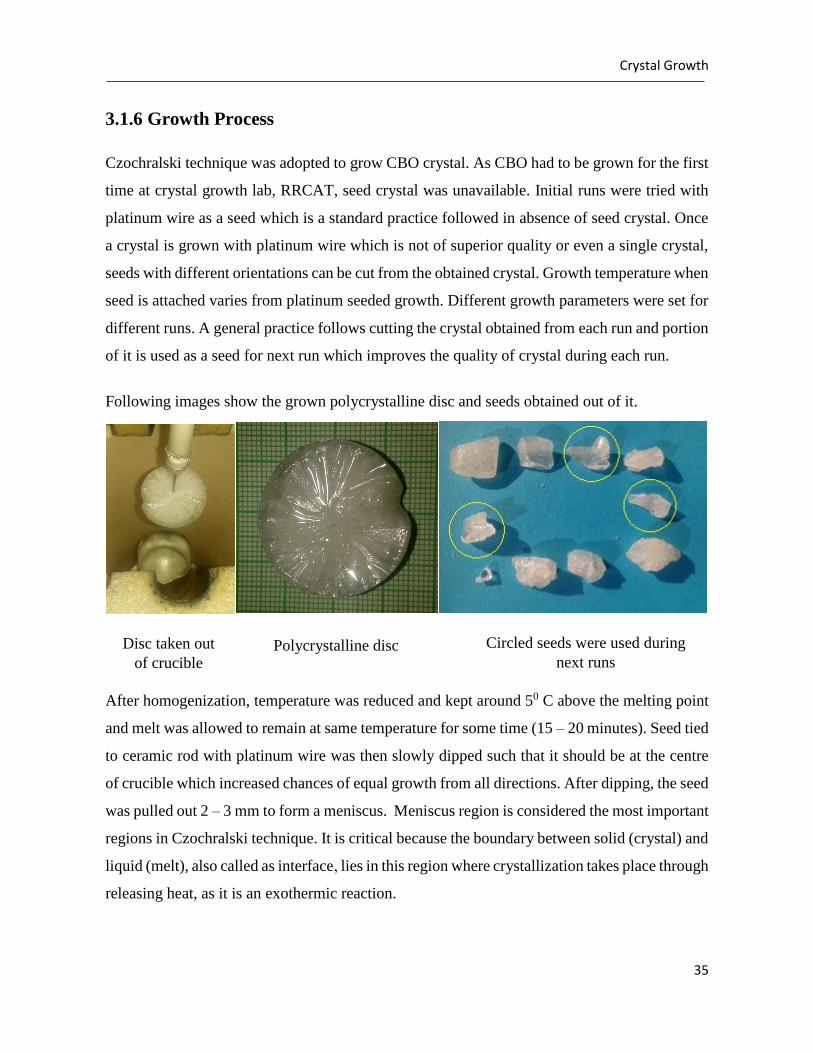
Phase diagram of 𝐶𝑠2𝑂 − 𝐵2𝑂3 system confirms congruent melting of CBO at 8350 C at 75%
mol of 𝐵2𝑂3. According to phase diagram, no other phase is formed near melting temperature.
It is important to crosscheck the phases formed in the crystal using x – ray diffraction (XRD)
technique and comparing it with JCPDS (The International Centre for Diffraction Data Sample)
database. Results were in accordance with JCPDS file number #740357 and lattice parameters
calculated using Qbasic software were in accordance with actual parameters as a = 6.2135 Å, b
= 8.5322 Å, c = 9.1841 Å and γ = β = γ = 900.
Following figure shows XRD pattern obtained from the polycrystalline disc shown earlier.
Figure 3.4 XRD pattern of CBO
Figure 3.3 Meniscus region in Czochralski technique
Crystal Growth
37
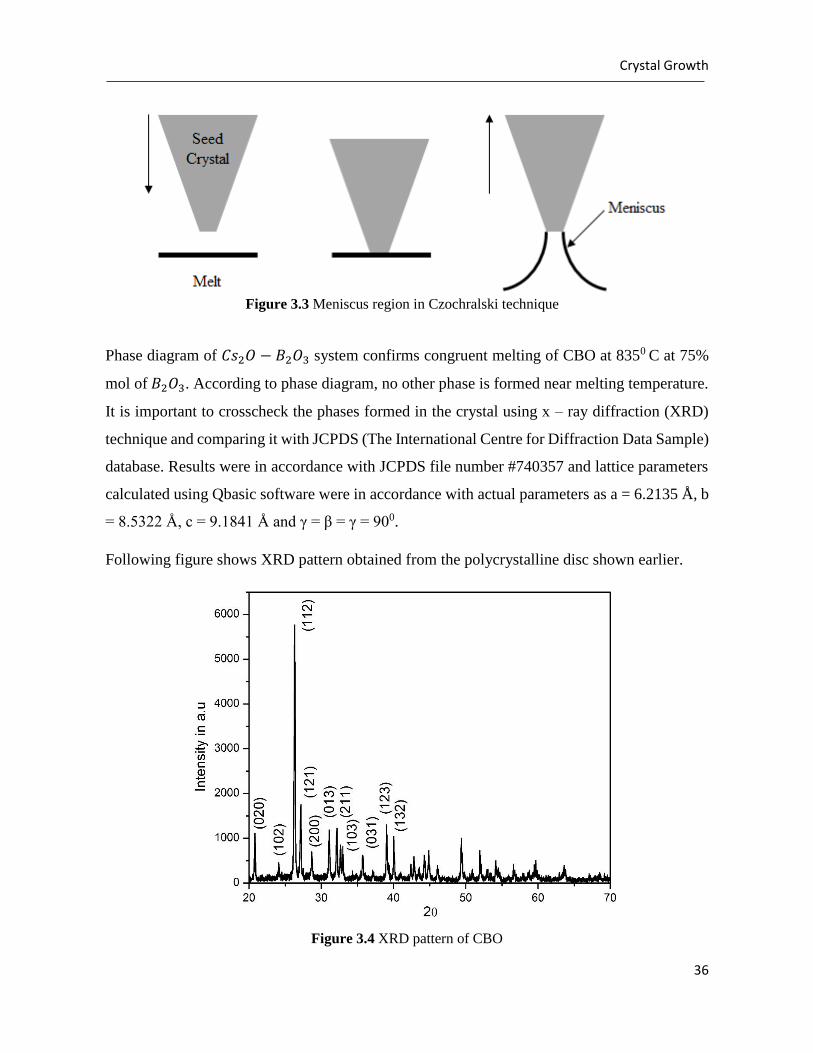
Following images show crystals obtained during various runs. Images are numbered in
increasing order of their quality in terms of transparency, facets, growth rate, etc.
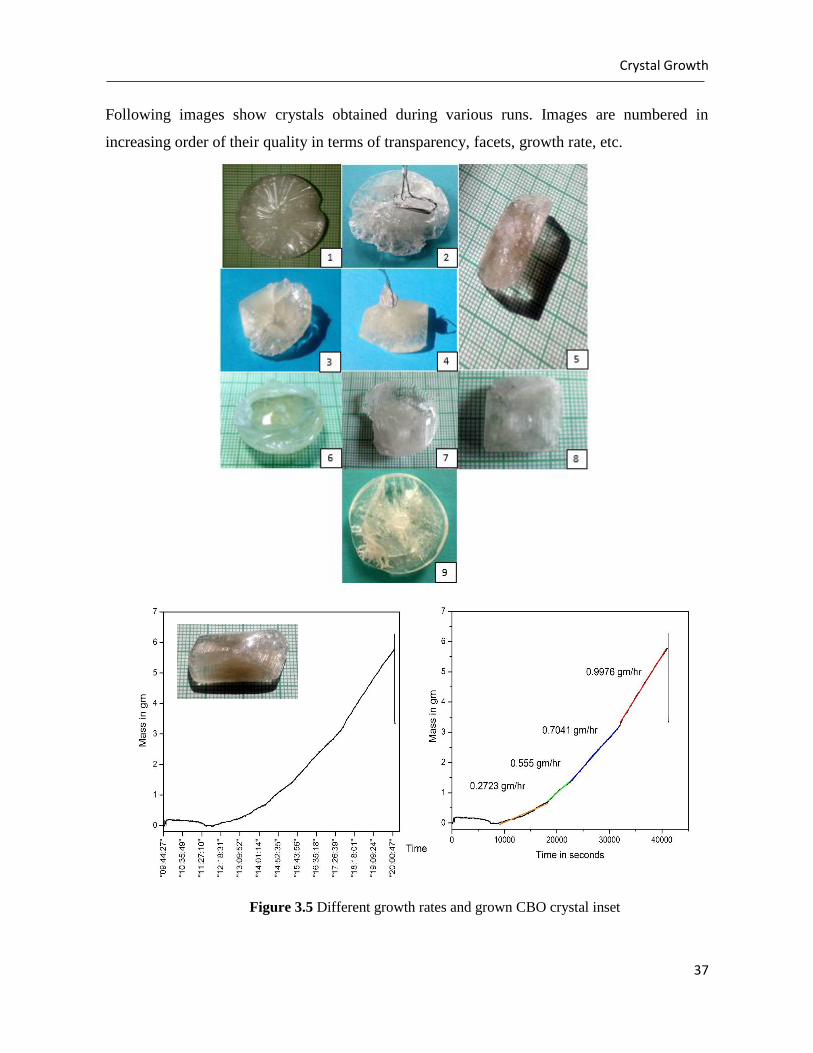
Figure 3.5 Different growth rates and grown CBO crystal inset
grown inset
Crystal Growth
38
3.2 Growth of Strontium Tetraborate (SBO)
SBO was decided to grow for the first time at crystal growth laboratory at RRCAT like CBO.
3.2.1 Charge Synthesis
Strontium tetraborate was prepared from strontium carbonate (SrCO3) and boric acid (H3BO3)
taken as reactants in purest (99.99%) form. The melting point of SBO is around 9800C. The
liquid state reaction can be given as,
𝑆𝑟𝐶𝑂3 + 4𝐻3𝐵𝑂3
∆→ 𝑆𝑟𝐵4𝑂7 + 6𝐻2𝑂 + 𝐶𝑂2 ↑
Initially, 50 gm charge was prepared and reactants were weighed accordingly. Calculations are
similar to those of CBO discussed in previous section. Synthesized charge was well mixed and
put in air tight bottle. The charge was transferred into cleaned crucible kept around 10600C in
batches and allowed to melt completely. Batch melting approach was adopted to avoid froth
formation through violent eruption of CO2 gas trapped under viscous layer of boron oxide. Once
the charge was completely transferred into crucible and allowed to melt, temperature of the
furnace was set 200C above the melting point and kept overnight to obtain homogenized melt.
3.2.2 Growth Process
The same experimental setup was used to grow CBO and then SBO crystals. Due to
unavailability of seed crystal, SBO was crystallized on platinum wire initially. Crystallization
on wire was found to be more difficult compared to CBO. Once seed crystals were obtained,
same were used for next growth runs. The procedure followed was exactly same as that of
during the growth of CBO crystal except change in temperature (~ 9850C). Rotation was kept
about 7 – 8 rpm with pulling rate of 0.2 mm/hr. After 15 hours of growth run, crystal was
detached carefully from the melt and allowed to cool slowly (200C/hr) to avoid any cracks
resulting from rapid temperature change. Growth rate is elaborated in figure 3.6.
Crystal Growth
39
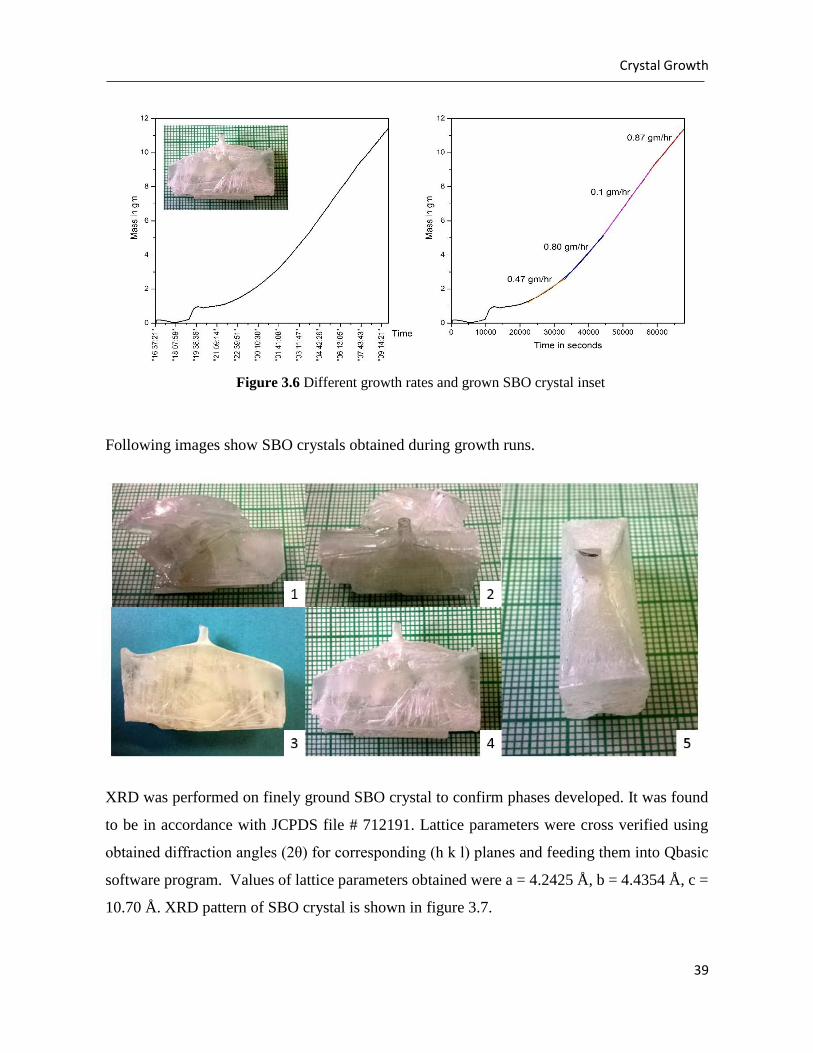
Following images show SBO crystals obtained during growth runs.
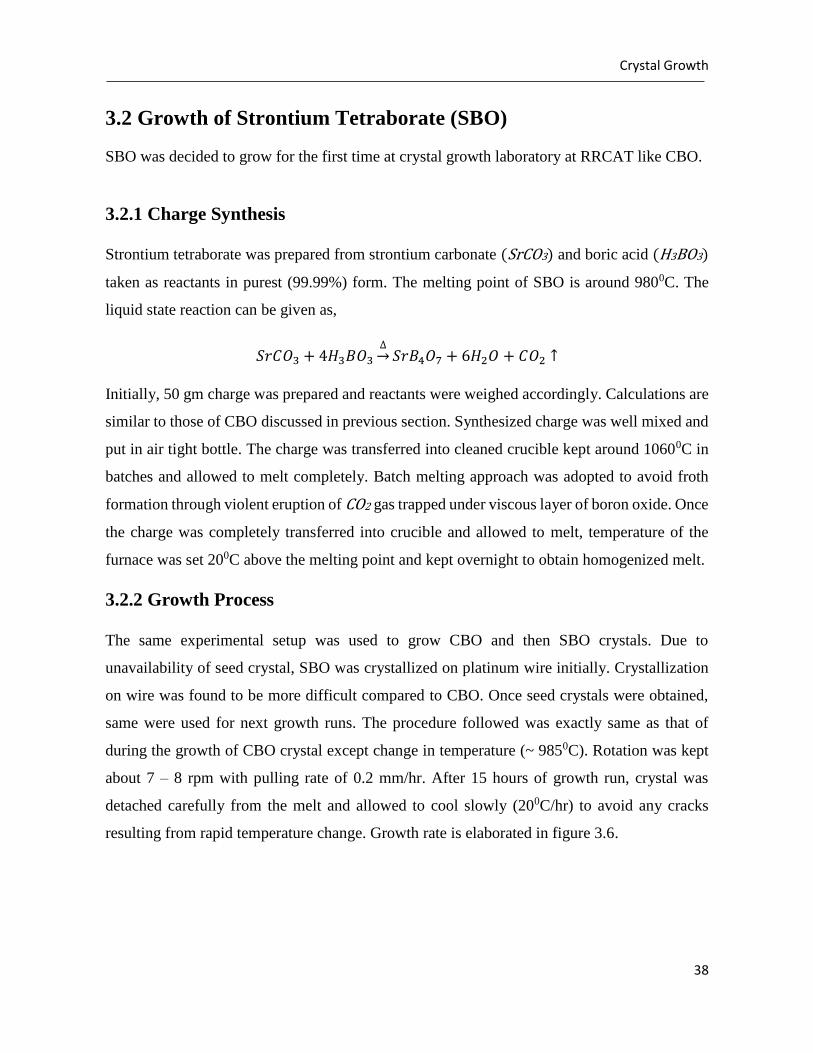
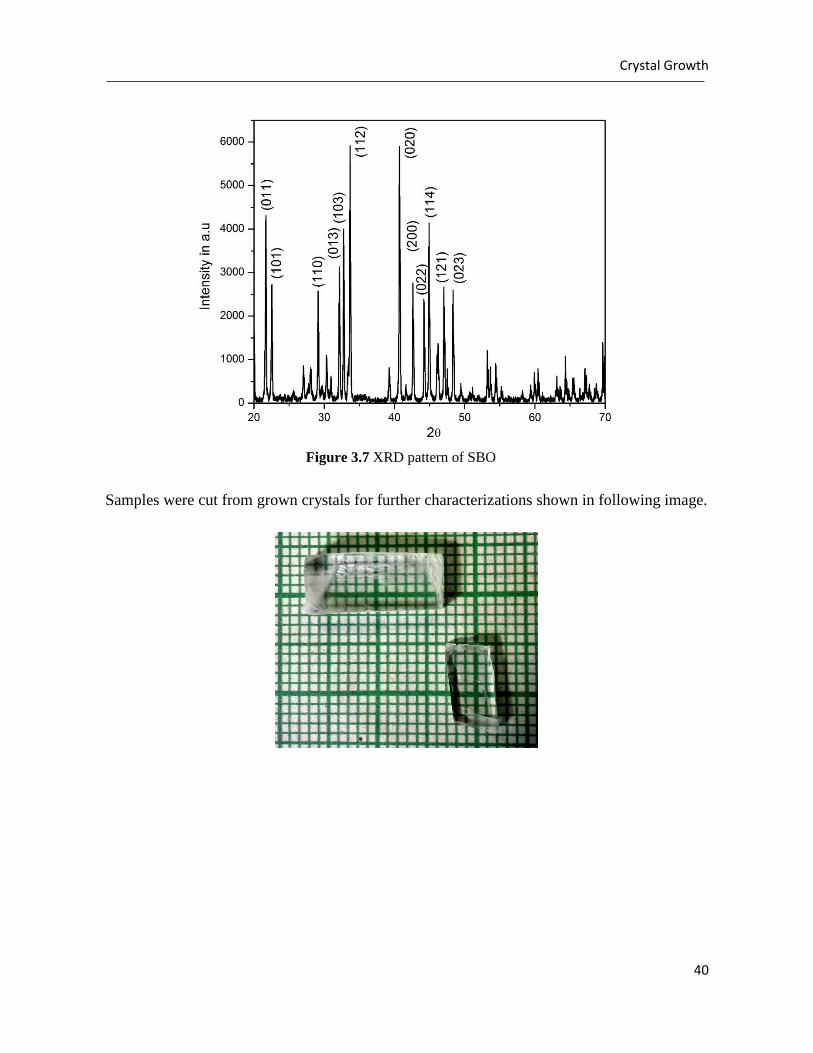
XRD was performed on finely ground SBO crystal to confirm phases developed. It was found
to be in accordance with JCPDS file # 712191. Lattice parameters were cross verified using
obtained diffraction angles (2θ) for corresponding (h k l) planes and feeding them into Qbasic
software program. Values of lattice parameters obtained were a = 4.2425 Å, b = 4.4354 Å, c =
10.70 Å. XRD pattern of SBO crystal is shown in figure 3.7.
Figure 3.6 Different growth rates and grown SBO crystal inset
Crystal Growth
40
Samples were cut from grown crystals for further characterizations shown in following image.
Figure 3.7 XRD pattern of SBO
Crystal Growth
41
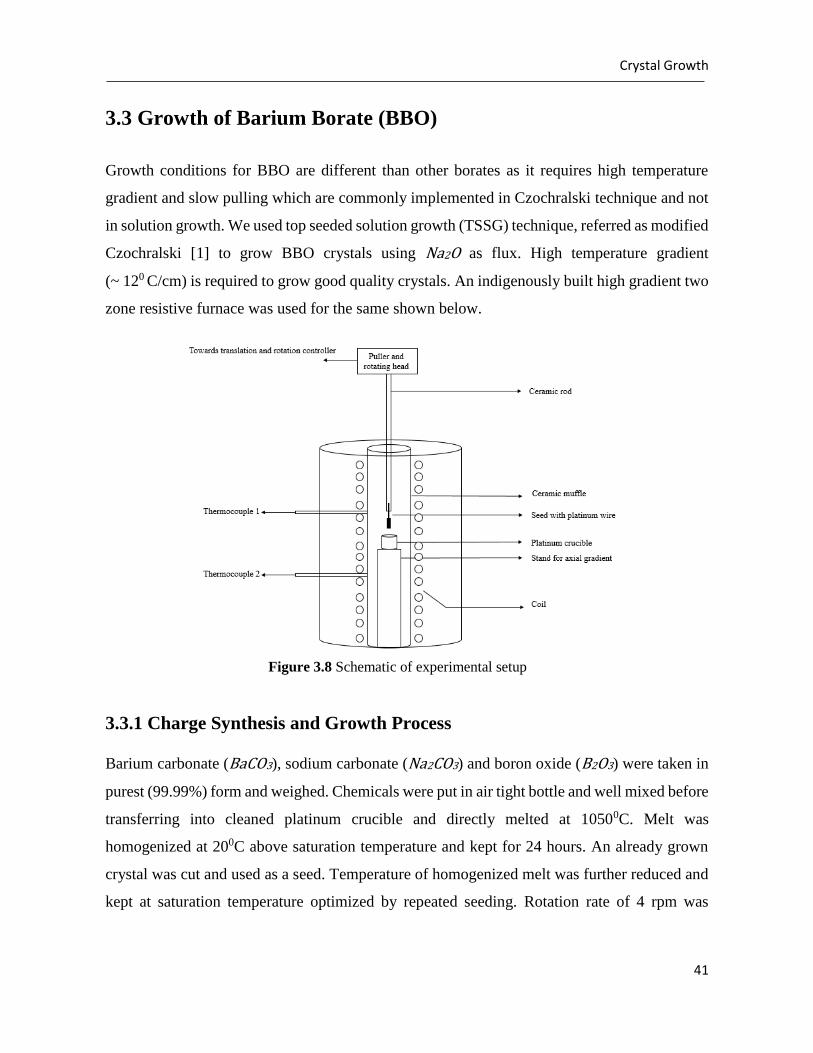
3.3 Growth of Barium Borate (BBO)
Growth conditions for BBO are different than other borates as it requires high temperature
gradient and slow pulling which are commonly implemented in Czochralski technique and not
in solution growth. We used top seeded solution growth (TSSG) technique, referred as modified
Czochralski [1] to grow BBO crystals using Na2O as flux. High temperature gradient
(~ 120 C/cm) is required to grow good quality crystals. An indigenously built high gradient two
zone resistive furnace was used for the same shown below.
3.3.1 Charge Synthesis and Growth Process
Barium carbonate (BaCO3), sodium carbonate (Na2CO3) and boron oxide (B2O3) were taken in
purest (99.99%) form and weighed. Chemicals were put in air tight bottle and well mixed before
transferring into cleaned platinum crucible and directly melted at 10500C. Melt was
homogenized at 200C above saturation temperature and kept for 24 hours. An already grown
crystal was cut and used as a seed. Temperature of homogenized melt was further reduced and
kept at saturation temperature optimized by repeated seeding. Rotation rate of 4 rpm was
Figure 3.8 Schematic of experimental setup
Crystal Growth
42
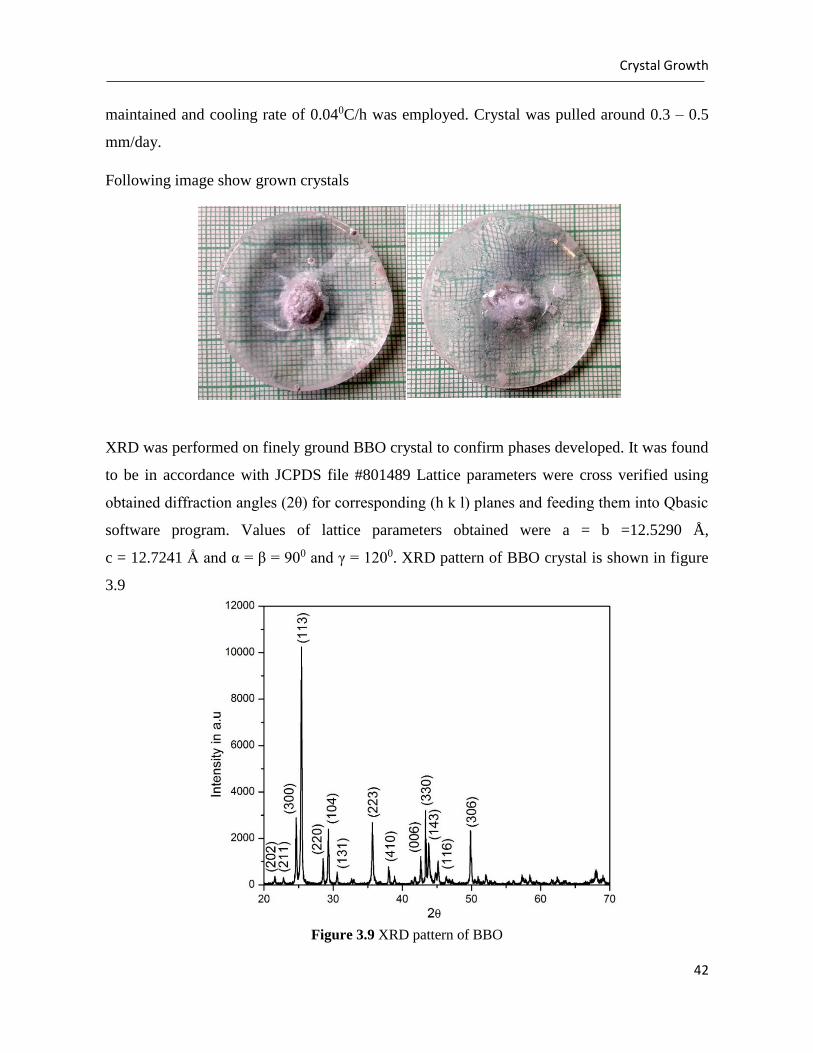
maintained and cooling rate of 0.040C/h was employed. Crystal was pulled around 0.3 – 0.5
mm/day.
Following image show grown crystals
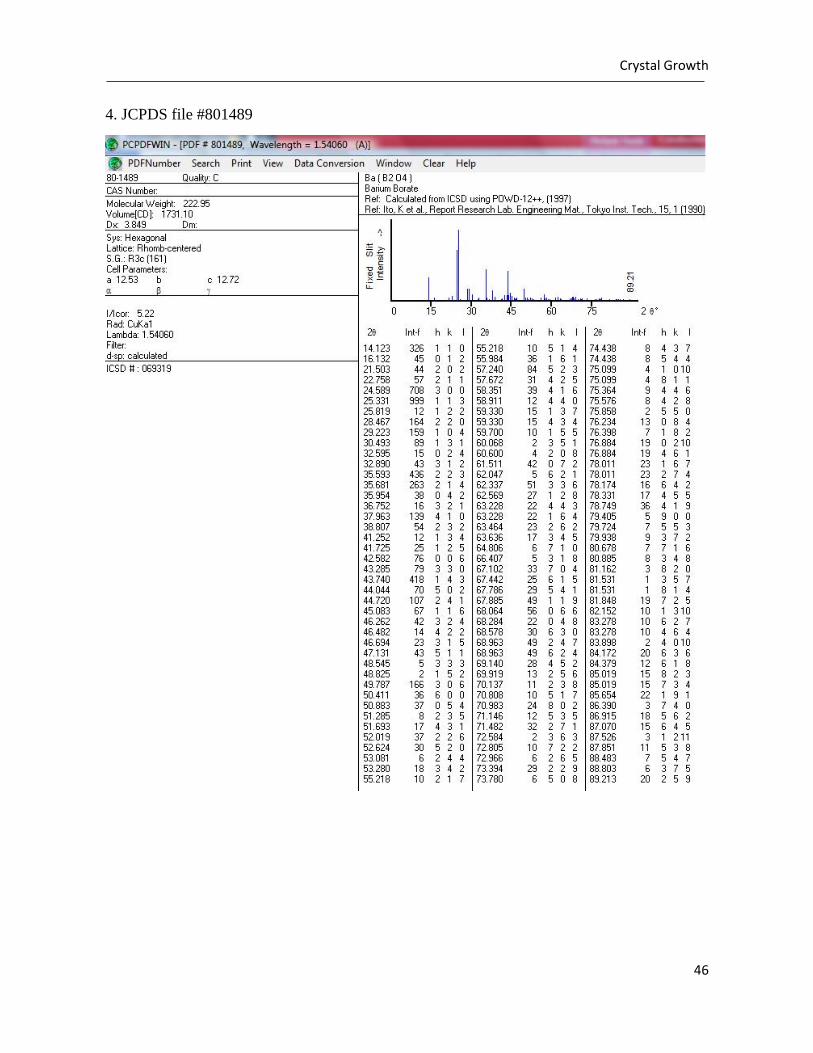
XRD was performed on finely ground BBO crystal to confirm phases developed. It was found
to be in accordance with JCPDS file #801489 Lattice parameters were cross verified using
obtained diffraction angles (2θ) for corresponding (h k l) planes and feeding them into Qbasic
software program. Values of lattice parameters obtained were a = b =12.5290 Å,
c = 12.7241 Å and α = β = 900 and γ = 1200. XRD pattern of BBO crystal is shown in figure
3.9
Figure 3.9 XRD pattern of BBO
Crystal Growth
43
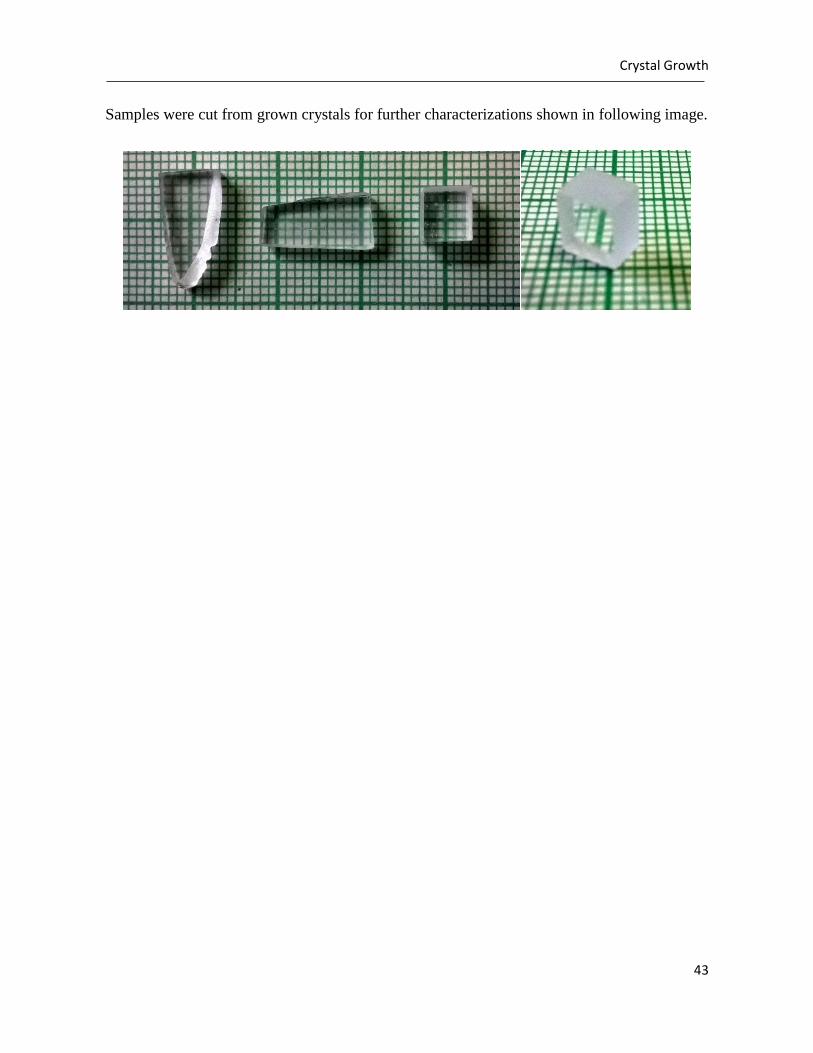
Samples were cut from grown crystals for further characterizations shown in following image.
Crystal Growth
44
References
1. Bhatt, R., Ganesamoorthy S., Bhaumik, I., Karnal, A., Wadhawan, V. (2007). Growth Rate
Anisotropy and Absorption Studies on β-BaB2O4 Single Crystals Grown by the Top-seeded
Solution Growth Technique. Optical Materials 29, 801-805.
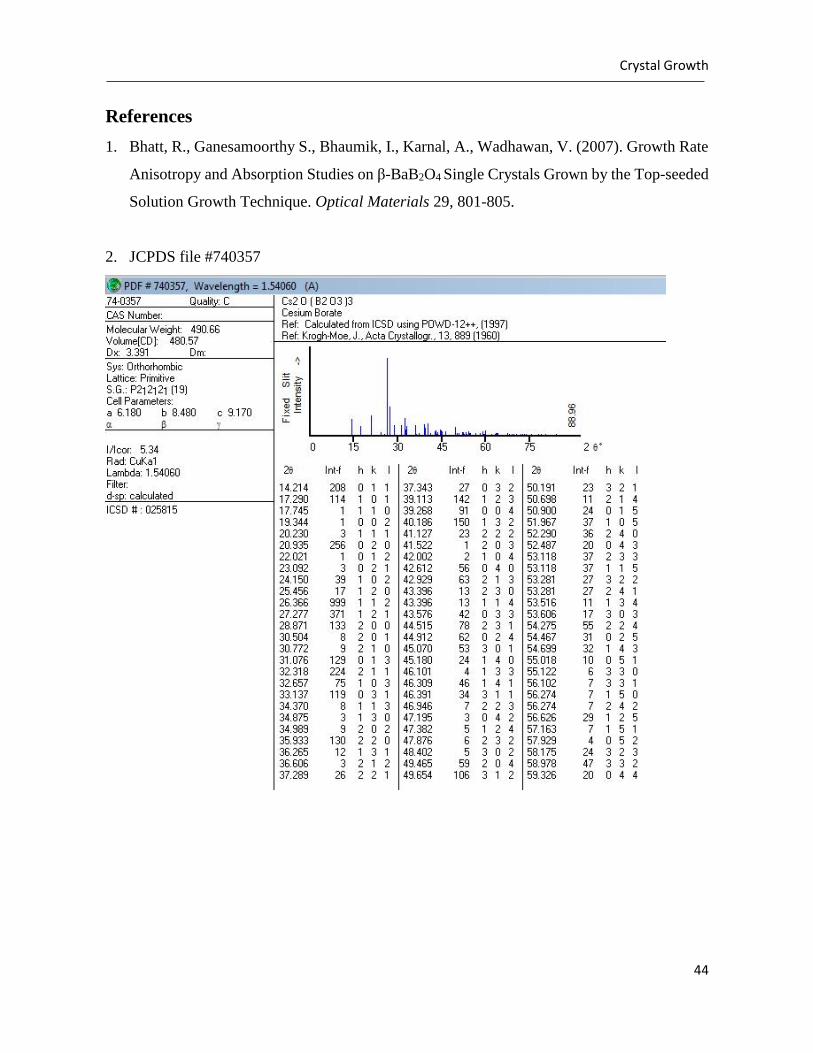
2. JCPDS file #740357
Crystal Growth
45
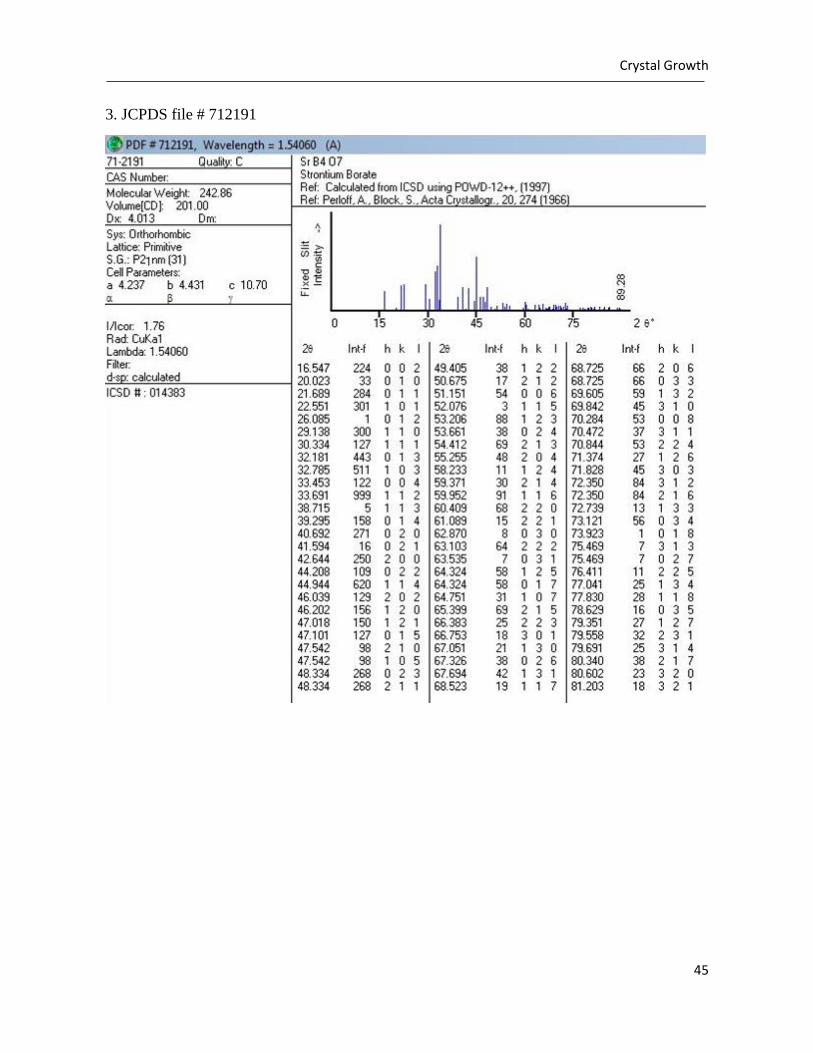
3. JCPDS file # 712191
Crystal Growth
46
4. JCPDS file #801489
Optical Characterization
47
4. OPTICAL CHARACTERIZATIONS
Optical characterizations like transmission measurement, refractive index measurement, and
study of conoscopic pattern were performed on processed samples obtained from grown
crystals. Samples were cut from the crystal, lapped and polished before measurements so as to
obtain reliable results.
4.1 Refractive Index Measurement
Refractive index of the sample measured over different wavelengths and temperature range is
useful in determining Sellmier’s coefficients as well as thermal coefficient. Calculation of
refractive index is a preliminary requirement to establish the usefulness of the crystal as a
nonlinear element in different optical and optoelectronic processes. Birefringence of the sample
can be evaluated by calculating the difference in refractive indices obtained through incidence
of orthogonally polarized laser lights.
The prism coupling technique was implemented to measure refractive index of samples. This
technique uses a prism of known refractive index (np) and sample is brought into contact using
pneumatic coupling head generally operated at pressure of five bar. Laser light is allowed to
fall on the sample through prism and reflected light is detected using a suitable detector. Light
with TE and TM polarization is used to calculate refractive indices along orthogonally polarized
directions. Basic principle used in this technique is to allow light to fall on the sample at critical
angle θc at which minimum light is reflected from the sample which results in sudden drop in
the detector output as shown in figure 4.2, referred as knee point. Refractive index can be
calculated at knee point as, 𝑛 = 𝑛𝑝𝑠𝑖𝑛𝜃𝑐.
Instrument used for refractive index measurement was a commercially available prism coupler
manufactured by Metricon Corp., UK with model 2010/M with five different laser wavelengths
407, 532, 828, 1064 and 1551 nm. High refractive index (n = 2.512) Rutile (TiO2) prism was
used for measurements.
Optical Characterization
48
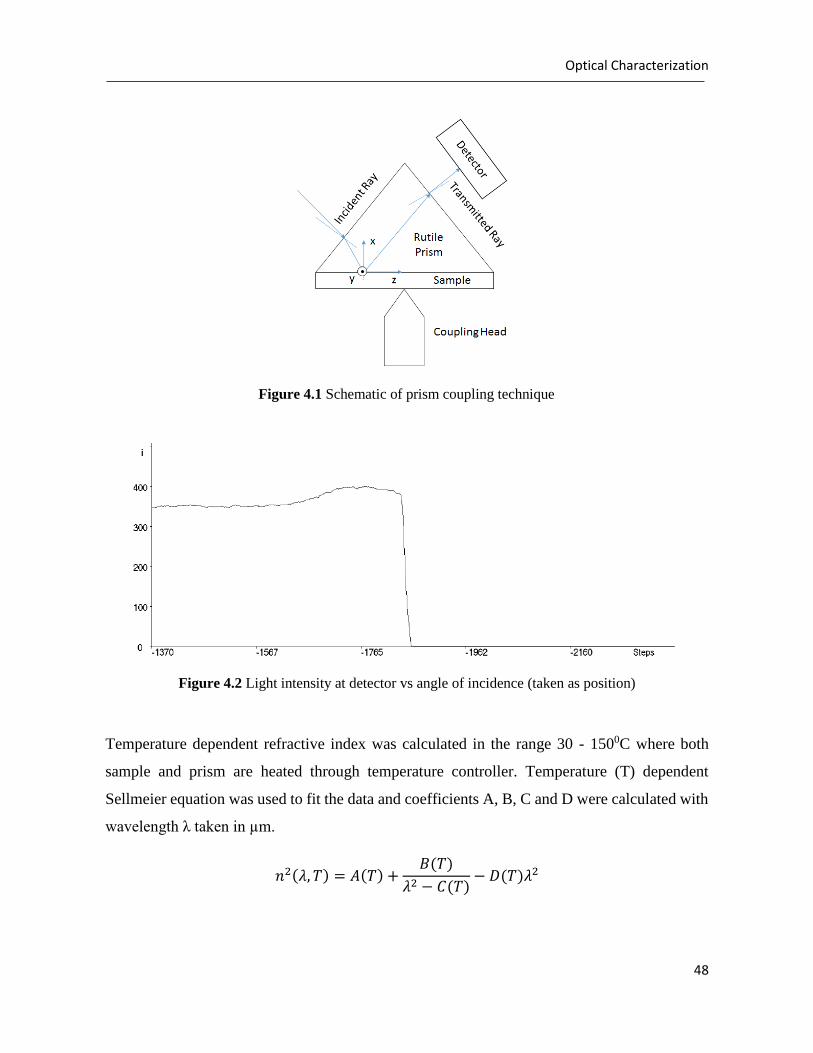
Figure 4.2 Light intensity at detector vs angle of incidence (taken as position)
Temperature dependent refractive index was calculated in the range 30 - 1500C where both
sample and prism are heated through temperature controller. Temperature (T) dependent
Sellmeier equation was used to fit the data and coefficients A, B, C and D were calculated with
wavelength λ taken in µm.
𝑛2(𝜆, 𝑇) = 𝐴(𝑇) +𝐵(𝑇)
𝜆2 − 𝐶(𝑇)− 𝐷(𝑇)𝜆2
Figure 4.1 Schematic of prism coupling technique
Optical Characterization
49
(a) (b)
(c)
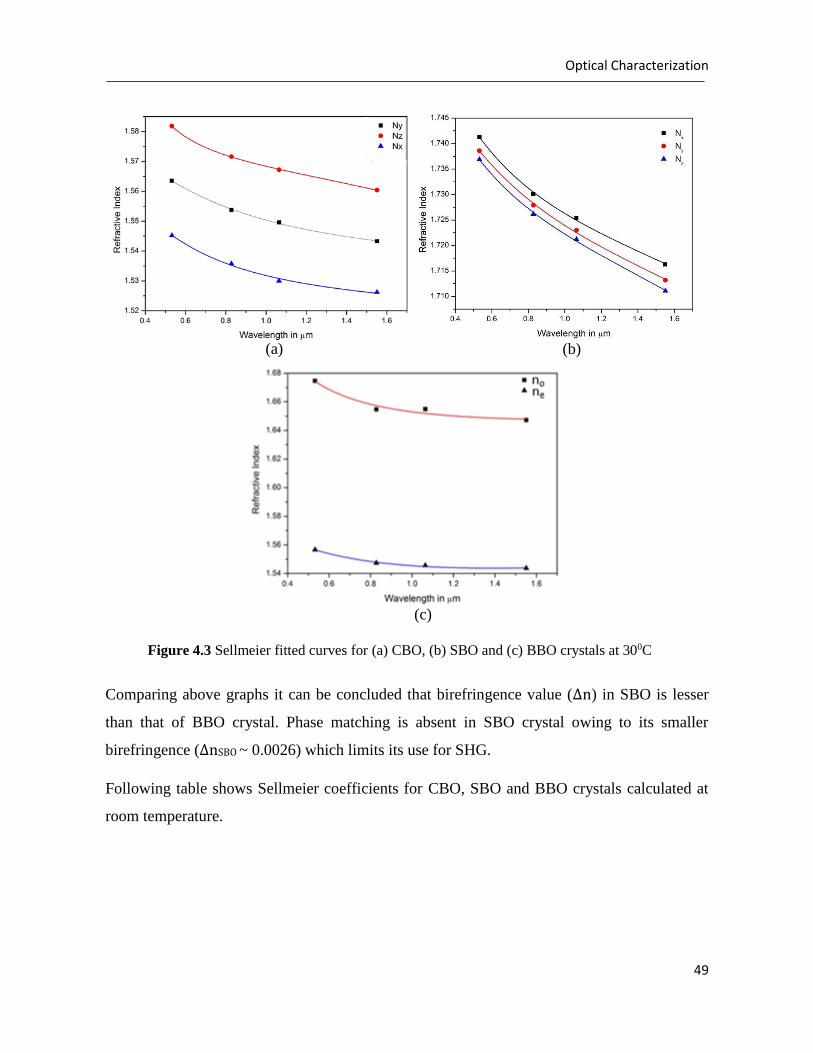
Comparing above graphs it can be concluded that birefringence value (Δn) in SBO is lesser
than that of BBO crystal. Phase matching is absent in SBO crystal owing to its smaller
birefringence (ΔnSBO ~ 0.0026) which limits its use for SHG.
Following table shows Sellmeier coefficients for CBO, SBO and BBO crystals calculated at
room temperature.
Figure 4.3 Sellmeier fitted curves for (a) CBO, (b) SBO and (c) BBO crystals at 300C
Optical Characterization
50
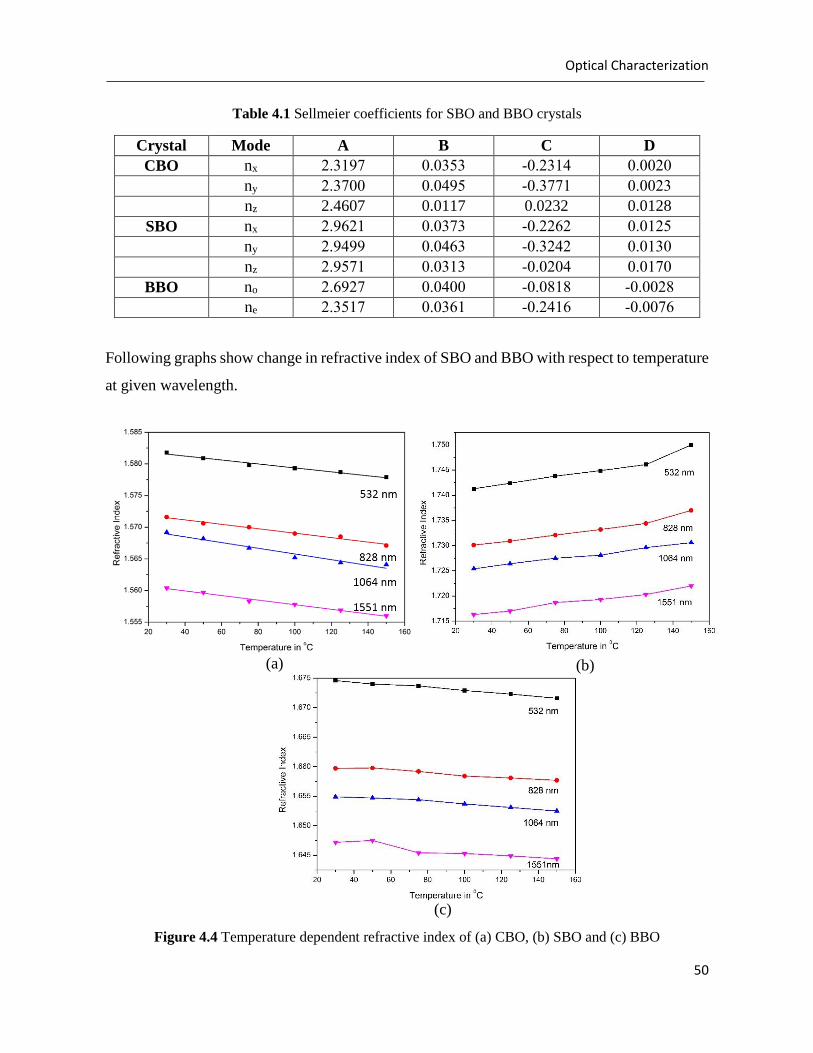
Table 4.1 Sellmeier coefficients for SBO and BBO crystals
Crystal Mode A B C D
CBO nx 2.3197 0.0353 -0.2314 0.0020
ny 2.3700 0.0495 -0.3771 0.0023
nz 2.4607 0.0117 0.0232 0.0128
SBO nx 2.9621 0.0373 -0.2262 0.0125
ny 2.9499 0.0463 -0.3242 0.0130
nz 2.9571 0.0313 -0.0204 0.0170
BBO no 2.6927 0.0400 -0.0818 -0.0028
ne 2.3517 0.0361 -0.2416 -0.0076
Following graphs show change in refractive index of SBO and BBO with respect to temperature
at given wavelength.
(a)
Figure 4.4 Temperature dependent refractive index of (a) CBO, (b) SBO and (c) BBO
crystals
(b)
(c)
Optical Characterization
51
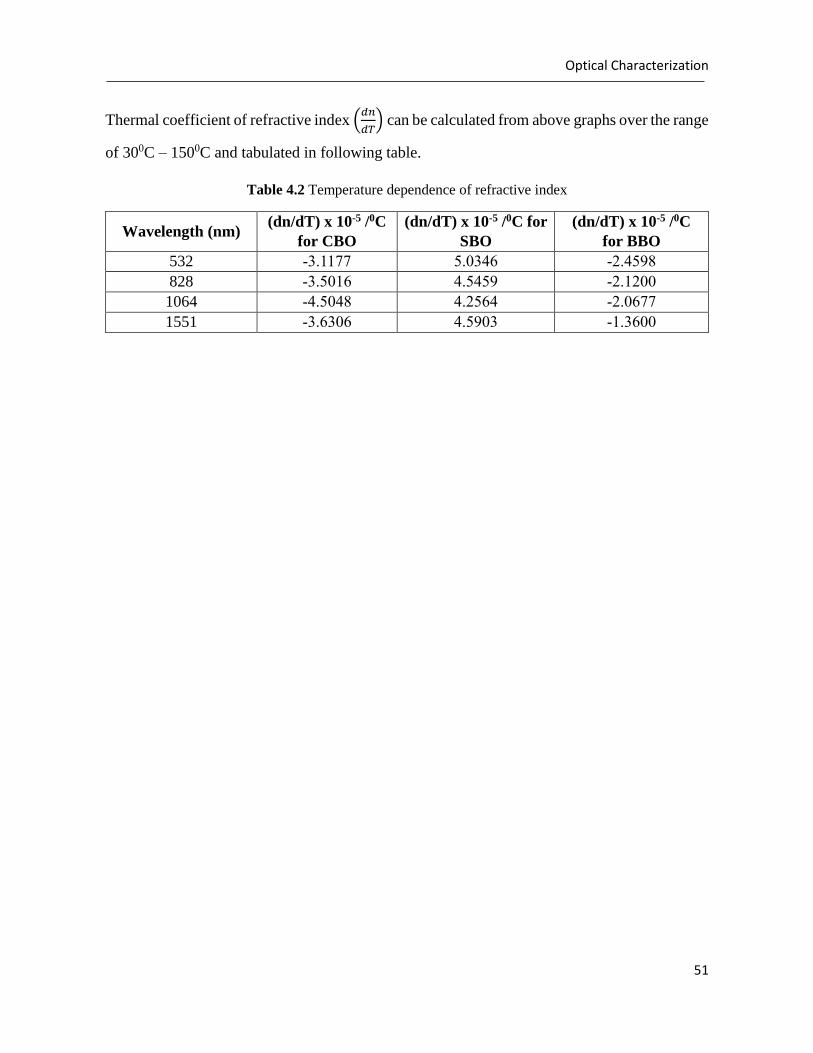
Thermal coefficient of refractive index (𝑑𝑛
𝑑𝑇) can be calculated from above graphs over the range
of 300C – 1500C and tabulated in following table.
Table 4.2 Temperature dependence of refractive index
Wavelength (nm) (dn/dT) x 10-5 /0C
for CBO
(dn/dT) x 10-5 /0C for
SBO
(dn/dT) x 10-5 /0C
for BBO
532 -3.1177 5.0346 -2.4598
828 -3.5016 4.5459 -2.1200
1064 -4.5048 4.2564 -2.0677
1551 -3.6306 4.5903 -1.3600
Optical Characterization
52
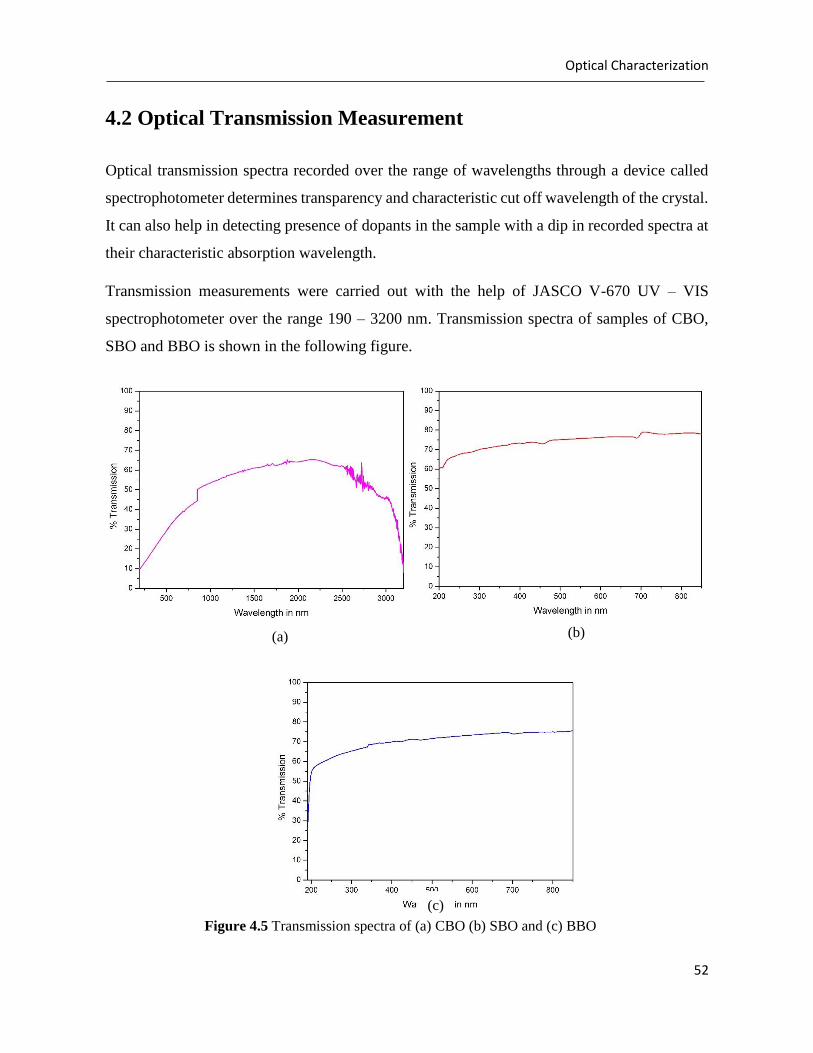
4.2 Optical Transmission Measurement
Optical transmission spectra recorded over the range of wavelengths through a device called
spectrophotometer determines transparency and characteristic cut off wavelength of the crystal.
It can also help in detecting presence of dopants in the sample with a dip in recorded spectra at
their characteristic absorption wavelength.
Transmission measurements were carried out with the help of JASCO V-670 UV – VIS
spectrophotometer over the range 190 – 3200 nm. Transmission spectra of samples of CBO,
SBO and BBO is shown in the following figure.
(a) (b)
(c)
Figure 4.5 Transmission spectra of (a) CBO (b) SBO and (c) BBO
Optical Characterization
53
Inclusions throughout the crystal resulted in poor transparecy for CBO as compared to that of
SBO and BBO. Transparency in CBO signifacnatly reduced towards low wavelength regions
as scattering becomes dominant.
Transmission spectra alongwith refractive index data are useful to determine absorption
coefficient for the material as well as bandgap energy. Absorption coefiicient (α) can be
calculated as,
𝛼 =1
𝑑𝑙𝑛 [
(1 − 𝑅)2
𝑇]
where d is the thickness of sample, T is transmittance and R is reflectivity of the sample
calculated from refractive index data and Sellmeier’s equation as,
𝑅 = (𝑛 − 1
𝑛 + 1)
2
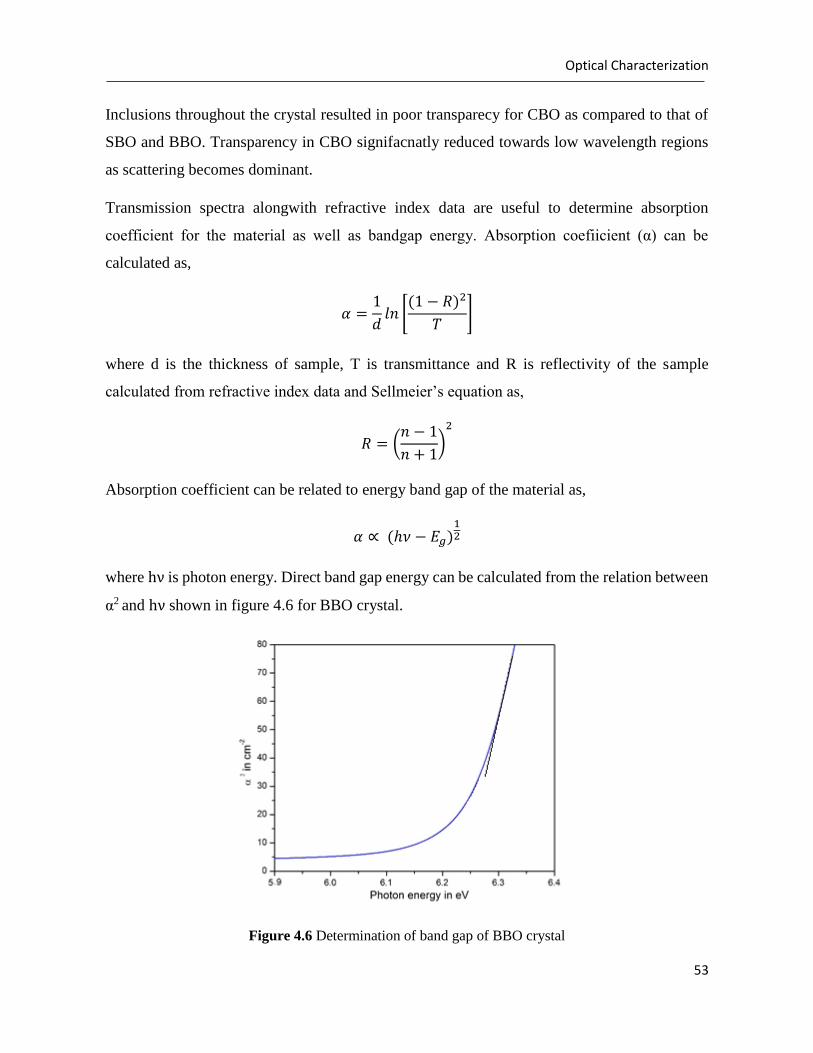
Absorption coefficient can be related to energy band gap of the material as,
𝛼 ∝ (ℎ𝜈 − 𝐸𝑔)12
where hν is photon energy. Direct band gap energy can be calculated from the relation between
α2 and hν shown in figure 4.6 for BBO crystal.
Figure 4.6 Determination of band gap of BBO crystal
Optical Characterization
54
From the above graph, band gap energy can be calculated as 6.2610 eV which is in well
accordance with reported value of 6.28 eV by Cheng et al. [1]. Abrupt rise in α2 with respect to
photon energy is result of photon absorption. Intercept of this line on energy axis which
necessarily means zero absorption, thus give value of energy band gap of the material. In case
of CBO, significant absorption was observed from visible range of spectra which was the result
of sample with inclusions. It was not possible to calculate energy band gap for SBO as it did
not exhibit significant absorption till 190 nm.
4.3 Study of Conoscopic Pattern
Conoscopy is an optical technique for a transparent specimen to make observations in a cone
of converging rays of light. For conoscopic observations and measurements a conoscope is
used. When diverging light rays travel through an anisotropic substance a conoscopic
interference pattern, a pattern of rings caused by optical interference, is observed. For uniaxial
crystal a plate if cut perpendicular to the optic axis, the pattern is in the form of concentric rings.
The shape and symmetry of the conoscopy pattern reveals the information about homogeneity
and strain in the crystal. Here to ascertain the quality of the grown crystals, a conoscopic study
was performed on a c-cut plate of BBO using an Olympus polarizing microscope in the
transmission mode.
Polarizing microscope consists of both a polarizer and an analyzer. A polarizer is positioned in
the light path somewhere before the specimen while an analyzer (a second polarizer) is placed
in the optical pathway between the objective rear aperture and the observation tubes or camera
port as shown in figure 4.6. The interaction of plane-polarized light with a birefrengent
specimen gives rise to image contrast to produce two individual wave components which are
polarized in mutually perpendicular planes. These components are termed the ordinary and the
extraordinary wave fronts whose velocities are different and vary with the propagation through
the specimen after which the light components are out of phase then pass through the analyzer
where they recombines with constructive and destructive interference.
Optical Characterization
55
Figure 4.7 Conscopy pattern of c-cut BBO sample
Concentric rings are evident for uniaxiality of the material and uniformity of rings account for
homogeneity of the sample. Conoscopic pattern for SBO could not be obtained as the
birefringence is very less.
References
1. Cheng, W., Huang, J., Lu, J. (1998). Electronic Structures and Nonlinear Optical
Coefficients of β-BaB2O4. Physical Review 57, 1527.
Results and Discussion
56
5. RESULTS AND DISCUSSION
Top seeded solution growth (TSSG) with self-flux (excess 𝐶𝑠2𝑂) or other suitable fluxes like
𝑁𝑎𝐹, 𝑉2𝑂5, 𝑀𝑜𝑂3 is the most preferred technique to grow CBO crystal [1]. First single crystal
of CBO was grown by Kyropoulos technique [2]. Growth of CBO using stoichiometric melt
involving Czochralski technique is considered difficult due to highly viscous 𝐵2𝑂3 and volatile
𝐶𝑠2𝑂 [1, 3]. A single paper is reported on growth of CBO using Czochralski technique [4] and
a conference paper [5], both reports describe the same CBO crystal having 20 mm diameter and
30 mm height at pulling rate of 8 mm/day at 600 C/cm gradient.
We opted to grow CBO crystal with Czochralski technique using a resistive furnace with an
indigenously built system at crystal growth lab, RRCAT. One of the major limitations working
with single zone resistive furnace was unavailability of getting high temperature gradient inside.
We could get 100 C/cm gradient with current setup after reaching certain height.
During initial runs when growth temperature was not optimised and platinum wire was used as
a seed, polycrystalline discs were obtained as result of fast and uncontrolled growth. Difficulty
was faced to nucleate and grow CBO using platinum wire, similar to CLBO [6]. Seeds were
melted during couple of runs due to low temperature gradient. After increasing the stand height
inside furnace, the problem of seed melting was rectified. Even high temperature gradient could
not solve problem of faster growth which most of times caused detachment of grown crystal
from the seed by hitting crucible wall. To deal with this problem, platinum crucible was placed
inside Zirconium crucible (melting point 18520 C) to obtain radial gradient but this resulted in
raising furnace temperature to reach optimum growth temperature.
Even after several runs continued for seven months we could not obtain good quality, inclusion
free single crystal of CBO.
Results and Discussion
57
BBO crystal was grown with well known Na2O flux with top seeded solution growth technique
discussed by Bhatt et al.[7]. Each run continued for 19 – 20 days and transparent single crystals
were obtained which were used for further characterization.
SBO crystal without having significance birefringence and SHG capabilities, was decided to
grow as it was primary attempt to obtain single crystal of SBO like CBO at RRCAT. Its
potential uses are still being investigated. One of the major applications being discussed is its
use as waveguide with lead tetraborate (LBO) due to large difference in refractive index [8].
SBO crystal was successfully grown and its thermal coefficient of refractive index was
calculated for the first time. It was observed that thermal coefficient of refractive index for SBO
was positive unlike most of the other borate materials.
Absorption studies could be performed only on BBO crystal as lower cut off wavelength for
the spectrophotometer used was 190 nm. Bandgap of BBO was calculated and found well in
accordance with the literature.
References
1. Chen, C., Sasaki, T., Li, R., Wu, Y., Lin, Z., Mori, Y., Hu, Z., Wang, J., Uda, S., Yoshimura,
M., & Kaneda, Y. (2012). Nonlinear Optical Borate Crystals Principles and Applications.
Wiley-VCH Verlag & Co. KGaA.
2. Kagebayashi, Y., Mori, Y., & Sasaki, T. (1999). Crystal Growth of Cesium Triborate
CsB3O5 by Kyropoulos Technique. Bull. Matter. Sci., 22(6), 971-973.
3. Saji, T., Hisaminato, N., Nishioka, M., Yoshimura, M., Mori, Y., & Sasaki, T. (2005).
Growth of Nonlinear Optical Crystal CsB3O5 from Self-Flux Solution. Journal of Crystal
Growth, 274, 183-190.
4. Fu, F., Wang, J., Hu, Z., Wu, Y., Yin, S., & Xu, Z. (1997). Growth and Properties of
Ultraviolet Nonlinear Optical Crystal Cesium Triborate.
5. Wu, Y. (1997). Crystal Growth and Nonlinear Optical Properties of Cesium Triborate. In
T. Sasaki (Ed.), Proceedings of International Symposium on Laser and Nonlinear Optical
Materials, (pp. 120-125). Singapore.
6. Karnal, A., Bhaumik, I., Ganesamoorthy, S., Bhatt, R., Saxena, A., Wadhawan, V., & Bhat,
H. (2007). Growth and Calorimetric Measurements on CsLiB6O10. Materials Letters, 61,
600-604.
Results and Discussion
58
7. Bhatt, R., Ganesamoorthy S., Bhaumik, I., Karnal, A., Wadhawan, V. (2007). Growth Rate
Anisotropy and Absorption Studies on β-BaB2O4 Single Crystals Grown by the Top-seeded
Solution Growth Technique. Optical Materials 29, 801-805.
8. Oseledchik, Yu., Prosvirnin, A., Pisarevskiy, A., Starshenko, V., Osadchuk, V., Osadchuk,
V., Belokrys, S., Svitanko, N., Korol, A., Krikunov, S., Selevich, T. (1995). New Nonlinear
Optical Crystals: Strontium and Lead Tetraborates. Optical Materials, 4, 669-674.
Conclusions and Future Scope
59
6. CONCLUSIONS & FUTURE SCOPE
Basics of crystals and different crystal growth techniques like melt growth (Czochralski,
Optical floating zone) and high temperature solution growth or flux growth were studied.
Single crystals of CBO, SBO and BBO were grown and characterized.
Good quality and inclusion free crystals of CBO were not obtained due to low temperature
gradient in the furnace.
Thermal coefficient of SBO was determined for the first time and found to be negative. It was
accounted for dominant polarizability over density changes with respect to temperature.
Growth of good quality CBO crystal implementing Czochralski technique can be taken up as
future work.
SBO crystals can be grown with suitable dopants and changes in its properties like refractive
index, thermoluminescence can be studied.
SBO grown over PBO substrate can be investigated as potential waveguide application.