Leading Chinese e-Business Brands as Key Elements for the Future of Chinese Economy
GrowinG brands by understandinG what Chinese shoppers really do
China Shopper Report 2013, Vol. 2

Copyright © 2013 Bain & Company, Inc. and Kantar WorldpanelAll rights reserved.
Growing brands by understanding what Chinese shoppers really do, Vol. 2 | Bain & Company, Inc. | Kantar Worldpanel
Page 1
Contents
1. Introduction . . . . . . . . . . . . . . . . . . . . . . . . . . . . . . . . . . . . . . . . . . . . . pg. 3
2. China’s evolving market . . . . . . . . . . . . . . . . . . . . . . . . . . . . . . . . . . . . . pg. 3
3. The state of competition between foreign and Chinese brands . . . . . . . . . . pg. 10
4. Implications . . . . . . . . . . . . . . . . . . . . . . . . . . . . . . . . . . . . . . . . . . . . pg. 14
During the past two decades, a steady stream of foreign brands has entered the Chinese market and achieved impressive growth. Competition between foreign and local players has never been as fierce as it is today. This volume of the China Shopper Report 2013 explores how the battle for Chinese shoppers has intensified in a changing environment that features slower rates of growth as well as rapid adoption of e-commerce. The insights will help both types of competitors capture their share of China’s growth.
Growing brands by understanding what Chinese shoppers really do, Vol. 2 | Bain & Company, Inc. | Kantar Worldpanel
Page 3
*Data for infant formula and baby diapers from Kantar Baby Panel Note: Data was drawn from mainland China, excluding Hong Kong, Macau and Taiwan. Sources: Kantar Worldpanel; Bain & Company analysis
Non-food & beverage
Home care
Non-food & beverageCreated packagedfood & beverage
Packagedfood
Personal careBeverage
Traditional packagedfood & beverage
Packagedfood
Beverage
Juice
Beer
Ready-to-drink(RTD) tea
Bottled water
Candy
Biscuits
Instant noodles
Carbonatedsoft drink
(CSD)
Milk
Yogurt
Chewinggum
Chocolate
Infantforumula*
Colorcosmetics
Skin care
Personalwash
Shampoo
Hairconditioner
Baby diapers*
Toothbrush
Toothpaste Kitchen cleaner
Facial tissue
Toilet tissue
Fabric detergent
Fabricsoftener
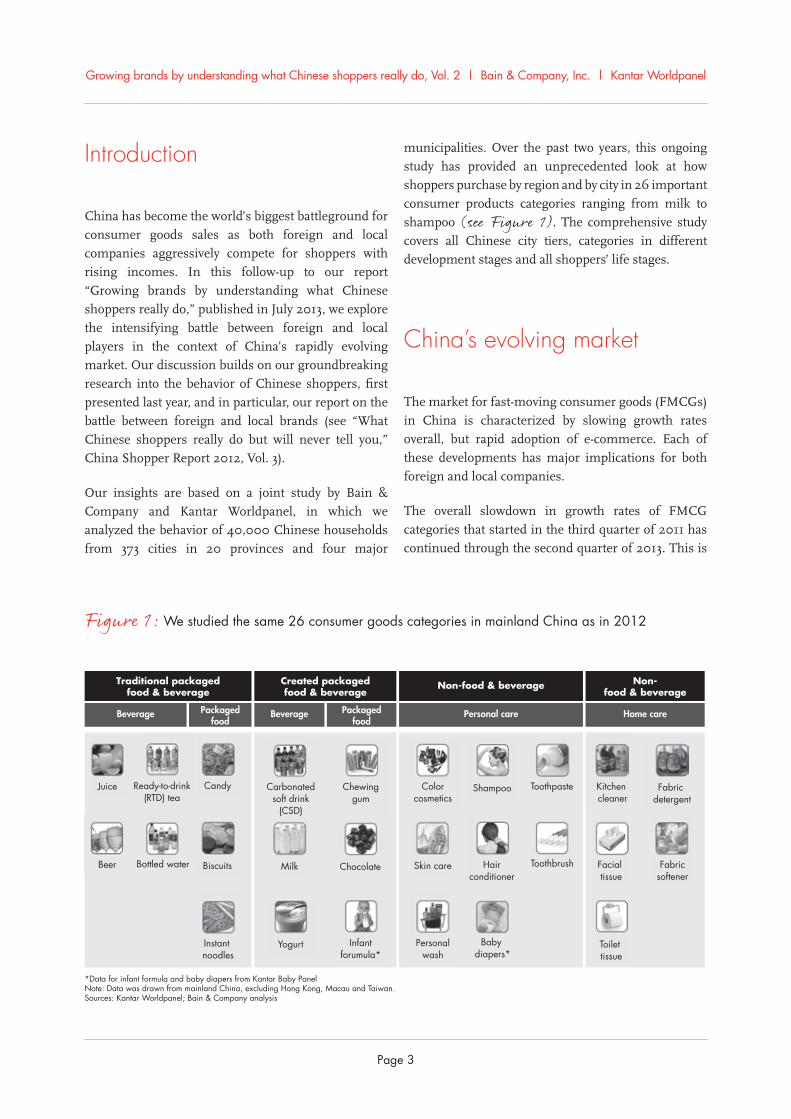
municipalities. Over the past two years, this ongoing study has provided an unprecedented look at how shoppers purchase by region and by city in 26 important consumer products categories ranging from milk to shampoo (see Figure 1). The comprehensive study covers all Chinese city tiers, categories in different development stages and all shoppers’ life stages.
China’s evolving market
The market for fast-moving consumer goods (FMCGs) in China is characterized by slowing growth rates overall, but rapid adoption of e-commerce. Each of these developments has major implications for both foreign and local companies.
The overall slowdown in growth rates of FMCG categories that started in the third quarter of 2011 has continued through the second quarter of 2013. This is
introduction
China has become the world’s biggest battleground for consumer goods sales as both foreign and local companies aggressively compete for shoppers with rising incomes. In this follow-up to our report “Growing brands by understanding what Chinese shoppers really do,” published in July 2013, we explore the intensifying battle between foreign and local players in the context of China’s rapidly evolving market. Our discussion builds on our groundbreaking research into the behavior of Chinese shoppers, first presented last year, and in particular, our report on the battle between foreign and local brands (see “What Chinese shoppers really do but will never tell you,” China Shopper Report 2012, Vol. 3).
Our insights are based on a joint study by Bain & Company and Kantar Worldpanel, in which we analyzed the behavior of 40,000 Chinese households from 373 cities in 20 provinces and four major
Figure 1: We studied the same 26 consumer goods categories in mainland China as in 2012
Growing brands by understanding what Chinese shoppers really do, Vol. 2 | Bain & Company, Inc. | Kantar Worldpanel
Page 4
1 The patterns we observed are consistent with the theories developed by Professor Andrew Ehrenberg in the late 1950s and have been demonstrated to hold true in a broad variety of categories and markets. These patterns are currently being further studied and refined by the Ehrenberg-Bass Institute for Marketing Science.
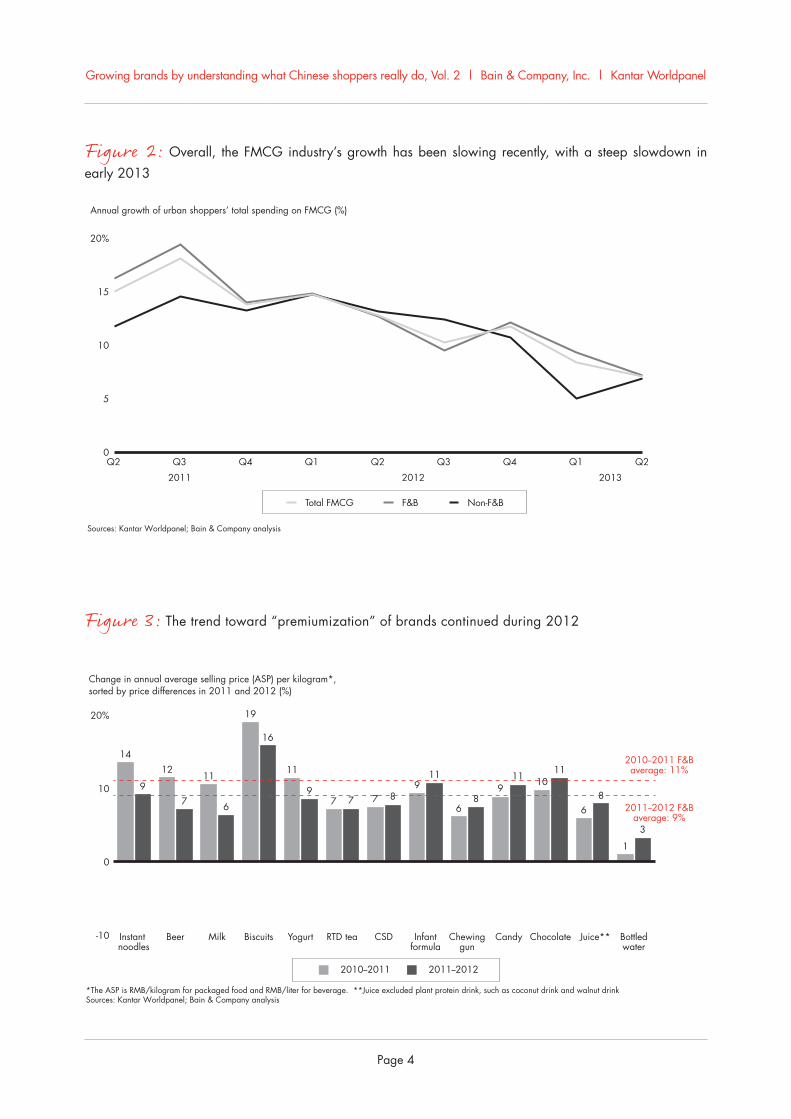
Figure 2: Overall, the FMCG industry’s growth has been slowing recently, with a steep slowdown in early 2013
Figure 3: The trend toward “premiumization” of brands continued during 2012
Sources: Kantar Worldpanel; Bain & Company analysis
Annual growth of urban shoppers’ total spending on FMCG (%)
Total FMCG F&B Non-F&B
20%
15
10
0
5
2011 2012 2013
Q2 Q3 Q4 Q1 Q2 Q3 Q4 Q1 Q2
Change in annual average selling price (ASP) per kilogram*,sorted by price differences in 2011 and 2012 (%)
*The ASP is RMB/kilogram for packaged food and RMB/liter for beverage. **Juice excluded plant protein drink, such as coconut drink and walnut drinkSources: Kantar Worldpanel; Bain & Company analysis
9
1412
7
Instant noodles
Beer Milk Biscuits Yogurt RTD tea CSD Infantformula
Chewinggun
Candy Chocolate Juice** Bottledwater
11
6
19
16
11
97 7 7 8
911
68
911 10
11
68
1
3
2011--2012 F&Baverage: 9%
2010--2011 F&Baverage: 11%
2010--2011 2011--2012
20%
10
0
-10
Growing brands by understanding what Chinese shoppers really do, Vol. 2 | Bain & Company, Inc. | Kantar Worldpanel
Page 5
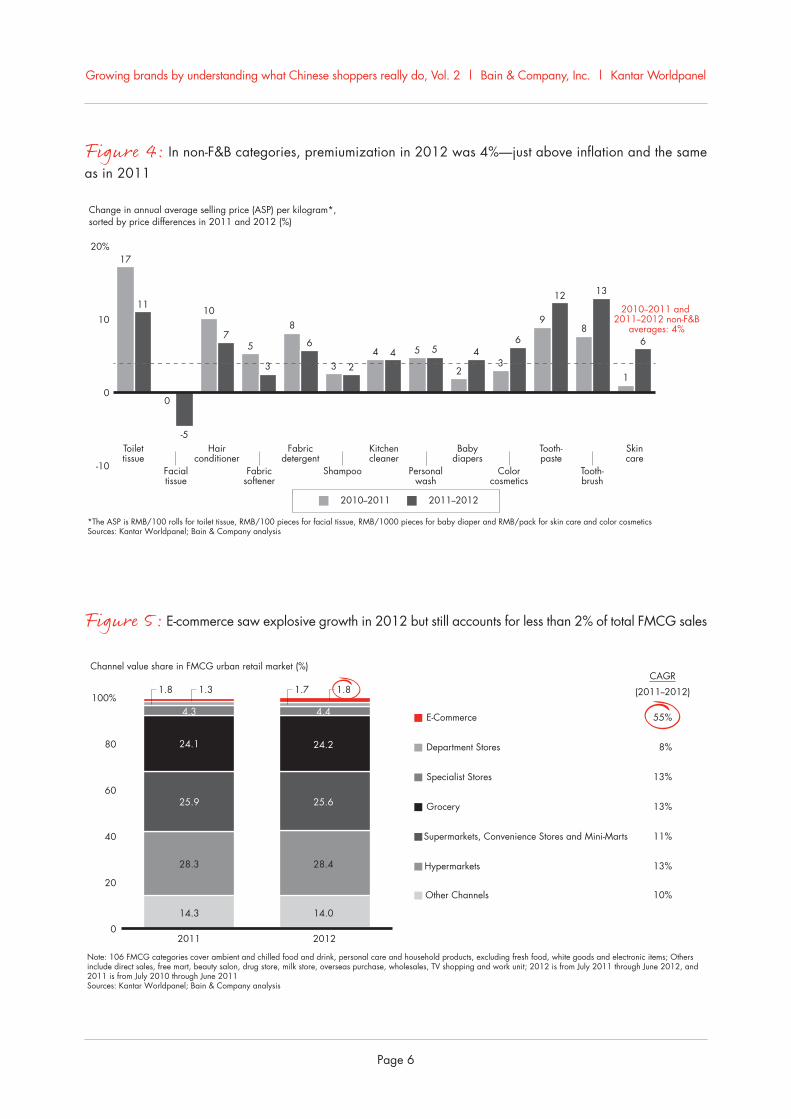
the percentage change between 2010 and 2011 and a level slightly above inflation (see Figure 4).
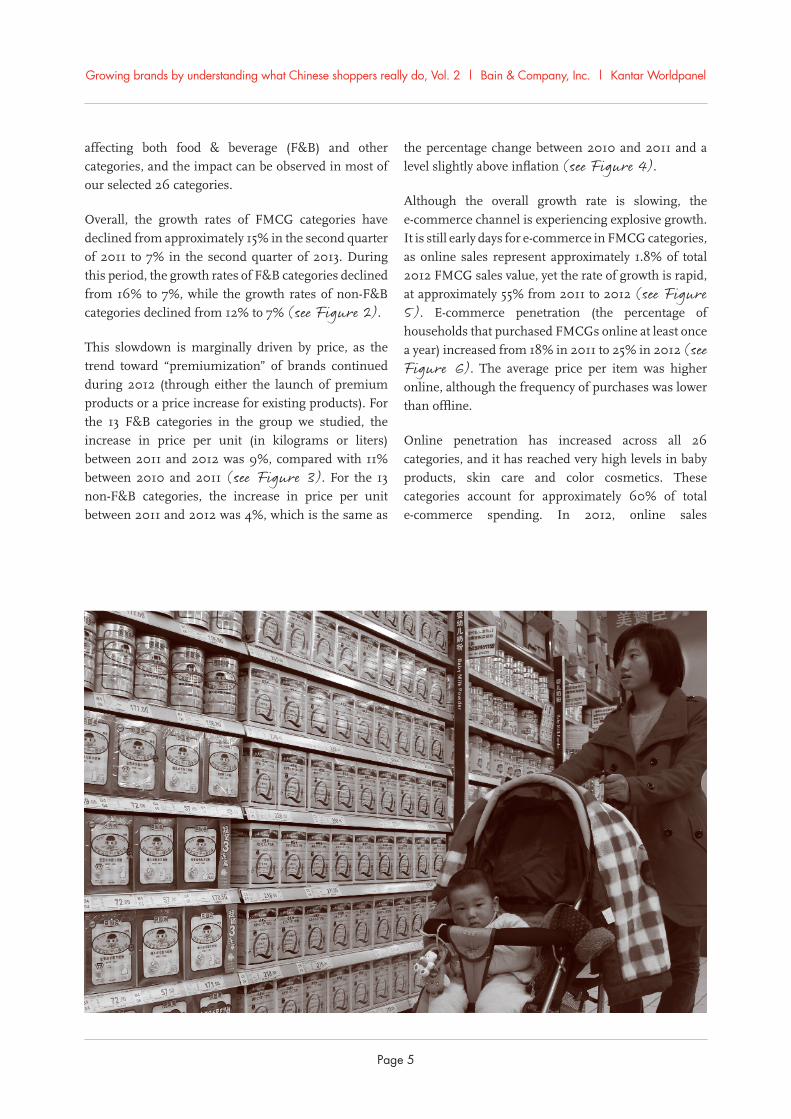
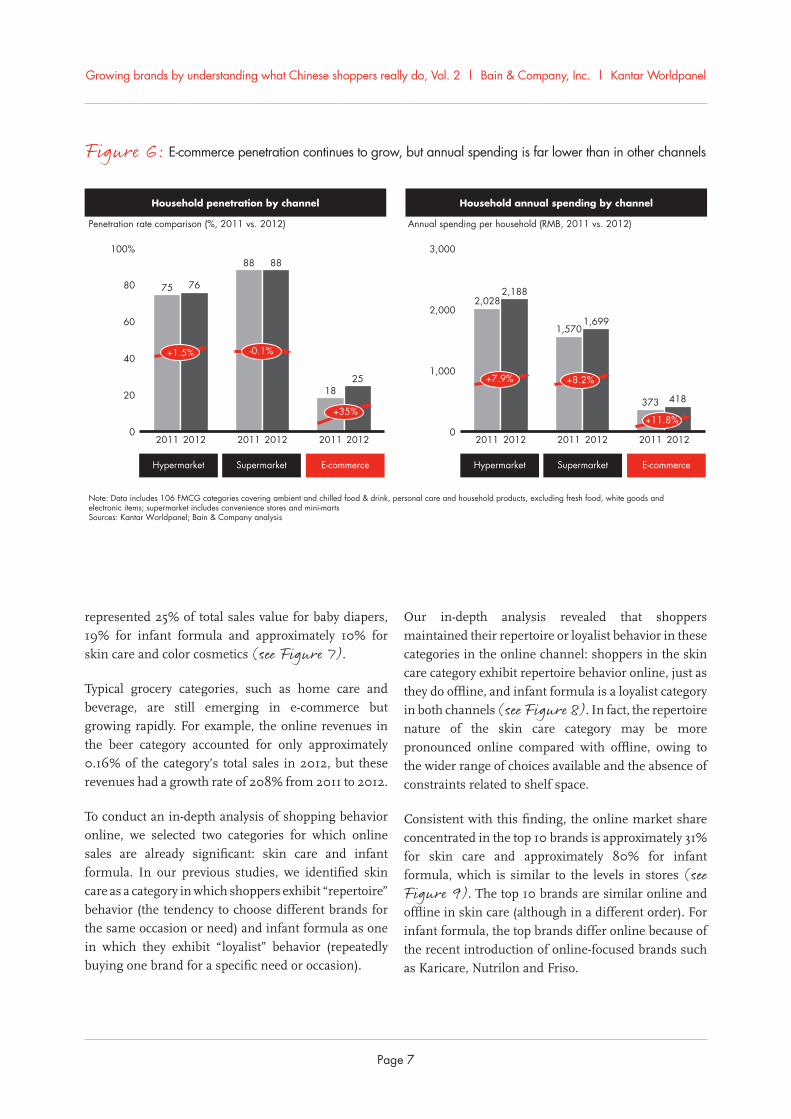
Although the overall growth rate is slowing, the e-commerce channel is experiencing explosive growth. It is still early days for e-commerce in FMCG categories, as online sales represent approximately 1.8% of total 2012 FMCG sales value, yet the rate of growth is rapid, at approximately 55% from 2011 to 2012 (see Figure 5). E-commerce penetration (the percentage of households that purchased FMCGs online at least once a year) increased from 18% in 2011 to 25% in 2012 (see Figure 6). The average price per item was higher online, although the frequency of purchases was lower than offline.
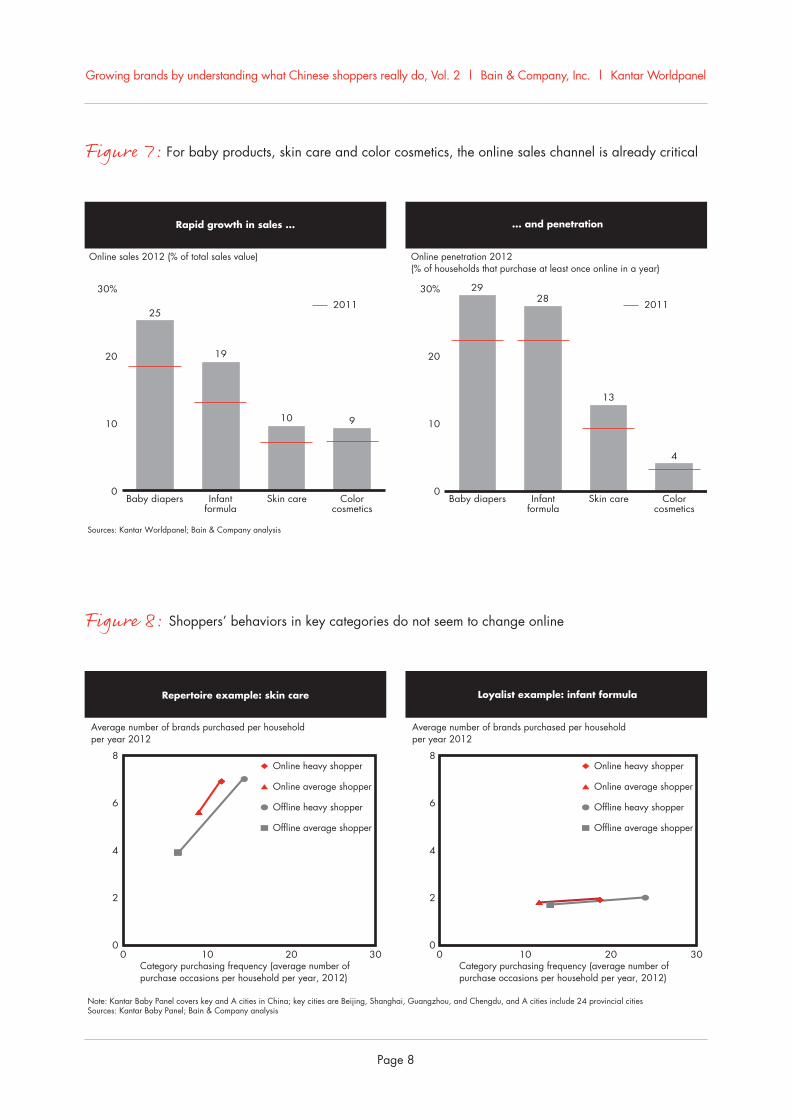
Online penetration has increased across all 26 categories, and it has reached very high levels in baby products, skin care and color cosmetics. These categories account for approximately 60% of total e-commerce spending. In 2012, online sales
affecting both food & beverage (F&B) and other categories, and the impact can be observed in most of our selected 26 categories.
Overall, the growth rates of FMCG categories have declined from approximately 15% in the second quarter of 2011 to 7% in the second quarter of 2013. During this period, the growth rates of F&B categories declined from 16% to 7%, while the growth rates of non-F&B categories declined from 12% to 7% (see Figure 2).
This slowdown is marginally driven by price, as the trend toward “premiumization” of brands continued during 2012 (through either the launch of premium products or a price increase for existing products). For the 13 F&B categories in the group we studied, the increase in price per unit (in kilograms or liters) between 2011 and 2012 was 9%, compared with 11% between 2010 and 2011 (see Figure 3). For the 13 non-F&B categories, the increase in price per unit between 2011 and 2012 was 4%, which is the same as
Growing brands by understanding what Chinese shoppers really do, Vol. 2 | Bain & Company, Inc. | Kantar Worldpanel
Page 6
Figure 4: In non-F&B categories, premiumization in 2012 was 4%—just above inflation and the same as in 2011
Figure 5: E-commerce saw explosive growth in 2012 but still accounts for less than 2% of total FMCG sales
Note: 106 FMCG categories cover ambient and chilled food and drink, personal care and household products, excluding fresh food, white goods and electronic items; Others include direct sales, free mart, beauty salon, drug store, milk store, overseas purchase, wholesales, TV shopping and work unit; 2012 is from July 2011 through June 2012, and 2011 is from July 2010 through June 2011Sources: Kantar Worldpanel; Bain & Company analysis
Channel value share in FMCG urban retail market (%)
100%
80
60
40
20
02011 2012
28.3
25.9
24.1
4.3
14.3
1.8 1.3
28.4
25.6
24.2
4.4
14.0
1.81.7
Other Channels
E-Commerce
Department Stores
Specialist Stores
Grocery
Supermarkets, Convenience Stores and Mini-Marts
Hypermarkets
10%
55%
8%
13%
13%
11%
13%
CAGR
(2011--2012)
Change in annual average selling price (ASP) per kilogram*, sorted by price differences in 2011 and 2012 (%)
*The ASP is RMB/100 rolls for toilet tissue, RMB/100 pieces for facial tissue, RMB/1000 pieces for baby diaper and RMB/pack for skin care and color cosmeticsSources: Kantar Worldpanel; Bain & Company analysis
2010--2011 2011--2012
3
6
9
12
8
13
1
6
2010--2011 and
2011--2012 non-F&Baverages: 4%
0
-5Toilettissue
Facialtissue
Hairconditioner
Fabricsoftener
Fabricdetergent
Shampoo
Kitchencleaner
Personalwash
Babydiapers
Colorcosmetics
Tooth-paste
Tooth-brush
Skincare
20%
10
0
-10
17
1110
75
3
8
6
3 24 4 5 5
2
4
Growing brands by understanding what Chinese shoppers really do, Vol. 2 | Bain & Company, Inc. | Kantar Worldpanel
Page 7
Household penetration by channel Household annual spending by channel
Note: Data includes 106 FMCG categories covering ambient and chilled food & drink, personal care and household products, excluding fresh food, white goods and electronic items; supermarket includes convenience stores and mini-martsSources: Kantar Worldpanel; Bain & Company analysis
Penetration rate comparison (%, 2011 vs. 2012) Annual spending per household (RMB, 2011 vs. 2012)
100%
80
60
40
20
0
3,000
2,000
1,000
0
75 76
88 88
1825
2011 2012 2011 2012 2011 2012 2011 2012 2011 2012 2011 2012
Hypermarket Supermarket E-commerce Hypermarket Supermarket E-commerce
2,0282,188
1,5701,699
373 418
+1.5% -0.1%
+35%
+7.9% +8.2%
+11.8%
Our in-depth analysis revealed that shoppers maintained their repertoire or loyalist behavior in these categories in the online channel: shoppers in the skin care category exhibit repertoire behavior online, just as they do offline, and infant formula is a loyalist category in both channels (see Figure 8). In fact, the repertoire nature of the skin care category may be more pronounced online compared with offline, owing to the wider range of choices available and the absence of constraints related to shelf space.
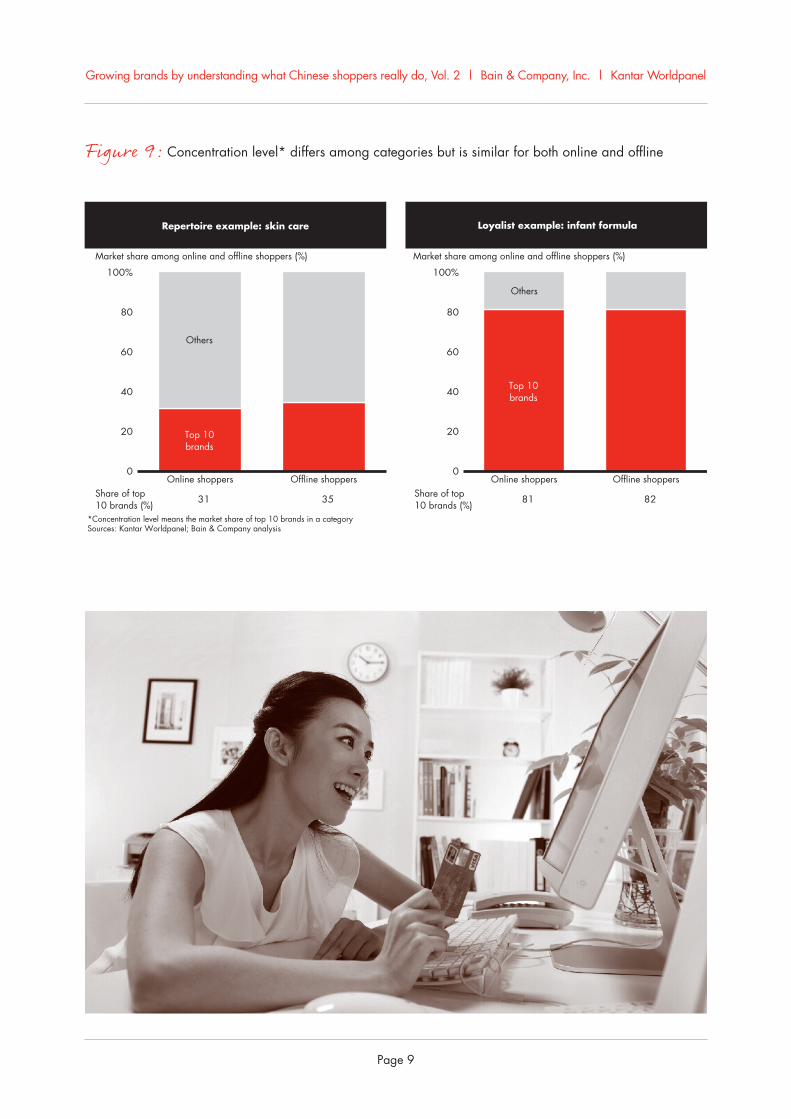
Consistent with this finding, the online market share concentrated in the top 10 brands is approximately 31% for skin care and approximately 80% for infant formula, which is similar to the levels in stores (see Figure 9). The top 10 brands are similar online and offline in skin care (although in a different order). For infant formula, the top brands differ online because of the recent introduction of online-focused brands such as Karicare, Nutrilon and Friso.
represented 25% of total sales value for baby diapers, 19% for infant formula and approximately 10% for skin care and color cosmetics (see Figure 7).
Typical grocery categories, such as home care and beverage, are still emerging in e-commerce but growing rapidly. For example, the online revenues in the beer category accounted for only approximately 0.16% of the category’s total sales in 2012, but these revenues had a growth rate of 208% from 2011 to 2012.
To conduct an in-depth analysis of shopping behavior online, we selected two categories for which online sales are already significant: skin care and infant formula. In our previous studies, we identified skin care as a category in which shoppers exhibit “repertoire” behavior (the tendency to choose different brands for the same occasion or need) and infant formula as one in which they exhibit “loyalist” behavior (repeatedly buying one brand for a specific need or occasion).
Figure 6: E-commerce penetration continues to grow, but annual spending is far lower than in other channels
Growing brands by understanding what Chinese shoppers really do, Vol. 2 | Bain & Company, Inc. | Kantar Worldpanel
Page 8
Repertoire example: skin care Loyalist example: infant formula
Note: Kantar Baby Panel covers key and A cities in China; key cities are Beijing, Shanghai, Guangzhou, and Chengdu, and A cities include 24 provincial citiesSources: Kantar Baby Panel; Bain & Company analysis
Average number of brands purchased per household per year 2012
Average number of brands purchased per household per year 2012
Category purchasing frequency (average number of purchase occasions per household per year, 2012)
Category purchasing frequency (average number of purchase occasions per household per year, 2012)
8
6
4
2
00 302010
Online heavy shopper
Online average shopper
Offline heavy shopper
Offline average shopper
Online heavy shopper
Online average shopper
Offline heavy shopper
Offline average shopper
8
6
4
2
0 3020100
Rapid growth in sales ... ... and penetration
Sources: Kantar Worldpanel; Bain & Company analysis
Online sales 2012 (% of total sales value) Online penetration 2012 (% of households that purchase at least once online in a year)
30%
20
10
0
25
19
10 9
2011
Baby diapers Infantformula
Skin care Colorcosmetics
2928
13
4
30%
20
10
0Baby diapers Infant
formulaSkin care Color
cosmetics
2011
Figure 7: For baby products, skin care and color cosmetics, the online sales channel is already critical
Figure 8: Shoppers’ behaviors in key categories do not seem to change online
Growing brands by understanding what Chinese shoppers really do, Vol. 2 | Bain & Company, Inc. | Kantar Worldpanel
Page 9
Repertoire example: skin care Loyalist example: infant formula
*Concentration level means the market share of top 10 brands in a categorySources: Kantar Worldpanel; Bain & Company analysis
Market share among online and offline shoppers (%) Market share among online and offline shoppers (%)
100%
80
60
40
20
0Online shoppers Offline shoppers
Share of top 10 brands (%)
Share of top 10 brands (%)31 35 81 82
Online shoppers Offline shoppers
Others
Top 10 brands
100%
0
80
60
40
20
Others
Top 10 brands
Figure 9: Concentration level* differs among categories but is similar for both online and offline
Growing brands by understanding what Chinese shoppers really do, Vol. 2 | Bain & Company, Inc. | Kantar Worldpanel
Page 10
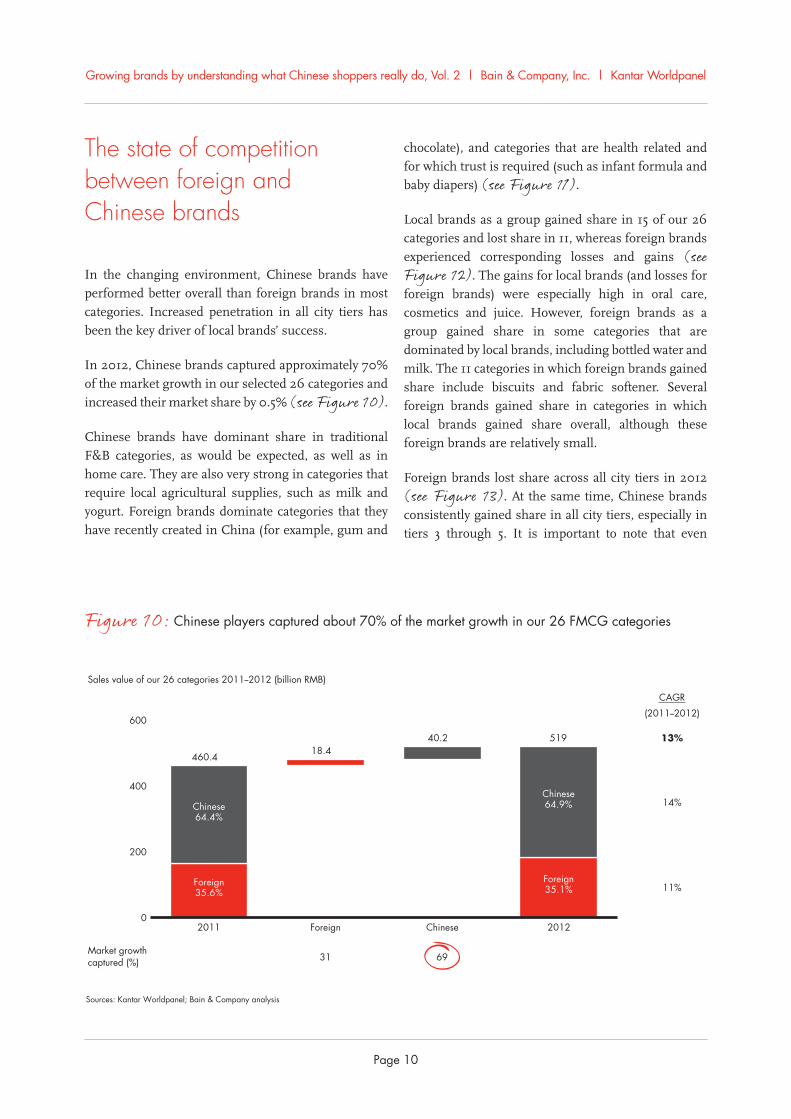
Figure 10: Chinese players captured about 70% of the market growth in our 26 FMCG categories
the state of competition between foreign and Chinese brands
In the changing environment, Chinese brands have performed better overall than foreign brands in most categories. Increased penetration in all city tiers has been the key driver of local brands’ success.
In 2012, Chinese brands captured approximately 70% of the market growth in our selected 26 categories and increased their market share by 0.5% (see Figure 10).
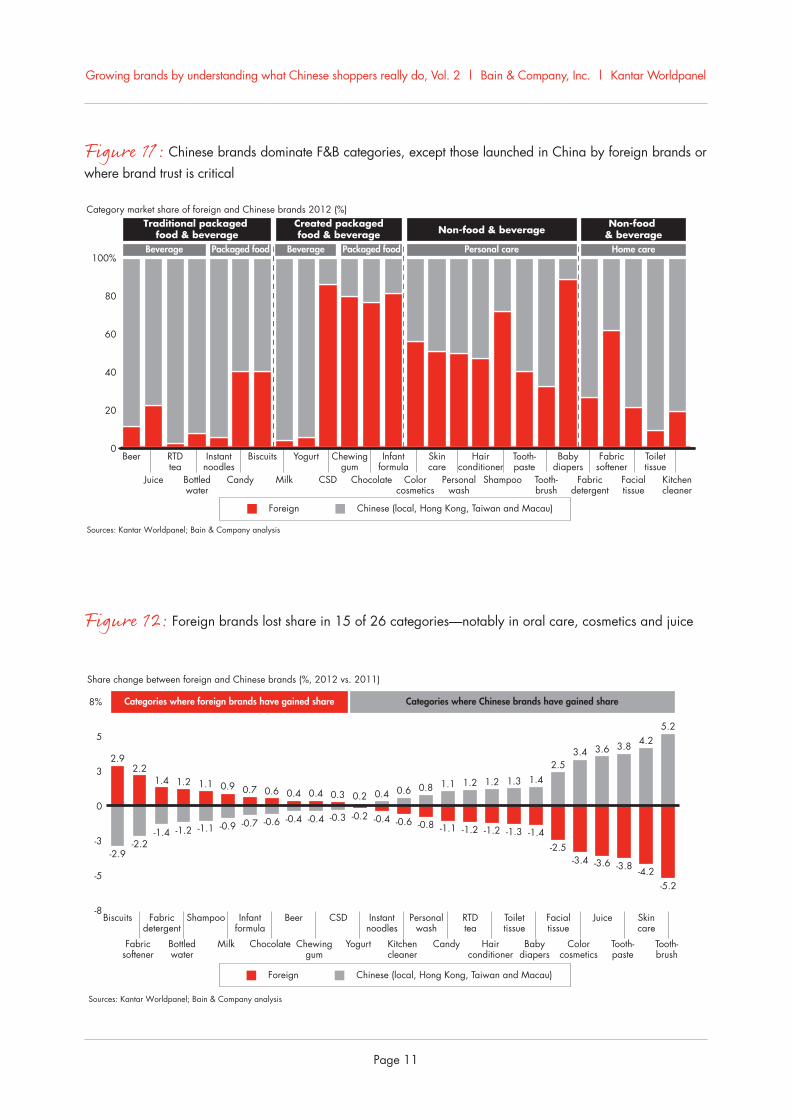
Chinese brands have dominant share in traditional F&B categories, as would be expected, as well as in home care. They are also very strong in categories that require local agricultural supplies, such as milk and yogurt. Foreign brands dominate categories that they have recently created in China (for example, gum and
chocolate), and categories that are health related and for which trust is required (such as infant formula and baby diapers) (see Figure 11).
Local brands as a group gained share in 15 of our 26 categories and lost share in 11, whereas foreign brands experienced corresponding losses and gains (see Figure 12). The gains for local brands (and losses for foreign brands) were especially high in oral care, cosmetics and juice. However, foreign brands as a group gained share in some categories that are dominated by local brands, including bottled water and milk. The 11 categories in which foreign brands gained share include biscuits and fabric softener. Several foreign brands gained share in categories in which local brands gained share overall, although these foreign brands are relatively small.
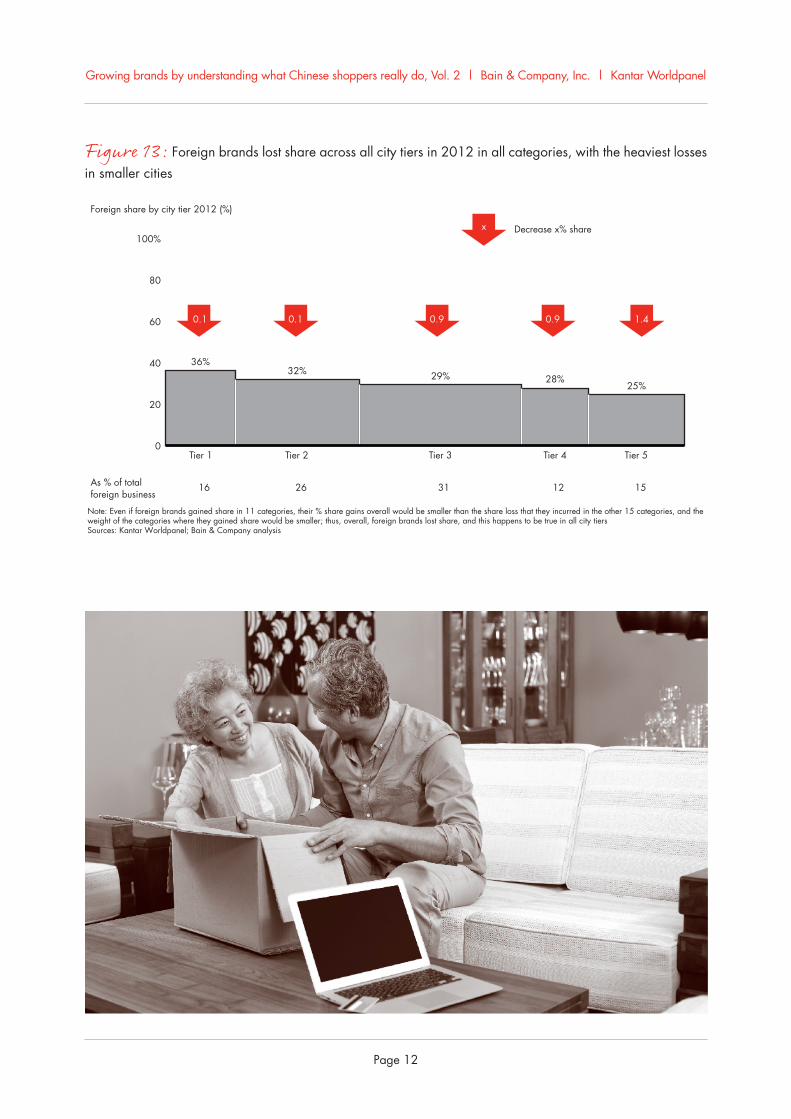
Foreign brands lost share across all city tiers in 2012 (see Figure 13). At the same time, Chinese brands consistently gained share in all city tiers, especially in tiers 3 through 5. It is important to note that even
Sources: Kantar Worldpanel; Bain & Company analysis
Sales value of our 26 categories 2011--2012 (billion RMB)
Market growth captured (%)
600
400
200
0
460.418.4
40.2 519
Chinese64.4%
Foreign35.6%
Chinese64.9%
Foreign35.1%
31 69
2011 2012Foreign Chinese
CAGR
(2011--2012)
13%
14%
11%
Growing brands by understanding what Chinese shoppers really do, Vol. 2 | Bain & Company, Inc. | Kantar Worldpanel
Page 11
Figure 11: Chinese brands dominate F&B categories, except those launched in China by foreign brands or where brand trust is critical
Figure 12: Foreign brands lost share in 15 of 26 categories—notably in oral care, cosmetics and juice
Category market share of foreign and Chinese brands 2012 (%)
Sources: Kantar Worldpanel; Bain & Company analysis
Traditional packaged food & beverage
Created packagedfood & beverage Non-food & beverage
Non-food & beverage
Beverage Packaged food Beverage Packaged food Personal care Home care100%
80
60
40
20
0Beer
Juice
RTDtea
Bottledwater
Instantnoodles
Biscuits
Milk
Yogurt
CSD
Chewinggum
Chocolate
Infantformula
Skincare
Hairconditioner
Tooth-paste
Babydiapers
Fabricsoftener
Toilettissue
Colorcosmetics
Personalwash
Shampoo Tooth-brush
Fabricdetergent
Facialtissue
Kitchencleaner
Foreign Chinese (local, Hong Kong, Taiwan and Macau)
Candy
Sources: Kantar Worldpanel; Bain & Company analysis
Foreign Chinese (local, Hong Kong, Taiwan and Macau)
Share change between foreign and Chinese brands (%, 2012 vs. 2011)
8%
5
3
0
-3
-5
-8
2.92.2
1.4 1.2 1.1 0.9 0.7 0.6 0.4 0.4 0.3 0.2 0.4 0.6 0.8 1.1 1.2 1.2 1.3 1.42.5
3.4 3.6 3.8 4.25.2
-2.9-2.2
-1.4 -1.2 -1.1 -0.9 -0.7 -0.6 -0.4 -0.4 -0.3 -0.2 -0.4 -0.6 -0.8 -1.1 -1.2 -1.2 -1.3 -1.4-2.5
-3.4 -3.6 -3.8 -4.2-5.2
BeerBiscuits Fabricdetergent
Shampoo Infantformula
CSD Instantnoodles
Personalwash
RTDtea
Toilettissue
Facialtissue
Juice Skincare
Fabricsoftener
Bottledwater
Milk Chocolate Chewinggum
Yogurt Kitchencleaner
Candy Hairconditioner
Babydiapers
Colorcosmetics
Tooth-paste
Tooth-brush
Categories where foreign brands have gained share Categories where Chinese brands have gained share
Growing brands by understanding what Chinese shoppers really do, Vol. 2 | Bain & Company, Inc. | Kantar Worldpanel
Page 12
Note: Even if foreign brands gained share in 11 categories, their % share gains overall would be smaller than the share loss that they incurred in the other 15 categories, and the weight of the categories where they gained share would be smaller; thus, overall, foreign brands lost share, and this happens to be true in all city tiersSources: Kantar Worldpanel; Bain & Company analysis
Foreign share by city tier 2012 (%)
100%
80
60
40
20
0
36%32% 29% 28%
25%
As % of total foreign business
16 26 31 12 15
Tier 1 Tier 2 Tier 3 Tier 4 Tier 5
Decrease x% share
0.1 0.1 0.9 0.9 1.4
x
Figure 13: Foreign brands lost share across all city tiers in 2012 in all categories, with the heaviest losses in smaller cities
Growing brands by understanding what Chinese shoppers really do, Vol. 2 | Bain & Company, Inc. | Kantar Worldpanel
Page 13
top five Chinese brands in each category increased penetration in all city tiers, while the top five foreign brands experienced lower penetration rates across city tiers. Foreign brands have traditionally been stronger in top-tier cities, but local brands are now gaining share in these cities by increasing penetration, while also maintaining their strength in lower-tier cities. As we discussed in Volume 1 of our 2013 report, penetration is the key driver of share change, and Chinese brands seem to execute better on that dimension than foreign brands.
though foreign brands gained share in 11 categories, their percentage share gain in these categories overall is smaller than the share loss that they incurred in the other 15 categories. The weighting of the categories in which they gained share is also smaller. Consequently, foreign brands lost share overall, and this was the case in all city tiers.
The share change was mainly driven by penetration gains by Chinese brands. Indeed, Chinese brands increased penetration across all city tiers in 2012. The
Growing brands by understanding what Chinese shoppers really do, Vol. 2 | Bain & Company, Inc. | Kantar Worldpanel
Page 14
implications
The overall slowdown in category growth means that FMCG companies will need to rely increasingly on gains in market share to grow a brand in China. As discussed in Volume 1 of our 2013 report, companies can gain market share by increasing penetration. Our analysis shows that local brands as a group were more successful at increasing penetration in 2012 than foreign brands.
At the same time, foreign and local FMCG companies must recognize and address the rapidly increasing importance of online sales in many categories. This means marketers should continually enhance their digital capabilities to stay relevant to consumers. For example, driving higher penetration online requires capabilities in website design, fast-changing merchandising and pricing, managing online traffic and conversations, fulfilling orders, building partnerships with key online channel players and managing social media.
These developments make it critical to drive penetration both online and offline. The approach marketers select
should depend on whether a category’s shoppers exhibit stronger repertoire or loyalist behavior:
• In repertoire categories, marketers often build consideration by investing in social media and traditional national media. For example, Inoherb, a leading local skin care brand online and offline, raised awareness and built its reputation by targeting social-media sites, such as Weibo and WeChat. The company strongly enhanced its brand consideration and penetration by launching a program for online shoppers to test products and share their experiences through blogs and forums. Inoherb has also invested heavily in advertising on CCTV and sponsored popular contests, such as the Dance Congress, a popular televised dance competition that features celebrity participants.
• In loyalist categories, such as infant formula, marketers leverage social media and consumer word of mouth to achieve brand preference. For example, Friso, the leading infant formula brand online, used consumer word of mouth to become a preferred brand.

Growing brands by understanding what Chinese shoppers really do, Vol. 2 | Bain & Company, Inc. | Kantar Worldpanel
Page 15
Our findings related to foreign and local FMCG players reinforce a key insight set out in Volume 1 of our 2013 report: The era of growing brands by riding the wave of high growth rates for categories has ended. In most categories, brand growth will primarily depend on gaining market share, which means penetration is paramount.
As competition intensifies, we expect to see more consolidation in both the retail and FMCG sectors. But
this does not mean that multinational companies will absorb local players. In fact, in recent deals between Tesco and China Resources Enterprise, Danone and China Mengniu Dairy, and Pepsi and Master Kong, the local companies have become the dominant partners. Which companies will emerge as market leaders in this wave of consolidation? Inevitably, it will be those that have the clearest understanding of the categories in which they compete and the behavior of Chinese shoppers.
Growing brands by understanding what Chinese shoppers really do, Vol. 2 | Bain & Company, Inc. | Kantar Worldpanel
Page 16
about the authors
Bruno Lannes is a partner in Bain’s Shanghai office and leads the firm’s Consumer Products and Retail practices for Greater China. You may contact him by email at [email protected]
Kevin Chong is a partner in Bain’s Shanghai office. You may contact him by email at [email protected]
James Root is a partner in Bain’s Hong Kong office. You may contact him by email at [email protected]
Fiona Liu is a manager in Bain’s Shanghai office. You may contact her by email at [email protected]
Mike Booker is a partner in Bain’s Singapore office and leads the firm’s Consumer Products and Retail practices for Asia. You may contact him by email at [email protected]
Guy Brusselmans is a partner in Bain’s Brussels office. You may contact him by email at [email protected]
Marcy Kou is CEO at Kantar Worldpanel Asia. You may contact her by email at [email protected]
Jason Yu is General Manager at Kantar Worldpanel China. You may contact him by email at [email protected]
Please direct questions and comments about this report via email to the authors.
Acknowledgments
This report is a joint effort between Bain & Company and Kantar Worldpanel. The authors extend gratitude to all who contributed to this report, in particular Chen Chen, Yifan Yang and Iris Zhou from Bain & Company and Vincent Shao and Lydia Wang from Kantar Worldpanel.
Growing brands by understanding what Chinese shoppers really do, Vol. 2 | Bain & Company, Inc. | Kantar Worldpanel
Page 17
Shared Ambition, True Results
Bain & Company is the management consulting firm that the world’s business leaders come to when they want results.Bain advises clients on strategy, operations, technology, organization, private equity and mergers and acquisitions. We
develop practical, customized insights that clients act on and transfer skills that make change stick. Founded in 1973,
Bain has 50 offices in 32 countries, and our deep expertise and client roster cross every industry and economic sector.
Our clients have outperformed the stock market 4 to 1.
What sets us apartWe believe a consulting firm should be more than an adviser. So we put ourselves in our clients’ shoes, selling
outcomes, not projects. We align our incentives with our clients by linking our fees to their results and collaborate to
unlock the full potential of their business. Our Results Delivery® process builds our clients’ capabilities, and our True
North values mean we do the right thing for our clients, people and communities—always.
Bain in Greater ChinaBain was the first strategic consulting firm to set up an office in Beijing in 1993. Since then Bain has worked with both
multinationals and local clients across more than 30 industries. We have served our clients in more than 40 cities in
China. There are now three offices in the Greater China region, covering Beijing, Shanghai and Hong Kong. There are
about 150 consultants currently working in Greater China, with extensive Chinese and global working experiences.
Kantar Worldpanel—high definition inspiration™, a CTR service in ChinaKantar Worldpanel is the world leader in continuous consumer panels. Our global team of consultants apply tailored
research solutions and advanced analytics to bring you unrivaled sharpness and clarity of insight to both the big picture
and the fine detail. We help our clients understand what people buy, what they use and the attitudes behind shopper
and consumer behavior.
We use the latest data collection technologies best matched to the people and the environment we are measuring.
Our expertise is rooted in hard, quantitative evidence—evidence that has become the market currency for local and
multinational FMCG brand and private label manufacturers, fresh food suppliers, retailers, market analysts and
government organizations. We are not limited to the grocery sector; we have a wide range of panels in fields as diverse
as entertainment, communications, petrol, fashion, personal care, beauty, baby and food on-the-go.
It’s what we do with our data that sets us apart. We apply hindsight, insight, foresight and advice to make a real
difference to the way you see your world and inspire the actions you take for a more successful business.
We have more than 40 years’ experience in helping companies shape their strategies and manage their tactical
decisions; we understand shopper and retailer dynamics; we explore opportunities for growth in terms of products,
categories, regions and within trade environments. Together with our partner relationships, we are present in more
than 50 countries—in most of which we are market leaders—which means we can deliver inspiring insights on a local,
regional and global scale. Kantar Worldpanel was formerly known as TNS Worldpanel.