GROWING AREA WL New Meadows River Towns of … · New Meadows River Towns of Harpswell, Brunswick,...
80
WL Triennial 2008 Effective Date 7/28/09 Revision No. 2 Page 1 of 80 GROWING AREA WL New Meadows River Towns of Harpswell, Brunswick, West Bath and Phippsburg Triennial Report for 2006-2008 Report Date: 07-28-2009 Anna Bourakovsky APPROVAL Division Director: _________________________ _________________________ Date: ____________ Print name signature DISTRIBUTION: ( ) Habitat/Aquaculture Division…………………………………………... By:_____Date:_______ ( ) Bureau of Resource Management Director………………………….. By:_____Date:_______ ( ) Office of the Commissioner……………………………………………. By:_____Date:_______
Transcript of GROWING AREA WL New Meadows River Towns of … · New Meadows River Towns of Harpswell, Brunswick,...

WL Triennial 2008 Effective Date 7/28/09 Revision No. 2
Page 1 of 80
GROWING AREA WL New Meadows River
Towns of Harpswell, Brunswick, West Bath and Phippsburg
Triennial Report for 2006-2008
Report Date: 07-28-2009
Anna Bourakovsky
APPROVAL Division Director: _________________________ _________________________ Date: ____________ Print name signature DISTRIBUTION: ( ) Habitat/Aquaculture Division…………………………………………... By:_____Date:_______( ) Bureau of Resource Management Director………………………….. By:_____Date:_______( ) Office of the Commissioner……………………………………………. By:_____Date:_______

WL Triennial 2008 Effective Date 7/28/09 Revision No. 2
Page 2 of 80
DRAFT APPROVAL ROUTING FORM
Date in Process: Operation Title: Revision No.: Originator’s Name:_Anna Bourakovsky______ ________________________________ Print name Signature The attached draft is for your evaluation and comment. Suggested changes should be concise and reasons specific. Return to sender. PEER reviewer: _Mercuria Cumbo_________ _________________________ Date: ____________ print name signature PEER reviewer: __Peter Koufopoulos_____ _________________________ Date: ____________ print name signature Division Director: _____Amy Fitzpatrick_____ _________________________ Date: ____________ print name signature

WL Triennial 2008 Effective Date 7/28/09 Revision No. 2
Page 3 of 80
TABLE OF CONTENTS Executive Summary ....................................................................................................................10 Growing Area Description ...........................................................................................................10 Current Classification(s)..............................................................................................................10 Activity during Review Period .....................................................................................................12 Current Management Plan(s) for Conditional Areas ...................................................................14 Current Annual Review of Conditional Area Management Plan .................................................14 Documentation of Pollution Sources...........................................................................................14
Evaluation of New Pollution Sources ..................................................................................15 Re-Evaluation of Existing Pollution Sources .......................................................................21
Water Quality Review and Discussion ........................................................................................42 Upward Classification Requests .................................................................................................49 Shoreline Survey Activity during Review Period .........................................................................59 Aquaculture/Wet Storage Activity ...............................................................................................61 Classification Changes Required................................................................................................61 Summary.....................................................................................................................................61 Appendix A. 2008 Annual Review of Management Plan-New Meadows River Marina Conditional Area, Area 19A ...........................................................................................................................63 Appendix B. 2008 Annual Review of Management Plan-Tottman Cove Seasonal Conditional Area, Area No. 19C.....................................................................................................................65 Appendix C. 2008 Annual Review of Management Plan-Hermit Island Seasonal Conditional Area, Area No. 19C.....................................................................................................................67 Appendix D. Key to Water Quality Table Headers......................................................................69 Appendix E. Transitioning to Membrane Filtration for Seawater and Pollution Source Samples70 Appendix F. Growing Area WL 2008 Data.................................................................................71 LIST OF TABLES Table 1. New Actual and Potential Pollution Sources, identified between 2006-2008...............15 Table 2. Previously Identified Domestic Actual and Potential Pollution Problems, Direct and Indirect, Area WL ........................................................................................................................21 Table 3. Active OBDs in Growing Area WL, with Closure Sizes (in acres) ................................28 Table 4. Growing Area WL Stream Samples, 2008 ...................................................................35 Table 5. Fecal Coliform Report for Growing Area WL, 2002-2008 ............................................42 Table 6. Fecal Coliform Report for New Meadows Marina, Opens Status Data, 2002-2008.....44 Table 7. Fecal Coliform Report for Tottman Cove Seasonal Area, Open Status Data, October 1 – June 30, 2001-2008 .................................................................................................................44 Table 8. Fecal Coliform Report for Hermit Island Seasonal Area, Open Status Data, November 16 – May 30, 1998-2008 .............................................................................................................44 Table 9. WL 2008 Sampling Effort ..............................................................................................44 Table 10. Station WL 36.50, Rainfall and Seasonal Assessment, 2003-2008............................51 Table 11. Station WL 36.70, Rainfall and Seasonal Assessment, 2003-2008............................52 Table 12. WL 36.90, Rainfall and Seasonal Assessment, 2003-2008........................................54

WL Triennial 2008 Effective Date 7/28/09 Revision No. 2
Page 4 of 80
Table 13. Geomean and P90 Calculations for Upper New Meadows Lake Stations, Data Collected after Rainfall >0.25 inches in 72 hours........................................................................57 Table 14. Geomean and P90 Calculations for New Meadows Lake Stations, Data Collected after Rainfall >0.25 inches in 48 hours........................................................................................57 LIST OF FIGURES Figure 1. Growing Area WL, with Active Water Stations; Pre -December 31, 2008 .....................5 Figure 2. Growing Area WL Detail – Upper New Meadows River; Pre -December 31, 2008 .....6 Figure 3. Growing Area WL Detail – Middle New Meadows River; Pre -December 31, 2008 ....7 Figure 4. Growing Area WL Detail – Lower New Meadows River; Pre -December 31, 2008 .......8 Figure 5. Growing Area WL, with Noted Changes in Classifications ............................................9 Figure 6. WL Actual Pollution Sources, identified 2006-2008....................................................18 Figure 7. WL- Upper New Meadows Potential Pollution Sources, identified 2006-2008 ...........19 Figure 8. WL- Lower New Meadows Potential Pollution Sources, identified 2006-2008 ...........20 Figure 9. Previously Identified Actual and Potential Pollution Sources......................................25 Figure 10. WL Over Board Discharge Locations .......................................................................27 Figure 11. Marinas in Growing Areas WL ...................................................................................30 Figure 12. Brunswick Stormwater Features in the New Meadows Watershed ...........................32 Figure 13. WL Stream Sample Locations ..................................................................................36 Figure 14. Farms in Growing Area WL .......................................................................................39 Figure 15. WL Recreation Areas................................................................................................41 Figure 16. P90 scores for WL stations Classified as Approved .................................................47 Figure 17. P90 scores for WL stations Classified as Conditionally Approved...........................48 Figure 18. P90 scores for WL stations Classified as Restricted ................................................48 Figure 19. P90 trends for New Meadows Lake Stations, 2004-2008..........................................50 Figure 20. Proposed Classification Changes for the New Meadows Lake .................................58

WL Triennial 2008 Effective Date 7/28/09 Revision No. 2
Page 5 of 80
Figure 1. Growing Area WL, with Active Water Stations; Pre -December 31, 2008 Classifications

WL Triennial 2008 Effective Date 7/28/09 Revision No. 2
Page 6 of 80
Figure 2. Growing Area WL Detail – Upper New Meadows River; Pre -December 31, 2008 Classifications

WL Triennial 2008 Effective Date 7/28/09 Revision No. 2
Page 7 of 80
Figure 3. Growing Area WL Detail – Middle New Meadows River; Pre -December 31, 2008 Classifications

WL Triennial 2008 Effective Date 7/28/09 Revision No. 2
Page 8 of 80
Figure 4. Growing Area WL Detail – Lower New Meadows River; Pre -December 31, 2008 Classifications

WL Triennial 2008 Effective Date 7/28/09 Revision No. 2
Page 9 of 80
Figure 5. Growing Area WL, with Noted Changes in Classifications

WL Triennial 2008 Effective Date 7/28/09 Revision No. 2
Page 10 of 80
Executive Summary This is a triennial report for growing area WL written in compliance with the requirements of the 2007 Model Ordinance and the National Shellfish Sanitation Program (NSSP). This report includes a water quality review, as well as an evaluation of all new pollution source identified between 2006 and 2008, and a re-evaluation of previously identified pollution sources. Pollution sources reviewed in this report include domestic waste, including private in-ground systems and over board discharge (OBDs), marinas, recreational areas, agricultural activities, domestic animal and wildlife areas, stormwater, and non-point pollution transported by streams. Shellfish growing area WL is located in the watershed of the New Meadows River (Figures 1-4). Based on this review, two classification downgrades were required: the area surrounding water quality station WL 11 was downgraded to restricted classification, due to unidentified non point source pollution; and the area surrounding station WL 46 (Mill Cove, West Bath) was downgraded to prohibited due to a malfunctioning septic system. Both of these changes were implemented on December 31, 2008 (Figure 5). An additional required classification change that is based on the current review is an expansion of a prohibited area surrounding an OBD located on Dingley Island, Harpswell. One upward classification recommendation for the New Meadows Lake is presented in this report. The next sanitary survey report for growing area WL will be written in 2011, and will cover growing area activities through 2010.
Growing Area Description Shellfish Growing Area WL begins at Fort Point, Cundys Harbor and ends at Small Point, Phippsburg and is comprised of the New Meadows River, including Buttermilk and Doughty Coves. The towns in this growing area are Harpswell, Brunswick, West Bath and Phippsburg. There are no municipal treatment facilities in this growing area. All residences have private waste disposal systems most of which are in ground systems. There are also 18 licensed overboard discharge systems, and several outhouses, chemical toilets or composting toilets located throughout the area, predominantly at seasonal properties. There is one marina in area WL, located near the head of the river, and several piers which provide support to local lobstering and fishing activities. There is also a large multi-season resort, Sebasco Harbor Resort, located in the Phippsburg portion of the growing area. There are no industrial discharges in the area.
Current Classification(s) Prior to December 31, 2008, shellfish growing Area WL had shellfish areas classified as;

WL Triennial 2008 Effective Date 7/28/09 Revision No. 2
Page 11 of 80
Approved: 41 stations Conditionally Approved
Pollution Area No. 19-A New Meadows Lake, Upper New Meadows River and Middle Ground (Bath, Brunswick, West Bath and Harpswell); sample stations monitoring the conditionally approved (seasonal based on a marina) area- WL 35.0, 36.0 and 36.1.
Pollution Area No. 19-C Lower New Meadows River (Harpswell to Phippsburg): sample station monitoring the Tottman Cove conditionally approved area based on season- WL 96
Pollution Area No. 19-C Lower New Meadows River (Harpswell to Phippsburg): sample station monitoring the Hermit Island conditionally approved area based on season- WL 102
Restricted Pollution Area No. 19-A New Meadows Lake, Upper New Meadows River and Middle
Ground (Bath, Brunswick, West Bath and Harpswell), New Meadows Lake- WL 36.7 (restricted due to non-point source pollution); Woodward Cove- WL 25, 26, and 27 (restricted due to non-point source pollution); and Middle Ground- WL 37 and 37.5 (restricted due to non-point source pollution).
Pollution Area 19-B Middle New Meadows River (West Bath, Harpswell and Phippsburg): Dam Cove- WL 51 and 52 (restricted due to non-point source pollution); and the area east of Hen Island- WL 73 (restricted due to non-point source pollution).
Pollution Area 19-C Lower New Meadows River (Harpswell to Phippsburg); Round Cove- WL 87 (restricted due to identified pollution sources)
Prohibited
Pollution Area No. 19-A New Meadows Lake, Upper New Meadows River and Middle Ground (Bath, Brunswick, West Bath and Harpswell), Rosedale Point: WL 34.5 (prohibited due to an active OBD); Upper New Meadows Lake Marsh: WL 36.9, due to non-point source pollution
Pollution Area 19-B Middle New Meadows River (West Bath, Harpswell and Phippsburg): Brighams Cove; WL 68 (prohibited due to identified pollution source and non-point source pollution); Wallace Shore, WL 10 (prohibited due to identified pollution source)
Pollution Area 19-C Lower New Meadows River (Harpswell to Phippsburg): WL 81, 85, 89 and 98 (Prohibited due to the presence of active OBDs).
On December 31, 2008, two areas were downgraded: Pollution Area No. 19-A New Meadows Lake, Upper New Meadows River and Middle Ground (Bath, Brunswick, West Bath and Harpswell): Browns Cove (WL 46) was reclassified from approved to prohibited due to a malfunctioning septic system and water quality not meeting the approved standard; and 19-B Middle New Meadows River (West Bath, Harpswell and Phippsburg): Laurel Point (WL 11) was reclassified from approved to restricted due to non-point source pollution and water quality scores not meeting the approved standard. There are six stations in area WL that are new stations (<30 data points); these stations do not have a classification assigned to them.
WL Triennial 2008 Effective Date 7/28/09 Revision No. 2
Page 12 of 80
Please visit the DMR website to view legal notices for growing area WL: http://www.maine.gov/dmr/rm/public_health/closures/closedarea.htm#L
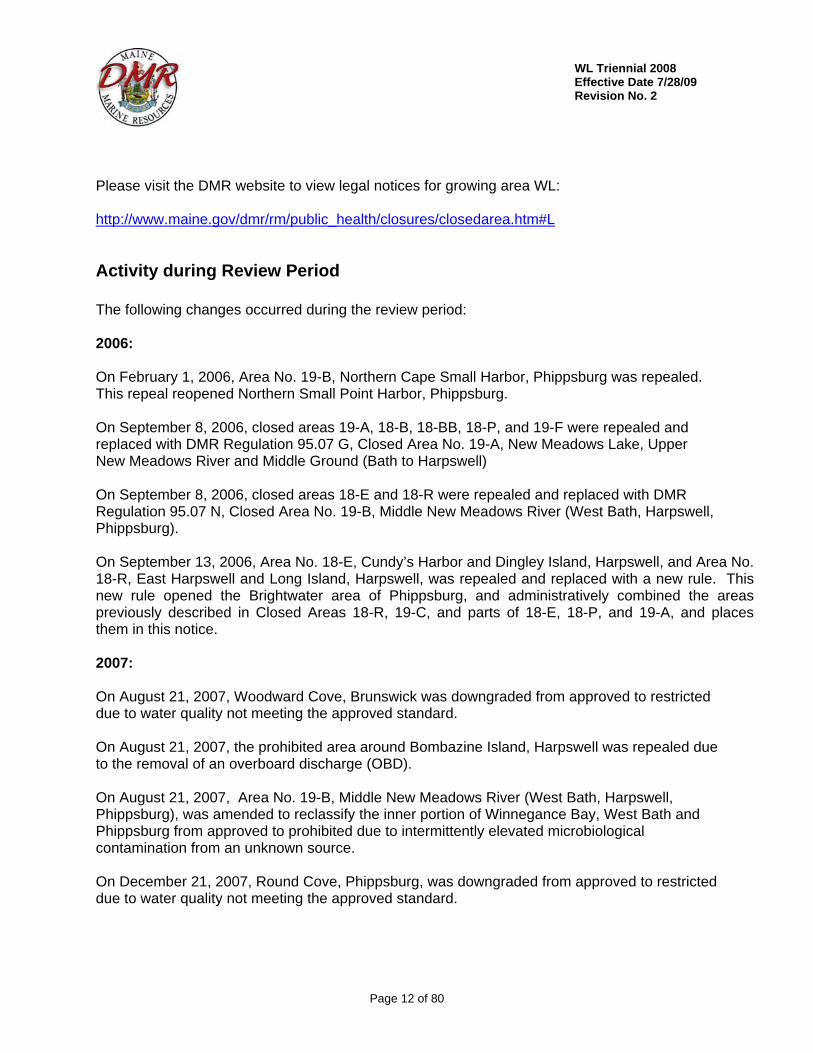
Activity during Review Period The following changes occurred during the review period: 2006: On February 1, 2006, Area No. 19-B, Northern Cape Small Harbor, Phippsburg was repealed. This repeal reopened Northern Small Point Harbor, Phippsburg. On September 8, 2006, closed areas 19-A, 18-B, 18-BB, 18-P, and 19-F were repealed and replaced with DMR Regulation 95.07 G, Closed Area No. 19-A, New Meadows Lake, Upper New Meadows River and Middle Ground (Bath to Harpswell) On September 8, 2006, closed areas 18-E and 18-R were repealed and replaced with DMR Regulation 95.07 N, Closed Area No. 19-B, Middle New Meadows River (West Bath, Harpswell, Phippsburg). On September 13, 2006, Area No. 18-E, Cundy’s Harbor and Dingley Island, Harpswell, and Area No. 18-R, East Harpswell and Long Island, Harpswell, was repealed and replaced with a new rule. This new rule opened the Brightwater area of Phippsburg, and administratively combined the areas previously described in Closed Areas 18-R, 19-C, and parts of 18-E, 18-P, and 19-A, and places them in this notice. 2007: On August 21, 2007, Woodward Cove, Brunswick was downgraded from approved to restricted due to water quality not meeting the approved standard. On August 21, 2007, the prohibited area around Bombazine Island, Harpswell was repealed due to the removal of an overboard discharge (OBD). On August 21, 2007, Area No. 19-B, Middle New Meadows River (West Bath, Harpswell, Phippsburg), was amended to reclassify the inner portion of Winnegance Bay, West Bath and Phippsburg from approved to prohibited due to intermittently elevated microbiological contamination from an unknown source. On December 21, 2007, Round Cove, Phippsburg, was downgraded from approved to restricted due to water quality not meeting the approved standard.

WL Triennial 2008 Effective Date 7/28/09 Revision No. 2
Page 13 of 80
On December 21, 2007, Area No. 19-B, Middle New Meadows River (West Bath, Harpswell, Phippsburg), was amended to reclassify Dam Cove, West Bath, as restricted for shellfish harvesting due to non-point pollution.
On December 21, 2007, Area No. 19-C, Lower New Meadows River (Harpswell to Phippsburg) was amended to reclassify The Branch portion of Small Point Harbor, Hermit Island, Phippsburg from approved to restricted due to water quality not meeting the approved standard. 2008: On May 30, 2008, Area No. 19-A, New Meadows Lake, Upper New Meadows River and Middle Ground (Bath to Harpswell), was amended to reclassify Long Cove, West Bath from “prohibited” to “approved” and upper Mill Cove, West Bath, from “restricted” to “approved”. On May 30, 2008, Area No. 19-B, Middle New Meadows River (West Bath, Harpswell, Phippsburg), was amended to reclassify an area at the Sabino Landing (West Bath) from “prohibited” to “restricted”; to reclassify the remaining area from Sabino to Birch Point (West Bath) from “prohibited” to “approved”; to reduces the size of the prohibited area in Winnegance Bay (Phippsburg); to repeal the prohibited area on Long Island (Harpswell); and to reclassify the area near Hen Island (Phippsburg) from “approved” to “restricted”. On May 30, 2008, Area No. 19-C, Lower New Meadows River (Harpswell to Phippsburg) was amended to reclassify two areas in Phippsburg from “restricted” to “conditionally approved” based on season. One area is in Tottman Cove, with an open status from October 1 – June 30; the second area is in The Branch, Hermit Island, with an open status from November 16 – May 31. On June 13, 2008, Area No. 19-B, Middle New Meadows River (West Bath, Harpswell, Phippsburg), was amended to reclassify an area at Foster’s Point (West Bath) from “prohibited” to “approved”. On November 21, 2008, Area No. 19-B, Middle New Meadows River (West Bath, Harpswell, Phippsburg), was amended to creates a closure east of Wallace Shore Road (Harpswell), due to the presence of holding tanks and a house that is submerged at high tide. This amendment also repealed a prohibited area on the east side of Indian Point (Harpswell) due to the removal of a licensed overboard discharge. On December 31, 2008, Area No. 19-A, Upper New Meadows River (Bath to Harpswell), was amended to reclassify the middle lobe of Mill Cove, locally known as Brown’s Cove, from approved to prohibited due to a malfunctioning septic system and water quality exceeding the approved standard. On December 31, 2008, Area No. 19-B, Middle New Meadows River (West Bath, Harpswell, Phippsburg), was amended to reclassify the flats surrounding Laurel Point, Harpswell from approved to restricted due to water quality exceeding the approved standard due to non-point pollution.

WL Triennial 2008 Effective Date 7/28/09 Revision No. 2
Page 14 of 80
Current Management Plan(s) for Conditional Areas There are three conditional areas in growing area WL:
1) New Meadows Marina Conditionally Approved Area, Open Nov 15- April 30 Conditionally approved (CA) Stations WL 35, 36 and 36.1
2) Tottman Cove Seasonal Conditionally Approved Area, Open October 1- June 30 CA Station WL 96
3) Hermit Island Seasonal Conditionally Approved Area, Open November 16- May 30 CA Station: WL 102; Boundary Station: WL 101.8 (A) Tottman Cove and Hermit Island Conditional areas were implemented in May 2008.
Current Annual Review of Conditional Area Management Plan In 2008, the New Meadows Marina Conditional Area met the condition of its management plan. Stations WL 35 and 36 were sampled six times in the open status. Station WL 36.1 was sampled 5 times in the open status; the station was attempted to be sampled a sixth time, but the sample could not be collected due to the presence of ice (area completely frozen). All three stations met their NSSP standard in the open status. The management plan was reviewed and updated in 2008. Tottman Cove conditional area and its management plan were implemented in May 2008. Prior to this reclassification, the area was classified as restricted. In 2008, this area was sampled a total of seven times, with 6 times during its open status. Station WL 96 met its NSSP classification standard. Hermit Island conditional area and its management plan were implemented in May 2008. Prior to this reclassification, the area was classified as restricted. In 2008, this area was sampled a total of 7 times, with 4 samples collected during the open status. The area will be sampled six times in the open status in 2009. Please refer to Appendices A, B and C for complete reviews of these conditional area management plans.
Documentation of Pollution Sources The following sections include information on pollution sources which do or may impact water quality in growing area WL. The section includes information on new pollution sources, identified over the past three review years, as well as updated reviews of existing pollution sources in this growing area. Pollution sources that are reviewed in this section include domestic waste, including both private inground systems and over board discharges (OBDs),

WL Triennial 2008 Effective Date 7/28/09 Revision No. 2
Page 15 of 80
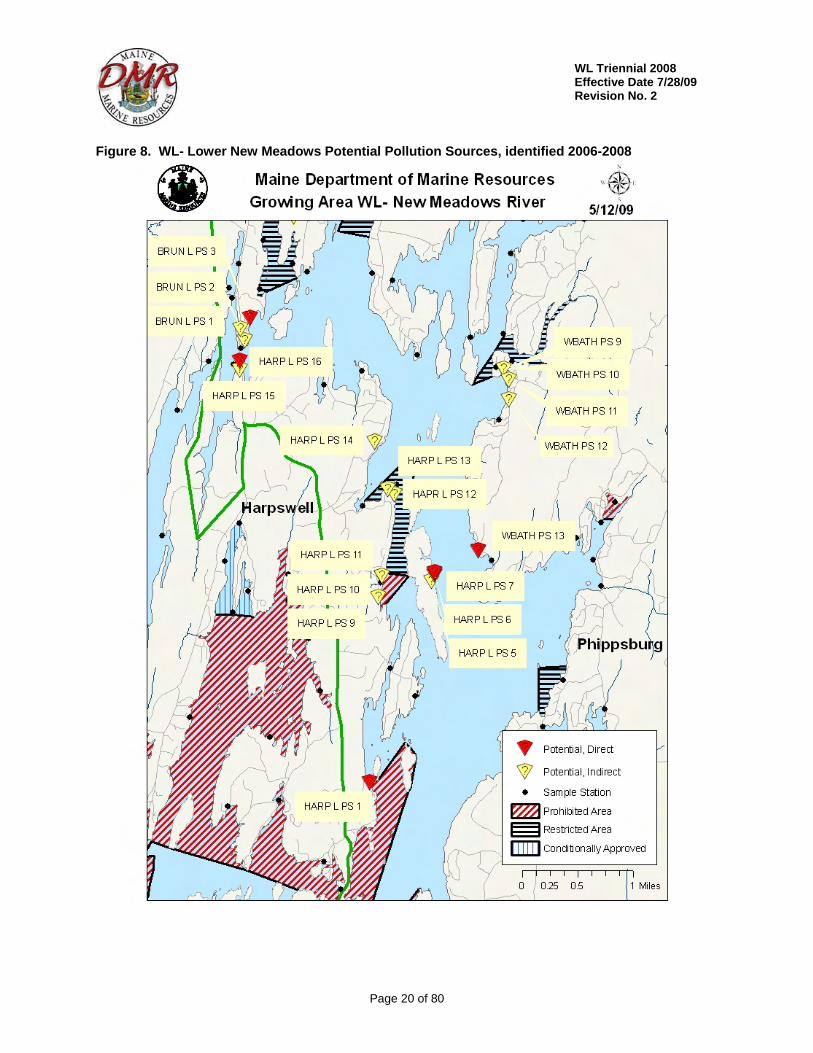
marinas and mooring fields, stormwater and pollution from non-point sources (streams), farms and other agricultural activities, domestic animals and wildlife areas, and recreational areas. Evaluation of New Pollution Sources Much of the shoreline in growing area WL has had an updated shoreline survey completed since the last triennial report for the area. Over the past three years, all of the shoreline in the town of Brunswick has been updated; most of the shoreline in Harpswell, with the exception of the prohibited area off Cundys Harbor has been re-surveyed as well. In West Bath, the shoreline along the New Meadows Lake and Bull Rock Road, and King’s Point Road were resurveyed in 2008, while the shoreline along the Sabino area was resurveyed in 2007. New actual and potential problems identified as part of this recent (2006-2008) shoreline survey work are presented in Table 1; any remediation or enforcement action taken by the town and DMR to correct the problems and protect public health is noted in bold font in Table 1, along with the description of the problem. Updates to the status of the pollution (actual vs. potential, direct vs. indirect) based on remediation action are also noted in bold in the table. Locations of new actual problems are presented in Figure 6; location of new potential problems are in Figures 7 and 8. All problems were reported to codes enforcement officers of each respective town. Several identified potential problems are scheduled to have follow-up work by DMR and DEP in summer 2009. The results of this follow up work will be presented in the next Sanitary Survey report. Table 1 . New Actual and Potential Pollution Sources, identified between 2006-2008
Town Pollution ID Actual / Potential
Direct / Indirect
Pollution Description and Action Taken
Survey Date
BRUN L PS 13 A/P D/I Graywater discharge; LPI confirmed that pipes are basement drains; dye test showed no impact to shore
31-Mar-08
BRUN L PS 19/20 A/P D/I
Graywater discharge; straight pipe; no IGS system; LPI confirmed system location; no problems noted during follow up visit
31-Mar-08
BRUN L PS 21 A/P D
Holding tank overflow to stream; Enforcement letter sent; currently using composting toilet and getting permit for new tank
31-Mar-08
BRUN L PS 24 A/P D
Straight pipe, toilet paper on shore bank; Enforcement letter not to occupy property; working with owner to install new system
31-Mar-08
BRUN L PS 26 A/P D Straight pipe; Enforcement letter not to occupy property; new system approved and installation pending
31-Mar-08
BRUN L PS 15/16 A/P I
Animal waste in yard; Graywater discharge- connected to septic system
31-Mar-08
BRUN L PS 22/23 A/P I
IGS malfunction; sewer pipe disconnected; Outhouse; LPI confirmed that outhouse is inactive
31-Mar-08

WL Triennial 2008 Effective Date 7/28/09 Revision No. 2
Page 16 of 80
Town Pollution ID Actual / Potential
Direct / Indirect
Pollution Description and Action Taken
Survey Date
BRUN L PS 25 A/P I Straight pipe into stream; Enforcement letter not to occupy until removed
31-Mar-08
BRUN L PS 32 A/P I IGS malfunction; confirmed FIXED 31-Mar-08
BRUN L PS 3 P D Graywater discharge; Enforcement letter not to occupy until fixed; graywater plugged
01-Apr-08
BRUN L PS 9/10 P D
Animal waste in yard; Holding tank overflow; not enough land for septic design; tank being pumped regularly; very little use of property
01-Apr-08
BRUN L PS 11 P D Potential graywater discharge 31-Mar-08 BRUN L PS 12 P D Land drains 31-Mar-08
BRUN L PS 14 P D Potential graywater/wastewater discharge 31-Mar-08
BRUN L PS 17 P D Animal waste in yard 31-Mar-08
BRUN L PS 31 P D Recommended IGS recheck in summer 31-Mar-08
BRUN L PS 1 P I Land drain; unlicensed OBD; No occupancy allowed; routinely patrolled by police
01-Apr-08
BRUN L PS 2 P I
Recommended IGS recheck; New field recently replaced. No additional problems confirmed by LPI
01-Apr-08
BRUN L PS 4/5/6
P I
Possible graywater discharge; Land drains; Recommended IGS recheck
31-Mar-08
BRUN L PS 7 P I Land drains 01-Apr-08
BRUN L PS 18 P I Possible IGS malfunction; System replaced and inspected by LPI 01-Apr-08
BRUN L PS 29 P I Recommended IGS recheck 31-Mar-08 BRUN L PS 30 P I Potential graywater discharge 31-Mar-08 BRUN L PS 33 P I Holding tank 27-Jun-08
BRUN L PS 34 P I Potential IGS malfunction; far from shore, does not impact growing area
09-Jul-08
HAPR L PS 8 A D
House sitting in water, waste pipe goes over water into bank; house floods on high tides; Closure implemented
17-Nov-08
HAPR L PS 1 P D Rusty drainage pipe from garage 20-Nov-08 HAPR L PS 6 P D/I Inactive straight pipe; Removed 11-Oct-06 HAPR L PS 7 P D Graywater discharge 11-Oct-06
Harpswell
HAPR L PS 16 P D Inactive straight pipe; House unoccupied 13-Nov-08

WL Triennial 2008 Effective Date 7/28/09 Revision No. 2
Page 17 of 80
Town Pollution ID Actual / Potential
Direct / Indirect
Pollution Description and Action Taken
Survey Date
HAPR L PS 5 P I Graywater discharge into holding tank 11-Oct-06 HAPR L PS 9 P I Holding tank 17-Nov-08
HAPR L PS 10 P I Holding tank 17-Nov-08 HAPR L PS 11 P I Outhouse 17-Nov-08 HAPR L PS 12 P I Holding tank 17-Nov-08 HAPR L PS 13 P I New system being installed 17-Nov-08
HAPR L PS 14 P I Possible IGS malfunction; reported to town for follow-up 17-Nov-08
HAPR L PS 15 P I Holding tank 10-Nov-08
WBATH PS 5 A I Graywater discharge from seasonal dwelling; Seasonal Closure Area 29-Oct-08
WBATH PS 18 A I Septic system malfunction; Closure implemented 06-Dec-08
WBATH PS 1 P D Inactive OBD pipe 18-Sep-08
WBATH PS 7 P D Possible OBD malfunction; located in Closed area, DEP will follow up 29-Oct-08
WBATH PS 13 P D Inactive OBD pipe 09-Oct-07 WBATH PS 2 P I Gulley drain to shore 18-Sep-08
WBATH PS 3 P I Recommended IGS recheck in summer; DEP will dye test in 2009 29-Oct-08
WBATH PS 4 P I Recommended IGS recheck in summer; DEP will dye test in 2009 29-Oct-08
WBATH PS 6 P I Recommended IGS recheck in summer; DEP will dye test in 2009 29-Oct-08
WBATH PS 8 P I Recommended IGS recheck in summer; DEP will dye test in 2009 29-Oct-08
WBATH PS 9 P I Land drain 10-Aug-07
WBATH PS 10 P I Possible IGS malfunction, will recheck/dye test in 2009 10-Aug-07
West Bath
WBATH PS 11 P I Holding tank; Confirmed OK by CEO 10-Aug-07
WBATH PS 12 P I Outhouse by shore; Outhouse Condemned by town LPI 02-Oct-07

WL Triennial 2008 Effective Date 7/28/09 Revision No. 2
Page 18 of 80
Figure 6. WL Actual Pollution Sources, identified 2006-2008 (underlined pollution IDs correspond to pollution courses that have been abated/ resolved)

WL Triennial 2008 Effective Date 7/28/09 Revision No. 2
Page 19 of 80
Figure 7. WL- Upper New Meadows Potential Pollution Sources, identified 2006-2008
WL Triennial 2008 Effective Date 7/28/09 Revision No. 2
Page 20 of 80
Figure 8. WL- Lower New Meadows Potential Pollution Sources, identified 2006-2008

WL Triennial 2008 Effective Date 7/28/09 Revision No. 2
Page 21 of 80
Re-Evaluation of Existing Pollution Sources
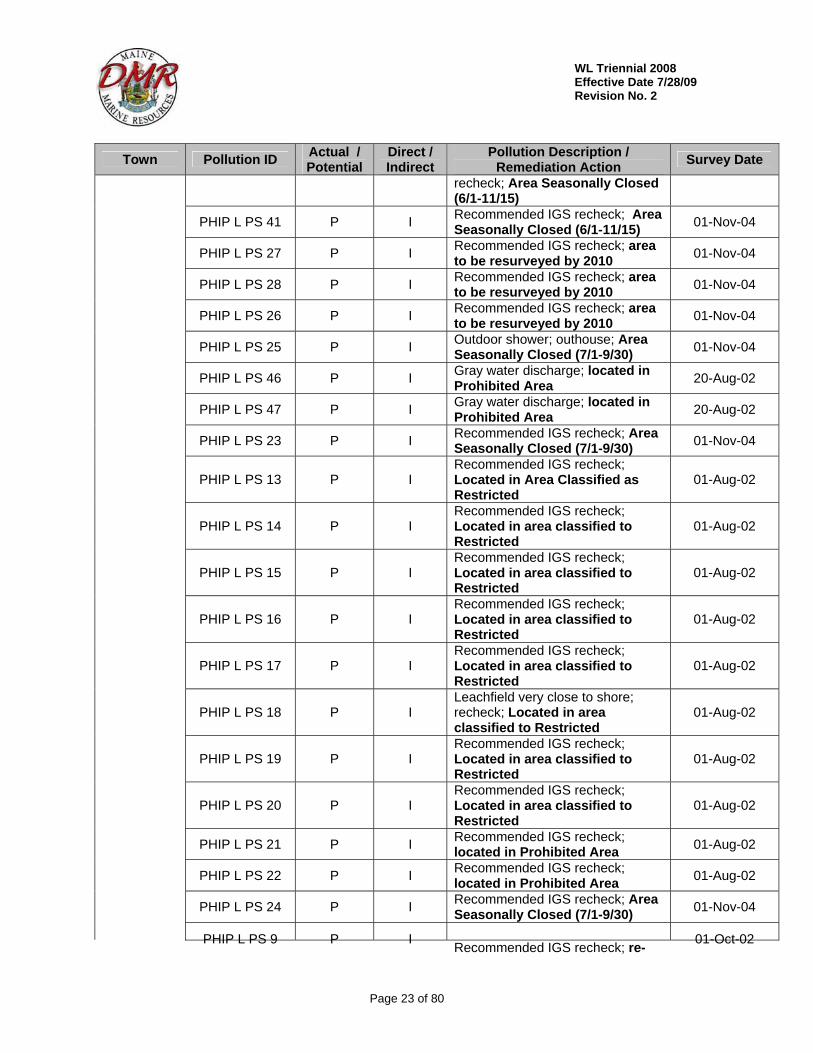
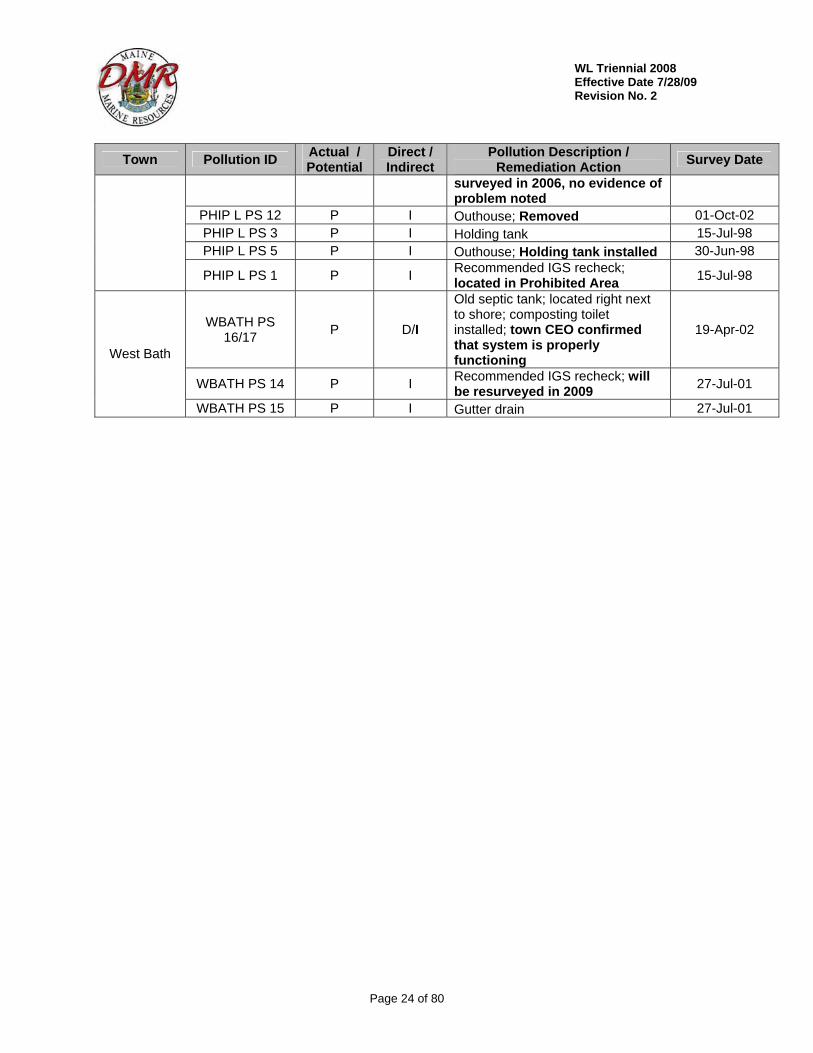
The following sections are a review of existing pollution sources in growing area WL. Pollution problems associated with domestic waste, including OBDs, which were identified prior to the last triennial are re-evaluated. Other pollution sources, which were present at the time of the last triennial review, are also reviewed. Domestic Waste The shoreline along the eastern shore of the mid and lower portion for the New Meadows River has been surveyed between 1998 and 2004. Much of the shoreline is to be resurveyed over the next two review years, with the findings being presented in the next sanitary survey report, to be written after the 2010 field season is completed. Table 2 and Figure 9 present all problems that were identified during shoreline surveys that have occurred prior to 2006; any remediation action or follow up work conducted by the town CEO and/or DMR staff is noted in the table in bold. Many of the previously identified problems are located in areas that have been reclassified to restricted or prohibited; these classifications are noted in Table 2 in bold. Updates to the status of the pollution (actual vs. potential, direct vs. indirect) based on remediation action are also noted in bold in the table. In Phippsburg, multiple seasonal properties located along the shoreline of Hermit Island conditionally approved area were identified as potential problems. Currently, this conditional area is seasonally closed between June 1st and November 15th, when the seasonal properties are occupied, and the inground systems are being used. This area has been identified as a priority survey area, and will be re-surveyed in 2009 or 2010 by DEP and DMR; properties that have been identified as potential problems will be dye tested to determine whether or not they are an actual direct or indirect pollution source. Three additional seasonal properties that were identified as potential problems are located within the boundaries of Tottman Cove conditional area; this area is seasonally closed from July 1st through September 30th. The following problems were identified in areas that are currently classified as approved: PHIP L PS 39 and PHIP L 42 (both actual, indirect); and PHIP L PS 3 and PHIP L PS 43 (both potential, indirect). These problems were not re-evaluated in 2008; and should be re-checked in 2009, with the results of these re-evaluations presented in the next sanitary survey report. All areas which have not been surveyed on or after 2006 should be surveyed by the end of 2010, with the data collected from 2006 through 2010 presented in a comprehensive sanitary survey report, to be written at the conclusion of the 2010 field season. Table 2. Previously Identified Domestic Actual and Potential Pollution Problems, Direct and Indirect, Area WL
Town Pollution ID Actual / Potential
Direct / Indirect
Pollution Description / Remediation Action Survey Date
HAPR L PS 2 A D Graywater discharge; located in Prohibited Area 23-Aug-05
HAPR L PS 4 A D Graywater discharge; located in Prohibited Area 23-Aug-05 Harpswell
HAPR L PS 3 P I Graywater discharge; located in 23-Aug-05

WL Triennial 2008 Effective Date 7/28/09 Revision No. 2
Page 22 of 80
Town Pollution ID Actual / Potential
Direct / Indirect
Pollution Description / Remediation Action Survey Date
Prohibited Area
PHIP L PS 35 A D Graywater discharge; Area Seasonally Closed (6/1-11/15) 01-Dec-04
PHIP L PS 11 A/P D/I Graywater discharge; re-surveyed in 2006, no evidence of problem noted
01-Oct-02
PHIP L PS 6 A D Outhouse on ledges; Removed 30-Jun-98 PHIP L PS 39 A I Graywater discharge 01-Nov-04 PHIP L PS 42 A I Broken pipe; tank overflow to shore 01-Dec-04
PHIP L PS 10 A/P I Graywater discharge; re-surveyed in 2006, no evidence of problem noted
01-Oct-02
PHIP L PS 7 A I
Gray water discharge; Located in Area Classified as Restricted; LPI ordered graywater discharge to be removed
17-Sep-02
PHIP L PS 8 A/P I Graywater discharge; Removed 17-Sep-02
PHIP L PS 4 A/P I Graywater discharge; Holding tank installed 30-Jun-98
PHIP L PS 44 P D Outhouse; located in Prohibited Area 01-Aug-02
PHIP L PS 45 P D Possible graywater discharge; located in Prohibited Area 01-Aug-02
PHIP L PS 2 P D Septic tank; no leachfield; Approved holding tank on site; confirmed by town CEO
15-Jul-98
PHIP L PS 43 P I Recommended IGS recheck 01-Dec-04
PHIP L PS 29 P I Recommended IGS recheck; Area Seasonally Closed (6/1-11/15) 01-Nov-04
PHIP L PS 30 P I Old system; recommended frequent IGS recheck; Area Seasonally Closed (6/1-11/15)
01-Nov-04
PHIP L PS 31 P I Old IGS system; recommended IGS recheck; Area Seasonally Closed (6/1-11/15)
01-Dec-04
PHIP L PS 32 P I Land drain; Area Seasonally Closed (6/1-11/15) 01-Dec-04
PHIP L PS 33 P I Recommended IGS recheck; Area Seasonally Closed (6/1-11/15) 01-Dec-04
PHIP L PS 34 P I Recommended IGS recheck; Area Seasonally Closed (6/1-11/15) 01-Dec-04
PHIP L PS 36 P I Recommended IGS recheck; Area Seasonally Closed (6/1-11/15) 01-Nov-04
PHIP L PS 37 P I Recommended IGS recheck; Area Seasonally Closed (6/1-11/15) 01-Nov-04
PHIP L PS 38 P I Holding tank; Area Seasonally Closed (6/1-11/15) 01-Nov-04
Phippsburg
PHIP L PS 40 P I Recommended IGS and dry well 01-Nov-04
WL Triennial 2008 Effective Date 7/28/09 Revision No. 2
Page 23 of 80
Town Pollution ID Actual / Potential
Direct / Indirect
Pollution Description / Remediation Action Survey Date
recheck; Area Seasonally Closed (6/1-11/15)
PHIP L PS 41 P I Recommended IGS recheck; Area Seasonally Closed (6/1-11/15) 01-Nov-04
PHIP L PS 27 P I Recommended IGS recheck; area to be resurveyed by 2010 01-Nov-04
PHIP L PS 28 P I Recommended IGS recheck; area to be resurveyed by 2010 01-Nov-04
PHIP L PS 26 P I Recommended IGS recheck; area to be resurveyed by 2010 01-Nov-04
PHIP L PS 25 P I Outdoor shower; outhouse; Area Seasonally Closed (7/1-9/30) 01-Nov-04
PHIP L PS 46 P I Gray water discharge; located in Prohibited Area 20-Aug-02
PHIP L PS 47 P I Gray water discharge; located in Prohibited Area 20-Aug-02
PHIP L PS 23 P I Recommended IGS recheck; Area Seasonally Closed (7/1-9/30) 01-Nov-04
PHIP L PS 13 P I Recommended IGS recheck; Located in Area Classified as Restricted
01-Aug-02
PHIP L PS 14 P I Recommended IGS recheck; Located in area classified to Restricted
01-Aug-02
PHIP L PS 15 P I Recommended IGS recheck; Located in area classified to Restricted
01-Aug-02
PHIP L PS 16 P I Recommended IGS recheck; Located in area classified to Restricted
01-Aug-02
PHIP L PS 17 P I Recommended IGS recheck; Located in area classified to Restricted
01-Aug-02
PHIP L PS 18 P I Leachfield very close to shore; recheck; Located in area classified to Restricted
01-Aug-02
PHIP L PS 19 P I Recommended IGS recheck; Located in area classified to Restricted
01-Aug-02
PHIP L PS 20 P I Recommended IGS recheck; Located in area classified to Restricted
01-Aug-02
PHIP L PS 21 P I Recommended IGS recheck; located in Prohibited Area 01-Aug-02
PHIP L PS 22 P I Recommended IGS recheck; located in Prohibited Area 01-Aug-02
PHIP L PS 24 P I Recommended IGS recheck; Area Seasonally Closed (7/1-9/30) 01-Nov-04
PHIP L PS 9 P I Recommended IGS recheck; re- 01-Oct-02
WL Triennial 2008 Effective Date 7/28/09 Revision No. 2
Page 24 of 80
Town Pollution ID Actual / Potential
Direct / Indirect
Pollution Description / Remediation Action Survey Date
surveyed in 2006, no evidence of problem noted
PHIP L PS 12 P I Outhouse; Removed 01-Oct-02 PHIP L PS 3 P I Holding tank 15-Jul-98 PHIP L PS 5 P I Outhouse; Holding tank installed 30-Jun-98
PHIP L PS 1 P I Recommended IGS recheck; located in Prohibited Area 15-Jul-98
WBATH PS 16/17 P D/I
Old septic tank; located right next to shore; composting toilet installed; town CEO confirmed that system is properly functioning
19-Apr-02
WBATH PS 14 P I Recommended IGS recheck; will be resurveyed in 2009 27-Jul-01
West Bath
WBATH PS 15 P I Gutter drain 27-Jul-01

WL Triennial 2008 Effective Date 7/28/09 Revision No. 2
Page 25 of 80
Figure 9. Previously Identified Actual and Potential Pollution Sources

WL Triennial 2008 Effective Date 7/28/09 Revision No. 2
Page 26 of 80
There are 18 active licensed overboard discharges (OBDs) in growing area WL (Figure 10). An overboard discharge (OBD) is the discharge of wastewater from residential, commercial, and publicly owned facilities to Maine's streams, rivers lakes, and the ocean. Commercial and residential discharges of sanitary waste have been regulated since the mid-1970's when most direct discharges of untreated waste were banned. Between 1974 and 1987 most of the "straight pipes" were connected to publicly-owned treatment works or replaced with standard septic systems. Overboard discharge treatment systems were installed for those facilities that were unable to connect to publicly-owned treatment works or unable to install a septic system because of poor soil conditions or small lot sizes. All overboard discharge systems include a process to clarify the wastewater and disinfect it prior to discharge. There are two general types of treatment systems; mechanical package plants and sand filters. Sand filter systems consist of a septic tank and a sand filter. In such systems, the wastewater is first directed to a holding tank where the wastewater solids are settled out and undergo partial microbial digestion. The partially treated wastewater then flows from the tank into a sand filter, consisting of distribution pipes, layers of stone and filter sand, and collection pipes within a plastic liner. The wastewater is biologically treated as it filters down through the sand, and is then collected and discharged to a disinfection unit. Mechanical package plants consist of a tank, where waste is mechanically broken up, mixed and aerated; mechanical systems require electric power, and must have an operating alarm on a separate electrical circuit that will activate if the treatment unit malfunctions due to a power failure. The aerated treated wastewater is held in a calm condition for a time, allowing for solids to settle and for the waste to be partially digested by naturally occurring bacteria. The clarified water from the tank is then pumped off the top into a disinfection unit. There are two types of disinfection units, UV and chlorinators (most common). In a chlorinator, the treated water contacts chlorine tablets and remains in a tank for at least 20 minutes where bacteria and other pathogens are killed. The treated and disinfected water is discharged from the disinfection unit to below the low water mark of the receiving waterbody (the ocean, a river, or a stream) via an outfall pipe. OBDs are licensed and inspected by the Maine Department of Environmental Protection. If an OBD is not properly maintained, or if the OBD malfunctions, it has the potential to directly discharge untreated wastewater to the shore, therefore, preventative closures are implemented surrounding every OBD located in growing area WL. The size of each closure is determined based on a dilution calculation, based on the permitted flow rate of the OBD, and the depth of the receiving water that each OBD discharges to; the fecal concentration used for this dilution calculation is 1.4X10⁵ fc/100 ml. All OBDs in growing area WL, except OBD 4060, located on Dingley Island, Harpswell, are surrounded by closures that are larger than the required closures based on the dilution calculation (Table 3). The closure surrounding OBD 4060 needs be expanded to 0.88 acres or greater. This required classification change was implemented on June 4, 2009. Since the last triennial report, one OBD has been removed (in 2007, located on Bombazine Island, Harpswell). Four of the remaining 18 OBDs in this growing area are on the priority removal list.

WL Triennial 2008 Effective Date 7/28/09 Revision No. 2
Page 27 of 80
Figure 10. WL Over Board Discharge Locations

WL Triennial 2008 Effective Date 7/28/09 Revision No. 2
Page 28 of 80
Table 3. Active OBDs in Growing Area WL, with Closure Sizes (in acres)
DEP ID TOWN FLOW
(GPD) Receiving
Water Body Depth of
Receiving Water (ft)
PRIORITY REMOVAL
Required Closure acres
Actual Closure acres
4060 315 New Meadows River 11 0.88 0.36 3265 300 New Meadows River 18 0.51 3675 400 New Meadows River 18 0.68 3986 300 New Meadows River 35 0.26 4548 315 New Meadows River 18 0.54 0896 1125 New Meadows River 18 1.92 4191 315 New Meadows River 18 0.54 3002 300 New Meadows River 18 0.51 2331
Harpswell
330 New Meadows River 18 0.56
213
1246 500 New Meadows River 6 Y 2.56 1940 750 New Meadows River 6 Y 3.84 1562
West Bath 300 New Meadows River 6 Y 1.53
10.5
2415 600 New Meadows River 15 1.23 10.8 1010 20,000 Sebasco Harbor 20 Y 30.7 100+ 1587 420 Sebasco Harbor 18 0.72 7187 360 Small Pt Harbor 18 0.51
25+
6665 1000 Fish House Cove 18 1.71 7232
Phippsburg
300 Small Pt Harbor 18 0.51 17+
Municipal Waste Water Treatment Plans There is no municipal waste water treatment facilities located in growing area WL. Industrial Pollution There are no industrial discharges into the New Meadows River. Dredging Activity There have been no dredging activities in the New Meadows River since the last review triennial review was completed. Marinas The New Meadows marina, located on the upper New Meadows River in Brunswick, is a full service marina, offering 60 slips, with water and electricity provided to most slips; there are no moorings at this location (Figure 11). The marina operates from May 1 to October 15th, with peak season from June to September. Per interview with the marina operator, completed on

WL Triennial 2008 Effective Date 7/28/09 Revision No. 2
Page 29 of 80
June 9th, 2008, of the sixty boats that may be docked at the marina, 12 have toilets, and none are lived on. The marina offers pump-out services to its clients. This marina is located in the Casco Bay No Discharge Zone, and is a member of Clean Marinas. This marina is located in a conditionally approved area; the area is in closed status from May 1st through November 15th, when the marina is in operation and more than 10 boats with heads may be present. A dilution calculation was completed to verify that the closure area is of adequate size. Based on 12 boats (2 people per boat) that are capable of discharging waste, and a mean discharge depth of 8 ft, a 35 acre closure is required to protect pubic health; the current closure is 87 acres. The Sebasco Hotel in Phippsburg has transient mooring space for 25 yachts. Based on 25 boats (2 people per boat) that are capable of discharging waste, and a mean discharge depth of 15 ft, a 37 acre closure around this marina is required to protect pubic health. This marina is situated in a prohibited area, greater than 100 acres in size. In addition to the two marinas, Basin Cove, Phippsburg is a popular anchorage spot for larger sail boats in the summer months. There are no pump-out stations or other sanitation facilities available at this location. For the next sanitary survey, due after 2010 field season, seasonal boating activity should be monitored and assessed. While water quality at the three sampling stations that monitor the Basin (WL 75, 76 and 77) continues to meet approved classification standards, water quality trends for station WL 77 have shown an increase in scores over the past 2 years. While the cause for this upward trend is unknown, discharge from boats may be contributing to higher scores, and thus seasonal use of this area should be monitored more closely.

WL Triennial 2008 Effective Date 7/28/09 Revision No. 2
Page 30 of 80
Figure 11. Marinas in Growing Areas WL

WL Triennial 2008 Effective Date 7/28/09 Revision No. 2
Page 31 of 80
Stormwater Stormwater runoff is generated when precipitation from rain and snowmelt events flows over land or impervious surfaces and does not percolate into the ground. As the runoff flows over the land or impervious surfaces (paved streets, parking lots, and building rooftops), it accumulates debris, chemicals, sediment or other pollutants that could adversely affect water quality if the runoff is discharged untreated (US EPA 2009). Thus, stormwater pollution is caused by the daily activities of people within the watershed. Currently, polluted stormwater is the largest source of water quality problems in the United States (Stormwater Protection in Maine, 2009). The primary method to control stormwater discharges is the use of best management practices (BMPs). In addition, most major stormwater discharges are considered point sources and require coverage under an NPDES permit. In 1990, under authority of the Clean Water Act, the U.S. EPA promulgated Phase I of its stormwater management program, requiring permitting through the National Pollution Discharge Elimination System (NPDES). The Phase I program covered three categories of discharges: (1) “medium” and “large” Municipal Separate Storm Sewer Systems (MS4s) generally serving populations over 100,000, (2) construction activity disturbing 5 acres of land or greater and (3) ten categories of industrial activity. In 1999, US EPA issued Phase II of the stormwater management program, expanding the Phase I program to include all urbanized areas and smaller construction sites. Currently, no towns within the boundary of growing area WL fall under Phase I or II of EPA’s stormwater management program. The Town of Brunswick is the only town in area WL with a municipal stormwater collection system in place to control stormwater runoff (Figure 12). Based on the information provided by the town engineer, there are three or so catch basins located on Old Bath Rd at the intersection of Bridge Road that drain east into the New Meadows River. The pipe from these catch basins daylights into an open ditch just east of the intersection, and the water flows through a grass lined ditch before discharging into the river (prohibited area at the head of the Upper New Meadows Lake, monitored by station WL 36.9). The catch basins which are located west of this intersection on Old Bath Road drain west into Bonney Brook, which ultimately drains north to the Androscoggin River and not the New Meadows watershed. There are also six catch basins located on Harding Road, south of the Rt 1 bridge. The stormwater from these catch basins drains east toward the railroad tracks (boundary line for Marina Conditionally Approved Area and Approved Area), and the pipe daylights into an open and grass lined ditch before discharging into a marshy area that ultimately drains into the New Meadows River. Pollution associated with this stormwater discharge is monitored by station WL 36.10. There are also several catch basins located on Gurnet Rd (not shown on Figure 10), near the Brunswick/ Harpswell town line. Stormwater from these basins drains into the New Meadows River, south of Thomas Bay. Pollution associated with this stormwater discharge is monitored by stations WL 25, 28 and 30 (Approved) and WL 26 and 27 (Restricted). All catch basins are cleaned every three years, and the waste material from the catch basins is removed and delivered to a landfill off-site. There are no structural stormwater management systems in the towns of Phippsburg, Harpswell, and West Bath. Stormwater in these areas would either percolate through the soil, with rates depending on soil type and depth above the bedrock layer; or flow overland directly

WL Triennial 2008 Effective Date 7/28/09 Revision No. 2
Page 32 of 80
into streams, gullies and coastal waters. Any pollution associated with stormwater drainage in areas where no structural facilities exist is monitored by growing area WL water quality monitoring stations, as well as by collecting samples from selected streams after adverse weather conditions. Figure 12. Brunswick Stormwater Features in the New Meadows Watershed
Map courtesy of Town of Brunswick Non-Point Pollution from Streams Streams are a source of fresh water to the New Meadows watershed, and carry stormwater, snowmelt and groundwater into the coastal estuaries. Waste, including that containing fecal matter, which is deposited on land, may be carried by streams to shellfish growing areas, contributing to elevated fecal counts in waters that are filtered by shellfish. In 2008, ten streams were selected for sampling, based on the water quality trends of the nearby water quality monitoring stations; water quality aspects that were considered in selecting the stream locations included the current P90 scores and recent P90 trends, geometric means and standard deviation, and the maximum scores in the dataset for each station (Table 4 and Figure 13). All streams were sampled multiple times, and under varying weather conditions. The rainfall accumulation (Brunswick rainfall reporting station) for the 72 hours preceding sampling dates was as follows: July 22, 2008= 0.25 inches; August 6, 2008= 0.3 inches and >1.5 inches 5 days prior to collection; September 23, 2008= 0 inches; October 8, 2008= 0 inches; and November 19, 2008=0 rain, with >0.7 inches of rain 6 days prior to collection. Flow rates were estimated on each day of collection.

WL Triennial 2008 Effective Date 7/28/09 Revision No. 2
Page 33 of 80
Stream S1 WL 14 is located on Indian Point, Harpswell, and drains into a small unnamed cove, which is currently classified as approved and monitored by station WL 14. The stream sampling station is located approximately 200 ft from the head of the cove. The area was surveyed in 2008, and no problems were identified within the vicinity of this stream. Two of the three samples collected in 2008 had high scores (200 and 75 CFU/100 ml on August 6 2008 and October 8, 2008, respectively. The flow rate on October 8, 2008 was significantly higher than the flow rate noted in August, and thus the impact of the stream would be greater based on the October results. A dilution calculation was completed based on the October data: using fecal concentration of 80 CFU/100, flow rate of 108,000 gpd, and the depth of receiving water of 3 feet, a closure of at least 0.6 acres is recommended. Stream S1 WL 31 is a tidal channel at the head of Thomas Bay. The channel was sampled twice in 2008, both times after rainfall. Both scores came back relatively low (34 and 5.1 CFU/100 ml), and no additional sampling was conducted under dry conditions. Stream S1 WL 36.9 drains into the head of Upper New Meadows Lake (prohibited area), approximately 300 ft from station WL 36.9. The stream flows parallel to the eastern shore of the lake, just east of the New Meadows Road in West Bath. Three of the four samples collected at the outlet of this stream had elevated scores. Currently, the stream drains into a 10 acre prohibited area, and is monitored by station WL36.9, which has met the NSSP approved standard for the past 5 years. No additional action is required around the outlet of this stream. Stream S1 WL 42 is a small stream that drains into the head of Broad Cove, in West Bath. There are no water quality stations at the head of the cove that monitor the impact of this stream. One of the four samples collected in 2008 showed an elevated score of 200 CFU/100ml. Due to access issues, the stream was sampled off Hill Road, approximately 3,300 feet from the point at which the stream drains into the cove. Most of the area surrounding the stream is forested (undeveloped), however, there is a house at the mouth of the stream, approximately 600 to 700 ft from the shore. In order to properly assess the impact of the entire drainage area surrounding this stream on water quality in Back Cove, the stream monitoring station should be moved closer to the mouth of the stream. Additionally, a new sample station should be created near the mouth of the stream, in order to monitor water quality at the head of Back Cove. Stream S1 WL 44.5 drains a small pond, located at the head of Long Cove in West Bath. This area was upgraded from prohibited to approved in May 2008, and stream sample collection was recommended as part of the 2007 Annual Water Quality Update report. On July 22, 2008 and August 23, 2008, no flow between the pond and the cove were observed, and the head of the Pond (at culvert) was sampled instead. On the August sample date, the pond samples were slightly elevated, with fecal scores of 53 CFU/100 ml. On the remaining three sampling dates, flow between the cove and the pond and the cove were observed, and samples were collected at the point where the stream flows into Long Cove; the results from these three samples showed good water quality. Based on these data, no changes in classification are required around the area where this stream drains into Long Cove. Further stream sampling is recommended, especially under adverse conditions (precipitation ≥0.5”).

WL Triennial 2008 Effective Date 7/28/09 Revision No. 2
Page 34 of 80
Stream S1 WL 47 drains into the eastern most lobe of Mill Cove, West Bath and the area is currently classified as approved. The stream showed one high score (160 CFU/100ml), from a sample collected after rainfall in July. The remaining three samples showed good water quality. The stream flow that was estimated at the time that the high sample was collected was 13 gpm (18,720 gpd). Based on this flow rate, a fecal concentration of 160 CFU/100 ml, and the depth of receiving water if 4 ft, a 0.2 acre closure zone surrounding the mouth of the stream would be needed for the polluted stream water to be diluted to approved standards. However, since 2008 was the first year that stream samples were collected in this area, and since only one of four samples showed elevated scores, more samples should be collected and reviewed in 2009, prior to implementing a closure around the mouth of the stream. Stream S1 WL 51 (Dam Cove Creek) drains into the restricted area of Dam Cove, West Bath. Due to access issues, this stream sampling location is located approximately 4000 ft from the point at which the stream enters the cove, thus the samples at this location most likely do not capture all of the pollution sources that may drain into the cove. Two of the four samples that were collected ion 2008 yielded high scores. Since the entire cove is currently classified as restricted, and an upward classification is not being recommended at this time, this stream is not recommended for further sampling in the coming review year. Stream S1 WL 68 is an intermittent stream that drains into the small prohibited area at the head of Brighams Cove, West Bath/Phippsburg town line. The stream was attempted to be sampled twice, once on August 6, 2008 and again on September 23, 2008; on both occasions there was not enough flow in the stream to collect a sample. Stream S1 WL 71 (Pasture Brook) drains into an approved area of Winnegance Bay, Phippsburg, approximately 825 ft east of station WL 71. Station WL 71 has had generally good water quality, with the highest score over the past 30 samples collected under the SRS schedule being 118 CFU/100ml. The area was upgraded in classification from prohibited to approved in May 2008, and stream sampling in this area was recommended as part of the 2007 Annual Water Quality Update report. Of the four samples collected in 2008, only one came back with an elevated score of 50 CFU/100ml; the flow rate on this sampling date was estimated at 15 gpm. Based on the data collected in 2008, no changes in classification are required around the area where this stream drains into the Winnegance Bay. Stream S1 WL 77 drains into an approved area of The Basin, in Phippsburg. The area surrounding this stream is under a conservation easement, and there is no development within the stream’s drainage basin, and is likely that any fecal pollution associated with this stream is from wildlife. Only one sample collected at this stream yielded a high score; the flow rate at the time that this sample was collected was very low. Based on the data collected in 2008, no changes in classification are required around the area where this stream drains into the Basin. Stream S1 WL 96 (North Creek, Phippsburg) had the highest fecal scores of all the streams sampled in growing area WL. The small stream is located off Rt. 217, and drains into the head of Tottman Bay, Phippsburg. Currently, Tottman Bay is classified as conditionally approved based on season, with the closed status from July 1 through September 30. While the two high scores from samples collected in 2008, it is recommended that this stream continues to be monitored in the coming review year, both just before the closed status begins, and right after

WL Triennial 2008 Effective Date 7/28/09 Revision No. 2
Page 35 of 80
the area is reopened in October to confirm that the closed status corresponds to the period when stream scores are expected to be high. Additional survey work is also recommended in the area surrounding the headwaters of this stream, in order to further investigate the source of this pollution. Table 4. Growing Area WL Stream Samples, 2008
Fecal Score CFU/100ml (Estimate Flow Rate in gpm) Stream Site ID
Nearest Station
Area Class 7/22/2008 8/6/2008 9/23/2008 10/8/2008 11/19/2008
S1 WL 14 WL 14 A - 200 (10) - 80 (75) 5.5 (45) S1 WL 31 WL 31 A 34 (tidal) 5.5 (tidal) - - -
S1 WL 36.9 WL36.9 P - 180 (tidal) 112 (8) 16 (50) 46 (75) S1 WL 42 WL 42 A - 220 (20) 18 (25) 24 (85) 6 (85)
S1 WL 44.5 WL 44.5 A 9.5 58 (0) 5.5 (35) 3.6 (100) <2 (100) S1 WL 47 WL 47 A - 160 (13) 13 (20) 7.3 (65) <2 (65) S1 WL 51 WL 51 R - 200 (8) 78 (18) 2 (75) 4 (100) S1 WL 66 WL 66 R - - S1 WL 71 WL 71 A - 50 (15) 2 (18) 2 (65) 2 (98) S1 WL 77 WL77 A - 142 (20) 14 (45) <2 (170) 2 (200) S1 WL 96 WL 96 CA - 650 (18) >1600 (8) 15 (12) <2 (15)

WL Triennial 2008 Effective Date 7/28/09 Revision No. 2
Page 36 of 80
Figure 13. WL Stream Sample Locations

WL Triennial 2008 Effective Date 7/28/09 Revision No. 2
Page 37 of 80
Agricultural Activities There are no large scale agricultural facilities on or near the shoreline of growing area WL. However, there are several smaller-scale family farms that have the potential to impact water quality along the shoreline of this growing area. There is a small, organic farm located on Thomas Bay, Brunswick (Farm 1 in Figure 14). The farm grows organic vegetables and has approximately 30 laying hens and some rabbits. The farm was surveyed in 2008 by DMR and the town of Brunswick shellfish warden; at the time of survey, a manure pile was noted within 15 ft of the bank of a small stream that drains into Thomas Bay. Since the survey, the farm has agreed to implement best management practices, and have enclosed the manure pile with a wooden retaining wall, in order to minimize run-off after rain events. The manure is not produced at this farm; it is only used as an organic fertilizer on the vegetable plots. There is another farm located in Brunswick, on the upper portion of New Meadows Lake (Farm 2). This farm has 20 to 30 heads of cattle, which are pastured on the west side of Peterson Lane, which runs parallel to the lake. The pasture is sloped away from the shoreline of the lake. There is another pasture area on the east side of the road (adjacent to lake shore), however, this pasture is rarely used for grazing (up to 1 week per year). Both pasture areas have buffer fencing that exclude cattle from low areas and gullies which may collect run-off from heavy rainstorms. Grass inside the buffer areas are not mowed, in order to slow water run-off. In 2008, several attempts were made to sample run-off draining from the farm towards shore after rain events; in both instances, no flow was observed in the gullies, and thus samples were not collected. Based on the information provided by the farmer and a visual assessment of the property by DMR, this farm is not a likely source of pollution to the New Meadows Lake. There is a small, family owned farm (Farm 3) located near the head of Tottman Cove, Phippsburg. This farm grows and sells organic produce, eggs, and flowers. Based on the current re-evaluation, this farm is not a source of pollution to Tottman Cove. Domestic Animals and Wildlife Activity Domestic animals can have an adverse impact on water quality if their waste is not properly managed and disposed of. During the survey activity over the past three years, there were several properties where the presence of animal waste was noted (BRUN L PS 9, 15 and 17; locations and description of these properties are provided in Table 1). These properties will be re-evaluated for the next sanitary survey report, and if these animal waste problems persist, necessary closures will be implemented. There is an equestrian training and boarding center located in the headwaters of the New Meadows River, in Brunswick (Figure 14). The facility has two barns, with boarding room for up to 20 horses. The facility also has an outdoor exercise arena. This facility is located well over 500 feet away from the shoreline of the upper New Meadows marsh area (prohibited area), and has no streams draining the property to shore; there is also a buffer of vegetation between the property and the marsh. There was an uncovered manure pile observed at the property, but it is improbable that any run-off generated on the property will drain into the marsh.

WL Triennial 2008 Effective Date 7/28/09 Revision No. 2
Page 38 of 80
There were several areas in growing area WL were the presence of 5 or less horses were noted in the last triennial review. In 2008, these areas were revisited to re-evaluate the impact the animals may be having on the growing area. In Brunswick, one horse was observed at a property located off Thomas Point. The property was surveyed in spring 2008, and no problems were noted. In West Bath, horses were noted just north of station WL 42; in 2008, a drive through survey identified 2 horses pastured south of Broad Cove Road, well over 500 feet from western shore of Back Cove. Station WL 42 maintains good water quality. In Phippsburg, fenced in pastures were observed in two location near the shoreline, however, over the course of the year, no animals were ever observed to be pastured at these locations. These areas will be monitored for animal activity during drive through surveys and sampling runs in the coming review year. In addition to domestic animals, wildlife can also have an adverse impact on water quality. While wildlife, especially wildfowl, can be occasionally observed in small numbers throughout the entire New Meadows River Watershed, wildlife has been frequently noted in the area surrounding water quality stations WL 14 and WL 27; both of these stations meet their current NSSP Classification standard. Additionally, the marsh located north of New Meadows Lake has been identified as a suitable shorebird and wading bird habitat (Town of Brunswick, 2009). The entire marsh area, as well as the upper portion of the New Meadows Lake is currently classified as prohibited.

WL Triennial 2008 Effective Date 7/28/09 Revision No. 2
Page 39 of 80
Figure 14. Farms in Growing Area WL

WL Triennial 2008 Effective Date 7/28/09 Revision No. 2
Page 40 of 80
Conservation/Recreation Areas There are three recreational areas in growing area WL that have the potential to impact water quality due to increased shore use by people in the summer, and were reviewed as part of this report (Figure 15). Hermit Island Campground, located on a 255 acre peninsula in Small Point, at the southern tip of Phippsburg, has 225 campsites, as well as six beach access points, hiking trails, and a small marina and wharf. The campground does not allow pets. The campground has both flush toilets and dry vault toilets on site. A portion of the eastern shore of Hermit Island is classified as conditionally approved based on season, and is closed from June 1st through November 15th, when the campground is in operation. The Meadowbrook campground is located at the head of Brighams Cove, on Winnegance Bay, in Phippsburg. It offers over 100 campsites, with power and water hookups; the campground also has flush toilets on site. The campsites are not located directly on the shore, and the campsite does not provide shore access to its guests. Pets are not prohibited at this campsite, however, due the lack of shorefront access, fecal pollution from animal waste is not of concern in this area. Additionally, the head of Brighams Cove is currently classified as prohibited. Thomas Point Beach and Campground is located on Thomas Bay, in Brunswick. This facility offers 64 campsites from mid-May to September, as well as picnic spots, a playground and grounds for large gatherings (concerts, festivals, etc). Sanitation facilities are available on site for camping guest and day users; no sink or shower waste discharge onto the ground is allowed on the property, per park regulations. The sanitation facilities are maintained throughout the summer, and the septic tanks are pumped regularly. Pets less than 25 pounds are allowed at the campsites, however, no pets are permitted on the beach or any other public area of the park; immediate pet waste pick-up is required. Based on the current review, this area does not require any action to protect public health.

WL Triennial 2008 Effective Date 7/28/09 Revision No. 2
Page 41 of 80
Figure 15. WL Recreation Areas

WL Triennial 2008 Effective Date 7/28/09 Revision No. 2
Page 42 of 80
Water Quality Review and Discussion Table 5 lists all active stations in Growing Area WL, with their respective geometric mean (geo mean) and P90 calculations for 2007. A key to header titles can be found in Appendix D. The approved and restricted standards for each station area also displayed in this table. These standards will fluctuate yearly as a result of the DMR transition from an MPN fecal coliform test method to a membrane filtration (MF) method and area dependent on the number of samples analyzed by MPN versus MF. The total number of data points used in the calculations is displayed in the COUNT column and includes both MPN and MF values. The numbers of data points analyzed by MF are displayed in the MFCNT column. This fluctuating standard will cease when all 30 data points have been analyzed by the MF method. Please refer to Appendix E for more information about this transition.
All approved and restricted stations met their respective NSSP standard, with the exception of station WL 11 (Harpswell) and WL 46 (Mill Cove, West Bath). Both stations were downgraded in classification on December 31, 2008. Table 5. Fecal Coliform Report for Growing Area WL, 2002-2008 STATION CLASS CNT MFCNT GM SDV MAX P90 APPD_STD RESTR_STDWL005.00 P 30 15 3.2 0.39 93 10.0 39 221 WL006.00 A 30 14 3.5 0.44 240 12.8 40 226 WL007.00 A 30 14 3.5 0.31 28 8.7 40 226 WL010.00 P 30 14 3.5 0.35 34 9.8 40 226 WL011.00 A 30 14 6.3 0.66 320 43.9 40 226 WL012.00 A 30 16 4.5 0.47 93 17.8 38 217 WL014.00 A 30 15 4.6 0.55 200 23.2 39 221 WL015.00 A 30 15 4.0 0.39 80 12.7 39 221 WL018.00 A 30 15 5.3 0.60 1700 31.3 39 221 WL019.00 A 30 15 3.8 0.37 43 11.3 39 221 WL020.00 A 30 15 5.3 0.47 130 21.2 39 221 WL021.00 A 30 15 5.2 0.56 140 27.0 39 221 WL022.00 A 30 14 5.0 0.51 146 22.4 40 226 WL022.50 New 4 4 WL023.00 A 30 14 3.6 0.35 44 10.1 40 226 WL025.00 R 30 14 5.2 0.59 460 29.5 40 226 WL026.00 R 30 15 7.6 0.69 460 58.1 39 221 WL027.00 R 30 14 4.6 0.46 460 18.2 40 226 WL028.00 A 30 14 3.8 0.48 460 15.6 40 226 WL030.00 A 30 14 4.1 0.36 29 11.9 40 226 WL031.00 A 30 14 4.0 0.39 40 12.9 40 226 WL033.00 A 30 14 4.9 0.47 93 19.2 40 226 WL034.50 P 30 14 4.2 0.51 240 19.1 40 226 WL036.50 A 30 14 4.2 0.33 23 11.3 40 226 WL036.70 R 30 14 3.8 0.53 240 18.5 40 226 WL036.90 P 30 14 5.3 0.57 98 29.0 40 226

WL Triennial 2008 Effective Date 7/28/09 Revision No. 2
Page 43 of 80
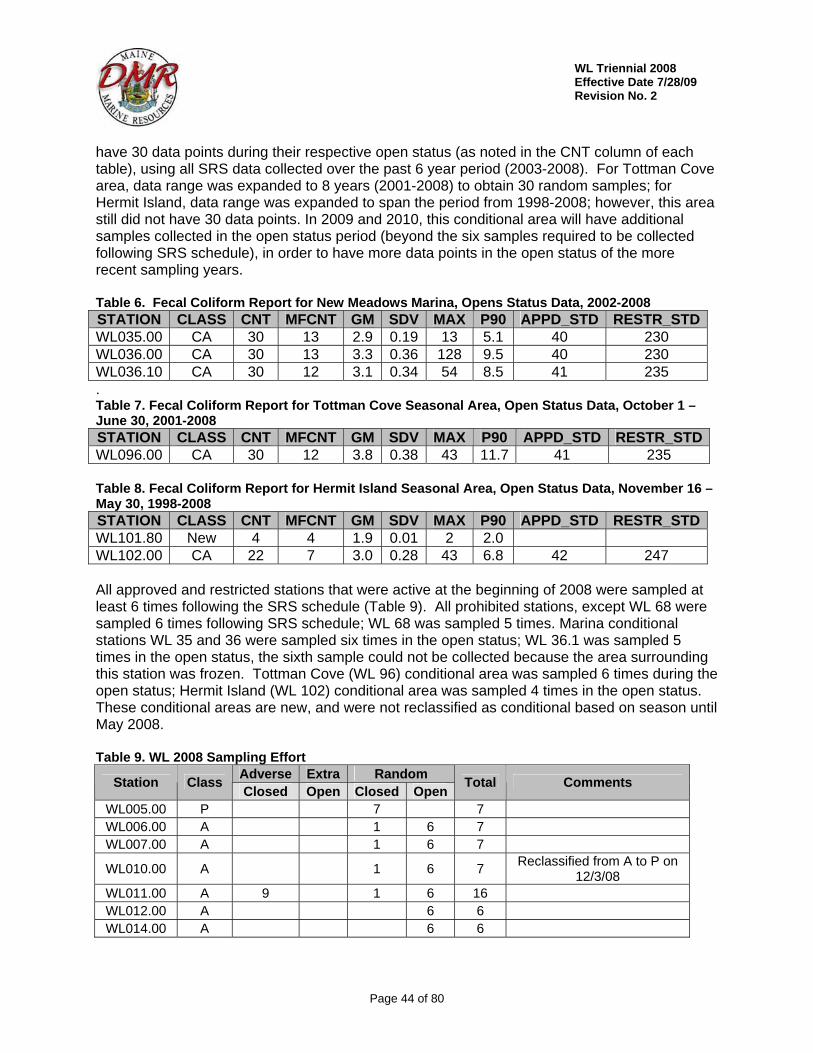
STATION CLASS CNT MFCNT GM SDV MAX P90 APPD_STD RESTR_STDWL037.00 R 30 14 6.3 0.74 1149 56.3 40 226 WL037.50 R 30 14 4.7 0.57 460 25.7 40 226 WL038.00 A 30 14 2.8 0.25 23 5.9 40 226 WL040.00 A 30 14 5.1 0.60 240 30.1 40 226 WL042.00 A 30 14 3.5 0.40 93 11.3 40 226 WL044.00 A 30 14 2.6 0.12 4 3.6 40 226 WL044.50 A 30 14 5.3 0.60 1100 30.5 40 226 WL045.00 A 30 14 4.9 0.64 1140 32.8 40 226 WL046.00 A 30 14 6.6 0.77 1700 63.6 40 226 WL047.00 A 30 14 5.6 0.58 460 30.8 40 226 WL048.00 A 30 14 4.4 0.58 1200 23.9 40 226 WL048.50 A 30 14 3.3 0.33 43 8.8 40 226 WL049.00 A 30 14 3.2 0.48 460 13.0 40 226 WL051.00 R 30 14 4.5 0.54 460 22.3 40 226 WL052.00 R 30 14 6.2 0.70 1200 49.2 40 226 WL054.00 A 30 14 3.2 0.35 93 9.0 40 226 WL057.00 A 30 14 4.2 0.60 460 24.9 40 226 WL060.00 A 30 14 3.6 0.45 93 13.5 40 226 WL063.00 A 30 14 4.6 0.59 1200 26.1 40 226 WL066.00 New 26 11 4.9 0.55 240 25.4 WL068.00 P 30 13 6.8 0.71 1100 54.6 40 230 WL070.00 A 30 14 3.4 0.34 43 9.3 40 226 WL071.00 A 30 14 5.2 0.54 118 25.2 40 226 WL073.00 R 30 14 4.2 0.64 1700 28.1 40 226 WL075.00 A 30 14 3.1 0.31 43 7.7 40 226 WL076.00 A 30 14 4.3 0.48 43 17.7 40 226 WL077.00 A 30 15 5.2 0.58 240 28.8 39 221 WL079.00 A 30 14 3.3 0.48 460 13.6 40 226 WL081.00 P 30 14 5.6 0.64 460 37.0 40 226 WL085.00 P 30 14 7.7 0.70 1200 60.2 40 226 WL087.00 R 30 14 5.3 0.61 150 32.4 40 226 WL087.20 New 6 6 2.5 0.29 10 6.1 WL089.00 P 30 14 3.7 0.38 48 11.4 40 226 WL095.50 New 21 14 2.6 0.19 9.1 4.5 WL097.00 New 28 14 2.9 0.40 240 9.6 39 221 WL098.00 P 30 15 4.7 0.45 78 17.9 39 221 WL099.00 A 30 14 2.9 0.25 34 6.1 40 226 WL101.00 A 30 14 4.6 0.45 43 17.3 40 226 WL101.80 New 7 7 1.9 0.01 2 2.0 WL103.00 A 30 14 3.2 0.34 126 8.7 40 226 Geomean and P90 scores for conditionally approved stations in WL are presented in Tables 6, 7 and 8. Tottman Cove and Hermit Island Seasonal Conditionally Approved areas were reviewed and implemented as part of the 2007 WL annual report. All conditional station in area WL met the NSSP approved standards in 2008. Since these areas are new, they do not yet
WL Triennial 2008 Effective Date 7/28/09 Revision No. 2
Page 44 of 80
have 30 data points during their respective open status (as noted in the CNT column of each table), using all SRS data collected over the past 6 year period (2003-2008). For Tottman Cove area, data range was expanded to 8 years (2001-2008) to obtain 30 random samples; for Hermit Island, data range was expanded to span the period from 1998-2008; however, this area still did not have 30 data points. In 2009 and 2010, this conditional area will have additional samples collected in the open status period (beyond the six samples required to be collected following SRS schedule), in order to have more data points in the open status of the more recent sampling years. Table 6. Fecal Coliform Report for New Meadows Marina, Opens Status Data, 2002-2008 STATION CLASS CNT MFCNT GM SDV MAX P90 APPD_STD RESTR_STDWL035.00 CA 30 13 2.9 0.19 13 5.1 40 230 WL036.00 CA 30 13 3.3 0.36 128 9.5 40 230 WL036.10 CA 30 12 3.1 0.34 54 8.5 41 235 . Table 7. Fecal Coliform Report for Tottman Cove Seasonal Area, Open Status Data, October 1 – June 30, 2001-2008 STATION CLASS CNT MFCNT GM SDV MAX P90 APPD_STD RESTR_STDWL096.00 CA 30 12 3.8 0.38 43 11.7 41 235 Table 8. Fecal Coliform Report for Hermit Island Seasonal Area, Open Status Data, November 16 – May 30, 1998-2008 STATION CLASS CNT MFCNT GM SDV MAX P90 APPD_STD RESTR_STDWL101.80 New 4 4 1.9 0.01 2 2.0 WL102.00 CA 22 7 3.0 0.28 43 6.8 42 247 All approved and restricted stations that were active at the beginning of 2008 were sampled at least 6 times following the SRS schedule (Table 9). All prohibited stations, except WL 68 were sampled 6 times following SRS schedule; WL 68 was sampled 5 times. Marina conditional stations WL 35 and 36 were sampled six times in the open status; WL 36.1 was sampled 5 times in the open status, the sixth sample could not be collected because the area surrounding this station was frozen. Tottman Cove (WL 96) conditional area was sampled 6 times during the open status; Hermit Island (WL 102) conditional area was sampled 4 times in the open status. These conditional areas are new, and were not reclassified as conditional based on season until May 2008. Table 9. WL 2008 Sampling Effort
Adverse Extra Random Station Class Closed Open Closed Open Total Comments
WL005.00 P 7 7 WL006.00 A 1 6 7 WL007.00 A 1 6 7
WL010.00 A 1 6 7 Reclassified from A to P on 12/3/08
WL011.00 A 9 1 6 16 WL012.00 A 6 6 WL014.00 A 6 6

WL Triennial 2008 Effective Date 7/28/09 Revision No. 2
Page 45 of 80
Adverse Extra Random Station Class Closed Open Closed Open Total Comments
WL015.00 A 9 6 15 WL018.00 A 6 6 WL019.00 A 1 6 7 WL020.00 A 1 6 7 WL021.00 A 6 6 WL022.00 A 11 6 17 WL022.50 NEW 4 4 New Station WL023.00 A 6 6 12 WL025.00 R 6 6 WL026.00 R 6 6 WL027.00 R 6 6 WL028.00 A 6 6 WL030.00 A 6 6 WL031.00 A 6 6 WL033.00 A 6 6 WL034.50 P 6 6 WL035.00 CA 3 6 9 WL036.00 CA 6 3 6 15 WL036.10 CA 4 5 9 WL036.50 A 6 6 WL036.70 R 6 6 WL036.90 P 6 6 WL037.00 R 1 6 7 WL037.50 R 1 6 7 WL038.00 A 1 6 7
A 4 WL040.00 P 3
7 Reclassified from P to A on 6/13/08
WL042.00 A 1 6 7 WL044.00 A 1 6 7
A 4 WL044.50 P 3
7 Reclassified from P to A on 5/30/08
WL045.00 A 1 6 7 WL046.00 A 10 1 6 17 Flood Station
A 4 WL047.00 R 1 2
7 Reclassified from R to A on 5/30/08
WL048.00 A 1 6 7 WL048.50 A 1 6 7 WL049.00 A 5 1 6 12 WL051.00 R 10 1 6 17 Flood Station
P 3 WL052.00 R 4
7 Reclassified from P to R on 5/30/08
A 4 WL053.00 P 3
7 Reclassified from P to A on 5/30/08

WL Triennial 2008 Effective Date 7/28/09 Revision No. 2
Page 46 of 80
Adverse Extra Random Station Class Closed Open Closed Open Total Comments
A 4 WL054.00 P 3
7 Reclassified from P to A on 5/30/08
A 4 WL057.00 P 3
7 Reclassified from P to A on 5/30/08
A 4 WL060.00 P 3
7 Reclassified from P to A on 5/30/08
WL063.00 A 1 6 7 WL066.00 A 10 1 6 17 Flood Station WL068.00 P 6 6
A 1 4 WL070.00 P 2
7 Reclassified from P to A on 5/30/08
A 1 4 WL071.00 P 2
7 Reclassified from P to A on 5/30/08
P 2 WL073.00 R 1 4
7 Reclassified from A to R on 5/30/08
WL075.00 A 1 6 7 WL076.00 A 1 6 7 WL077.00 A 9 1 6 16 Flood station WL079.00 A 1 6 7 WL081.00 P 7 7 WL085.00 P 7 7 WL087.00 R 1 6 7 WL087.20 R 1 6 7 WL089.00 P 7 7 WL095.50 P 7 7
CA 2 4 WL096.00 R 2
8 Reclassified from R to CA on 5/30/08
WL097.00 A 1 6 7 WL098.00 P 7 7 WL099.00 A 1 6 7 WL101.00 A 1 6 7 WL101.80 A 1 7 8
CA 4 2 WL102.00 R 2
8 Reclassified from R to CA on 5/30/08
WL103.00 A 1 6 7 Figures 16 and 17 show the P90 trends over the past three years, for all approved, and conditionally approved stations in growing area WL; figure 17 shows data collected during the open status only. During the transition from MPN to MF analysis method, the approved standard will decrease every year, until all samples have been analyzed by the MF method. In order to show the trend of the P90 value over the years, the calculated P90 scores are expressed as a percentage of the approved standard; any station showing the 2008 column on or above 100 percent does not meet the standard for approved classification. Generally, most

WL Triennial 2008 Effective Date 7/28/09 Revision No. 2
Page 47 of 80
approved stations have shown steady or improving water quality over the past three years. Three stations have shown a significant decline in water quality over the past 3 years, and are currently over 50 percent of the approved standard. Station WL 18, located near the Gurnet Straight was surveyed in 2008, and no actual or potential problems were identified; thus the cause of the rising scores is unknown. Station WL 20, located in Doughty Cove has shown a steady increase in scores over the past two years; this station is located near two potential pollution sources, and follow-up work is recommended to further elucidate the cause of the problem. Station WL 77, located in the Basin, Phippsburg has a slight increase in score since 2007, however, a significant increase in its score between 2006 and 2007. Boating activity in the Basin may be contributing to elevated scores at this station, and further investigatory work is recommended. Two stations (WL 11 and 46) that surpass the 100 percent line have been downgraded in classification. All conditionally approved stations are well under the limit of their classification standard. The New Meadows River Marina stations (WL 35, 36 and 36.1) have maintained good water quality over the past three years; all three stations were under 25 percent of the approved standard. Station WL 96 and 102 are located in new conditional areas and trends for these two stations will be assessed as more data are collected in the open status over the coming review years. Figure 16. P90 scores (as percent of approved standard) for WL stations Classified as Approved
0
50
100
150
200
250
WL006
.00
WL007
.00
WL011
.00
WL012
.00
WL014
.00
WL015
.00
WL018
.00
WL019
.00
WL020
.00
WL021
.00
WL022
.00
WL023
.00
WL028
.00
WL030
.00
WL031
.00
WL033
.00
WL036
.50
WL038
.00
WL040
.00
WL042
.00
WL044
.00
WL044
.50
WL045
.00
WL046
.00
WL047
.00
WL048
.00
WL048
.50
WL049
.00
WL054
.00
WL057
.00
WL060
.00
WL063
.00
WL070
.00
WL071
.00
WL075
.00
WL076
.00
WL077
.00
WL079
.00
WL099
.00
WL101
.00
WL103
.00
% a
ppro
ved
stan
dard
2006
2007
2008

WL Triennial 2008 Effective Date 7/28/09 Revision No. 2
Page 48 of 80
Figure 17. P90 scores (as percent of approved standard) for WL stations Classified as Conditionally Approved, Open Status only
0
5
10
15
20
25
30
35
40
45
50
WL 35.00 WL 36.00 WL 36.10 WL 96 WL 102
% a
ppro
ved
stan
dard
2006
2007
2008
Figure 18 shows P90 trends over the past three years for all restricted station in area WL; scores are shown as a percent of the restricted standard, and any station surpassing 100 percent no longer meets its classification standard. All restricted station in growing area WL are well under (30 percent or less) the limit of the restricted classification standard. Over the past review year, no station has shown a deterioration in water quality. Figure 18. P90 scores (as percent of restricted standard) for WL stations Classified as Restricted
0
5
10
15
20
25
30
35
40
WL25.0
WL26.0
WL27.0
WL36.7
WL37.0
WL37.5
WL51.0
WL52.0
WL73.0
WL87.0
% re
stric
ted
stan
dard
2006
2007
2008

WL Triennial 2008 Effective Date 7/28/09 Revision No. 2
Page 49 of 80
Upward Classification Requests New Meadows Lake The Upper New Meadows Lake is being proposed for an upward classification change, based on consistently good water quality data over the past 5 years, a rainfall analysis, and recently completed shoreline survey work. Until 2005, this area was classified as conditionally approved based on rainfall (1 inch in 24 hours), however, no rainfall study was conducted prior to this area receiving the conditional classification. As a result of the 2004 Triennial report, the area was downgraded to restricted, due to a violation of the management plan (inadequate rainfall reporting by non-DMR personnel). The entire shoreline has been surveyed in 2008 and no actual problems with the capacity to impact water quality were identified. Two potential problems, both located on the West Bath shore, were noted during the recent survey. These potential problems include a gulley drain to shore and a pipe from an inactive OBD (please refer to Table 1 and Figure 7 for more information). With the exception of the removal of three OBDs on the eastern shore of the lake, no changes in pollution sources have been reported or observed since the last sanitary survey was completed. One stream drains into the prohibited area at the head of the lake; this stream was sampled four times in 2008 and the results of these samples are presented and discussed in the Non-Point Pollution from Streams section of this report (Table 4 and Figure 13). Other pollution sources that are located on the New Meadows Lake, and were re-evaluated as part of this triennial report include a nearby farm that has 20-30 heads of cattle, stormwater drainages, and an equestrian center; please refer to the Re-evaluation of Existing Pollution Sources section of this report for complete reviews of each of these sources. The New Meadows Lake is monitored by stations WL 36.7 and 36.9; the latter station is located within a prohibited area at the head of the lake, but has served as the boundary station for the restricted/prohibited areas. Station 36.5 (approved station) monitors the boundary between the restricted area and the approved area south of the New Meadows Lake. All three stations have met approved standards since 2001; more recent trends over the past 5 review years are presented in Figure 19. While the stations have met approved standards based on P90 calculations using data collected using the SRS sampling technique, a more comprehensive data assessment and analysis was completed to determine whether seasonality or adverse weather conditions have a significant impact on water quality in New Meadows Lake. Tables 10, 11 and 12 show all data (random, extra, adverse, excluding data collected while area was under an emergency flood closure) collected from 2003 through 2008; cumulative rainfall recorded for the 72 hour period prior to the day of collection, as well as cumulative rainfall for 72 hour period prior to the day of collection plus the rainfall that occurred on the sample date are also noted on each table. None of the stations showed a seasonal effect, and station WL 36.5 showed no rainfall effect. Station WL 36.7 showed some rainfall effect after 1 inch of rain, and since 2003, had three scores that exceed the variability standard; however, the rainfall effect at this station was not consistent, and six samples, collected after at least 1 inch of rain in 72 hours prior to collection showed scores below the variability standard. Station WL 36.9, which is located near the mouth of a moderately polluted stream and near the point where the marshy area located to the north of the lake flows into the New Meadows Lake, received 5 elevated scores after rainfall, however, similar to station WL 36.7, the effect of rainfall on fecal coliform

WL Triennial 2008 Effective Date 7/28/09 Revision No. 2
Page 50 of 80
scores was not consistent. For both stations, while some rainfall effect has been noted, pollution loading that has occurred after rainfall of at least 1 inch has been intermittent and has not caused either station to exceed its NSSP P90 standard over the past 8 years, based on data collected following the SRS schedule technique. In order the assess the consistency of scores collected under rainfall conditions, the P90 scores for stations WL 36.7 and 36.9 were recalculated using data collected only after at least 0.25 inches of rainfall had occurred within 72 hours (Table 13) and 48 hours (Table 14) prior to each sample’s collection date; in both calculations, the 30 most recent data points (random and adverse samples, excluding flood samples) that met the rainfall condition were used. In completing this analysis, all data collected under dry condition, and thus less likely to be polluted by run-off and produce low scores, was removed from the dataset. In both calculations, station WL 36.7 met the approved standard. Station WL 36.9, which is located in a prohibited area showed scores over the approved standard when the P90 calculation excluded all dry weather data. This station is impacted by the stream that drains into the head of the lake, and is located within a ten acre prohibited area, which is of adequate size to achieve proper dilution. Tidal impact on station located within New Meadows Lake was note assessed, as tidal flow is restricted at the Rt 1 bridge, and the lake’s tidal range on a typical single tide is less than 2 feet (Craig 2006). Figure 19. P90 trends for New Meadows Lake Stations, 2004-2008
0
20
40
60
80
100
120
36.5 36.7 36.9
% a
ppro
ved
stan
dard
2004
2005
2006
2007
2008

WL Triennial 2008 Effective Date 06/26/09 Revision No.
Page 51 of 80
Table 10. Station WL 36.50, Rainfall and Seasonal Assessment, 2003-2008 Rain 72 hours
Rain 72 hours
+sample Date Strat Adv SAL% Jan Feb March April May Jun Jul Aug Sept Oct Nov Dec
0 0 9/15/2003 R - 32 <3 0 0 11/17/2003 R - 30 9.1 0 0 4/12/2004 R - 24 <3 0 0.16 5/10/2004 R - 25 <3 0 0 3/21/2005 R N 10 <3 0 0.001 4/12/2005 R - 21 <3 0 0 6/27/2005 R - 28 <3 0 0 3/27/2006 R - 28 <3 0 0 8/14/2006 R - 28 9.1 0 0 4/23/2007 R - 20 <2 0 0.52 11/26/2007 R P 26 <2 0 0 4/22/2008 R - 24 <2 0 0 5/13/2008 R - 24 <2 0 0.03 10/14/2008 R P 25 5.5
0.002 0.002 3/10/2003 R - 2 <3 0.002 0.002 5/8/2006 R - 26 <3 0.02 0.16 11/29/2006 R P 21 <2 0.03 0.07 6/9/2003 R P 30 3.6 0.06 0.06 4/9/2007 R T 14 <2 0.07 0.071 6/19/2006 R - 22 9.1 0.09 0.09 10/20/2003 R P 30 9.1 0.09 0.09 12/14/2004 R - 29 3.6 0.11 0.11 6/16/2008 R P 28 11
0.141 0.141 1/12/2003 R - 20 <3 0.17 0.17 8/5/2008 R - 29 <2 0.19 0.19 6/21/2004 R - 28 <3
0.261 0.291 7/20/2004 R - 30 <3 0.29 0.3 3/8/2004 R - 25 <3 0.34 0.34 10/13/2004 R - 30 23

WL Triennial 2008 Effective Date 06/26/09 Revision No.
Page 52 of 80
Rain 72 hours
Rain 72 hours
+sample Date Strat Adv SAL% Jan Feb March April May Jun Jul Aug Sept Oct Nov Dec
0.42 0.42 4/14/2003 R - 24 <3 0.42 0.42 9/25/2006 R P 29 12
0.511 0.511 7/14/2003 R - 30 <3 0.52 0.52 7/25/2007 R - 29 <2
0.541 0.541 2/23/2004 R P 32 3.6 0.59 1.01 8/15/2005 R P 30 9.1
0.681 1.371 8/11/2003 R P 31 <3 0.71 1.26 5/12/2003 R P 30 3.6 0.71 0.71 11/17/2008 R P 24 8 0.92 1.27 5/4/2005 R P 18 <3 1.01 1.01 9/12/2007 R P 30 11 1.27 1.29 11/8/2004 R - 28 <3 1.35 1.48 1/4/2005 R - 5 <3 1.36 1.361 12/8/2003 R P 28 <3 1.4 1.4 11/29/2004 R P 25 9.1 1.4 2.7 12/1/2004 A P 23 9.1 1.45 2.45 6/4/2007 R P 24 18 1.79 1.79 9/19/2005 R - 30 <3 3.35 3.35 8/24/2004 R P 26 3.6
Table 11. Station WL 36.70, Rainfall and Seasonal Assessment, 2003-2008
Rain 72 hours
Rain 72hours +day of sample
Date Strat Adv SAL% Jan Feb March April May Jun Jul Aug Sept Oct Nov Dec
0 0 9/15/2003 R - 30 <3 0 0 11/17/2003 R - 25 <3 0 0 4/12/2004 R - 18 <3 0 0.92 5/3/2004 A P 22 9.1 0 0.16 5/10/2004 R - 15 <3 0 0 3/21/2005 R N 0 <3
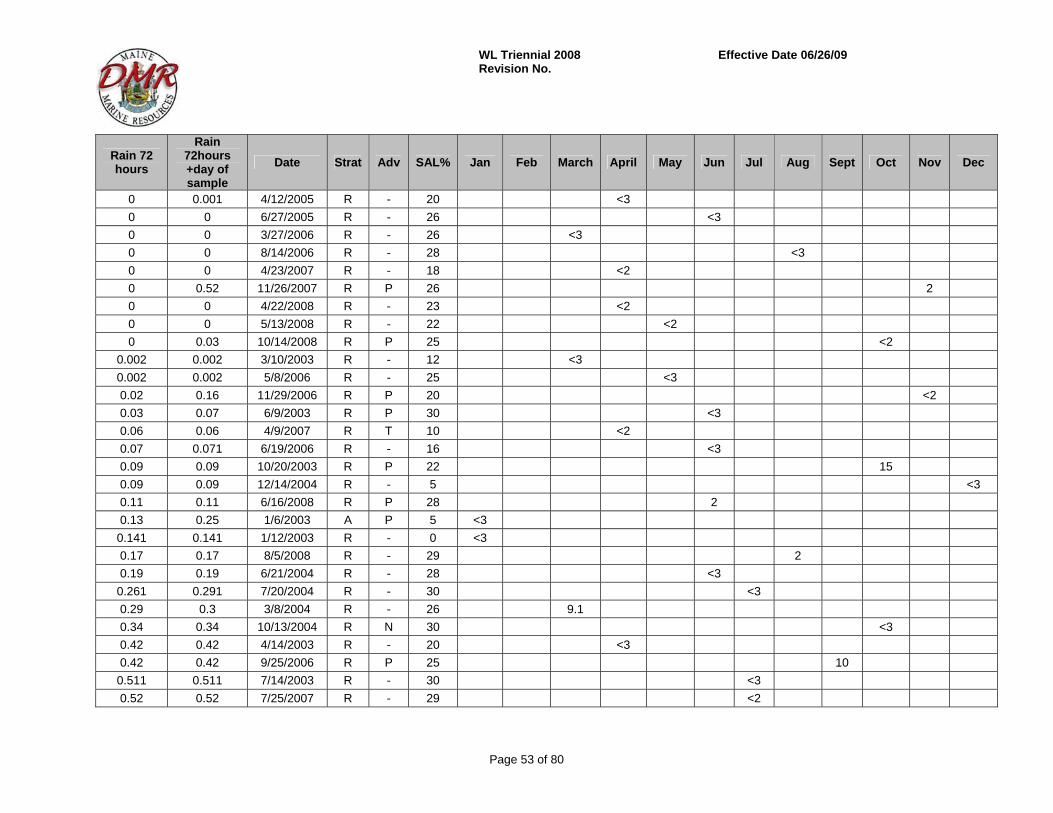
WL Triennial 2008 Effective Date 06/26/09 Revision No.
Page 53 of 80
Rain 72 hours
Rain 72hours +day of sample
Date Strat Adv SAL% Jan Feb March April May Jun Jul Aug Sept Oct Nov Dec
0 0.001 4/12/2005 R - 20 <3 0 0 6/27/2005 R - 26 <3 0 0 3/27/2006 R - 26 <3 0 0 8/14/2006 R - 28 <3 0 0 4/23/2007 R - 18 <2 0 0.52 11/26/2007 R P 26 2 0 0 4/22/2008 R - 23 <2 0 0 5/13/2008 R - 22 <2 0 0.03 10/14/2008 R P 25 <2
0.002 0.002 3/10/2003 R - 12 <3 0.002 0.002 5/8/2006 R - 25 <3 0.02 0.16 11/29/2006 R P 20 <2 0.03 0.07 6/9/2003 R P 30 <3 0.06 0.06 4/9/2007 R T 10 <2 0.07 0.071 6/19/2006 R - 16 <3 0.09 0.09 10/20/2003 R P 22 15 0.09 0.09 12/14/2004 R - 5 <3 0.11 0.11 6/16/2008 R P 28 2 0.13 0.25 1/6/2003 A P 5 <3 0.141 0.141 1/12/2003 R - 0 <3 0.17 0.17 8/5/2008 R - 29 2 0.19 0.19 6/21/2004 R - 28 <3 0.261 0.291 7/20/2004 R - 30 <3 0.29 0.3 3/8/2004 R - 26 9.1 0.34 0.34 10/13/2004 R N 30 <3 0.42 0.42 4/14/2003 R - 20 <3 0.42 0.42 9/25/2006 R P 25 10 0.511 0.511 7/14/2003 R - 30 <3 0.52 0.52 7/25/2007 R - 29 <2

WL Triennial 2008 Effective Date 06/26/09 Revision No.
Page 54 of 80
Rain 72 hours
Rain 72hours +day of sample
Date Strat Adv SAL% Jan Feb March April May Jun Jul Aug Sept Oct Nov Dec
0.541 0.541 2/23/2004 R P 0 <3 0.59 1.01 8/15/2005 R P 31 3.6 0.681 1.371 8/11/2003 R P 31 3.6 0.71 1.26 5/12/2003 R P 20 43 0.71 0.71 11/17/2008 R P 25 2 0.92 1.27 5/4/2005 R P 12 <3 1.01 1.01 9/12/2007 R P 20 78 1.27 1.29 11/8/2004 R - 26 <3 1.35 1.48 1/4/2005 R - 10 <3 1.36 1.361 12/8/2003 R P 24 3 1.4 1.4 11/29/2004 R P 20 240 1.4 2.7 12/1/2004 A P 26 <3
1.45 2.45 6/4/2007 R P 12 98 1.79 1.79 9/19/2005 R - 30 3.6 3.35 3.35 8/24/2004 R P 25 <3
Table 12. WL 36.90, Rainfall and Seasonal Assessment, 2003-2008
Rain 72
hours
Rain 72hours +day of sample
Date Strat ADV SAL% Jan Feb March April May Jun Jul Aug Sept Oct Nov Dec
0 0 9/15/2003 R - 32 5.7 0 0 11/17/2003 R - 30 <3 0 0 4/12/2004 R - 22 <3 0 0.16 5/10/2004 R - 24 <3 0 0 3/21/2005 R N 0 <3 0 0.001 4/12/2005 R N 18 <3 0 0 6/27/2005 R - 27 <3 0 0 3/27/2006 R - 26 <3 0 0 8/14/2006 R - 27 9.1

WL Triennial 2008 Effective Date 06/26/09 Revision No.
Page 55 of 80
Rain 72
hours
Rain 72hours +day of sample
Date Strat ADV SAL% Jan Feb March April May Jun Jul Aug Sept Oct Nov Dec
0 0 4/23/2007 R - 15 <2 0 0.52 11/26/2007 R P 22 <2 0 0 4/22/2008 R - 23 <2 0 0 5/13/2008 R - 23 <2 0 0.03 10/14/2008 R P 22 2
0.002 0.002 5/8/2006 R NW 26 <3 0.02 0.16 11/29/2006 R P 20 2 0.03 0.07 6/9/2003 R P 30 14 0.06 0.06 4/9/2007 R T 6 <2 0.07 0.071 6/19/2006 R - 15 20 0.09 0.09 10/20/2003 R P 18 9 0.09 0.09 12/14/2004 R - 3 3.6 0.11 0.11 6/16/2008 R P 28 6 0.17 0.17 8/5/2008 R - 29 <2 0.19 0.19 6/21/2004 R - 26 <3 0.261 0.291 7/20/2004 R - 27 3.6 0.34 0.34 10/13/2004 R N 30 <3 0.42 0.42 4/14/2003 R - 14 23 0.42 0.42 9/25/2006 R P 28 <2 0.511 0.511 7/14/2003 R - 30 <3 0.52 0.52 7/25/2007 R - 29 <2 0.541 0.541 2/23/2004 R P 28 30 0.59 1.01 8/15/2005 R P 30 23 0.681 1.371 8/11/2003 R P 31 3.2 0.71 1.26 5/12/2003 R P 30 3.6 0.71 0.71 11/17/2008 R P 5 22 0.92 1.27 5/4/2005 R P 12 <3 1.01 1.01 9/12/2007 R P 26 72 1.27 1.29 11/8/2004 R - 28 <3

WL Triennial 2008 Effective Date 06/26/09 Revision No.
Page 56 of 80
Rain 72
hours
Rain 72hours +day of sample
Date Strat ADV SAL% Jan Feb March April May Jun Jul Aug Sept Oct Nov Dec
1.35 1.48 1/4/2005 R N 0 75 1.36 1.361 12/8/2003 R P 24 <3 1.4 1.4 11/29/2004 R P 8 93 1.4 2.7 12/1/2004 A P 17 240
1.45 2.45 6/4/2007 R P 16 98 1.79 1.79 9/19/2005 R - 30 7.1 3.35 3.35 8/24/2004 R P 26 <3

WL Triennial 2008 Effective Date 06/26/09 Revision No.
Page 57 of 80
Table 13. Geomean and P90 Calculations for Upper New Meadows Lake Stations, Data Collected after Rainfall >0.25 inches in 72 hours
STATION Current CLASS CNT MFCNT GM SDV MAX P90 APPD_STD RESTR_STD
WL036.7 R 30 6 6.0 0.58 240 33.5 45 266 WL036.9 P 30 6 8.3 0.64 240 54.6 45 266 Table 14. Geomean and P90 Calculations for New Meadows Lake Stations, Data Collected after Rainfall >0.25 inches in 48 hours
STATION Current CLASS CNT MFCNT GM SDV MAX P90 APPD_STD RESTR_STD
WL036.7 R 30 6 6.4 0.59 240 36.5 45 266 WL036.9 P 30 6 9.5 0.67 240 69 45 266 Based on the analyses presented above, as well as the review of all existing pollution sources which may impact water quality in the New Meadows Lake, the following changes are recommended:1) the restricted portion of the lake may be upgraded from restricted to approved classification; 2) a new station be created on the east shore of the lake, to monitor the boundary of the approved and prohibited area; until this station has 30 data points, station WL 36.9, which is currently located within the prohibited area at the head of the lake, will continue to serve as the boundary station, and must meet approved standards; and 3) the prohibited area, which is currently 10 acres in size, should be expanded to provide a dilution area for any stormwater or run-off from pasture land or marsh, that may drain into the head of the New Meadows Lake from the Brunswick side of the watershed (Figure 20).

WL Triennial 2008 Effective Date 06/26/09 Revision No.
Page 58 of 80
Figure 20. Proposed Classification Changes for the New Meadows Lake

WL Triennial 2008 Effective Date 06/26/09 Revision No.
Page 59 of 80
Shoreline Survey Activity during Review Period The following shoreline survey work was completed between 2006 and 2008. Please refer to the Documentation of Pollution Sources section of this report for details on each identified pollution source. 2006 On March 30, 2006, all properties located in the Brightwater area of Phippsburg were re-surveyed by DMR staff; several improvements were documented. On September 11, 2006, 25 properties in Long Reach and Buttermilk Cove, Brunswick were surveyed by DMR staff. No problems were noted. Long Island, Harpswell was also surveyed; a straight pipe was identified and a closure was made. 2007 On August 10, 2007, 22 lots surveyed in Sabino Area, West Bath (Map U-22) by DMR staff. No actual problems were identified. One potential problem was identified off Sabino Road; the town CEO was notified. Two lots were recommended for a re-check within a few years. On October 2, 2007, 17 lots in West Bath Sabino area (map U23) were surveyed by DMR staff. No actual problems and one potential (indirect) problem were identified. On October 3, 2007, 10 lots in West Bath Sabino area (map R06 and R07 and U24) were surveyed by DMR staff. No actual problems and one potential (indirect) problem off Westside Drive were identified On October 9, 2007, 9 lots in West Bath (map U24) were surveyed by Don Card. One actual problem was identified; this pollution source was referred to the town CEO. Between October 10, 2007 and October 17, 2007, 45 properties in West Bath were surveyed, through Map U 25) by Don Card. No problems, other than several cellar drains (Potential/Direct, but not evident problems) were observed. 2008 A drive through survey of area WL conducted by DMR on February 12, 2008. On March 31, 2008 and April 1, 2008, DMR staff, town of Brunswick Natural Resource Planner, and the town of Brunswick Shellfish Warden surveyed 104 properties in Brunswick. Ten actual and ten potential problems were identified, and reported to the town for follow up and remediation work,

WL Triennial 2008 Effective Date 06/26/09 Revision No.
Page 60 of 80
On September 27, 2008, DMR, DEP and the town of Brunswick Shellfish Warden surveyed in the New Meadows area in Brunswick, starting from Map 43, and going through Map 49. A total of 21 properties were visited, and no problems were identified. On July 9, 2008, DMR, DEP and the town of Brunswick Shellfish Warden surveyed 18 properties on the upper New Meadows Lake, Brunswick. One actual problem was noted; this problem is located more than 500 ft away from shore, with a dense forest buffer in between the malfunction and the shoreline. This problem is not a Water Quality public health concern. Two farms were also visited as part of the survey. On August 1, 2008, eleven properties were sampled by DMR staff and town of Brunswick shellfish warden in the Gurnett Straight and Woodward Cove areas; no problems were noted. Four properties were surveyed in Buttermilk Cove area; no problems were noted. On August 6, 2008, a drive through survey and sampling of 10 streams was completed by DMR staff. On September 9, 2008, a drive through survey of the eastern shore of the lower New Meadows River (Phippsburg) was completed as part of the random run. No new development was observed. On September 18, 2008, DMR staff surveyed the upper New Meadows Lake, West Bath. A total of 18 properties were surveyed. No actual or potential problems were noted. On October 29, 2008, DMR and DEP staff surveyed 48 properties in West Bath, on Kings Pt Rd and Bull Rock Road. One actual problem was identified. Several properties were identified for follow- up work in the Spring/Summer 2009. On November 10, 2008, DMR and town of Harpswell shellfish warden surveyed 79 properties in Harpswell (Tax Map 50). One actual and one potential problem were identified and reported to the town CEO after survey to review unknown systems and potential problems. Systems that remain unknown due to lack of town records are listed below: On November 13, 2008, DMR and town of Harpswell shellfish warden surveyed 66 properties in Harpswell (Tax Map 51). Two potential problems and one new development project were observed. A new system that replaced an OBD was inspected, and the closure surrounding this property was repealed. On November 17, 2008, DMR and town of Harpswell shellfish warden surveyed 71 properties in Harpswell (Tax Maps 52 and 53). One actual and three potential problems were identified. Following this survey, the area adjacent to Wallace Shores Road was reclassified as prohibited. On November 20, 2008, DMR and town of Harpswell shellfish warden surveyed 26 properties (Map 56, 58, and 62); no problems were observed. Follow up survey work on Wallace Shores and Laurel Pt Circle with the town CEO was also completed on the same day.

WL Triennial 2008 Effective Date 06/26/09 Revision No.
Page 61 of 80
Aquaculture/Wet Storage Activity There are no wet storage permits in the growing area. There are currently two shellfish lease sites in this growing area. One is located in the upper New Meadows River, north of the train tracks in the approved area. The second lease site is located in Mill Cove, West Bath, off the peninsula that is monitored by stations WL 45.0 and WL 46.0.
Please visit the Aquaculture website for more information:
http://www.maine.gov/dmr/aquaculture/leaseinventory2006/newmeadowsriver.htm
Classification Changes Required Based on the findings of this report, two downgrades were required. Both were completed on December 31, 2008. The closure size surrounding OBD 4060, located on Dingley Island is required to be expanded from 0.36 acres to at least 0.88 acres, based on the current dilution calculation. An upward classification change is being proposed for the New Meadows Lake.
Summary With the exception of two areas, growing area WL has maintained good water quality over the past review year, with many stations showing improvement in scores over the past three years. As a result of the findings of this report, two areas were downgraded in classification: Laurel Point, Harpswell (WL 11) was downgraded to restricted due to water quality no longer meeting approved standards; and Browns Cove, West Bath (WL 46) was reclassified to prohibited after water quality no longer met the approved standards, and when a malfunctioning septic system was located within the vicinity of the station. This septic system has been approved for a community grant and will be replaced in 2009; once the town confirms its replacement, station WL 46 may be sampled on an accelerated sampling. In addition to the two downgrades in classification, a prohibited area surrounding OBD 4060, located on Dingley Island, must be expanded in size, as indicated by a current dilution calculation. Closure sizes surrounding the remaining OBDs are of adequate size to protect public health. The conditional area surrounding the marina was reviewed, and the dilution calculation was revised based on the information provided by the marina operator in 2008. The size of the marina conditional area is adequate to protect public health. One classification upgrade is proposed in this report. The New Meadows Lake (Brunswick and West Bath) has met approved standards for the past five years, and the area which is currently classified as restricted is recommended for an approved classification. The following work is recommended for the 2009 review year and for the next sanitary survey report (2010): 1) updating the sanitary survey on the remaining shoreline in West Bath by the end of 2009; 2) follow up work with DEP on properties identified as potential problems along Rosedale Point and King’s Point, West Bath; 3) continue monitoring streams throughout growing area WL, and record flow rates under a variety of environmental conditions; 4) update sanitary survey work along the Phippsburg shoreline by the end of 2010; and 5) follow-up

WL Triennial 2008 Effective Date 06/26/09 Revision No.
Page 62 of 80
survey in the vicinity of station WL 11, in order to try to elucidate the source of pollution at Laurel Point.

WL Triennial 2008 Effective Date 06/26/09 Revision No.
Page 63 of 80
Appendix A. 2008 Annual Review of Management Plan-New Meadows River Marina Conditional Area, Area 19A Scope The seasonal portion of the Upper New Meadows River is located between Rosedale Point and the railroad trestle north of the Bath Road, in the New Meadows River, between Brunswick and West Bath. This seasonal conditional area is based on the presence of a marina, and is closed to shellfish harvest from May 1 through November 15, due to the presence of boats at the New Meadows Marina. Monitoring stations WL 35, 36 and 31.1 are located within this conditional area, and monitor water quality both in the open and closed status. Typically, water quality data meets approved standards year-round, however the area is classified as conditionally approved because of the potential pollution from boats in the river at the marina during the times of operation late spring through mid-fall.

WL Triennial 2008 Effective Date 06/26/09 Revision No.
Page 64 of 80
Compliance with management plan Per management plan, in 2008, this conditional area closed to shellfish harvest on May 1st and reopened on November 15th. Prior to re-opening, a data check was completed to verify that the area was meeting NSSP approved water quality standards in the open status. DMR is also required to complete a visual check prior to the area seasonal closure and seasonal re-opening, to confirm the presence/absence of 10 or more boats with heads, which are capable of discharging waste to the conditional area. In 2008, a seasonal closure check was conducted on May 2nd. While less than 10 boats were present at the time of this seasonal inspection, it was noted that the spring marina check must be completed prior to May 1 in order to be in compliance with the management plan; in 2009, the seasonal closure check was completed on time, on April 26. The fall re-opening marina check was completed on time, on October 7th. There were less than 10 boats present, and the marina was closing for the season and the docks and slips were being removed from the water. Adequacy of reporting and cooperation of involved persons This management plan does not require reporting by non-DMR personnel. Compliance with approved growing area criteria All stations in this conditional area met their NSSP standard during the open status. Table 1. Geomean and P90 Calculations for Conditional Stations, Open Status Only STATION CLASS CNT MFCNT GM SDV MAX P90 APPD_STD RESTR_STDWL035.00 CA 30 13 2.9 0.19 13 5.1 40 230 WL036.00 CA 30 13 3.3 0.36 128 9.5 40 230 WL036.10 CA 30 12 3.1 0.34 54 8.5 41 235 Water sampling compliance history Stations WL 35 and 36 were sampled six times in the open status. Station WL 36.1 was sampled 5 times in the open status; the station was attempted to be sampled a sixth time, but the sample could not be collected due to the presence of ice (area completely frozen) Analysis-Recommendations No recommendations for changes to the current management plan or conditional area classification status are required at this time.

WL Triennial 2008 Effective Date 06/26/09 Revision No.
Page 65 of 80
Appendix B. 2008 Annual Review of Management Plan-Tottman Cove Seasonal Conditional Area, Area No. 19C Scope Tottman Cove is located in Phippsburg, in the New Meadows River Growing Area. The area was classified as conditionally approved based on season on May 30, 2008; previously to the reclassification, the area was classified as restricted. Water quality in the area is monitored by station WL 096.00. Tottman Cove is closed from July 1 through September 30 because of occasional seasonal non-point pollution, possibly due to an increase in shore usage in the summer months.
Compliance with management plan This is a new management plan, implemented in May 2008. In 2008, the area reopened on October 1st, after a review of water quality data confirmed that the area met the approved standards during the open status.
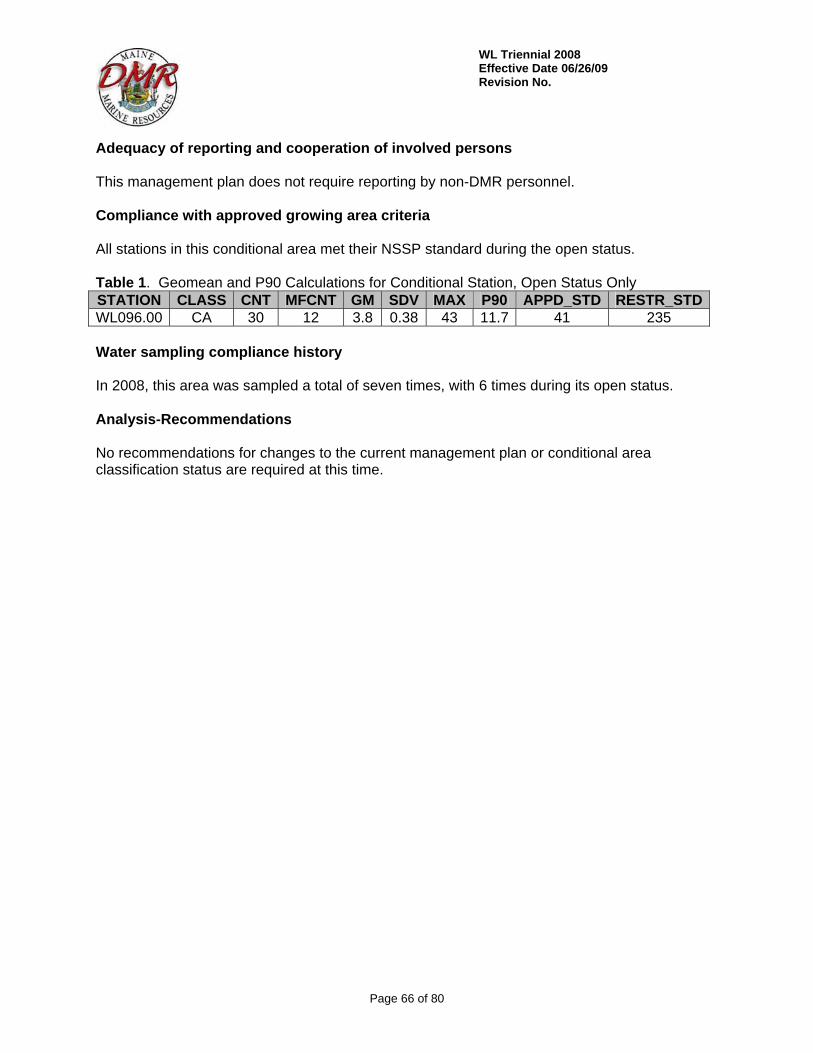
WL Triennial 2008 Effective Date 06/26/09 Revision No.
Page 66 of 80
Adequacy of reporting and cooperation of involved persons This management plan does not require reporting by non-DMR personnel. Compliance with approved growing area criteria All stations in this conditional area met their NSSP standard during the open status. Table 1. Geomean and P90 Calculations for Conditional Station, Open Status Only STATION CLASS CNT MFCNT GM SDV MAX P90 APPD_STD RESTR_STDWL096.00 CA 30 12 3.8 0.38 43 11.7 41 235 Water sampling compliance history In 2008, this area was sampled a total of seven times, with 6 times during its open status. Analysis-Recommendations No recommendations for changes to the current management plan or conditional area classification status are required at this time.

WL Triennial 2008 Effective Date 06/26/09 Revision No.
Page 67 of 80
Appendix C. 2008 Annual Review of Management Plan-Hermit Island Seasonal Conditional Area, Area No. 19C Scope Hermit Island seasonal conditional area is located in Phippsburg, in the New Meadows River Growing Area. The area was classified as conditionally approved based on season on May 30, 2008; previously to the reclassification, the area was classified as restricted. Water quality in the area is monitored by station WL 102.00. Hermit Island Conditional Area is closed from June 1 through November 15 because of occasional seasonal non-point pollution, possibly due to an increase in shore usage in the summer months.

WL Triennial 2008 Effective Date 06/26/09 Revision No.
Page 68 of 80
Compliance with management plan This is a new management plan, implemented in May 2008. In 2008, the area reopened on November 15th, after a review of water quality data confirmed that the area met the approved standards during the open status. Adequacy of reporting and cooperation of involved persons This management plan does not require reporting by non-DMR personnel. Compliance with approved growing area criteria All stations in this conditional area met their NSSP standard during the open status. Table 1. Geomean and P90 Calculations for Conditional Station, Open Status Only STATION CLASS CNT MFCNT GM SDV MAX P90 APPD_STD RESTR_STDWL101.80 New 4 4 1.9 0.01 2 2.0 WL102.00 CA 22 7 3.0 0.28 43 6.8 42 247 Water sampling compliance history In 2008, this area was sampled a total of 7 times, with 4 samples collected during the open status. This area will be sampled six times in the open status in 2009. Analysis-Recommendations No recommendations for changes to the current management plan or conditional area classification status are required at this time.

WL Triennial 2008 Effective Date 06/26/09 Revision No.
Page 69 of 80
Appendix D. Key to Water Quality Table Headers Station = water quality monitoring station Class = classification assigned to the station; prohibited (P), restricted (R), conditionally restricted (CR), conditionally approved (CA) and approved (A). Count = the number of samples evaluated for classification, must be a minimum of 30. MFCNT = the number of samples evaluated with the MTec method (included in the total Count column) Geo_Mean = means the antilog (base 10) of the arithmetic mean of the sample result logarithm (base 10). SDV = standard deviation Max = maximum score of the 30 data points in the count column P90 = 90th percentile APPD_STD = the 90th percentile, at or below which the station would meet approved criteria in the absence of pollution sources or poisonous and deleterious substances. RESTR_STD = the 90th percentile, at or below which the station would meet restricted criteria.

WL Triennial 2008 Effective Date 06/26/09 Revision No.
Page 70 of 80
Appendix E. Transitioning to Membrane Filtration for Seawater and Pollution Source Samples The Maine Department of Marine Resources has switched to a Membrane Filtration (MF) method for Fecal Coliforms using mTEC agar with a two hour resuscitation step. The geometric mean and the 90th percentile are calculated on 30 data points extending over a five year period. During the transition from MPN to MF, we will be accumulating MF data points. The statistical calculations will be a combination of MPN and MF data points. During the transition the P90 standard for approved and restricted classification will migrate. The FDA has determined that the best way to handle the data is to perform the calculations as always for the data set, but to compare the data set to a hybrid weighted 90th percentile. This hybrid standard is calculated by weighting the relative contributions of each method to the database. This will mean that as the number of MPN data points reduce and the number of MF data points increase the 90th percentile standard that the sample site is compared to will change over time. Once all 30 data points are analyzed using MF, the 90th percentile for approved classification will be 31 and for restricted (for depuration) will be 163. The geomean approved standard of 14 fecal coliforms per 100 ml and geomean restricted standard of 88 fecal coliforms per 100 ml will remain the same for both methods. Reports that display 90th percentiles will show the number of data points derived from MF analysis and will show the appropriate 90th percentile standard for that MPN/MF combination for approved and restricted classifications. It must be remembered that this weighted standard is only used for data sets encompassing data from the two different test methods, MF and MPN (3 tube/3 dilution). If decisions are to be made on a single test result analyzed by the MF method or a multiple number of test results all exclusively analyzed by the MF method, the 90th percentile standard is 31 fecal coliforms per 100 ml. This was the first year the water quality program documented, in the database, the inability to collect a sample based on the following parameters: if the tide stage was too low to collect the sample, there was a safety issue with collecting the sample, the location was inaccessible or “other” which was accompanied by a comment on the data sheet. Stations that were unable to be sampled due to any of these parameters show 999 in the salinity column and have no data recorded in any of the columns except the time which is recorded so the actual tide stage can be computed. Stations that were missed due to the above parameters were required to be made up to assure that each station would receive the required six samples during the sampling season.

WL Triennial 2008 Effective Date 06/26/09 Revision No.
Page 71 of 80
Appendix F. Growing Area WL 2008 Data Station Date Collect Tide Temp Sal Strat ADV Stat CL MFCOL WIND
03/26/08 SCF F 6 29 R - C P <2.0 SE 04/16/08 GBR E 9 28 R - C P <2.0 SW 06/16/08 GBR HE 15 28 R P C P <2.0 - 08/05/08 GBR HF 20 28 R - C P 4 CL 10/15/08 GBR HE 15 30 R - C P <2.0 CL
WL005.00
11/24/08 GBR E 7 31 R - C P <2.0 CL 03/26/08 SCF HF 6 28 R - O A <2.0 SE 04/16/08 GBR E 10 26 R - O A <2.0 SW 06/16/08 GBR HE 15 30 R P O A <2.0 - 08/05/08 GBR HF 24 28 R - O A <2.0 CL 10/15/08 GBR HE 15 30 R - O A 8 CL
WL006.00
11/24/08 GBR E 5 30 R - O A <2.0 CL 03/26/08 SCF F 5 30 R - O A <2.0 SE 04/16/08 GBR E 8 25 R - O A <2.0 SW 06/16/08 GBR HE 15 28 R P O A <2.0 - 08/05/08 GBR HF 21 30 R - O A 13 CL 10/15/08 GBR HE 16 30 R - O A 28 CL
WL007.00
11/24/08 GBR E 9 31 R - O A 13 CL 03/26/08 SCF HF 5 30 R - O A <2.0 SE 04/16/08 GBR E 7 26 R - O A <2.0 CL 06/16/08 GBR E 15 30 R P O A 29 - 08/05/08 GBR HF 24 30 R - O A <2.0 CL 10/15/08 GBR HE 15 30 R - O A 34 CL
WL010.00
11/24/08 GBR E 7 31 R - O A <2.0 CL 03/26/08 SCF HF 5 30 R - O A <2.0 SE 04/16/08 GBR H 7 28 R - O A <2.0 CL 06/16/08 GBR E 15 30 R P O A 16 - 08/05/08 GBR HF 20 30 R - O A 76 CL 10/15/08 GBR E 15 32 R - O A 300 CL
WL011.00
11/24/08 GBR E 8 31 R - O A 4 CL 03/26/08 SCF HF 5 29 R - O A <2.0 SE 04/16/08 GBR H 8 29 R - O A <2.0 CL 06/16/08 GBR E 15 30 R P O A <2.0 - 08/05/08 GBR HF 23 30 R - O A 2 CL 10/15/08 GBR E 15 32 R - O A 2 CL
WL012.00
11/24/08 GBR E 5 30 R - O A <2.0 CL 03/26/08 SCF HF 5 30 R - O A <2.0 SE 04/16/08 GBR H 7 28 R - O A <2.0 CL 06/16/08 GBR E 16 30 R P O A <2.0 - 08/05/08 GBR HF 22 30 R - O A 2 CL 10/15/08 GBR E 16 32 R - O A <2.0 CL
WL014.00
11/24/08 GBR E 5 30 R - O A <2.0 CL

WL Triennial 2008 Effective Date 06/26/09 Revision No.
Page 72 of 80
Station Date Collect Tide Temp Sal Strat ADV Stat CL MFCOL WIND03/26/08 SCF H 5 30 R - O A <2.0 SE 04/16/08 GBR H 7 30 R - O A <2.0 CL 06/16/08 GBR E 16 30 R P O A <2.0 - 08/05/08 GBR H 20 30 R - O A <2.0 CL 10/15/08 GBR E 15 32 R - O A 8 CL
WL015.00
11/24/08 GBR E 6 30 R - O A <2.0 CL 03/26/08 SCF H 5 31 R - O A <2.0 SE 04/16/08 GBR E 10 30 R - O A <2.0 CL 06/16/08 GBR E 16 30 R P O A 10 - 08/05/08 GBR H 22 30 R - O A 16 CL 10/15/08 GBR E 14 30 R - O A >1600 CL
WL018.00
11/24/08 GBR E 30 R - O A 4 CL 03/26/08 SCF H 5 30 R - O A <2.0 SE 04/16/08 GBR E 10 28 R - O A <2.0 SW 06/16/08 GBR E 16 30 R P O A <2.0 - 08/05/08 GBR H 19 28 R - O A <2.0 CL 10/15/08 GBR E 17 30 R - O A 2 CL
WL019.00
11/24/08 GBR E 6 29 R - O A <2.0 CL 03/26/08 SCF H 5 30 R - O A <2.0 SE 04/16/08 GBR E 9 30 R - O A <2.0 CL 06/16/08 GBR E 16 30 R P O A <2.0 - 08/05/08 GBR H 20 26 R - O A 40 CL 10/15/08 GBR E 14 28 R - O A 3.7 CL
WL020.00
11/24/08 GBR E 4 28 R - O A <2.0 CL 02/25/08 EXT F 2 28 R - O A <2.0 CL 04/22/08 VLE HF 11 28 R - O A <2.0 S 06/16/08 DD HE 17 31 R P O A <2.0 SW 08/05/08 DD F 19 30 R - O A <2.0 CL 10/14/08 DD HF 12 30 R P O A 6 CL
WL021.00
11/17/08 DD H 9 28 R P O A <2.0 S 02/25/08 EXT F 1 30 R - O A <2.0 CL 04/22/08 VLE HF 11 28 R - O A <2.0 CL 06/16/08 DD E 15 30 R P O A <2.0 SW 08/05/08 DD F 20 30 R - O A <2.0 CL 10/14/08 DD HF 11 30 R P O A <2.0 CL
WL022.00
11/17/08 DD H 8 28 R P O A 4 S 08/05/08 DD F 22 29 R - O A <2.0 CL 10/14/08 DD HF 12 30 R P - - 4 CL 11/17/08 DD HF 9 28 R P O A 13 CL
WL022.50
12/29/08 AB H 1 25 R - O A 2 CL 02/25/08 EXT F 2 30 R - O A <2.0 CL 04/22/08 VLE HF 10 28 R - O A <2.0 S 06/16/08 DD E 14 30 R P O A 2 CL 08/05/08 DD F 17 30 R - O A <2.0 CL
WL023.00
10/14/08 DD HF 10 30 R P O A 4 SE

WL Triennial 2008 Effective Date 06/26/09 Revision No.
Page 73 of 80
Station Date Collect Tide Temp Sal Strat ADV Stat CL MFCOL WIND11/17/08 DD HF 8 30 R P O A 6 S 02/25/08 EXT F 2 32 R - O R <2.0 CL 04/22/08 VLE HF 13 28 R - O R <2.0 CL 06/16/08 DD HE 16 30 R P O R <2.0 W 08/05/08 DD HF 23 30 R - O R <2.0 SE 10/14/08 DD HF 12 30 R P O R 8 SE
WL025.00
11/17/08 DD HF 8 28 R P O R <2.0 CL 02/25/08 EXT F 2 32 R - O R <2.0 CL 04/22/08 VLE HF 13 26 R - O R <2.0 CL 06/16/08 DD HE 18 33 R P O R <2.0 W 08/05/08 DD HF 18 30 R - O R <2.0 SE 10/14/08 DD HF 11 30 R P O R <2.0 CL
WL026.00
11/17/08 DD HF 9 28 R P O R 4 CL 02/25/08 EXT HF 1 30 R - O R <2.0 CL 04/22/08 VLE HF 13 28 R W O R <2.0 CL 06/16/08 DD E 17 31 R P O R 8 W 08/05/08 DD HF 17 30 R W O R <2.0 CL 10/14/08 DD HF 10 30 R P O R <2.0 CL
WL027.00
11/17/08 DD HF 9 30 R P O R 2 S 02/25/08 EXT HF 1 32 R - O A <2.0 CL 04/22/08 VLE HF 26 R - O A <2.0 SE 06/16/08 DD E 16 30 R P O A <2.0 W 08/05/08 DD HF 17 30 R - O A <2.0 E 10/14/08 DD HF 11 31 R P O A <2.0 S
WL028.00
11/17/08 DD HF 9 30 R P O A 2 W 02/25/08 EXT HF 2 30 R - O A <2.0 CL 04/22/08 VLE F 12 28 R - O A <2.0 SE 06/16/08 DD E 17 30 R P O A 13 W 08/05/08 DD HF 19 30 R - O A <2.0 E 10/14/08 DD HF 10.5 30 R P O A 2 S
WL030.00
11/17/08 DD HF 9 29 R P O A 4 CL 02/25/08 EXT H 3 30 R - O A <2.0 CL 04/22/08 VLE F 12 28 R - O A <2.0 SE 06/16/08 DD E 16 30 R P O A 6 W 08/05/08 DD HF 22 30 R - O A <2.0 CL 10/14/08 DD HF 11 30 R P O A <2.0 SE
WL031.00
11/17/08 DD HF 9 28 R P O A 2 S 02/25/08 EXT H 3 32 R - O A <2.0 SW 04/22/08 VLE F 12 28 R - O A <2.0 SE 06/16/08 DD E 16 32 R P O A <2.0 SW 08/05/08 DD F 19 30 R - O A 6 S 10/14/08 DD HF 11 30 R P O A <2.0 SE
WL033.00
11/17/08 DD HF 9 30 R P O A 8 S 02/25/08 EXT H 2 28 R - C P <2.0 SW WL034.50
04/22/08 VLE F 12 28 R - C P <2.0 SE

WL Triennial 2008 Effective Date 06/26/09 Revision No.
Page 74 of 80
Station Date Collect Tide Temp Sal Strat ADV Stat CL MFCOL WIND06/16/08 DD E 17 30 R P C P <2.0 CL 08/05/08 DD F 22 30 R - C P 13 S 10/14/08 DD F 12 30 R P C P 2 SE 11/17/08 DD HF 9 28 R P C P <2.0 SW 01/02/08 DD L 1 30 R PT O CA <2.0 NW 02/25/08 EXT F 1 26 R - O CA <2.0 CL 03/12/08 CLV E 5 27 R P O CA <2.0 CL 04/22/08 VLE F 12 28 R - O CA <2.0 SE 06/16/08 DD E 16 31 R P C CA 13 CL 08/05/08 DD LF 20 30 R - C CA <2.0 CL 10/14/08 DD F 12 28 R P C CA 2 SE 11/17/08 DD HF 9 26 R P O CA 4 SW
WL035.00
12/08/08 DD E 0 27 R P O CA 2 W 01/02/08 DD L 2 28 R PT O CA <2.0 NW 02/25/08 EXT F 1 26 R - O CA <2.0 CL 03/12/08 CLV E 5 26 R P O CA <2.0 CL 04/22/08 VLE F 12 27 R M O CA <2.0 SE 06/16/08 DD E 18 30 R P C CA 6 CL 08/05/08 DD LF 20 29 R M C CA <2.0 CL 10/14/08 DD H 13 27 R P C CA <2.0 SE 11/17/08 DD H 8 26 R P O CA 4 CL
WL036.00
12/08/08 DD E -3 28 R P O CA 2 W 01/07/08 EXT E -4 28 R - O CA <2.0 CL 03/12/08 CLV E 5 20 R P O CA <2.0 CL 04/22/08 VLE F 14 25 R - O CA <2.0 CL 05/13/08 LL LF 14 25 R - C CA <2.0 NE 06/16/08 DD E 20 30 R P C CA <2.0 CL 08/05/08 DD LF 23 29 R - C CA 13 CL 10/14/08 DD H 14 28 R P C CA 2 SE 11/17/08 DD HE 6 26 R P O CA <2.0 CL
WL036.10
12/08/08 DD E -3 22 R PW O CA <2.0 W 04/22/08 VLE F 13 24 R - O A <2.0 CL 05/13/08 LL LF 14 24 R - O A <2.0 NE 06/16/08 DD E 21 28 R P O A 11 CL 08/05/08 DD LF 25 29 R - O A <2.0 SE 10/14/08 DD HE 15 25 R P O A 5.5 E
WL036.50
11/17/08 DD HE 7 24 R P O A 8 CL 04/22/08 VLE F 14 23 R - O R <2.0 CL 05/13/08 LL LF 15 22 R - O R <2.0 NE 06/16/08 DD E 21 28 R P O R 2 CL 08/05/08 DD LF 25 29 R - O R 2 SE 10/14/08 DD E 14 25 R P O R <2.0 E
WL036.70
11/17/08 DD HE 7 25 R P O R 2 CL 04/22/08 VLE F 15 23 R - C P <2.0 CL WL036.90
05/13/08 LL LF 17 23 R - C P <2.0 N

WL Triennial 2008 Effective Date 06/26/09 Revision No.
Page 75 of 80
Station Date Collect Tide Temp Sal Strat ADV Stat CL MFCOL WIND06/16/08 DD E 22 28 R P C P 6 W 08/05/08 DD LF 26 29 R - C P <2.0 CL 10/14/08 DD HE 14 22 R P C P 2 E 11/17/08 DD HE 5 5 R P C P 22 CL 03/05/08 WARS H 3 30 R P O R 2 N 04/22/08 WARS F 11 26 R - O R <2.0 S 06/17/08 WARS HF 16 30 R - O R 7.3 S 08/06/08 WARS F 18 28 R P O R <2.0 SW 10/15/08 WARS HF 13 30 R - O R <2.0 NW
WL037.00
10/29/08 WARS F 9 30 R - O R 14 SW 03/05/08 WARS H 2 29 R P O R <2.0 N 04/22/08 WARS F 12 25 R - O R <2.0 S 06/17/08 WARS HF 16 30 R - O R <2.0 S 08/06/08 WARS F 17 29 R P O R <2.0 SW 10/15/08 WARS HF 13 30 R - O R 2 NW
WL037.50
10/29/08 WARS HF 9 28 R - O R 14 SW 03/05/08 WARS H 2 30 R P O A <2.0 N 04/22/08 WARS F 11 26 R - O A <2.0 S 06/17/08 WARS HF 16 30 R - O A <2.0 S 08/06/08 WARS F 17 30 R P O A <2.0 SW 10/15/08 WARS HF 13 31 R - O A <2.0 NW
WL038.00
10/29/08 WARS HF 9 30 R - O A <2.0 SW 03/05/08 WARS H 1.5 29 R P C P <2.0 N 04/22/08 WARS F 10 25 R - C P <2.0 S 06/17/08 WARS HF 16 30 R - O A <2.0 S 08/06/08 WARS F 16 28 R P O A 6 SW 10/15/08 WARS HF 13 30 R - O A <2.0 NW
WL040.00
10/29/08 WARS HF 9 30 R - O A <2.0 SW 03/05/08 WARS H 1 26 R P O A 9.1 NE 04/22/08 WARS F 12 25 R - O A <2.0 S 06/17/08 WARS HF 17 31 R - O A 10 S 08/06/08 WARS F 17 28 R P O A 2 SW 10/15/08 WARS HF 13 30 R - O A <2.0 NW
WL042.00
10/29/08 WARS HF 9 30 R - O A 2 SW 03/05/08 WARS HE 2 28 R P O A 4 NE 04/22/08 WARS HF 10 24 R - O A <2.0 S 06/17/08 WARS HF 15 30 R - O A <2.0 S 08/06/08 WARS F 16 29 R P O A <2.0 SW 10/15/08 WARS HF 14 30 R - O A <2.0 NW
WL044.00
10/29/08 WARS HF 10 30 R - O A <2.0 SW 03/05/08 WARS HE 2 26 R P C P <2.0 NE 04/22/08 WARS HF 15 24 R - C P <2.0 S 06/17/08 WARS H 19 29 R - O A 32 S 08/06/08 WARS F 18 26 R P O A 2 SW
WL044.50
10/15/08 WARS H 10 30 R - O A 11 NW

WL Triennial 2008 Effective Date 06/26/09 Revision No.
Page 76 of 80
Station Date Collect Tide Temp Sal Strat ADV Stat CL MFCOL WIND10/29/08 WARS HF 8 30 R - O A 6 SW 03/05/08 WARS HE 2 26 R P O A <2.0 NE 04/22/08 WARS HF 11 26 R - O A <2.0 S 06/17/08 WARS H 17 30 R - O A 2 S 08/06/08 WARS F 17 29 R P O A 1140 SW 10/15/08 WARS H 12 30 R - O A 2 NW
WL045.00
10/29/08 WARS HF 10 30 R - O A 16 SW 03/05/08 WARS HE 2 29 R P O A <2.0 N 04/22/08 WARS HF 9 26 R - O A <2.0 S 06/17/08 WARS H 17 30 R - O A 46 S 08/06/08 WARS F 17 28 R P O A >1600 SW 10/15/08 WARS H 14 31 R - O A 2 NW
WL046.00
10/29/08 WARS HF 10 30 R - O A 26 SW 03/05/08 WARS E 2 28 R P O R 32 N 04/22/08 WARS HF 12 26 R - O R <2.0 S 06/17/08 WARS H 17 30 R - O A 13 S 08/06/08 WARS HF 17 28 R P O A 6 SW 10/15/08 WARS H 13 30 R - O A 12 NW
WL047.00
10/29/08 WARS H 10 28 R - O A 15 SW 03/05/08 WARS E 2 26 R P O A <2.0 N 04/22/08 WARS HF 16 24 R - O A <2.0 S 06/17/08 WARS H 17 30 R - O A 14 S 08/06/08 WARS HF 18 28 R P O A 2 SW 10/15/08 WARS H 13 31 R - O A <2.0 NW
WL048.00
10/29/08 WARS H 10 27 R - O A 2 SW 03/05/08 WARS E 2 29 R P O A <2.0 NE 04/22/08 WARS HF 10 24 R - O A <2.0 S 06/17/08 WARS H 16 30 R - O A <2.0 SE 08/06/08 WARS HF 16 28 R P O A 8 SW 10/15/08 WARS H 13 30 R - O A <2.0 NW
WL048.50
10/29/08 WARS H 10 30 R - O A <2.0 SW 04/22/08 WARS HF 10 24 R - O A <2.0 S 06/17/08 WARS H 15 30 R - O A <2.0 SE 08/06/08 WARS HF 17 30 R P O A <2.0 SW 10/15/08 WARS H 13 30 R - O A <2.0 NW 10/29/08 WARS H 10 30 R - O A <2.0 SW
WL049.00
11/19/08 AB F 5 30 R - O A 2 N 03/05/08 WARS E 2.5 22 R P O R 6 NE 04/22/08 WARS HF 10 24 R - O R <2.0 S 06/17/08 WARS H 15 30 R - O R <2.0 SE 08/06/08 WARS HF 17 29 R P O R 7.3 SW 10/15/08 WARS H 14 30 R - O R <2.0 NW
WL051.00
10/29/08 WARS H 10 30 R - O R 2 SW 03/05/08 WARS E 2 28 R P C P <2.0 NE WL052.00
04/22/08 WARS HF 10 24 R - C P <2.0 S

WL Triennial 2008 Effective Date 06/26/09 Revision No.
Page 77 of 80
Station Date Collect Tide Temp Sal Strat ADV Stat CL MFCOL WIND06/17/08 WARS H 16 28 R - O R <2.0 SE 08/06/08 WARS HF 17 29 R P O R 2 SW 10/15/08 WARS H 12 30 R - O R 14 NW 10/29/08 WARS H 10 30 R - O R 4 SW 03/05/08 WARS E 2 28 R P C P <2.0 NE 04/22/08 WARS HF 10 24 R - C P <2.0 S 06/17/08 WARS H 15 29 R - O A <2.0 SE 08/06/08 WARS HF 17 28 R P O A 46 SW 10/15/08 WARS HE 12 30 R - O A <2.0 NW
WL053.00
10/29/08 WARS H 10 30 R - O A <2.0 SW 03/05/08 WARS E 2.5 30 R P C P <2.0 NW 04/22/08 WARS HF 10 24 R - C P <2.0 S 06/17/08 WARS H 16 30 R - O A <2.0 SE 08/06/08 WARS HF 17 28 R P O A 6 SW 10/15/08 WARS HE 12 30 R - O A <2.0 NW
WL054.00
10/29/08 WARS H 10 30 R - O A 2 SW 03/05/08 WARS E 2.5 30 R P C P <2.0 NW 04/22/08 WARS HF 10 24 R - C P <2.0 S 06/17/08 WARS H 15 29 R - O A <2.0 SE 08/06/08 WARS H 16 26 R P O A 160 SW 10/15/08 WARS HE 13 30 R - O A <2.0 NW
WL057.00
10/29/08 WARS HE 10 30 R - O A 2 SW 03/05/08 WARS E 2 30 R P C P <2.0 NW 04/22/08 WARS HF 10 22 R - C P <2.0 S 06/17/08 WARS HE 15 28 R - O A <2.0 SE 08/06/08 WARS H 16 28 R P O A 28 SW 10/15/08 WARS HE 13 30 R - O A <2.0 W
WL060.00
10/29/08 WARS HE 10 31 R - O A <2.0 SW 03/05/08 WARS E 2 30 R P O A 12 NW 04/22/08 WARS H 10 22 R - O A <2.0 S 06/17/08 WARS HE 15 28 R - O A <2.0 SE 08/06/08 WARS H 16 28 R P O A 14 SW 10/15/08 WARS HE 12 29 R - O A <2.0 W
WL063.00
10/29/08 WARS HE 10 31 R - O A <2.0 SW 03/05/08 WARS E 2 30 R P O A 9.1 NW 04/22/08 WARS H 10 22 R - O A <2.0 S 06/17/08 WARS HE 15 28 R - O A <2.0 SE 08/06/08 WARS H 16 28 R P O A 18 SW 10/15/08 WARS HE 12 29 R - O A <2.0 W
WL066.00
10/29/08 WARS HE 10 31 R - O A <2.0 SW 03/05/08 WARS E 2 30 R P C P 50 NW 04/22/08 WARS H 10 22 R - C P <2.0 S 08/06/08 WARS H 16 28 R P C P 46 SW 10/15/08 WARS HE 13 30 R - C P <2.0 W
WL068.00
10/29/08 WARS HE 10 31 R - C P 4 SW

WL Triennial 2008 Effective Date 06/26/09 Revision No.
Page 78 of 80
Station Date Collect Tide Temp Sal Strat ADV Stat CL MFCOL WIND02/27/08 DDO F 2 30 R P C P <2.0 CL 04/23/08 DDO E 13 22 R - C P <2.0 SW 07/16/08 EXT HF 21 30 R - O A <2.0 CL 10/20/08 DDO F 12 32 R - O A <2.0 NW 11/04/08 DDO E 10 30 R - O A 2 CL
WL070.00
11/19/08 DDO HF 6 31 R - O A <2.0 NW 02/27/08 DDO F 0 29 R P C P <2.0 CL 04/23/08 DDO E 14 22 R - C P <2.0 SW 07/16/08 EXT HF 21 30 R - O A <2.0 CL 10/20/08 DDO F 11 32 R - O A <2.0 NW 11/04/08 DDO E 10 30 R - O A <2.0 CL
WL071.00
11/19/08 DDO HF 4 28 R - O A 2 NW 02/27/08 DDO F 2 30 R P C P <2.0 CL 04/23/08 DDO E 15 22 R - C P <2.0 W 07/16/08 EXT HF 21 29 R - O R <2.0 CL 10/20/08 DDO F 11 32 R - O R <2.0 NW 11/04/08 DDO E 10 30 R - O R <2.0 S
WL073.00
11/19/08 DDO HF 5 28 R - O R <2.0 NW 02/27/08 DDO F 2 30 R P O A <2.0 CL 04/23/08 DDO E 16 24 R W O A <2.0 CL 07/16/08 EXT HF 22 30 R - O A <2.0 CL 10/20/08 DDO F 12 32 R - O A <2.0 NW 11/04/08 DDO E 10 30 R - O A <2.0 S
WL075.00
11/19/08 DDO HF 6 30 R - O A <2.0 NW 02/27/08 DDO F 2 30 R P O A <2.0 CL 04/23/08 DDO E 19 24 R - O A <2.0 S 07/16/08 EXT HF 21 31 R - O A <2.0 CL 10/20/08 DDO F 11 32 R - O A <2.0 NW 11/04/08 DDO E 10 30 R - O A <2.0 S
WL076.00
11/19/08 DDO HF 6 28 R - O A 36 NW 02/27/08 DDO HF 2 30 R P O A <2.0 CL 04/23/08 DDO HE 14 24 R - O A <2.0 S 07/16/08 EXT HF 22 30 R - O A <2.0 CL 10/20/08 DDO F 10 32 R - O A <2.0 NW 11/04/08 DDO E 9 31 R - O A <2.0 S
WL077.00
11/19/08 DDO HF 5 27 R - O A 6 NW 02/27/08 DDO HF 2 29 R P O A <2.0 CL 04/23/08 DDO HE 12 20 R - O A <2.0 S 07/16/08 EXT H 19 30 R - O A <2.0 CL 10/20/08 DDO HF 11 32 R - O A <2.0 NW 11/04/08 DDO E 10 30 R - O A <2.0 S
WL079.00
11/19/08 DDO HF 6 31 R - O A <2.0 NW 02/27/08 DDO HF 2 28 R P C P <2.0 CL 04/23/08 DDO HE 15 20 R - C P <2.0 S
WL081.00
07/16/08 EXT H 21 30 R - C P 4 SW

WL Triennial 2008 Effective Date 06/26/09 Revision No.
Page 79 of 80
Station Date Collect Tide Temp Sal Strat ADV Stat CL MFCOL WIND10/20/08 DDO HF 12 32 R - C P 72 NW 11/04/08 DDO HE 11 30 R - C P <2.0 S 11/19/08 DDO H 6 30 R - C P 2 NW 02/27/08 DDO HF 3 28 R PW C P <2.0 CL 04/23/08 DDO HE 15 19 R W C P <2.0 SE 07/16/08 EXT H 22 30 R - C P 2 SW 10/20/08 DDO HF 13 32 R - C P 8 NW 11/04/08 DDO HE 11 24 R - C P 2 S
WL085.00
11/19/08 DDO H 6 30 R - C P <2.0 NW 02/27/08 DDO HF 3 28 R P O R <2.0 CL 04/23/08 DDO H 16 20 R - O R <2.0 SE 07/16/08 EXT H 20 30 R - O R 4 CL 10/20/08 DDO HF 12 31 R - O R 6 NW 11/04/08 DDO HE 10 28 R - O R <2.0 S
WL087.00
11/19/08 DDO H 8 31 R - O R <2.0 NW 02/27/08 DDO H 2 28 R P O R <2.0 CL 04/23/08 DDO H 13 20 R - O R <2.0 S 07/16/08 EXT H 19 30 R - O R <2.0 SW 10/20/08 DDO HF 12 31 R - O R 10 NW 11/04/08 DDO HE 10 28 R - O R <2.0 S
WL087.20
11/19/08 DDO H 7 30 R - O R <2.0 NW 02/27/08 DDO H 2 26 R P C P 22 CL 04/23/08 DDO H 13 21 R W C P <2.0 S 07/16/08 EXT H 20 30 R - C P 2 CL 10/20/08 DDO HF 12 32 R - C P <2.0 NW 11/04/08 DDO HE 10 29 R - C P <2.0 S
WL089.00
11/19/08 DDO H 5 30 R - C P 2 NW 02/27/08 DDO HE 2 29 R P C P <2.0 CL 04/23/08 DDO H 12 20 R - C P <2.0 S 07/16/08 EXT HE 18 29 R - C P <2.0 SW 10/20/08 DDO HF 12 31 R - C P <2.0 NW 11/04/08 DDO HE 10 28 R - C P <2.0 S
WL095.50
11/19/08 DDO H 6 30 R - C P <2.0 NW 02/27/08 DDO HE 2 28 R PW O R <2.0 CL 04/23/08 DDO HF 14 19 R - O R <2.0 S 07/16/08 EXT HE 23 29 R - C CA 6 CL 10/20/08 DDO H 11 31 R - O CA 22 NW 11/04/08 DDO H 10 26 R - O CA <2.0 S 11/19/08 DDO H 6 30 R - O CA <2.0 NW
WL096.00
12/08/08 MLP HE -1 30 R - O CA <2.0 SW 02/27/08 DDO E 2 28 R P O A <2.0 CL 04/23/08 DDO HF 11 20 R - O A <2.0 S 07/16/08 EXT HE 19 30 R - O A <2.0 SW 10/20/08 DDO H 12 31 R - O A 2 NW
WL097.00
11/04/08 DDO H 10 28 R - O A <2.0 S

WL Triennial 2008 Effective Date 06/26/09 Revision No.
Page 80 of 80
Station Date Collect Tide Temp Sal Strat ADV Stat CL MFCOL WIND11/19/08 DDO HE 6 31 R - O A <2.0 NW 02/27/08 DDO E 2 27 R P C P <2.0 CL 04/23/08 DDO HF 13 21 R - C P <2.0 S 07/16/08 EXT HE 20 30 R - C P 2 CL 10/20/08 DDO H 12 31 R - C P <2.0 NW 11/04/08 DDO H 10 28 R - C P <2.0 S
WL098.00
11/19/08 DDO HE 6 30 R - C P <2.0 NW 02/27/08 DDO E 2 28 R P O A <2.0 N 04/23/08 DDO HF 11 20 R - O A <2.0 SE 07/16/08 EXT HE 19 29 R - O A 2 CL 10/20/08 DDO H 11 32 R - O A <2.0 NW 11/04/08 DDO H 10 28 R - O A 2 S
WL099.00
11/19/08 DDO F 6 31 R - O A 2 W 02/27/08 DDO E 2 28 R P O A <2.0 CL 04/23/08 DDO F 12 20 R - O A <2.0 SE 07/16/08 EXT E 21 30 R - O A <2.0 CL 10/20/08 DDO H 12 32 R - O A <2.0 NW 11/04/08 DDO H 10 28 R - O A 2 S
WL101.00
11/19/08 DDO F 5 28 R - O A <2.0 W 02/27/08 DDO E 2 28 R P O A <2.0 CL 04/23/08 DDO F 12 20 R - O A <2.0 SE 07/16/08 EXT E 22 30 R - O A <2.0 CL 10/20/08 DDO H 11 32 R - O A <2.0 NW 11/04/08 DDO H 10 28 R - O A <2.0 SE 11/19/08 DDO F 5 28 R - O A <2.0 W
WL101.80
12/08/08 MLP HE -3 27 R - O A 2 NW 02/27/08 DDO E 1 27 R P O R <2.0 N 04/23/08 DDO F 15 19 R - O R <2.0 E 07/16/08 EXT E 21 30 R - C CA <2.0 CL 10/20/08 DDO HE 11 31 R - C CA 4 NW 11/04/08 DDO H 10 28 R - C CA <2.0 E 11/19/08 DDO F 5 28 R W O CA 2 W
WL102.00
12/29/08 AB HE 3 28 R - O CA <2.0 N 02/27/08 DDO E 2 28 R P O A <2.0 N 04/23/08 DDO F 12 20 R - O A <2.0 N 07/16/08 EXT E 19 30 R - O A 2 SW 10/20/08 DDO HE 31 R - O A 126 NW 11/04/08 DDO HF 10 28 R - O A <2.0 E
WL103.00
11/19/08 DDO F 8 31 R - 0 A <2.0 W