Grouping Minnesota Cities - house.leg.state.mn.us
58
Research Department Minnesota House of Representatives September 2015 Grouping Minnesota Cities Using Cluster Analysis
Transcript of Grouping Minnesota Cities - house.leg.state.mn.us
Research Department Minnesota House of Representatives
September 2015
Grouping Minnesota Cities
Using Cluster Analysis

The Research Department of the Minnesota House of Representatives is a nonpartisan professional office serving the entire membership of the House and its committees. The department assists all members and committees in
developing, analyzing, drafting, and amending legislation.
The department also conducts in-depth research studies and collects, analyzes, and publishes information regarding public policy issues for use by
all House members.
Research Department Minnesota House of Representatives
600 State Office Building, St. Paul, MN 55155 651-296-6753
September 2015
Grouping Minnesota Cities
Using Cluster Analysis
This technical paper describes a method used for public finance analysis by the House Research Department to group Minnesota cities into classes with similar characteristics. These groupings are called “clusters.” This is the fourth grouping of cities for analysis purposes used by the House Research Department since the original groupings published in January 1988.
Copies of this publication may be obtained by calling 651-296-6753. This document can be made available in alternative formats for people with disabilities by calling 651-296-6753 or the Minnesota State Relay Service at 711 or 1-800-627-3529 (TTY). Many House Research Department publications are also available on the Internet at: www.house.mn/hrd/.
This report was prepared by Pat Dalton and Sean Williams, legislative analysts in the House Research Department. Special thanks to Jim Cleary, former legislative analyst, for his help with methodology.
Questions may be addressed to Pat Dalton at 651-296-7434.
Scott Kulzer provided graphics and production assistance.

Contents
Introduction to Clustering ................................................................................ 4
Purpose of clustering ................................................................................... 4 What is Cluster Analysis? ............................................................................ 4
Clustering Minnesota Cities ............................................................................. 5 Clustering Method ....................................................................................... 5 Summary of the Resulting Clusters ............................................................. 6 Cluster Descriptions ..................................................................................... 8 Metropolitan Cities ...................................................................................... 8 Nonmetropolitan City Clusters .................................................................. 12
Appendix A: Classification Methodology ..................................................... 16 What is Cluster Analysis? .......................................................................... 16
Appendix B-1: City Clusters and Cluster Variables ...................................... 23 Appendix B-2: City Clusters Listed by County ............................................. 48

House Research Department September 2015 Grouping Minnesota Cities Page 4
Introduction to Clustering
Purpose of Clustering
Since 1988 the House Research Department has used a strategy for grouping cities into classes called “clusters.” The clustering methodology assigns cities to groups based on their similarities and differences across several characteristics. Minnesota has 853 cities, and without a classification scheme, it is hard to analyze and draw conclusions regarding the effect of different policies on different “kinds” of cities.1 Clusters, which are based on multiple characteristics of cities, can show meaningful patterns of effects that are not apparent in cities grouped by size or location alone. Clusters help legislators to evaluate, from a broader perspective, the proposals and policies that affect city finances. This department, the League of Minnesota Cities, the Minnesota Department of Revenue, and several other groups regularly used the city clusters to analyze city aid and city spending. The first set of city clusters was developed and used by the House Research Department in 1988. However, cities grow and change over time, therefore the groupings need to change over time as well. In 1996 this office developed updated groups, and in 2002 the League of Minnesota Cities, in consultation with House Research, updated the city grouping again using the same methodology. In 2013 House Research completed and unveiled a fourth updated set of city clusters in time to be used in the analysis of a major reform of the local government aid program for cities. The publication explains how the new city clusters were developed and describes the resulting groups. The aim of the cluster analysis of cities is utility rather than statistical elegance. The purpose of the grouping is to help legislators understand and evaluate how a policy proposal impacts different types of cities. For that reason, a cluster analysis must not only be based on relevant characteristics, but the policymakers must be able to form a mental picture of the cities in each group. What is Cluster Analysis?
The method used to classify cities is a statistical technique called cluster analysis. The method is summarized briefly in this section and explained in more detail in Appendix A. Cluster analysis is a method of grouping similar objects together based on common characteristics. The characteristics used in the analysis determine the groups or “clusters” that result. Because objects have many characteristics, there is no one “correct” or perfect cluster. Meaningful clusters result from grouping based on characteristics that are relevant to the given purpose.
1 The city of Thomson merged with the city of Carlton since the analysis. However the report shows results for
all 853 cities that existed at the time of analysis.

House Research Department September 2015 Grouping Minnesota Cities Page 5
Cluster analysis is as much an art as it is a statistical method since there is no one correct result. Successful clusters are determined more by their intuitive sense than their statistical rigor. For this reason, some clusters may be determined outside of the analysis to account for factors that are judged to be important in the classification scheme, even if these factors do not lend themselves to statistical analysis. Clustering Minnesota Cities
Clustering Method
Although we originally looked at a number of possible city characteristics on which to base the groupings, the city characteristics used to develop the new city clusters are the same or similar to ones used by the League of Minnesota for the 2002 cluster analysis. The characteristics were updated to reflect the passage of time. The variables are listed below. Twin Cities metropolitan area cities were clustered based on the following characteristics:
• Current (2010 census) population • Population growth for the previous ten years (2000-2010) • Median household income for 2010 • Percent of total property market value classified as commercial/industrial property
for 20112 Greater Minnesota cities were clustered based on the following characteristics:
• Current (2010 census) population • Population growth for the previous ten years (2000-2010) • Median household income for 2010 • Per capita commercial/industrial property market value for 2011
As in the earlier analyses, Minnesota cities have been separated into two groups for clustering purposes. One group consists of all cities in the seven-county Twin Cities metropolitan area; the second group consists of all other cities. Segregating the metro and nonmetro cities reflects historical perspective in the way decision-makers view the state. In addition, metro area cities can be defined vis-a-vis their role within the urbanized metropolitan area while nonmetro cities are defined by their role in their regional economies.
2 The variable used in the 2002 analysis was per capita commercial/industrial property value in 2001, but the substitution of the percentage for that variable resulted in more consistent city groups.

House Research Department September 2015 Grouping Minnesota Cities Page 6
Summary of the Resulting Clusters
After adjustments for cities with extreme values for the chosen variables, we tried the cluster analysis using various numbers of groups. A complete description of the methodology used in developing the groups can be found in Appendix A. The result was 15 clusters, each named for its dominant characteristic or characteristics. A complete list is found in Table 1. There are seven clusters of cities in the seven-county metropolitan area and eight clusters of cities in the nonmetropolitan or Greater Minnesota region. We defined most of the clusters using the statistical clustering technique. However, we defined two clusters using criteria outside of the analysis. The word “predetermined” under the dominant characteristic listing in Table 1 indicates these clusters. Two other clusters in Greater Minnesota—Sub-regional Centers and Urban Fringe—began as one large cluster but were subdivided into two groups post-analysis based on each city’s proximity to the seven-county metropolitan area. Appendix A provides a more complete explanation of the rationale behind these choices.
House Research Department September 2015 Grouping Minnesota Cities Page 7
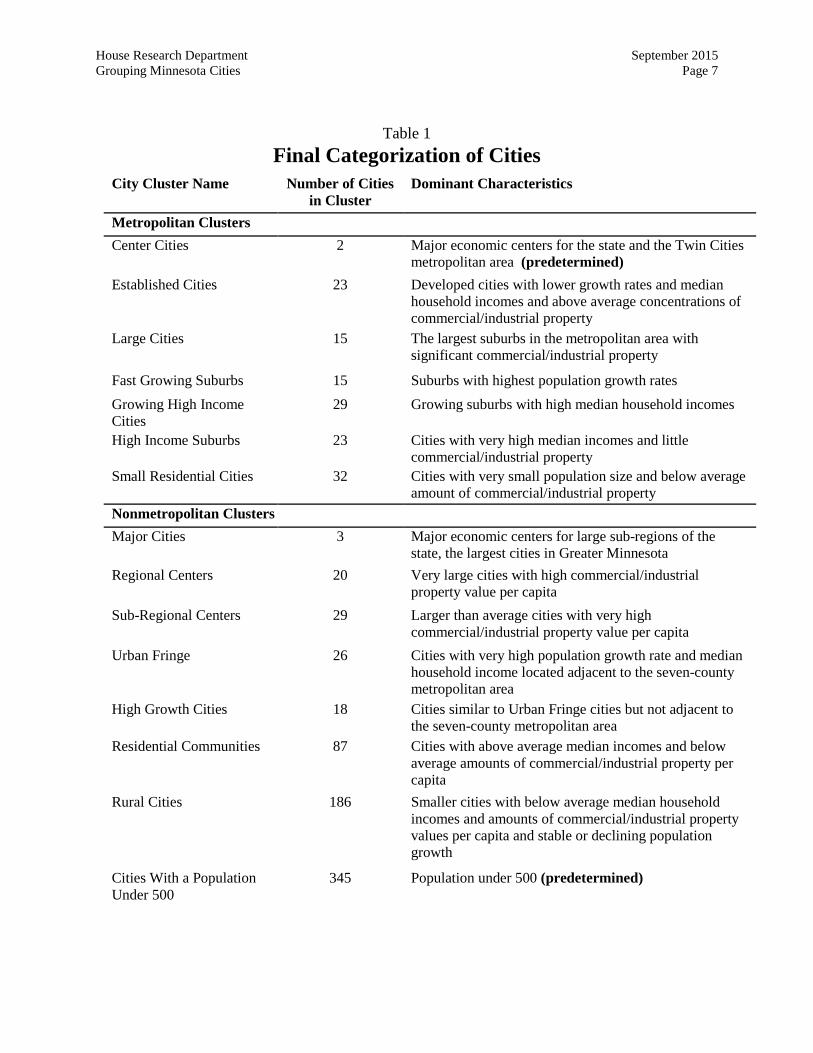
Table 1 Final Categorization of Cities
City Cluster Name
Number of Cities
in Cluster
Dominant Characteristics
Metropolitan Clusters Center Cities 2 Major economic centers for the state and the Twin Cities
metropolitan area (predetermined) Established Cities 23 Developed cities with lower growth rates and median
household incomes and above average concentrations of commercial/industrial property
Large Cities 15 The largest suburbs in the metropolitan area with significant commercial/industrial property
Fast Growing Suburbs 15 Suburbs with highest population growth rates Growing High Income Cities
29 Growing suburbs with high median household incomes
High Income Suburbs 23 Cities with very high median incomes and little commercial/industrial property
Small Residential Cities 32 Cities with very small population size and below average amount of commercial/industrial property
Nonmetropolitan Clusters Major Cities 3 Major economic centers for large sub-regions of the
state, the largest cities in Greater Minnesota Regional Centers 20 Very large cities with high commercial/industrial
property value per capita Sub-Regional Centers 29 Larger than average cities with very high
commercial/industrial property value per capita Urban Fringe 26 Cities with very high population growth rate and median
household income located adjacent to the seven-county metropolitan area
High Growth Cities 18 Cities similar to Urban Fringe cities but not adjacent to the seven-county metropolitan area
Residential Communities 87 Cities with above average median incomes and below average amounts of commercial/industrial property per capita
Rural Cities 186 Smaller cities with below average median household incomes and amounts of commercial/industrial property values per capita and stable or declining population growth
Cities With a Population Under 500
345 Population under 500 (predetermined)
House Research Department September 2015 Grouping Minnesota Cities Page 8
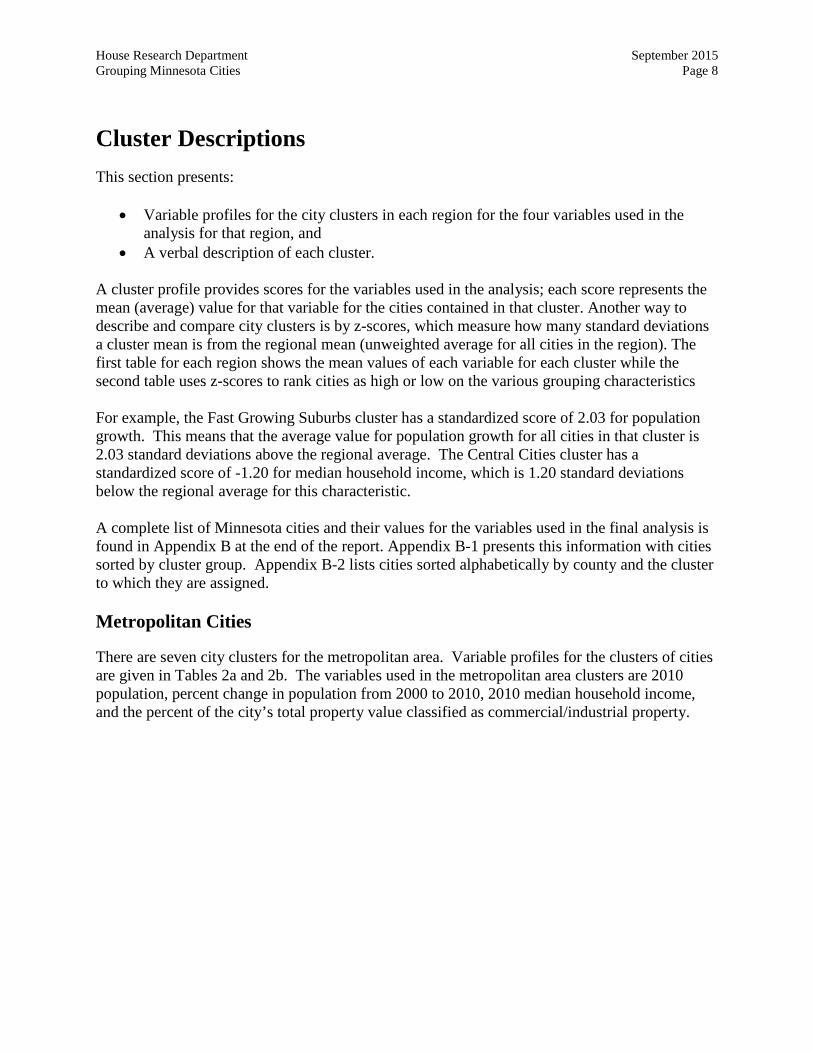
Cluster Descriptions This section presents:
• Variable profiles for the city clusters in each region for the four variables used in the analysis for that region, and
• A verbal description of each cluster.
A cluster profile provides scores for the variables used in the analysis; each score represents the mean (average) value for that variable for the cities contained in that cluster. Another way to describe and compare city clusters is by z-scores, which measure how many standard deviations a cluster mean is from the regional mean (unweighted average for all cities in the region). The first table for each region shows the mean values of each variable for each cluster while the second table uses z-scores to rank cities as high or low on the various grouping characteristics For example, the Fast Growing Suburbs cluster has a standardized score of 2.03 for population growth. This means that the average value for population growth for all cities in that cluster is 2.03 standard deviations above the regional average. The Central Cities cluster has a standardized score of -1.20 for median household income, which is 1.20 standard deviations below the regional average for this characteristic. A complete list of Minnesota cities and their values for the variables used in the final analysis is found in Appendix B at the end of the report. Appendix B-1 presents this information with cities sorted by cluster group. Appendix B-2 lists cities sorted alphabetically by county and the cluster to which they are assigned. Metropolitan Cities
There are seven city clusters for the metropolitan area. Variable profiles for the clusters of cities are given in Tables 2a and 2b. The variables used in the metropolitan area clusters are 2010 population, percent change in population from 2000 to 2010, 2010 median household income, and the percent of the city’s total property value classified as commercial/industrial property.

House Research Department September 2015 Grouping Minnesota Cities Page 9
Table 2a Cluster Profiles for Metropolitan Cities
Cluster Name
2010 Population
Population Growth Rate
2000-2010
Median
Household Income
% of Property Classified
Comm./Ind.
No. of Cities
Center Cities 333,823 -0.4% $45,757 20.3% 2 Established Cities 14,189 -1.0% $54,496 29.7% 23 Large Cities 60,314 10.0% $76,534 19.9% 15 Fast Growing Suburbs 10,076 112.3% $80,846 11.2% 15 Growing High Income Suburbs 14,982 17.2% $80,768 9.7% 29 High Income Suburbs 2,631 2.8% $113,931 2.7% 23 Smaller Residential Cities 6,828 -1.1% $58,828 12.9% 32 Metro Unweighted Average*
19,880
16.8%
$75,905
14.0%
139
Standard Deviation
42,832
47.2%
$24,995
11.0%
*This is not equal to the regional average since cities were not weighted by size.
House Research Department .
Table 2b Characteristics Ranks for Metropolitan City Clusters
Cluster Name
2010 Population
Population Growth Rate 2000-2010
Median
Household Income
% of Property Classified
Comm./Ind.
Center Cities Very High Low Very Low High Established Cities Medium Low Low Very High Large Cities High Medium Medium High Fast Growing Suburbs Low Very High High Low Growing High Income Suburbs Medium Medium High Low High Income Suburbs Low Low Very High Very Low Smaller Residential Cities Low Low Low Medium
Note on Ranks: Very High = the cluster mean is more than 1 standard deviation above the regional mean High = the cluster mean is between 0.2 and 1.0 standard deviation above the regional mean Medium = the cluster mean is within plus or minus 0.2 standard deviation of the regional mean Low = the cluster mean is between 0.2 and 1.0 standard deviation below the regional mean Very Low = the cluster mean is more than 1.0 standard deviation below the regional mean
House Research Department September 2015 Grouping Minnesota Cities Page 10
1. Center Cities (Number of cities = 2)
The “Center Cities” cluster consists of Minneapolis and St. Paul. These two cities clearly stand apart from others in the metropolitan area because of their role as the economic nucleus for the region and the state. Minneapolis and St. Paul are much larger than the other metropolitan cities based on their population. The median household income is only about 60 percent of the average for metropolitan area cities.
Minneapolis and St. Paul serve as the major government and economic centers for the region and the state. This increased economic activity translates into a significant amount of commercial/industrial property in the city. In addition these cities provide services to a larger population than residents alone. The extended population served by these cities affects the kinds and amounts of government services needed, as does the fact that these cities have a larger share of low-income households. The increased commercial/industrial tax base enhances their ability to meet some of those additional needs.
2. Established Cities (Number of cities = 23) (Examples: Anoka, Maplewood)
The “Established Cities” consists of 23 of the most established communities in the metropolitan area. The cluster is characterized by lower than average population growth rates and median household income. However, the percentage of their total property value classified as commercial/industrial property is very high.
Many cities in this cluster, such as Anoka or Maple Plain, were established and “freestanding” cities before the development of surrounding suburbs. Others, such as Golden Valley and Maplewood, were early bedroom communities for the central cities. These cities often have established business areas. The age and size of these communities indicate cities with established infrastructure and developed delivery systems for government services. These cities have limited opportunity for further growth and development.
3. Large Cities (Number of cities = 15) (Examples: Bloomington, Woodbury)
“Large Cities” have a cluster profile score above the average for per capita commercial/industrial property value and population. These cities have average scores for population growth rates and median household income, although the rates for individual cities on each of the last two characteristics are mixed.
The cities are the largest cities in the metropolitan area outside of the Central Cities and are the sub-economic centers of the region. They are major locations for jobs and often contain major shopping hubs. These cities need to provide city services to commuters who work or shop in the city as well as to city residents.
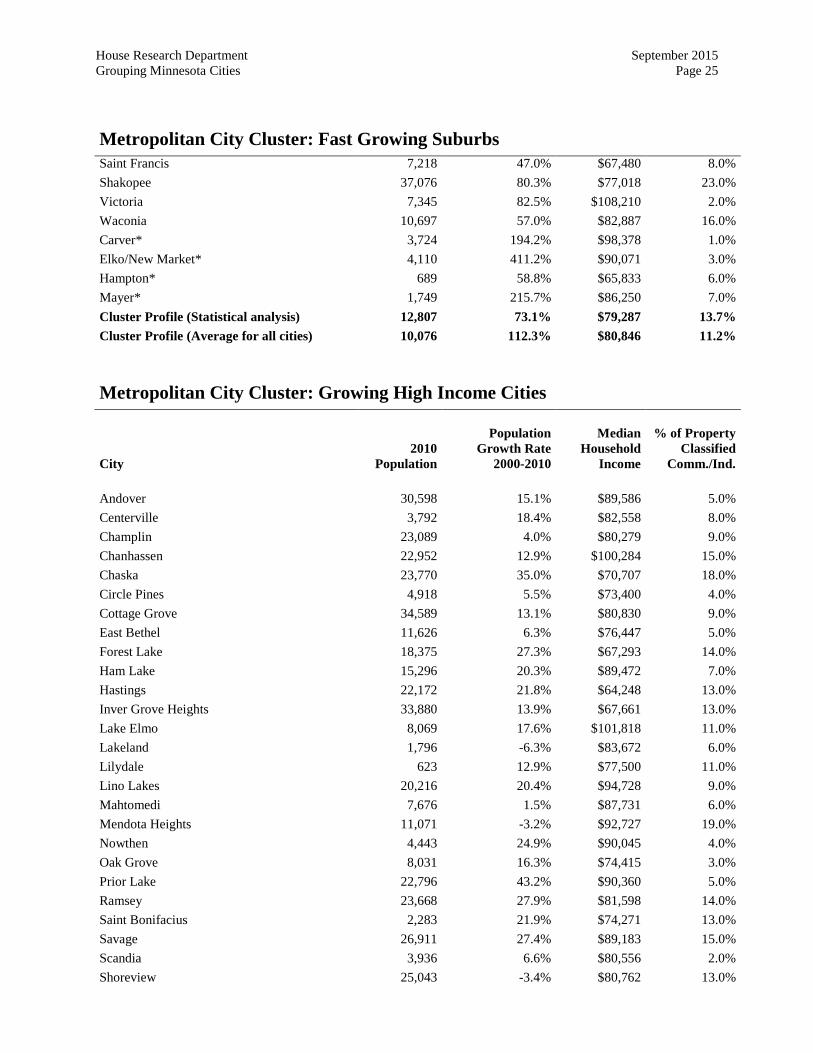
4. Fast Growing Suburbs (Number of cities = 15) (Examples: Farmington, Shakopee)
Cities classified as “fast growing” show a mean population growth rate for 2000 to 2010 that is more than six times larger than the growth rate for all metropolitan area cities. The profile

House Research Department September 2015 Grouping Minnesota Cities Page 11
scores for population, median household income, and percent of property value classified as commercial/industrial property for this cluster are below the means for metropolitan area cities, while the profile score for median household income for this group is slightly higher than for all cities in the region
The Fast Growing Suburbs are located in areas that were relatively rural until recently and would be considered third-ring suburbs or located on the fringe of the urban area. These cities are highly dependent on the freeway system to allow residents access to jobs in other areas. Many of these cities are along the transportation corridors to St. Cloud and Rochester, two nearby major cities. The rapid growth of cities in this cluster raise special difficulties for these communities in providing necessary government services and infrastructure.
The cities in this cluster are essentially small bedroom communities. With few exceptions, they have minimal commercial/industrial development. This means that these cities have little in-commuting and mainly serve their resident population. The higher than average household incomes indicate an increased ability to pay for city services with less need to provide services to low income groups.
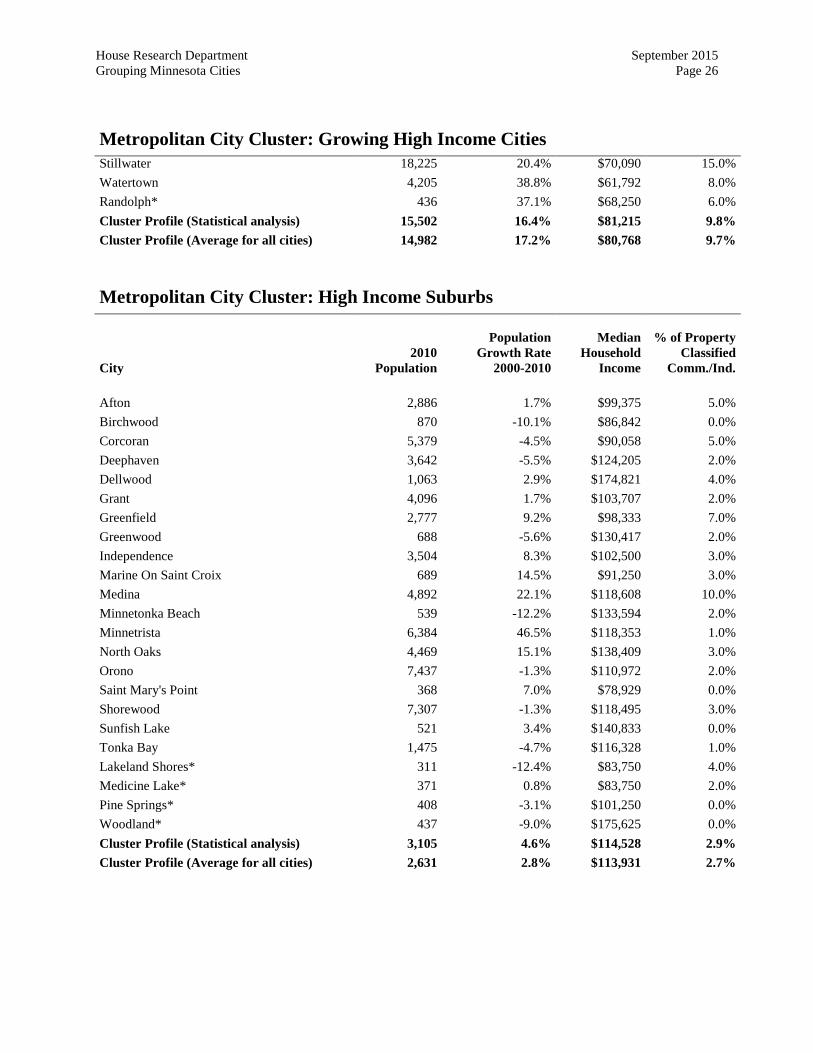
5. Growing High Income Cities (Number of cities = 29) (Examples: Chanhassen, Cottage
Grove)
Cities classified in the “Growing High Income” cluster are similar to the cities in the previous cluster but they are slightly larger and their growth has slowed to near the regional average. Roughly half of these cities were classified as high growth cities in the 2002 analysis.
Like fast growing suburbs, the growing high income cities are generally located in the outer rings of the Twin Cities metropolitan area. They are generally bedroom communities with below average commercial/industrial development.
6. High Income Suburbs (Number of cities = 23) (Examples: Minnetonka Beach, North Oaks)
The predominant characteristic for the “High Income Suburbs” cluster is its profile score for median household income, which is 50 percent higher than the average for all cities in the region. The scores for the other three factors—population, population growth, and percent of property classified as commercial/industrial—are significantly below the regional averages.
High Income Suburbs tend to be very small bedroom communities with virtually no commercial development. This means that the cities have little in-commuting and primarily provide services to their resident populations. The extremely high median household incomes indicate an ability to fund city services internally with little outside help.
7. Small Cities (Number of cities = 32) (Examples: St. Anthony, Willernie)
The “Small Cities” cluster includes cities that are smaller than average for the metropolitan area with an average population of about one-third of the average population for all metropolitan cities. The cluster’s profile on other cluster variables (per capita
House Research Department September 2015 Grouping Minnesota Cities Page 12
commercial/industrial market value, population growth, and median household income) is also below the average for metropolitan area cities.
This group of cities is made up of two types: small cities in developed areas that have no room for growth (i.e., Falcon Heights); and small cities in the exurban area that have yet to be affected by exurban growth (i.e., Hamburg). Small cities may face unique problems in delivering government services to their communities due to economies of scale. These problems may require special solutions such as contracting with other governmental units to provide services.
Greater Minnesota City Clusters
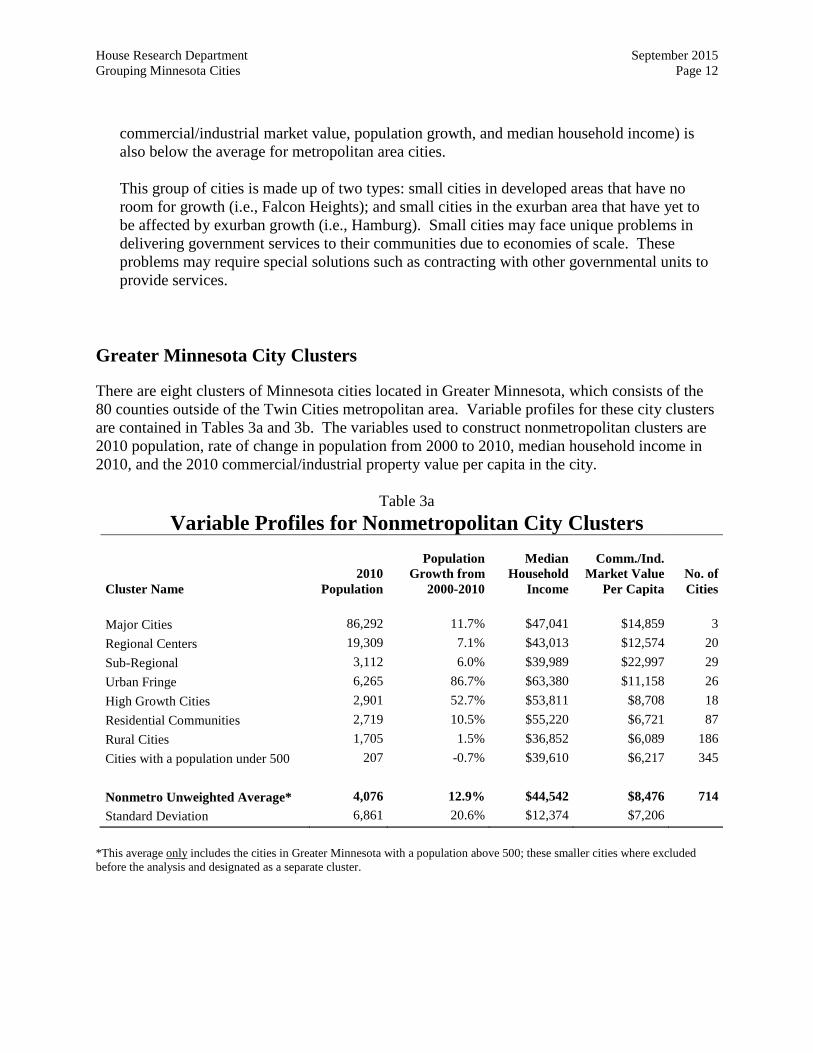
There are eight clusters of Minnesota cities located in Greater Minnesota, which consists of the 80 counties outside of the Twin Cities metropolitan area. Variable profiles for these city clusters are contained in Tables 3a and 3b. The variables used to construct nonmetropolitan clusters are 2010 population, rate of change in population from 2000 to 2010, median household income in 2010, and the 2010 commercial/industrial property value per capita in the city.
Table 3a Variable Profiles for Nonmetropolitan City Clusters
Cluster Name
2010 Population
Population
Growth from 2000-2010
Median
Household Income
Comm./Ind.
Market Value Per Capita
No. of Cities
Major Cities 86,292 11.7% $47,041 $14,859 3 Regional Centers 19,309 7.1% $43,013 $12,574 20 Sub-Regional 3,112 6.0% $39,989 $22,997 29 Urban Fringe 6,265 86.7% $63,380 $11,158 26 High Growth Cities 2,901 52.7% $53,811 $8,708 18 Residential Communities 2,719 10.5% $55,220 $6,721 87 Rural Cities 1,705 1.5% $36,852 $6,089 186 Cities with a population under 500 207 -0.7% $39,610 $6,217 345 Nonmetro Unweighted Average* 4,076 12.9% $44,542 $8,476 714 Standard Deviation 6,861 20.6% $12,374 $7,206
*This average only includes the cities in Greater Minnesota with a population above 500; these smaller cities where excluded before the analysis and designated as a separate cluster.
House Research Department September 2015 Grouping Minnesota Cities Page 13
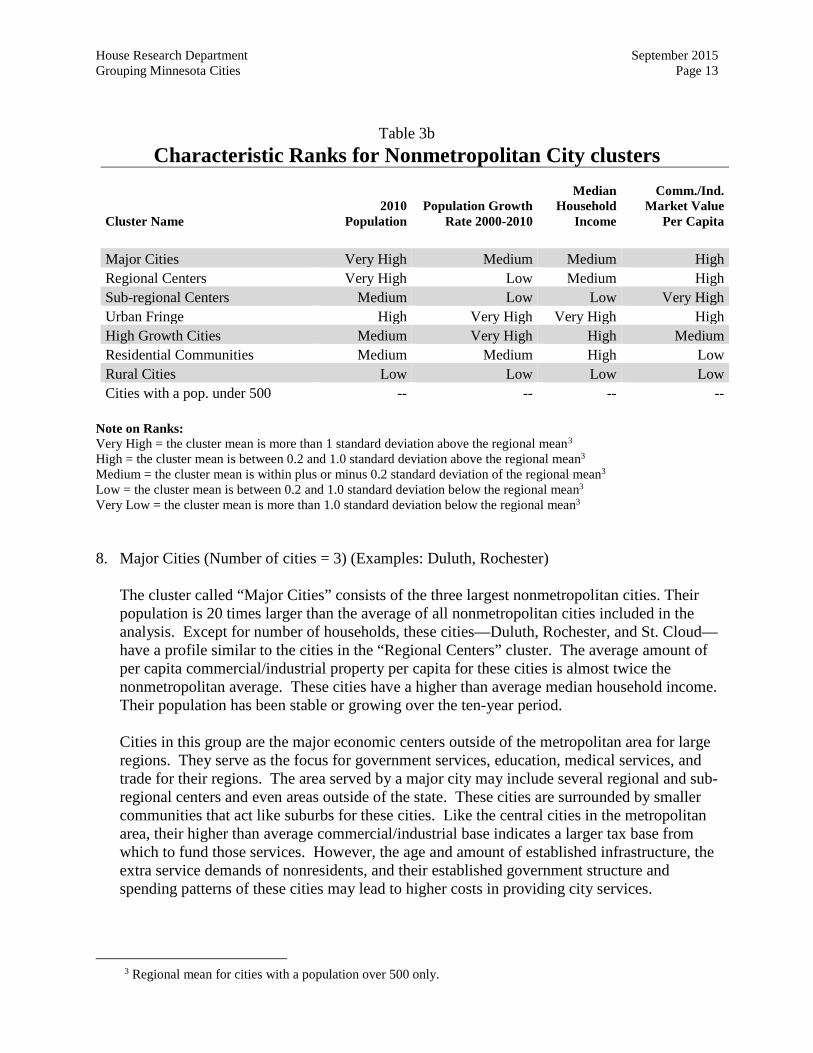
Table 3b Characteristic Ranks for Nonmetropolitan City clusters
Cluster Name
2010 Population
Population Growth Rate 2000-2010
Median
Household Income
Comm./Ind. Market Value
Per Capita
Major Cities Very High Medium Medium High Regional Centers Very High Low Medium High Sub-regional Centers Medium Low Low Very High Urban Fringe High Very High Very High High High Growth Cities Medium Very High High Medium Residential Communities Medium Medium High Low Rural Cities Low Low Low Low Cities with a pop. under 500 -- -- -- --
Note on Ranks: Very High = the cluster mean is more than 1 standard deviation above the regional mean3 High = the cluster mean is between 0.2 and 1.0 standard deviation above the regional mean3
Medium = the cluster mean is within plus or minus 0.2 standard deviation of the regional mean3
Low = the cluster mean is between 0.2 and 1.0 standard deviation below the regional mean3
Very Low = the cluster mean is more than 1.0 standard deviation below the regional mean3
8. Major Cities (Number of cities = 3) (Examples: Duluth, Rochester)
The cluster called “Major Cities” consists of the three largest nonmetropolitan cities. Their population is 20 times larger than the average of all nonmetropolitan cities included in the analysis. Except for number of households, these cities—Duluth, Rochester, and St. Cloud—have a profile similar to the cities in the “Regional Centers” cluster. The average amount of per capita commercial/industrial property per capita for these cities is almost twice the nonmetropolitan average. These cities have a higher than average median household income. Their population has been stable or growing over the ten-year period.
Cities in this group are the major economic centers outside of the metropolitan area for large regions. They serve as the focus for government services, education, medical services, and trade for their regions. The area served by a major city may include several regional and sub-regional centers and even areas outside of the state. These cities are surrounded by smaller communities that act like suburbs for these cities. Like the central cities in the metropolitan area, their higher than average commercial/industrial base indicates a larger tax base from which to fund those services. However, the age and amount of established infrastructure, the extra service demands of nonresidents, and their established government structure and spending patterns of these cities may lead to higher costs in providing city services.
3 Regional mean for cities with a population over 500 only.
House Research Department September 2015 Grouping Minnesota Cities Page 14
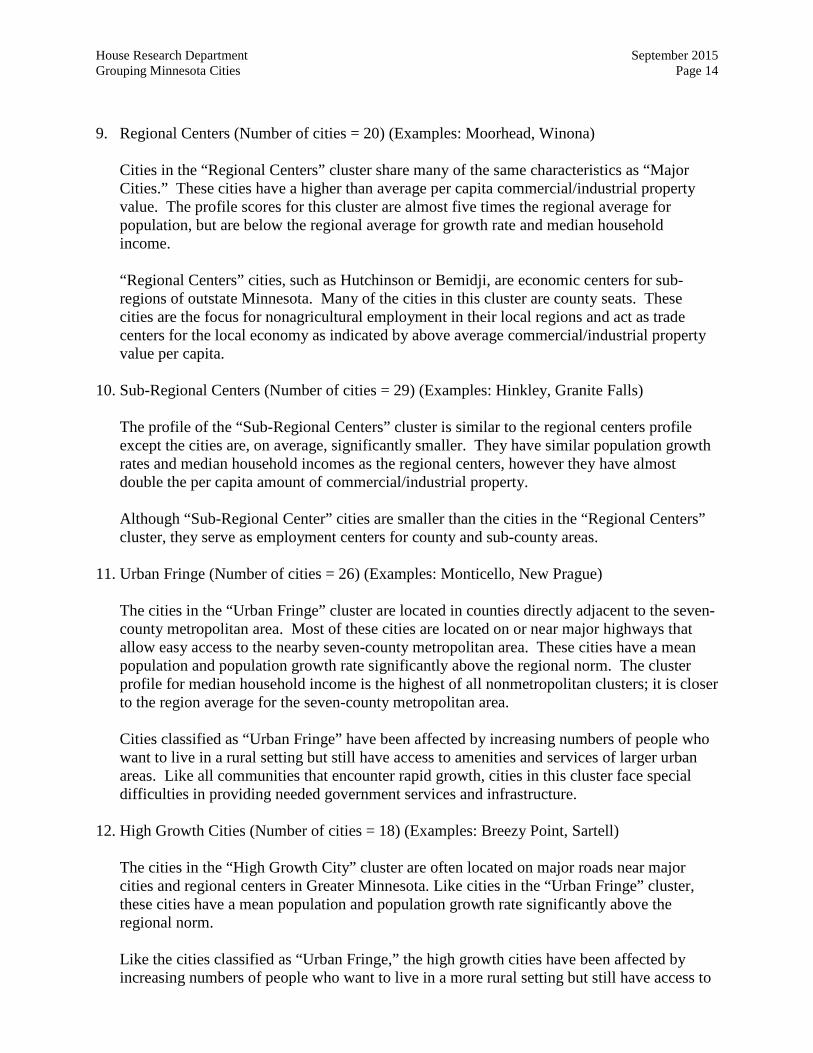
9. Regional Centers (Number of cities = 20) (Examples: Moorhead, Winona)
Cities in the “Regional Centers” cluster share many of the same characteristics as “Major Cities.” These cities have a higher than average per capita commercial/industrial property value. The profile scores for this cluster are almost five times the regional average for population, but are below the regional average for growth rate and median household income.
“Regional Centers” cities, such as Hutchinson or Bemidji, are economic centers for sub-regions of outstate Minnesota. Many of the cities in this cluster are county seats. These cities are the focus for nonagricultural employment in their local regions and act as trade centers for the local economy as indicated by above average commercial/industrial property value per capita.
10. Sub-Regional Centers (Number of cities = 29) (Examples: Hinkley, Granite Falls)
The profile of the “Sub-Regional Centers” cluster is similar to the regional centers profile except the cities are, on average, significantly smaller. They have similar population growth rates and median household incomes as the regional centers, however they have almost double the per capita amount of commercial/industrial property.
Although “Sub-Regional Center” cities are smaller than the cities in the “Regional Centers” cluster, they serve as employment centers for county and sub-county areas.
11. Urban Fringe (Number of cities = 26) (Examples: Monticello, New Prague)
The cities in the “Urban Fringe” cluster are located in counties directly adjacent to the seven-county metropolitan area. Most of these cities are located on or near major highways that allow easy access to the nearby seven-county metropolitan area. These cities have a mean population and population growth rate significantly above the regional norm. The cluster profile for median household income is the highest of all nonmetropolitan clusters; it is closer to the region average for the seven-county metropolitan area.
Cities classified as “Urban Fringe” have been affected by increasing numbers of people who want to live in a rural setting but still have access to amenities and services of larger urban areas. Like all communities that encounter rapid growth, cities in this cluster face special difficulties in providing needed government services and infrastructure.
12. High Growth Cities (Number of cities = 18) (Examples: Breezy Point, Sartell)
The cities in the “High Growth City” cluster are often located on major roads near major cities and regional centers in Greater Minnesota. Like cities in the “Urban Fringe” cluster, these cities have a mean population and population growth rate significantly above the regional norm.
Like the cities classified as “Urban Fringe,” the high growth cities have been affected by increasing numbers of people who want to live in a more rural setting but still have access to
House Research Department September 2015 Grouping Minnesota Cities Page 15
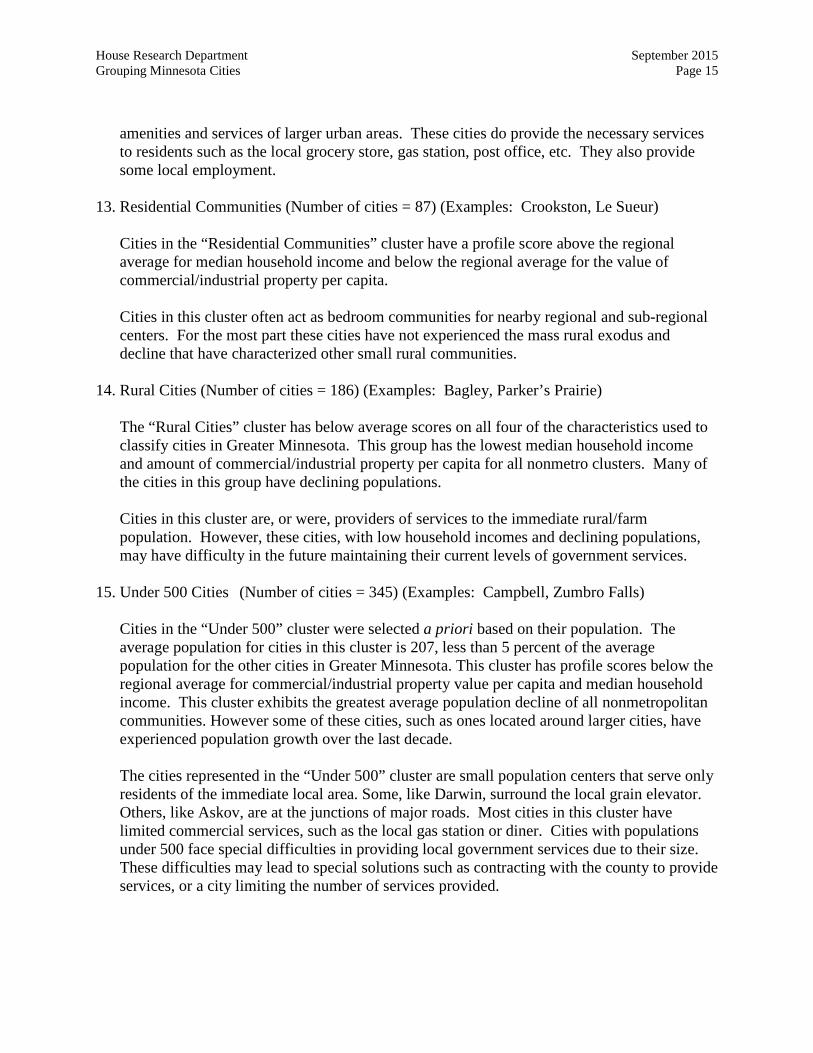
amenities and services of larger urban areas. These cities do provide the necessary services to residents such as the local grocery store, gas station, post office, etc. They also provide some local employment.
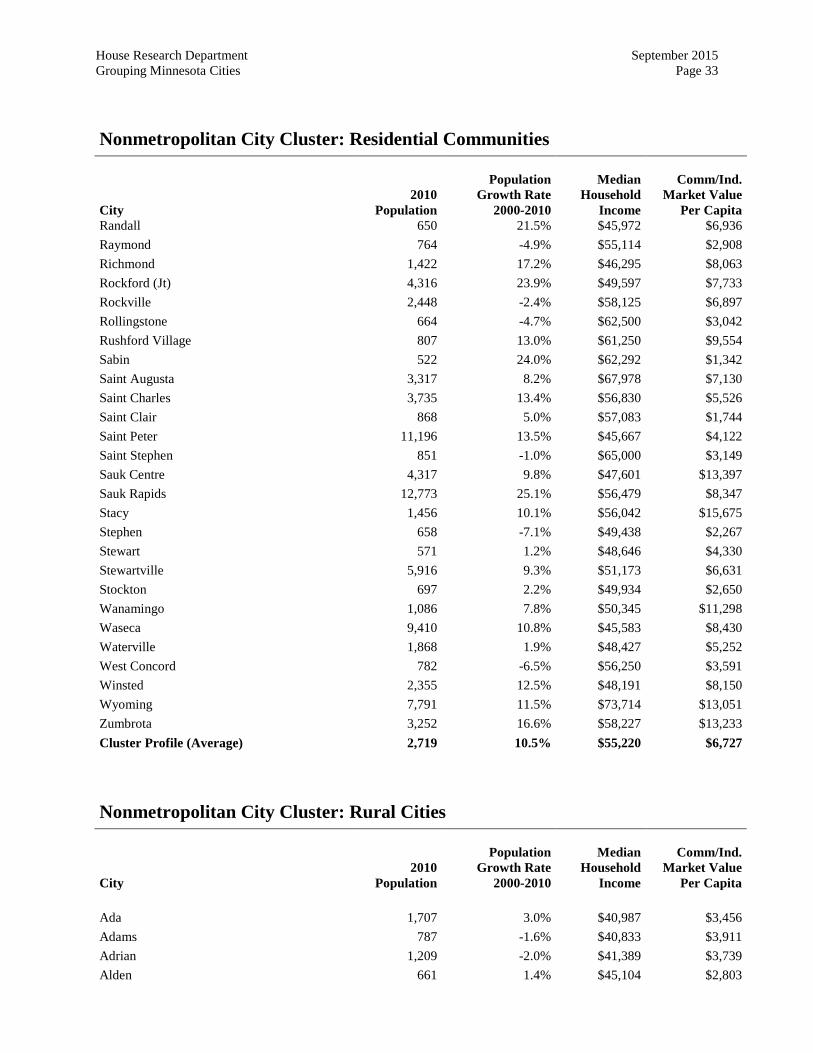
13. Residential Communities (Number of cities = 87) (Examples: Crookston, Le Sueur)
Cities in the “Residential Communities” cluster have a profile score above the regional average for median household income and below the regional average for the value of commercial/industrial property per capita.
Cities in this cluster often act as bedroom communities for nearby regional and sub-regional centers. For the most part these cities have not experienced the mass rural exodus and decline that have characterized other small rural communities.
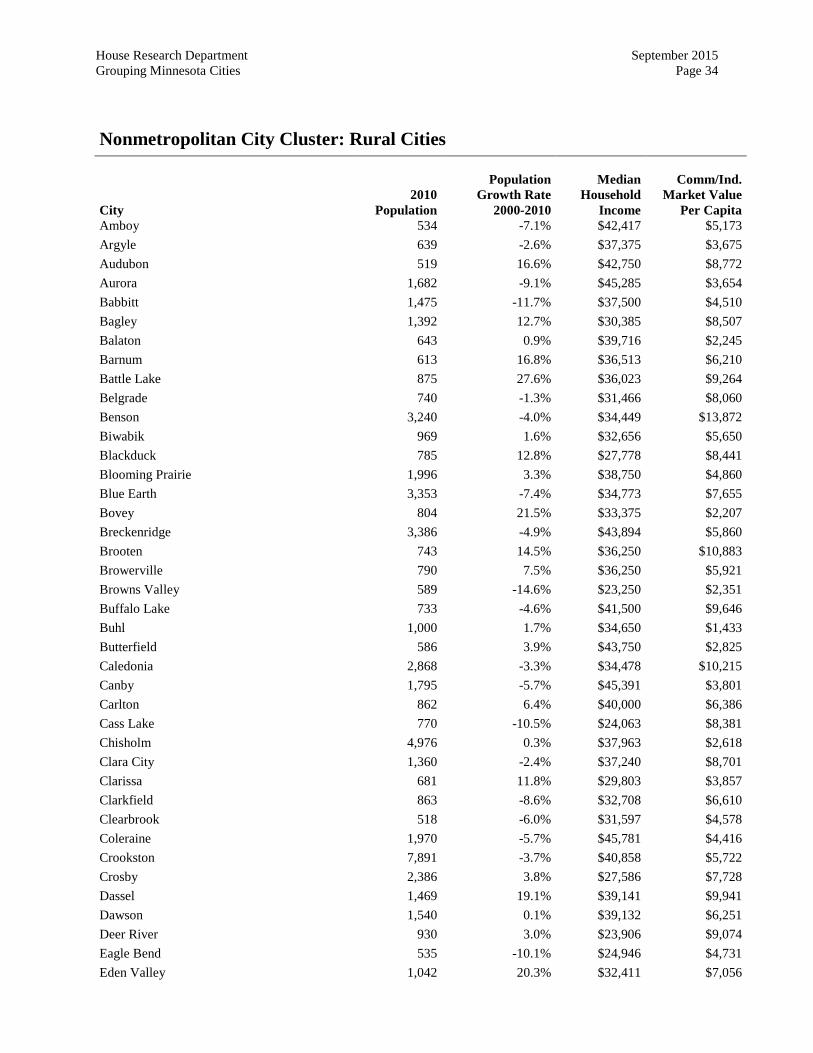
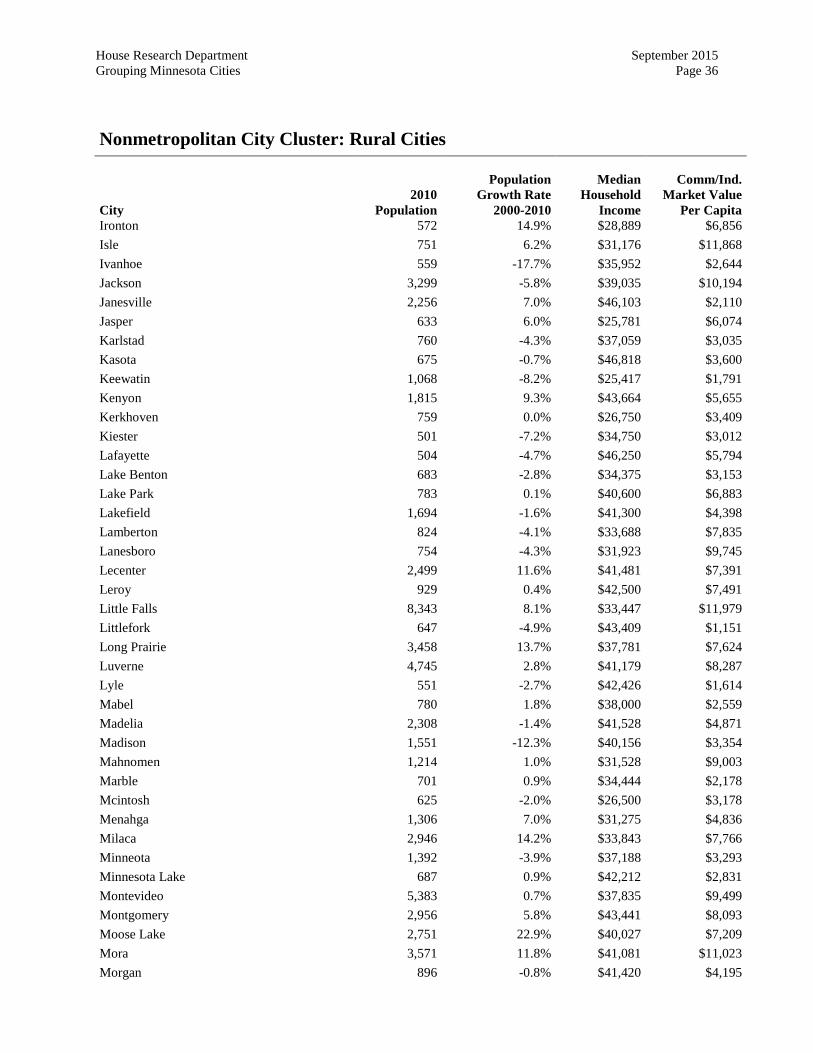
14. Rural Cities (Number of cities = 186) (Examples: Bagley, Parker’s Prairie)
The “Rural Cities” cluster has below average scores on all four of the characteristics used to classify cities in Greater Minnesota. This group has the lowest median household income and amount of commercial/industrial property per capita for all nonmetro clusters. Many of the cities in this group have declining populations.
Cities in this cluster are, or were, providers of services to the immediate rural/farm population. However, these cities, with low household incomes and declining populations, may have difficulty in the future maintaining their current levels of government services.
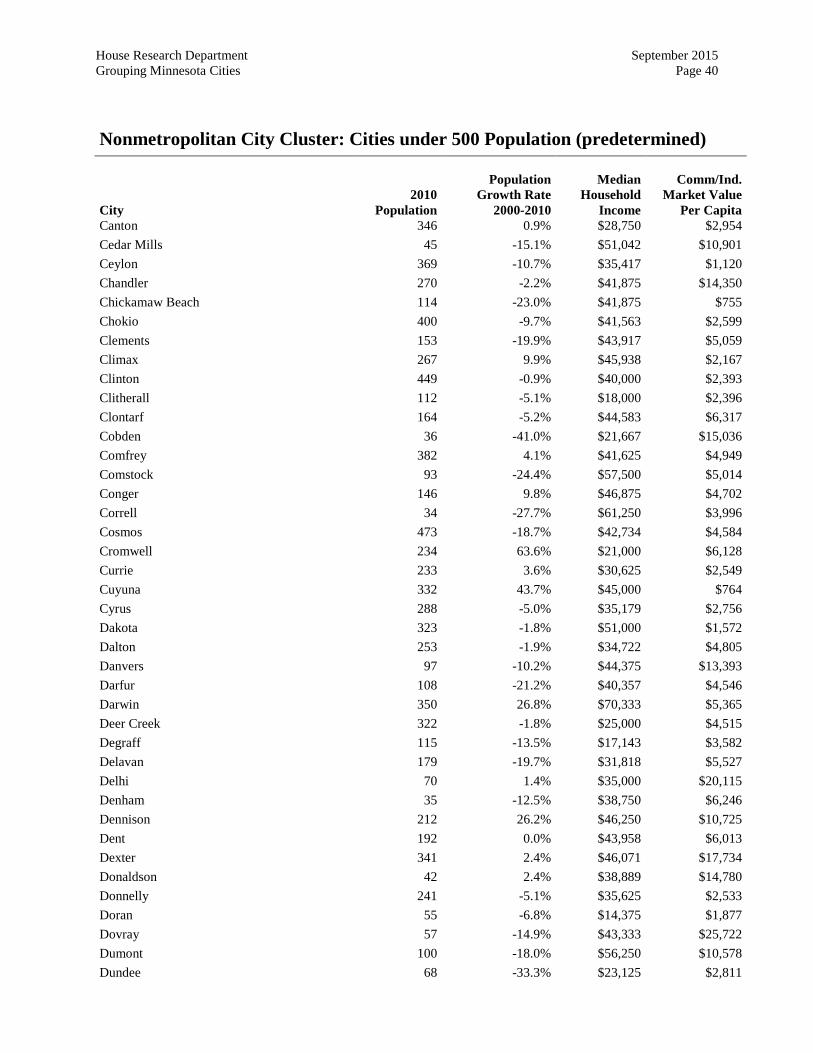
15. Under 500 Cities (Number of cities = 345) (Examples: Campbell, Zumbro Falls)
Cities in the “Under 500” cluster were selected a priori based on their population. The average population for cities in this cluster is 207, less than 5 percent of the average population for the other cities in Greater Minnesota. This cluster has profile scores below the regional average for commercial/industrial property value per capita and median household income. This cluster exhibits the greatest average population decline of all nonmetropolitan communities. However some of these cities, such as ones located around larger cities, have experienced population growth over the last decade.
The cities represented in the “Under 500” cluster are small population centers that serve only residents of the immediate local area. Some, like Darwin, surround the local grain elevator. Others, like Askov, are at the junctions of major roads. Most cities in this cluster have limited commercial services, such as the local gas station or diner. Cities with populations under 500 face special difficulties in providing local government services due to their size. These difficulties may lead to special solutions such as contracting with the county to provide services, or a city limiting the number of services provided.
House Research Department September 2015 Grouping Minnesota Cities Page 16
Appendix A: Classification Methodology
What is Cluster Analysis?
Cluster analysis is a statistical method of classifying a set of objects into groups with similar characteristics. Using this technique, a researcher calculates which objects are statistically most similar to one another, and then sorts them into different “clusters” or groups of like objects. This technique is useful because it allows an analyst to create rigorous categorization schemes or typologies grounded in empirical data.
Cluster analysis differs from other statistical analysis techniques because there is not a single correct way to categorize a set of objects; it is more of an art than a science. While objects are always assigned to the group to which they are statistically most similar, there are typically a number of equally valid ways of grouping objects using different variables and numbers of groups. The “best” classification is the one that is most intuitively valid and analytically useful for the proposed use of the clusters.
The Minnesota city clusters are developed to allow analysis of the effects of property tax and local aid proposals on different types of cities. For this reason, the clusters are based on city characteristics related to local government spending needs and ability to pay. We ultimately classified all of Minnesota’s 853 cities into one of 15 different clusters, seven of which consisted of cities in the seven-county Twin Cities metropolitan area and eight of which consisted of cities in Greater Minnesota. The department then assigned these groups of cities intuitive names that describe the kinds of cities they contain, such as “Fast Growing Suburbs,” “Regional Centers,” or “Urban Fringe.”
The resulting classification scheme is useful because it allows legislators and policy analysts to quickly compare the outcomes of policy changes for similar cities, as well as to think more generally about how different kinds of cities fare relative to others. This typology is useful because it allows an analyst to think about policy changes with a scope that is narrower than looking at the state as a whole, but broader than looking at a particular city. It also provides a more nuanced analysis of policy changes than can be achieved by simply classifying cities based on one characteristic, such as geographic location
Data Collected and Characteristics Chosen for Analysis At the start of the analysis, we collected data on more than 35 characteristics for each city in Minnesota. Our goal was to eventually use four to five characteristics to classify cities, but it began with the broader list of potential characteristics below. Demographic and housing data came from either the 2010 Decennial Census or from the Census Bureau’s American Community Survey.4 We used property value and tax capacity data for 2011, from the Minnesota Department of Revenue.
4 American Community Survey data were from five-year pooled samples from the years 2007 to 2011.

House Research Department September 2015 Grouping Minnesota Cities Page 17
Table A-1: Characteristics Initially Examined Demographic Housing Property Value/Tax Capacity
(all values per capita) • Average household size • Median household income • Natural logarithm of the
population • Per capita income • Population • Population density per acre • Population growth
(previous 10 years) • Population growth
(previous 5 years) • Percent aged 18 or younger • Percent aged 65 or older • Percent change in median
household income (previous 10 years)
• Percent change in non-Hispanic, white only (previous 10 years)
• Percent living in group quarters
• Percent living in poverty • Percent non-Hispanic,
white only • Percent over 25 with a
bachelor’s degree • Percent living in single
parent households • Total households
• Median gross rent • Median home value • Percent of housing units
built 1939 or earlier • Percent of housing units
built 1949 or earlier • Percent of housing units
built 1969 or earlier • Percent of housing units
built 1979 or earlier • Percent of housing units
built 2005 or later • Percent of housing units
occupied by renters • Percent of housing units
that were vacant
• Adjusted net tax capacity • Percent of total property
value represented by commercial/industrial property
• Market value of commercial/industrial property
• Market value of residential/apartment property
• Market value of farm property
• Market value of seasonal-recreational property.
• Market value of public utility property
• Market value of state-owned land
• Market value of tax-exempt property
We eventually decided against using most of the above characteristics for a variety of reasons. Some characteristics were highly correlated with one another, such as college education and median household income, and the inclusion both would be redundant and add little analytical value. Others, such as market value of farm property, were irrelevant to many Minnesota cities, and were therefore an ineffective method for categorizing them.
House Research Department September 2015 Grouping Minnesota Cities Page 18
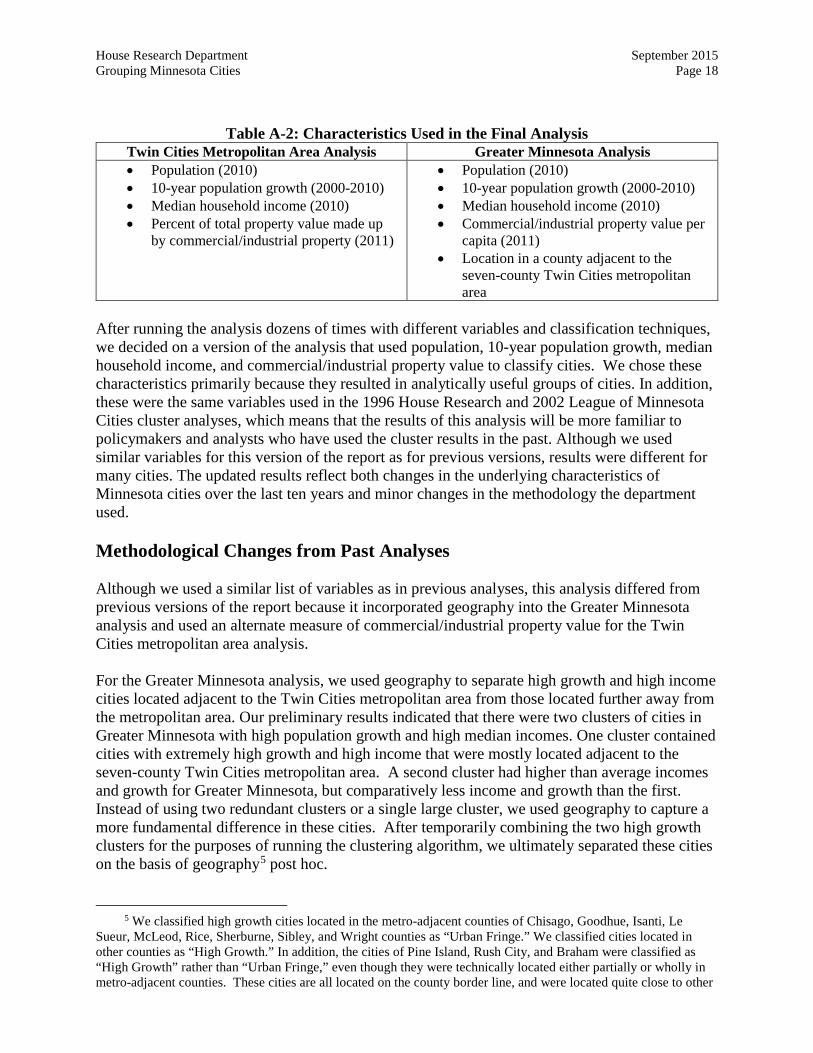
Table A-2: Characteristics Used in the Final Analysis Twin Cities Metropolitan Area Analysis Greater Minnesota Analysis • Population (2010) • 10-year population growth (2000-2010) • Median household income (2010) • Percent of total property value made up
by commercial/industrial property (2011)
• Population (2010) • 10-year population growth (2000-2010) • Median household income (2010) • Commercial/industrial property value per
capita (2011) • Location in a county adjacent to the
seven-county Twin Cities metropolitan area
After running the analysis dozens of times with different variables and classification techniques, we decided on a version of the analysis that used population, 10-year population growth, median household income, and commercial/industrial property value to classify cities. We chose these characteristics primarily because they resulted in analytically useful groups of cities. In addition, these were the same variables used in the 1996 House Research and 2002 League of Minnesota Cities cluster analyses, which means that the results of this analysis will be more familiar to policymakers and analysts who have used the cluster results in the past. Although we used similar variables for this version of the report as for previous versions, results were different for many cities. The updated results reflect both changes in the underlying characteristics of Minnesota cities over the last ten years and minor changes in the methodology the department used. Methodological Changes from Past Analyses Although we used a similar list of variables as in previous analyses, this analysis differed from previous versions of the report because it incorporated geography into the Greater Minnesota analysis and used an alternate measure of commercial/industrial property value for the Twin Cities metropolitan area analysis. For the Greater Minnesota analysis, we used geography to separate high growth and high income cities located adjacent to the Twin Cities metropolitan area from those located further away from the metropolitan area. Our preliminary results indicated that there were two clusters of cities in Greater Minnesota with high population growth and high median incomes. One cluster contained cities with extremely high growth and high income that were mostly located adjacent to the seven-county Twin Cities metropolitan area. A second cluster had higher than average incomes and growth for Greater Minnesota, but comparatively less income and growth than the first. Instead of using two redundant clusters or a single large cluster, we used geography to capture a more fundamental difference in these cities. After temporarily combining the two high growth clusters for the purposes of running the clustering algorithm, we ultimately separated these cities on the basis of geography5 post hoc.
5 We classified high growth cities located in the metro-adjacent counties of Chisago, Goodhue, Isanti, Le
Sueur, McLeod, Rice, Sherburne, Sibley, and Wright counties as “Urban Fringe.” We classified cities located in other counties as “High Growth.” In addition, the cities of Pine Island, Rush City, and Braham were classified as “High Growth” rather than “Urban Fringe,” even though they were technically located either partially or wholly in metro-adjacent counties. These cities are all located on the county border line, and were located quite close to other
House Research Department September 2015 Grouping Minnesota Cities Page 19
In addition to the use of geography for Greater Minnesota, we used a slightly different measure of commercial/industrial property value for the Twin Cities metropolitan area than we did for the rest of the state. For the Twin Cities metropolitan area, we used the share of total property value represented by commercial/industrial property, while for Greater Minnesota, we used commercial/industrial property value per capita. We chose this alternate measure because in the Twin Cities metropolitan area, the use of commercial/industrial property per capita resulted in certain cities with high overall property values being improperly classified as commercial centers. We initially chose commercial/industrial property as a variable to capture the amount of commercial activity in a given city. When we ran our analysis using per capita commercial/industrial property, lake cities with high overall property values such as Wayzata ended up classified by the analysis as commercial centers, because all property in these areas was more valuable due to the city’s location. By switching to commercial/industrial property as a share of total property, the analysis was able to better identify which cities actually contained a lot of commercial activity. A Priori Separations Before running any quantitative analysis, we made four a priori decisions about how to structure the clustering process. First, as with previous versions of the cluster analysis, we ran two separate analyses for the seven-county Twin Cities metropolitan area and the rest of Greater Minnesota. This decision reflected a key frame that policymakers use when thinking about Minnesota cities. Moreover, it reflected statistically measureable differences between the two regions; cities in the metropolitan area are on average larger and have much higher median incomes than cities in Greater Minnesota. We considered breaking with previous versions of the cluster analysis and running a single, combined cluster analysis for the state of Minnesota as a whole. To test the validity of such an approach, we ran several iterations of a combined cluster analysis. While the combined cluster analysis produced several surprising and potentially insightful groupings of cities, many of the resulting clusters were too confusing to be used as a tool for policy analysis. As a result, we decided to stick with the tradition of separating the Twin Cities metropolitan area region from the rest of the state for the cluster groupings. Second, because of their unique role in the Minnesota economy, we established the “Center City” cluster of Minneapolis and St. Paul a priori. Because we pre-determined the “Center City” cluster, we did not include Minneapolis and St. Paul in our calculations for the Twin Cities metropolitan area. Third, we initially excluded cities with fewer than 500 people from our analysis. The sheer quantity of such cities in Greater Minnesota in particular threatened to give them outsized
“High Growth” cities. This categorization reflects a judgment on the part of the department that these cities were more similar to the other cities in the “High Growth” cluster than to the cities in the “Urban Fringe” cluster.

House Research Department September 2015 Grouping Minnesota Cities Page 20
influence on the results of the analysis. By focusing on lager cities, we could make sure that the clusters reflected meaningful differences between the state’s main population centers. For the Twin Cities metropolitan area analysis, we assigned the 14 cities with populations less than 500 to the most mathematically similar cluster. For Greater Minnesota, which contained 345 cities with populations below 500, these cities were grouped into a separate cluster, “Cities with a population under 500.” Fourth, we initially excluded four outlier cities from our analysis that tended to overwhelm the clustering algorithm. Carver, Elko/New Market, and Mayer grew so quickly in ten years (194.2 percent, 411.2 percent, and 215.7 percent, respectively) that they tended to break off into one and two city clusters without any analytical value. Along with these high growth cities, we excluded the city of Landfall from our initial analysis because it had an exceptionally high proportion (82 percent) of its total property value represented by commercial/industrial property. While we initially excluded these cities from the clustering process, we added them to the most appropriate cluster post hoc. Hierarchical vs. Nonhierarchical Clustering Statisticians have devised two main methods for performing cluster analyses: hierarchical and nonhierarchical clustering. Hierarchical Clustering: To perform a hierarchical cluster analysis, a statistician does not need to specify a preferred number of clusters as an outcome or identify starting points for the “centers” of the clusters. Instead, hierarchical clustering groups objects in a step-by-step process. It begins with a large data set and merges the most similar objects or groups of objects together one after the other. Advantages:
• Requires fewer preconceptions about number of clusters and initial centers than nonhierarchical clustering.
• Always produces the same result given a particular set of characteristics. • A “dendogram” of a hierarchical cluster analysis allows an analyst to see how groups
progressively merge with each other during each step of the process, which can be useful in identifying an intuitive or analytically meaningful number of clusters.
Disadvantages: • Less flexible than nonhierarchical clustering. • Once an object is classified in a particular group, it cannot move to another group at a
later stage in the process. • Tends to emphasize small differences between large groups rather than large differences
between small groups.
Nonhierarchical Clustering: Nonhierarchical clustering typically requires an analyst to specify the number of clusters he or she wishes to create, as well as to describe the starting points or “centers” of each cluster. From there, the clustering algorithm assigns objects to whichever cluster they most closely resemble. This process is typically repeated several times as the centers
House Research Department September 2015 Grouping Minnesota Cities Page 21
of the clusters change and objects shift between groups. Advantages:
• Extremely flexible—allows a researcher to specify both the number and starting points for cluster centers.
• Iterative process allows cities to shift to whichever clusters they most closely resemble. Initial “errors” in classification are not irreversible.
Disadvantages: • Decisions about number of clusters may be influenced by an analyst’s preconceptions
about how objects should be sorted. • If no initial cluster centers are specified, cities are usually assigned randomly to particular
clusters, which can result in variation in final results depending on initial cluster centers. Method of Analysis Used We began our analysis by standardizing variables and proceeding to use an iterative nonhierarchical k-means cluster analysis, starting with 15 clusters and gradually eliminating redundant or analytically meaningless groupings. Prior to running the analysis, we standardized the variables to avoid placing undue emphasis on a single characteristic. The clustering process was conducted using SPSS, which always uses simple Euclidian distance to classify objects for a k-means cluster analysis. As a result, if we used variables with very different scales (e.g., median income and population growth rate), the clustering algorithm will weigh variables with larger units more heavily. We therefore standardized each variable, and ran the clustering algorithm using the standardized values. Because we ran two separate analyses, we standardized the variables separately for the Greater Minnesota and Twin Cities metropolitan area analyses. We developed the final clusters using an iterative process that started with a large number of clusters and proceeded to gradually merge and eliminate clusters until a meaningful result was achieved. Because we used the k-means method of cluster analysis, we had to initially specify the number of clusters we wished to generate. We initially conducted two separate 15-cluster analyses for the Twin Cities metropolitan area and Greater Minnesota. Starting with a large number of clusters gave us a better sense of the patterns and structure of the dataset, which made it easier to build. The initial 15 cluster analyses contained several clusters that were redundant with one another for purposes of interpretation. For example, both analyses contained two or more clusters with very high growth rates. While there is a statistical difference between these clusters, they are similar enough to combine for the purposes of policy analysis. To reduce the number of clusters to only analytically meaningful groupings, we eliminated one of these clusters and ran a new analysis using the final centers from the previous analysis as initial centers for a new analysis. In the next iteration of the analysis, the two high growth clusters would combine.

House Research Department September 2015 Grouping Minnesota Cities Page 22
After eliminating obviously redundant clusters from our initial analysis, we ended up with six distinct and meaningful clusters for the Twin Cities metropolitan area and seven distinct clusters for Greater Minnesota. Together with the “Center Cities” cluster in the Twin Cities metropolitan area and “Cities With a Population Under 500,” the final analysis resulted in 15 clusters for the state as a whole.

House Research Department September 2015 Grouping Minnesota Cities Page 23
Appendix B-1: City Clusters and Cluster Variables
Metropolitan City Cluster: Center Cities (predetermined) City
2010 Population
Population
Growth Rate 2000-2010
Median
Household Income
% of Property Classified
Comm./Ind. Minneapolis 382,578 0.0% $46,075 21.5% Saint Paul 285,068 -0.7% $45,439 19.2% Cluster Profile (including all cities) 333,823 -0.4% $45,757 20.3%
Metropolitan City Cluster: Established Cities
City
2010 Population
Population
Growth Rate 2000-2010
Median
Household Income
% of Property
Classified Comm./Ind.
Anoka 17,142 -5.2% $48,616 24.0% Arden Hills 9,552 -1.0% $78,681 32.0% Brooklyn Center 30,104 3.2% $49,226 22.0% Fridley 27,208 -0.9% $51,656 34.0% Golden Valley 20,371 0.4% $80,487 28.0% Hilltop 744 -2.9% $26,750 41.0% Hopkins 17,591 2.6% $46,828 29.0% Little Canada 9,773 0.0% $47,419 27.0% Long Lake 1,768 -4.0% $74,688 26.0% Maple Plain 1,768 -15.3% $65,625 31.0% Maplewood 38,018 8.8% $57,438 27.0% Mounds View 12,155 -4.6% $60,087 27.0% New Hope 20,339 -2.6% $49,833 23.0% Newport 3,435 -7.5% $49,646 22.0% Oak Park Heights 4,339 9.7% $50,449 27.0% Oakdale 27,378 2.7% $67,061 20.0% Osseo 2,430 -0.2% $41,964 32.0% Richfield 35,228 2.3% $51,549 19.0% Roseville 33,660 -0.1% $55,300 33.0% Vadnais Heights 12,302 -5.9% $69,926 25.0% Coates* 161 -1.2% $58,929 31.0%
* City assigned to the cluster post-analysis due to being an outlier or a city with a population under 500 in the metropolitan area Note: When cities were assigned to a cluster postanalysis, the cluster profile (unweighted average) is shown for both (1) the cities included in the statistical analysis only, and (2) all cities included in the final cluster.
House Research Department September 2015 Grouping Minnesota Cities Page 24
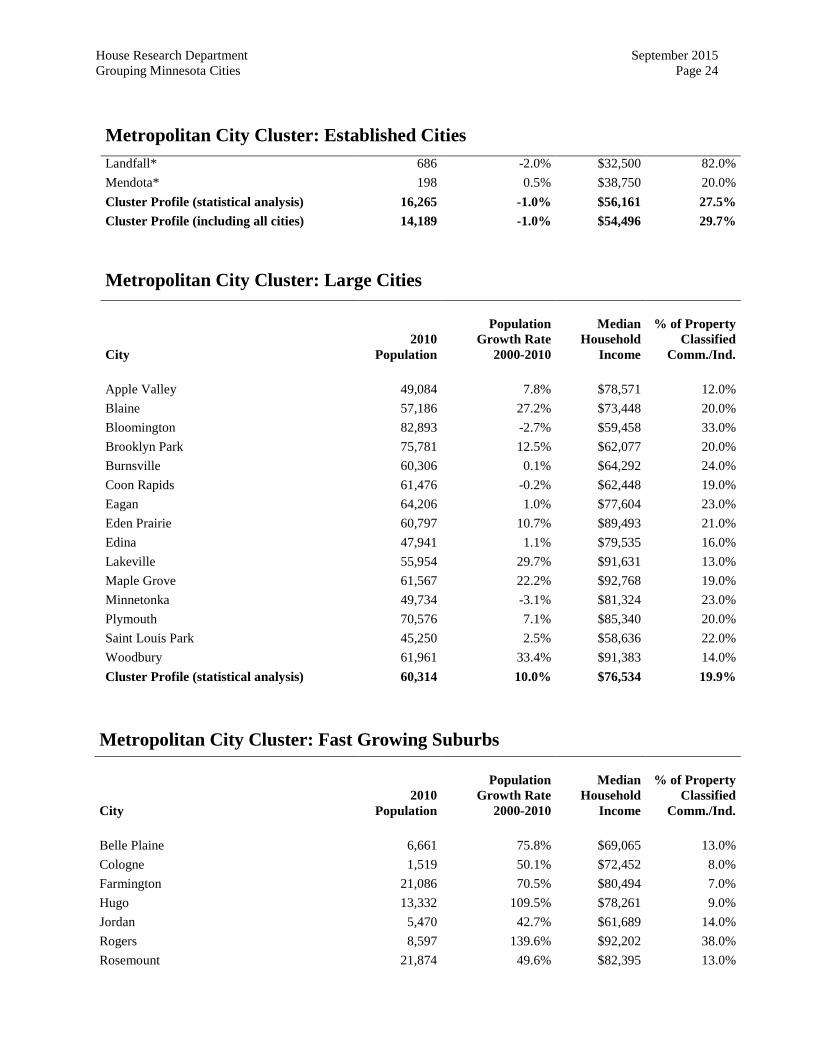
Metropolitan City Cluster: Established Cities Landfall* 686 -2.0% $32,500 82.0% Mendota* 198 0.5% $38,750 20.0% Cluster Profile (statistical analysis) 16,265 -1.0% $56,161 27.5% Cluster Profile (including all cities) 14,189 -1.0% $54,496 29.7%
Metropolitan City Cluster: Large Cities City
2010 Population
Population
Growth Rate 2000-2010
Median
Household Income
% of Property
Classified Comm./Ind.
Apple Valley 49,084 7.8% $78,571 12.0% Blaine 57,186 27.2% $73,448 20.0% Bloomington 82,893 -2.7% $59,458 33.0% Brooklyn Park 75,781 12.5% $62,077 20.0% Burnsville 60,306 0.1% $64,292 24.0% Coon Rapids 61,476 -0.2% $62,448 19.0% Eagan 64,206 1.0% $77,604 23.0% Eden Prairie 60,797 10.7% $89,493 21.0% Edina 47,941 1.1% $79,535 16.0% Lakeville 55,954 29.7% $91,631 13.0% Maple Grove 61,567 22.2% $92,768 19.0% Minnetonka 49,734 -3.1% $81,324 23.0% Plymouth 70,576 7.1% $85,340 20.0% Saint Louis Park 45,250 2.5% $58,636 22.0% Woodbury 61,961 33.4% $91,383 14.0% Cluster Profile (statistical analysis) 60,314 10.0% $76,534 19.9%
Metropolitan City Cluster: Fast Growing Suburbs City
2010 Population
Population
Growth Rate 2000-2010
Median
Household Income
% of Property
Classified Comm./Ind.
Belle Plaine 6,661 75.8% $69,065 13.0% Cologne 1,519 50.1% $72,452 8.0% Farmington 21,086 70.5% $80,494 7.0% Hugo 13,332 109.5% $78,261 9.0% Jordan 5,470 42.7% $61,689 14.0% Rogers 8,597 139.6% $92,202 38.0% Rosemount 21,874 49.6% $82,395 13.0%
House Research Department September 2015 Grouping Minnesota Cities Page 25
Metropolitan City Cluster: Fast Growing Suburbs Saint Francis 7,218 47.0% $67,480 8.0% Shakopee 37,076 80.3% $77,018 23.0% Victoria 7,345 82.5% $108,210 2.0% Waconia 10,697 57.0% $82,887 16.0% Carver* 3,724 194.2% $98,378 1.0% Elko/New Market* 4,110 411.2% $90,071 3.0% Hampton* 689 58.8% $65,833 6.0% Mayer* 1,749 215.7% $86,250 7.0% Cluster Profile (Statistical analysis) 12,807 73.1% $79,287 13.7% Cluster Profile (Average for all cities) 10,076 112.3% $80,846 11.2%
Metropolitan City Cluster: Growing High Income Cities City
2010 Population
Population
Growth Rate 2000-2010
Median
Household Income
% of Property
Classified Comm./Ind.
Andover 30,598 15.1% $89,586 5.0% Centerville 3,792 18.4% $82,558 8.0% Champlin 23,089 4.0% $80,279 9.0% Chanhassen 22,952 12.9% $100,284 15.0% Chaska 23,770 35.0% $70,707 18.0% Circle Pines 4,918 5.5% $73,400 4.0% Cottage Grove 34,589 13.1% $80,830 9.0% East Bethel 11,626 6.3% $76,447 5.0% Forest Lake 18,375 27.3% $67,293 14.0% Ham Lake 15,296 20.3% $89,472 7.0% Hastings 22,172 21.8% $64,248 13.0% Inver Grove Heights 33,880 13.9% $67,661 13.0% Lake Elmo 8,069 17.6% $101,818 11.0% Lakeland 1,796 -6.3% $83,672 6.0% Lilydale 623 12.9% $77,500 11.0% Lino Lakes 20,216 20.4% $94,728 9.0% Mahtomedi 7,676 1.5% $87,731 6.0% Mendota Heights 11,071 -3.2% $92,727 19.0% Nowthen 4,443 24.9% $90,045 4.0% Oak Grove 8,031 16.3% $74,415 3.0% Prior Lake 22,796 43.2% $90,360 5.0% Ramsey 23,668 27.9% $81,598 14.0% Saint Bonifacius 2,283 21.9% $74,271 13.0% Savage 26,911 27.4% $89,183 15.0% Scandia 3,936 6.6% $80,556 2.0% Shoreview 25,043 -3.4% $80,762 13.0%
House Research Department September 2015 Grouping Minnesota Cities Page 26
Metropolitan City Cluster: Growing High Income Cities Stillwater 18,225 20.4% $70,090 15.0% Watertown 4,205 38.8% $61,792 8.0% Randolph* 436 37.1% $68,250 6.0% Cluster Profile (Statistical analysis) 15,502 16.4% $81,215 9.8% Cluster Profile (Average for all cities) 14,982 17.2% $80,768 9.7%
Metropolitan City Cluster: High Income Suburbs City
2010 Population
Population
Growth Rate 2000-2010
Median
Household Income
% of Property
Classified Comm./Ind.
Afton 2,886 1.7% $99,375 5.0% Birchwood 870 -10.1% $86,842 0.0% Corcoran 5,379 -4.5% $90,058 5.0% Deephaven 3,642 -5.5% $124,205 2.0% Dellwood 1,063 2.9% $174,821 4.0% Grant 4,096 1.7% $103,707 2.0% Greenfield 2,777 9.2% $98,333 7.0% Greenwood 688 -5.6% $130,417 2.0% Independence 3,504 8.3% $102,500 3.0% Marine On Saint Croix 689 14.5% $91,250 3.0% Medina 4,892 22.1% $118,608 10.0% Minnetonka Beach 539 -12.2% $133,594 2.0% Minnetrista 6,384 46.5% $118,353 1.0% North Oaks 4,469 15.1% $138,409 3.0% Orono 7,437 -1.3% $110,972 2.0% Saint Mary's Point 368 7.0% $78,929 0.0% Shorewood 7,307 -1.3% $118,495 3.0% Sunfish Lake 521 3.4% $140,833 0.0% Tonka Bay 1,475 -4.7% $116,328 1.0% Lakeland Shores* 311 -12.4% $83,750 4.0% Medicine Lake* 371 0.8% $83,750 2.0% Pine Springs* 408 -3.1% $101,250 0.0% Woodland* 437 -9.0% $175,625 0.0% Cluster Profile (Statistical analysis) 3,105 4.6% $114,528 2.9% Cluster Profile (Average for all cities) 2,631 2.8% $113,931 2.7%

House Research Department September 2015 Grouping Minnesota Cities Page 27
Metropolitan City Cluster: Smaller Residential Cities City
2010 Population
Population
Growth Rate 2000-2010
Median
Household Income
% of Property
Classified Comm./Ind.
Bayport 3,471 9.8% $56,356 18.0% Columbia Heights 19,496 5.3% $51,565 10.0% Columbus 3,914 -1.1% $82,917 14.0% Crystal 22,151 -2.4% $60,032 11.0% Dayton 4,671 -0.6% $69,583 11.0% Excelsior 2,188 -8.6% $60,135 20.0% Falcon Heights 5,321 -4.5% $54,929 6.0% Hamburg 513 -4.6% $68,000 9.0% Lake Saint Croix Beach 1,051 -7.8% $65,481 2.0% Lauderdale 2,379 0.6% $48,070 11.0% Lexington 2,049 -7.5% $50,357 17.0% Loretto 650 14.0% $69,583 21.0% Mound 9,052 -4.1% $65,942 3.0% New Brighton 21,456 -3.4% $60,396 18.0% North Saint Paul 11,460 -3.9% $52,995 12.0% Norwood Young America 3,549 14.2% $55,660 17.0% Robbinsdale 13,953 -1.2% $55,270 8.0% Saint Anthony 8,226 2.7% $54,310 16.0% Saint Paul Park 5,279 4.1% $64,034 11.0% South Saint Paul 20,160 0.0% $55,060 15.0% Spring Lake Park 6,412 -5.3% $53,623 21.0% Spring Park 1,669 -2.8% $45,125 13.0% Wayzata 3,688 -10.3% $64,369 20.0% West Saint Paul 19,540 0.7% $48,440 19.0% White Bear Lake 23,797 -2.2% $56,953 17.0% Willernie 507 -7.7% $55,833 14.0% Bethel* 466 5.2% $44,375 14.0% Gem Lake* 393 -6.2% $74,375 18.0% Miesville* 125 -7.4% $41,719 9.0% New Germany* 372 7.5% $57,750 8.0% New Trier* 112 -3.4% $73,750 6.0% Vermillion* 419 -4.1% $65,500 5.0% Cluster Profile (Statistical analysis) 8,331 -1.0% $58,655 13.6% Cluster Profile (Average for all cities) 6,828 -1.1% $58,828 12.9%

House Research Department September 2015 Grouping Minnesota Cities Page 28
Nonmetropolitan City Cluster: Major Cities City
2010 Population
Population
Growth Rate 2000-2010
Median
Household Income
Comm/Ind.
Market Value Per Capita
Duluth 86,265 -0.8% $41,092 $10,732 Rochester 106,769 24.4% $60,883 $18,694 Saint Cloud 65,842 11.4% $39,149 $15,152 Cluster Profile (Average) 86,292 11.7% $47,041 $14,859
Nonmetropolitan City Cluster: Regional Centers City
2010 Population
Population
Growth Rate 2000-2010
Median
Household Income
Comm/Ind.
Market Value Per Capita
Albert Lea 18,016 -1.9% $35,629 $10,429 Austin 24,718 6.0% $40,395 $6,222 Bemidji 13,431 12.7% $31,475 $17,074 Brainerd 13,590 3.1% $29,458 $14,561 Cloquet 12,124 8.2% $47,071 $11,216 Fairmont 10,666 -2.0% $40,007 $13,746 Faribault 23,352 12.2% $48,098 $11,364 Fergus Falls 13,138 -2.5% $37,872 $13,671 Hibbing 16,361 -4.2% $36,585 $7,340 Hutchinson 14,178 8.4% $57,750 $12,997 Mankato 39,309 21.2% $40,190 $20,862 Marshall 13,680 7.4% $42,685 $18,533 Moorhead 38,065 18.3% $44,598 $9,632 New Ulm 13,522 -0.5% $45,603 $10,435 Northfield 20,007 16.7% $63,934 $11,100 Owatonna 25,599 14.1% $53,569 $11,800 Red Wing 16,459 2.1% $49,810 $14,793 Willmar 19,610 6.9% $38,529 $13,941 Winona 27,592 1.9% $36,296 $12,397 Worthington 12,764 13.1% $40,703 $9,365 Cluster Profile (Average) 19,309 7.1% $43,013 $12,574

House Research Department September 2015 Grouping Minnesota Cities Page 29
Nonmetropolitan City Cluster: Sub-regional Centers
City
2010 Population
Population
Growth Rate 2000-2010
Median
Household Income
Comm/Ind.
Market Value Per Capita
Aitkin 2,165 9.1% $31,175 $17,580 Alexandria 11,070 25.5% $32,976 $32,707 Appleton 1,412 -50.8% $34,345 $17,987 Baudette 1,106 0.2% $48,819 $18,809 Baxter 7,610 37.0% $59,916 $44,716 Cannon Falls 4,083 7.6% $52,593 $18,002 Cook 574 -7.7% $31,750 $16,831 Crosslake 2,141 13.1% $50,806 $24,851 Deerwood 532 -9.8% $30,000 $19,251 Detroit Lakes 8,569 16.6% $36,798 $20,440 Grand Marais 1,351 -0.1% $40,772 $18,605 Grand Rapids 10,869 8.4% $41,776 $20,807 Hinckley 1,800 39.4% $36,250 $29,790 Laprairie 665 -10.1% $41,442 $18,223 Motley 671 14.7% $34,423 $17,479 Mt Iron 2,869 -4.3% $42,976 $15,818 Nisswa 1,971 0.9% $54,403 $24,494 Ottertail 572 26.8% $38,490 $37,032 Park Rapids 3,709 13.2% $28,586 $27,216 Pequot Lakes 2,162 20.0% $36,875 $19,556 Perham 2,985 16.6% $38,580 $21,362 Pine City 3,123 2.6% $46,025 $19,412 Princeton 4,698 19.5% $38,022 $15,577 Roseau 2,633 -4.5% $46,339 $13,088 Spicer 1,167 3.6% $38,977 $15,266 Waite Park 6,715 2.2% $38,031 $54,462 Walker 941 -12.0% $34,853 $32,098 Welcome 686 -4.9% $35,781 $19,173 Winthrop 1,399 2.3% $37,900 $16,291 Cluster Profile (Average) 3,112 6.0% $39,989 $22,997

House Research Department September 2015 Grouping Minnesota Cities Page 30
Nonmetropolitan City Cluster: Urban Fringe City
2010 Population
Population
Growth Rate 2000-2010
Median
Household Income
Comm/Ind.
Market Value Per Capita
Albertville 7,044 94.5% $74,940 $21,766 Becker 4,538 69.8% $70,526 $16,250 Big Lake 10,060 65.9% $64,807 $10,016 Buffalo 15,453 53.0% $62,705 $11,437 Cambridge 8,111 46.9% $46,487 $17,266 Chisago City 4,967 64.7% $59,464 $6,629 Clear Lake 545 104.9% $73,125 $11,449 Clearwater 1,735 102.2% $43,669 $13,808 Delano 5,464 42.4% $69,274 $14,625 Dundas 1,367 149.9% $62,065 $28,228 Elk River 22,974 39.7% $72,944 $17,686 Goodhue 1,176 51.2% $53,304 $7,455 Green Isle 559 67.4% $41,154 $4,618 Hanover ( 2,938 116.8% $100,764 $4,762 Isanti 5,251 125.9% $55,873 $7,882 Lindstrom 4,442 47.3% $57,888 $6,295 Lonsdale 3,674 146.4% $67,863 $7,683 Maple Lake 2,059 26.1% $48,092 $15,123 Monticello 12,759 62.2% $64,141 $19,858 Montrose 2,847 149.1% $61,593 $4,608 New Prague 7,321 60.6% $53,305 $9,620 Otsego 13,571 112.4% $74,449 $7,164 Saint Michael 16,399 80.2% $86,427 $7,902 Shafer 1,045 204.7% $50,370 $5,873 Waverly 1,357 85.4% $66,786 $4,990 Zimmerman 5,228 83.4% $65,858 $7,118 Cluster Profile (Average) 6,265 86.7% $63,380 $11,158 Nonmetropolitan City Cluster: High Growth Cities City
2010 Population
Population
Growth Rate 2000-2010
Median
Household Income
Comm/Ind.
Market Value Per Capita
Albany 2,561 42.6% $47,938 $11,345 Braham 1,793 40.5% $41,607 $4,242 Breezy Point 2,346 139.6% $51,964 $10,884 Carlos 502 52.6% $50,000 $4,296

House Research Department September 2015 Grouping Minnesota Cities Page 31
Nonmetropolitan City Cluster: High Growth Cities Cold Spring 4,025 35.3% $63,448 $11,989 Dilworth 4,024 34.1% $50,833 $11,380 Dover 735 67.8% $65,833 $3,802 Foreston 533 37.0% $44,688 $5,142 Freeport 632 39.2% $60,789 $17,652 Oronoco 1,300 47.2% $83,750 $3,260 Pine Island 3,263 39.6% $53,405 $7,641 Rice 1,275 79.3% $56,940 $16,343 Rock Creek 1,628 45.5% $47,287 $3,103 Royalton 1,242 52.2% $47,292 $6,868 Rush City 3,079 46.5% $43,707 $8,715 Saint Joseph 6,534 39.6% $59,680 $9,094 Sartell 15,876 64.7% $65,513 $13,315 Walnut Grove 871 45.4% $33,917 $7,664 Cluster Profile (Average) 2,901 52.7% $53,811 $8,708
Nonmetropolitan City Cluster: Residential Communities City
2010 Population
Population
Growth Rate 2000-2010
Median
Household Income
Comm/Ind.
Market Value Per Capita
Annandale 3,228 20.3% $45,395 $11,102 Arlington 2,233 9.0% $50,417 $3,051 Atwater 1,133 5.0% $51,125 $6,206 Avon 1,396 12.4% $55,847 $13,621 Barnesville 2,563 17.9% $53,295 $2,913 Bird Island 1,042 -12.8% $50,069 $5,140 Brownsdale 676 -5.8% $52,679 $3,032 Brownton 762 -5.6% $54,583 $1,798 Byron 4,914 40.4% $66,406 $6,935 Center City 628 7.9% $65,179 $6,669 Chatfield 2,779 16.1% $55,000 $6,201 Claremont 548 -11.6% $68,571 $11,404 Clarks Grove 706 -3.8% $48,214 $5,420 Cleveland 719 6.8% $57,083 $2,504 Cohasset 2,698 8.7% $64,500 $6,755 Cokato 2,694 -1.2% $45,833 $12,783 Cottonwood 1,212 5.6% $57,829 $7,918 Courtland 611 13.6% $63,000 $8,488 Danube 505 -4.5% $48,611 $2,552 Dodge Center 2,670 19.9% $49,464 $10,074

House Research Department September 2015 Grouping Minnesota Cities Page 32
Nonmetropolitan City Cluster: Residential Communities City
2010 Population
Population
Growth Rate 2000-2010
Median
Household Income
Comm/Ind.
Market Value Per Capita
Eagle Lake 2,422 35.5% $61,635 $2,061 East Grand Forks 8,601 14.7% $50,090 $8,787 East Gull Lake 1,004 2.7% $59,637 $4,427 Elgin 1,089 31.8% $51,429 $3,829 Ellendale 691 17.1% $70,119 $3,991 Elysian 652 34.2% $67,688 $6,350 Eyota 1,977 20.3% $62,466 $3,329 Foley 2,603 20.8% $47,955 $7,445 Geneva 555 23.6% $48,947 $2,571 Glencoe 5,631 3.3% $49,574 $7,315 Glyndon 1,394 32.9% $57,981 $2,869 Good Thunder 583 -1.5% $50,208 $2,986 Goodview 4,036 19.7% $50,382 $12,335 Grand Meadow 1,139 20.5% $55,000 $3,805 Hallock 981 -18.0% $54,926 $4,905 Harris 1,132 1.0% $57,663 $9,805 Hayfield 1,340 1.1% $49,063 $7,475 Henderson 886 -2.6% $54,219 $3,477 Hermantown 9,414 26.4% $64,330 $15,713 Hokah 580 -5.5% $52,857 $3,549 Kasson 5,931 34.9% $62,406 $4,193 Kimball 762 20.0% $52,500 $11,421 Lacrescent 4,830 -1.9% $51,500 $5,179 Lake City 5,063 2.3% $46,705 $10,618 Lake Crystal 2,549 5.3% $56,279 $4,470 Lake Shore 1,004 3.9% $62,500 $4,036 Lester Prairie 1,730 25.6% $58,571 $4,207 Lesueur 4,058 3.5% $53,097 $10,743 Lewiston 1,620 9.2% $62,794 $6,306 Litchfield 6,726 2.5% $46,591 $10,463 Madison Lake 1,017 21.5% $56,683 $4,762 Mantorville 1,197 13.6% $66,173 $1,964 Mapleton 1,756 4.6% $50,820 $4,592 Mazeppa 842 8.2% $52,273 $3,229 Medford 1,239 25.9% $62,404 $13,985 Melrose 3,598 16.4% $46,077 $11,450 Nicollet 1,093 22.9% $48,281 $5,471 North Branch 10,125 26.2% $62,627 $12,612 North Mankato 13,394 14.9% $60,194 $10,439 Proctor 3,057 7.2% $52,665 $9,082
House Research Department September 2015 Grouping Minnesota Cities Page 33
Nonmetropolitan City Cluster: Residential Communities City
2010 Population
Population
Growth Rate 2000-2010
Median
Household Income
Comm/Ind.
Market Value Per Capita
Randall 650 21.5% $45,972 $6,936 Raymond 764 -4.9% $55,114 $2,908 Richmond 1,422 17.2% $46,295 $8,063 Rockford (Jt) 4,316 23.9% $49,597 $7,733 Rockville 2,448 -2.4% $58,125 $6,897 Rollingstone 664 -4.7% $62,500 $3,042 Rushford Village 807 13.0% $61,250 $9,554 Sabin 522 24.0% $62,292 $1,342 Saint Augusta 3,317 8.2% $67,978 $7,130 Saint Charles 3,735 13.4% $56,830 $5,526 Saint Clair 868 5.0% $57,083 $1,744 Saint Peter 11,196 13.5% $45,667 $4,122 Saint Stephen 851 -1.0% $65,000 $3,149 Sauk Centre 4,317 9.8% $47,601 $13,397 Sauk Rapids 12,773 25.1% $56,479 $8,347 Stacy 1,456 10.1% $56,042 $15,675 Stephen 658 -7.1% $49,438 $2,267 Stewart 571 1.2% $48,646 $4,330 Stewartville 5,916 9.3% $51,173 $6,631 Stockton 697 2.2% $49,934 $2,650 Wanamingo 1,086 7.8% $50,345 $11,298 Waseca 9,410 10.8% $45,583 $8,430 Waterville 1,868 1.9% $48,427 $5,252 West Concord 782 -6.5% $56,250 $3,591 Winsted 2,355 12.5% $48,191 $8,150 Wyoming 7,791 11.5% $73,714 $13,051 Zumbrota 3,252 16.6% $58,227 $13,233 Cluster Profile (Average) 2,719 10.5% $55,220 $6,727
Nonmetropolitan City Cluster: Rural Cities City
2010 Population
Population
Growth Rate 2000-2010
Median
Household Income
Comm/Ind.
Market Value Per Capita
Ada 1,707 3.0% $40,987 $3,456 Adams 787 -1.6% $40,833 $3,911 Adrian 1,209 -2.0% $41,389 $3,739 Alden 661 1.4% $45,104 $2,803
House Research Department September 2015 Grouping Minnesota Cities Page 34
Nonmetropolitan City Cluster: Rural Cities City
2010 Population
Population
Growth Rate 2000-2010
Median
Household Income
Comm/Ind.
Market Value Per Capita
Amboy 534 -7.1% $42,417 $5,173 Argyle 639 -2.6% $37,375 $3,675 Audubon 519 16.6% $42,750 $8,772 Aurora 1,682 -9.1% $45,285 $3,654 Babbitt 1,475 -11.7% $37,500 $4,510 Bagley 1,392 12.7% $30,385 $8,507 Balaton 643 0.9% $39,716 $2,245 Barnum 613 16.8% $36,513 $6,210 Battle Lake 875 27.6% $36,023 $9,264 Belgrade 740 -1.3% $31,466 $8,060 Benson 3,240 -4.0% $34,449 $13,872 Biwabik 969 1.6% $32,656 $5,650 Blackduck 785 12.8% $27,778 $8,441 Blooming Prairie 1,996 3.3% $38,750 $4,860 Blue Earth 3,353 -7.4% $34,773 $7,655 Bovey 804 21.5% $33,375 $2,207 Breckenridge 3,386 -4.9% $43,894 $5,860 Brooten 743 14.5% $36,250 $10,883 Browerville 790 7.5% $36,250 $5,921 Browns Valley 589 -14.6% $23,250 $2,351 Buffalo Lake 733 -4.6% $41,500 $9,646 Buhl 1,000 1.7% $34,650 $1,433 Butterfield 586 3.9% $43,750 $2,825 Caledonia 2,868 -3.3% $34,478 $10,215 Canby 1,795 -5.7% $45,391 $3,801 Carlton 862 6.4% $40,000 $6,386 Cass Lake 770 -10.5% $24,063 $8,381 Chisholm 4,976 0.3% $37,963 $2,618 Clara City 1,360 -2.4% $37,240 $8,701 Clarissa 681 11.8% $29,803 $3,857 Clarkfield 863 -8.6% $32,708 $6,610 Clearbrook 518 -6.0% $31,597 $4,578 Coleraine 1,970 -5.7% $45,781 $4,416 Crookston 7,891 -3.7% $40,858 $5,722 Crosby 2,386 3.8% $27,586 $7,728 Dassel 1,469 19.1% $39,141 $9,941 Dawson 1,540 0.1% $39,132 $6,251 Deer River 930 3.0% $23,906 $9,074 Eagle Bend 535 -10.1% $24,946 $4,731 Eden Valley 1,042 20.3% $32,411 $7,056

House Research Department September 2015 Grouping Minnesota Cities Page 35
Nonmetropolitan City Cluster: Rural Cities City
2010 Population
Population
Growth Rate 2000-2010
Median
Household Income
Comm/Ind.
Market Value Per Capita
Edgerton 1,189 15.1% $38,750 $7,065 Elbow Lake 1,176 -7.8% $37,042 $5,463 Elmore 663 -9.8% $28,636 $3,696 Ely 3,460 -7.1% $31,905 $11,515 Emily 813 -4.0% $37,750 $8,934 Erskine 503 15.1% $32,708 $4,920 Evansville 612 8.1% $26,500 $4,845 Eveleth 3,718 -3.8% $36,755 $3,120 Fairfax 1,235 -4.6% $38,571 $3,927 Fertile 842 -5.7% $40,104 $4,717 Floodwood 528 5.0% $21,708 $5,246 Fosston 1,527 -3.0% $29,597 $8,410 Franklin 510 2.4% $30,521 $1,179 Frazee 1,350 -2.0% $32,969 $4,307 Fulda 1,318 2.7% $39,348 $2,012 Gaylord 2,305 1.1% $36,172 $6,187 Gibbon 772 -4.5% $39,643 $3,299 Gilbert 1,799 -2.6% $40,925 $2,700 Glenville 643 -10.7% $38,203 $3,234 Glenwood 2,564 -1.2% $35,396 $10,884 Graceville 577 -4.6% $35,833 $3,135 Granite Falls 2,897 -5.6% $43,056 $6,996 Greenbush 719 -8.3% $40,461 $3,838 Grove City 635 4.4% $43,021 $3,956 Halstad 597 -4.0% $35,000 $3,168 Hancock 765 6.7% $40,547 $2,966 Harmony 1,020 -5.6% $32,455 $10,120 Hawley 2,067 9.8% $41,550 $5,693 Hector 1,151 -1.3% $42,422 $6,710 Hendricks 713 -1.7% $39,271 $3,153 Henning 802 11.5% $29,712 $6,437 Heron Lake 698 -9.1% $38,750 $6,091 Hill City 633 32.2% $18,889 $5,329 Hills 686 21.4% $40,764 $2,247 Hoffman 681 1.3% $24,091 $5,711 Holdingford 708 -3.8% $47,500 $3,588 Houston 979 -4.0% $40,774 $6,189 Howard Lake 1,962 5.9% $31,856 $11,201 Hoyt Lakes 2,017 -3.1% $45,338 $8,473 Intl Falls 6,424 -4.2% $30,214 $10,555
House Research Department September 2015 Grouping Minnesota Cities Page 36
Nonmetropolitan City Cluster: Rural Cities City
2010 Population
Population
Growth Rate 2000-2010
Median
Household Income
Comm/Ind.
Market Value Per Capita
Ironton 572 14.9% $28,889 $6,856 Isle 751 6.2% $31,176 $11,868 Ivanhoe 559 -17.7% $35,952 $2,644 Jackson 3,299 -5.8% $39,035 $10,194 Janesville 2,256 7.0% $46,103 $2,110 Jasper 633 6.0% $25,781 $6,074 Karlstad 760 -4.3% $37,059 $3,035 Kasota 675 -0.7% $46,818 $3,600 Keewatin 1,068 -8.2% $25,417 $1,791 Kenyon 1,815 9.3% $43,664 $5,655 Kerkhoven 759 0.0% $26,750 $3,409 Kiester 501 -7.2% $34,750 $3,012 Lafayette 504 -4.7% $46,250 $5,794 Lake Benton 683 -2.8% $34,375 $3,153 Lake Park 783 0.1% $40,600 $6,883 Lakefield 1,694 -1.6% $41,300 $4,398 Lamberton 824 -4.1% $33,688 $7,835 Lanesboro 754 -4.3% $31,923 $9,745 Lecenter 2,499 11.6% $41,481 $7,391 Leroy 929 0.4% $42,500 $7,491 Little Falls 8,343 8.1% $33,447 $11,979 Littlefork 647 -4.9% $43,409 $1,151 Long Prairie 3,458 13.7% $37,781 $7,624 Luverne 4,745 2.8% $41,179 $8,287 Lyle 551 -2.7% $42,426 $1,614 Mabel 780 1.8% $38,000 $2,559 Madelia 2,308 -1.4% $41,528 $4,871 Madison 1,551 -12.3% $40,156 $3,354 Mahnomen 1,214 1.0% $31,528 $9,003 Marble 701 0.9% $34,444 $2,178 Mcintosh 625 -2.0% $26,500 $3,178 Menahga 1,306 7.0% $31,275 $4,836 Milaca 2,946 14.2% $33,843 $7,766 Minneota 1,392 -3.9% $37,188 $3,293 Minnesota Lake 687 0.9% $42,212 $2,831 Montevideo 5,383 0.7% $37,835 $9,499 Montgomery 2,956 5.8% $43,441 $8,093 Moose Lake 2,751 22.9% $40,027 $7,209 Mora 3,571 11.8% $41,081 $11,023 Morgan 896 -0.8% $41,420 $4,195

House Research Department September 2015 Grouping Minnesota Cities Page 37
Nonmetropolitan City Cluster: Rural Cities City
2010 Population
Population
Growth Rate 2000-2010
Median
Household Income
Comm/Ind.
Market Value Per Capita
Morris 5,286 4.3% $38,511 $6,855 Morristown 987 0.6% $44,000 $2,730 Mt Lake 2,104 1.1% $39,712 $3,763 Nashwauk 983 5.1% $33,207 $8,203 New London 1,251 17.4% $40,950 $9,731 New Richland 1,203 0.5% $42,875 $2,886 New York Mills 1,199 3.5% $26,985 $11,383 Olivia 2,484 -3.3% $37,198 $9,817 Onamia 878 3.7% $21,734 $12,307 Ortonville 1,916 -11.2% $38,287 $4,957 Osakis 1,740 11.0% $39,091 $5,550 Parkers Prairie 1,011 2.0% $32,045 $7,264 Paynesville 2,432 7.3% $44,911 $10,962 Pelican Rapids 2,464 3.8% $32,014 $9,125 Pennock 508 0.8% $40,583 $2,360 Pierz 1,393 9.1% $35,833 $9,078 Pine River 944 1.7% $29,125 $12,676 Pipestone 4,317 0.9% $37,902 $7,013 Plainview 3,340 4.7% $45,099 $7,704 Preston 1,325 -7.1% $40,052 $9,695 Red Lake Falls 1,427 -10.3% $39,833 $2,628 Redwood Falls 5,254 -3.8% $39,049 $7,457 Renville 1,287 -2.7% $41,065 $5,730 Rushford 1,731 2.1% $41,058 $7,106 Sacred Heart 548 -0.2% $32,778 $4,071 Saintjames 4,605 -1.9% $38,689 $5,539 Sandstone 2,849 83.9% $35,556 $4,633 Scanlon 991 18.3% $43,828 $6,949 Sebeka 711 0.1% $35,000 $5,855 Sherburn 1,137 5.1% $41,016 $1,863 Silver Bay 1,887 -8.8% $42,857 $4,442 Silver Lake 837 10.0% $44,423 $3,902 Slayton 2,153 3.9% $39,732 $5,709 Sleepy Eye 3,599 2.4% $43,375 $4,607 Spring Grove 1,330 2.0% $36,250 $5,245 Spring Valley 2,479 -1.5% $42,416 $6,341 Springfield 2,152 -2.8% $42,500 $4,071 Staples 2,981 -4.0% $27,333 $5,215 Starbuck 1,302 -0.9% $36,127 $5,997 Taylors Falls 976 2.6% $40,917 $6,674

House Research Department September 2015 Grouping Minnesota Cities Page 38
Nonmetropolitan City Cluster: Rural Cities City
2010 Population
Population
Growth Rate 2000-2010
Median
Household Income
Comm/Ind.
Market Value Per Capita
Thief River Falls 8,573 1.9% $36,218 $7,402 Tower 500 4.4% $31,607 $8,095 Tracy 2,163 -4.6% $40,893 $3,647 Trimont 747 -0.9% $33,750 $4,697 Truman 1,115 -11.4% $47,321 $7,784 Twin Valley 821 -5.1% $25,104 $1,946 Two Harbors 3,745 3.7% $39,520 $10,164 Tyler 1,143 -6.2% $39,167 $3,528 Ulen 547 2.8% $34,583 $13,487 Verndale 602 4.7% $30,395 $4,474 Virginia 8,712 -4.9% $32,664 $9,486 Wabasha 2,521 -3.0% $41,846 $11,973 Wabasso 696 8.2% $44,545 $8,083 Wadena 4,088 -4.8% $28,924 $8,732 Warren 1,563 -6.9% $44,113 $4,673 Warroad 1,781 3.4% $44,063 $14,025 Watkins 962 9.3% $30,417 $7,260 Wells 2,343 -6.1% $38,314 $5,501 Westbrook 739 -2.1% $30,556 $3,062 Wheaton 1,424 -12.0% $40,806 $7,036 Windom 4,646 3.5% $35,757 $7,495 Winnebago 1,437 -3.4% $36,976 $7,485 Cluster Profile (Average) 1,705 1.5% $36,852 $6,089
Nonmetropolitan City Cluster: Cities under 500 Population (predetermined) City
2010 Population
Population
Growth Rate 2000-2010
Median
Household Income
Comm/Ind.
Market Value Per Capita
Akeley 432 4.9% $30,625 $4,131 Alberta 103 -27.5% $37,750 $14,486 Aldrich 48 -9.4% $9,911 $8,148 Alpha 116 -7.9% $41,518 $3,528 Altura 493 18.2% $45,313 $3,865 Alvarado 363 -2.2% $51,705 $1,279 Arco 75 -25.0% $32,500 $1,791 Ashby 446 -5.5% $46,719 $6,499 Askov 364 -1.1% $31,302 $7,203

House Research Department September 2015 Grouping Minnesota Cities Page 39
Nonmetropolitan City Cluster: Cities under 500 Population (predetermined) City
2010 Population
Population
Growth Rate 2000-2010
Median
Household Income
Comm/Ind.
Market Value Per Capita
Avoca 147 0.7% $40,625 $6,597 Backus 250 -19.6% $29,250 $7,597 Badger 375 -20.2% $32,656 $3,282 Barrett 415 16.9% $32,125 $2,735 Barry 16 -36.0% $6,773 Beardsley 233 -11.1% $44,583 $2,796 Beaver Bay 181 3.4% $41,458 $24,147 Beaver Creek 297 18.8% $33,571 $5,385 Bejou 89 -5.3% $29,750 $4,182 Bellechester 175 1.7% $29,583 $3,710 Bellingham 168 -18.0% $32,656 $12,493 Beltrami 107 5.9% $40,833 $10,602 Belview 384 -6.8% $29,375 $1,314 Bena 116 5.5% $10,536 $1,126 Bertha 497 5.7% $31,029 $3,523 Big Falls 236 -10.6% $30,833 $1,107 Bigelow 235 1.7% $64,375 $3,725 Bigfork 446 -4.9% $29,688 $7,887 Bingham Lake 126 -24.6% $56,875 $23,631 Biscay 113 -0.9% $56,000 $192 Blomkest 157 -15.6% $54,167 $4,014 Bluffton 207 -1.4% $40,208 $4,358 Bock 106 0.0% $27,083 $9,329 Borup 110 20.9% $56,250 $1,315 Bowlus 290 11.5% $45,333 $2,849 Boy River 47 23.7% $25,625 $1,740 Boyd 175 -16.7% $35,208 $2,180 Brandon 489 8.7% $46,250 $13,958 Brewster 473 -5.8% $44,417 $16,214 Bricelyn 365 -3.7% $33,409 $4,051 Brook Park 139 -10.9% $37,344 $7,159 Brooks 141 0.0% $32,386 $6,758 Brookston 141 43.9% $33,929 $2,787 Brownsville 466 -9.9% $40,268 $1,254 Bruno 102 0.0% $30,417 $11,203 Buckman 270 29.8% $69,375 $6,331 Burtrum 144 -1.4% $26,250 $1,623 Callaway 234 17.0% $44,583 $3,775 Calumet 367 -4.2% $38,125 $3,592 Campbell 158 -34.4% $48,438 $7,363
House Research Department September 2015 Grouping Minnesota Cities Page 40
Nonmetropolitan City Cluster: Cities under 500 Population (predetermined) City
2010 Population
Population
Growth Rate 2000-2010
Median
Household Income
Comm/Ind.
Market Value Per Capita
Canton 346 0.9% $28,750 $2,954 Cedar Mills 45 -15.1% $51,042 $10,901 Ceylon 369 -10.7% $35,417 $1,120 Chandler 270 -2.2% $41,875 $14,350 Chickamaw Beach 114 -23.0% $41,875 $755 Chokio 400 -9.7% $41,563 $2,599 Clements 153 -19.9% $43,917 $5,059 Climax 267 9.9% $45,938 $2,167 Clinton 449 -0.9% $40,000 $2,393 Clitherall 112 -5.1% $18,000 $2,396 Clontarf 164 -5.2% $44,583 $6,317 Cobden 36 -41.0% $21,667 $15,036 Comfrey 382 4.1% $41,625 $4,949 Comstock 93 -24.4% $57,500 $5,014 Conger 146 9.8% $46,875 $4,702 Correll 34 -27.7% $61,250 $3,996 Cosmos 473 -18.7% $42,734 $4,584 Cromwell 234 63.6% $21,000 $6,128 Currie 233 3.6% $30,625 $2,549 Cuyuna 332 43.7% $45,000 $764 Cyrus 288 -5.0% $35,179 $2,756 Dakota 323 -1.8% $51,000 $1,572 Dalton 253 -1.9% $34,722 $4,805 Danvers 97 -10.2% $44,375 $13,393 Darfur 108 -21.2% $40,357 $4,546 Darwin 350 26.8% $70,333 $5,365 Deer Creek 322 -1.8% $25,000 $4,515 Degraff 115 -13.5% $17,143 $3,582 Delavan 179 -19.7% $31,818 $5,527 Delhi 70 1.4% $35,000 $20,115 Denham 35 -12.5% $38,750 $6,246 Dennison 212 26.2% $46,250 $10,725 Dent 192 0.0% $43,958 $6,013 Dexter 341 2.4% $46,071 $17,734 Donaldson 42 2.4% $38,889 $14,780 Donnelly 241 -5.1% $35,625 $2,533 Doran 55 -6.8% $14,375 $1,877 Dovray 57 -14.9% $43,333 $25,722 Dumont 100 -18.0% $56,250 $10,578 Dundee 68 -33.3% $23,125 $2,811

House Research Department September 2015 Grouping Minnesota Cities Page 41
Nonmetropolitan City Cluster: Cities under 500 Population (predetermined) City
2010 Population
Population
Growth Rate 2000-2010
Median
Household Income
Comm/Ind.
Market Value Per Capita
Dunnell 167 -15.2% $43,036 $4,975 Easton 199 -7.0% $36,250 $6,681 Echo 278 0.0% $27,321 $4,750 Effie 123 35.2% $12,656 $2,557 Eitzen 243 6.1% $34,625 $6,601 Elba 152 -29.0% $39,861 $3,355 Elizabeth 173 0.6% $41,103 $3,000 Elkton 141 -5.4% $50,250 $3,186 Ellsworth 463 -14.3% $30,764 $2,527 Elmdale 116 8.4% $54,063 $3,373 Elrosa 211 27.1% $44,583 $10,052 Emmons 391 -9.5% $40,000 $2,453 Erhard 148 -1.3% $33,409 $5,712 Evan 86 -5.5% $38,472 $1,514 Farwell 51 -10.5% $24,688 $1,530 Federal Dam 110 8.9% $30,875 $2,117 Felton 177 -18.1% $24,444 $4,275 Fifty Lakes 387 -1.3% $42,206 $3,310 Finlayson 315 0.3% $35,833 $10,982 Fisher 435 0.0% $42,292 $1,427 Flensburg 225 -7.8% $58,750 $820 Florence 39 -36.1% $44,583 $2,348 Forada 185 -6.1% $51,250 $6,863 Fort Ripley 69 -6.8% $32,188 $11,086 Fountain 410 19.5% $43,125 $8,943 Foxhome 116 -18.9% $49,167 $1,635 Freeborn 297 -2.6% $39,375 $2,487 Frost 198 -21.1% $36,750 $1,692 Funkley 5 -66.7% n/a $9,407 Garfield 354 26.0% $40,375 $12,144 Garrison 210 -1.4% $28,750 $47,732 Garvin 135 -15.1% $40,536 $1,964 Gary 214 -0.5% $40,625 $2,636 Genola 75 5.6% $33,125 $43,991 Georgetown 129 3.2% $78,333 $4,370 Ghent 370 17.5% $61,667 $3,402 Gilman 224 4.2% $51,563 $4,803 Gonvick 282 -4.1% $31,389 $3,496 Goodridge 132 34.7% $21,635 $1,332 Granada 303 -4.4% $36,250 $809
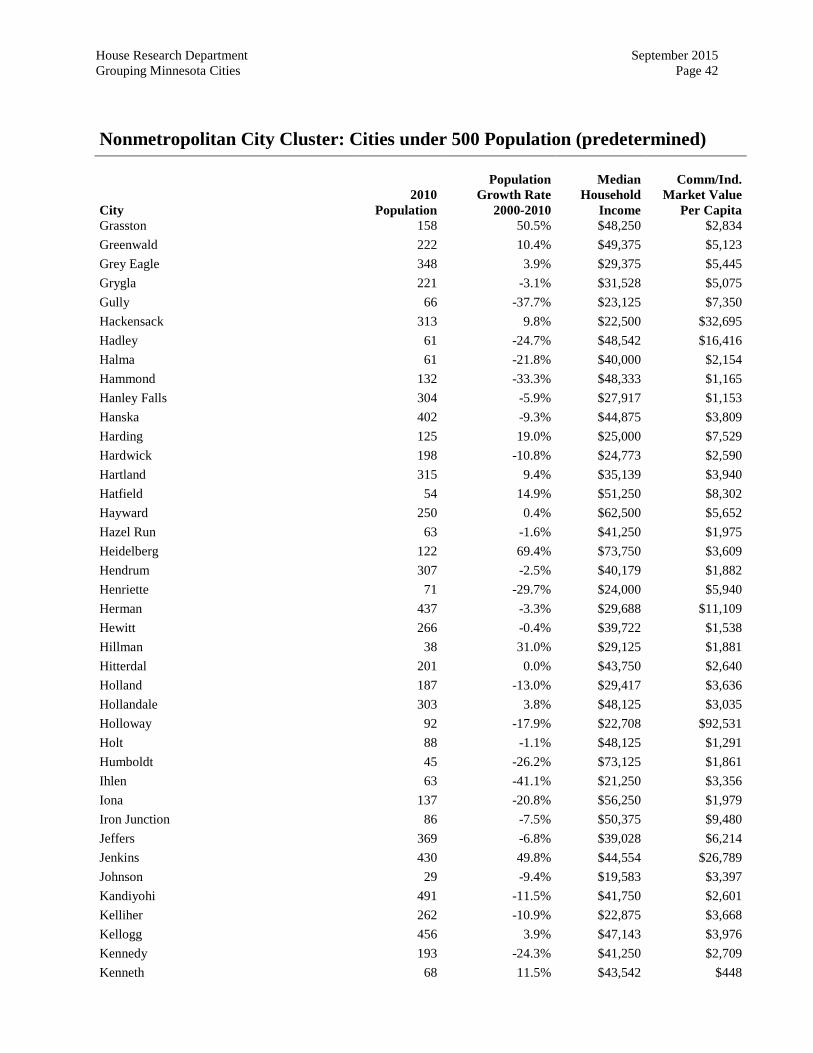
House Research Department September 2015 Grouping Minnesota Cities Page 42
Nonmetropolitan City Cluster: Cities under 500 Population (predetermined) City
2010 Population
Population
Growth Rate 2000-2010
Median
Household Income
Comm/Ind.
Market Value Per Capita
Grasston 158 50.5% $48,250 $2,834 Greenwald 222 10.4% $49,375 $5,123 Grey Eagle 348 3.9% $29,375 $5,445 Grygla 221 -3.1% $31,528 $5,075 Gully 66 -37.7% $23,125 $7,350 Hackensack 313 9.8% $22,500 $32,695 Hadley 61 -24.7% $48,542 $16,416 Halma 61 -21.8% $40,000 $2,154 Hammond 132 -33.3% $48,333 $1,165 Hanley Falls 304 -5.9% $27,917 $1,153 Hanska 402 -9.3% $44,875 $3,809 Harding 125 19.0% $25,000 $7,529 Hardwick 198 -10.8% $24,773 $2,590 Hartland 315 9.4% $35,139 $3,940 Hatfield 54 14.9% $51,250 $8,302 Hayward 250 0.4% $62,500 $5,652 Hazel Run 63 -1.6% $41,250 $1,975 Heidelberg 122 69.4% $73,750 $3,609 Hendrum 307 -2.5% $40,179 $1,882 Henriette 71 -29.7% $24,000 $5,940 Herman 437 -3.3% $29,688 $11,109 Hewitt 266 -0.4% $39,722 $1,538 Hillman 38 31.0% $29,125 $1,881 Hitterdal 201 0.0% $43,750 $2,640 Holland 187 -13.0% $29,417 $3,636 Hollandale 303 3.8% $48,125 $3,035 Holloway 92 -17.9% $22,708 $92,531 Holt 88 -1.1% $48,125 $1,291 Humboldt 45 -26.2% $73,125 $1,861 Ihlen 63 -41.1% $21,250 $3,356 Iona 137 -20.8% $56,250 $1,979 Iron Junction 86 -7.5% $50,375 $9,480 Jeffers 369 -6.8% $39,028 $6,214 Jenkins 430 49.8% $44,554 $26,789 Johnson 29 -9.4% $19,583 $3,397 Kandiyohi 491 -11.5% $41,750 $2,601 Kelliher 262 -10.9% $22,875 $3,668 Kellogg 456 3.9% $47,143 $3,976 Kennedy 193 -24.3% $41,250 $2,709 Kenneth 68 11.5% $43,542 $448
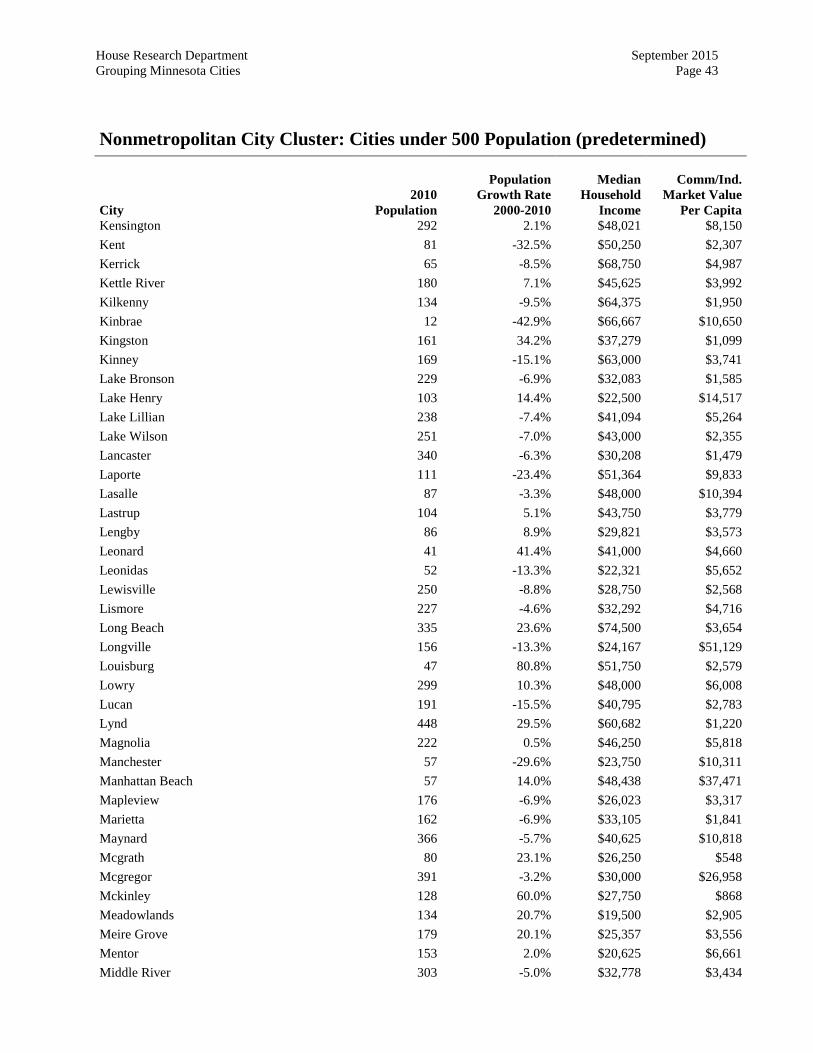
House Research Department September 2015 Grouping Minnesota Cities Page 43
Nonmetropolitan City Cluster: Cities under 500 Population (predetermined) City
2010 Population
Population
Growth Rate 2000-2010
Median
Household Income
Comm/Ind.
Market Value Per Capita
Kensington 292 2.1% $48,021 $8,150 Kent 81 -32.5% $50,250 $2,307 Kerrick 65 -8.5% $68,750 $4,987 Kettle River 180 7.1% $45,625 $3,992 Kilkenny 134 -9.5% $64,375 $1,950 Kinbrae 12 -42.9% $66,667 $10,650 Kingston 161 34.2% $37,279 $1,099 Kinney 169 -15.1% $63,000 $3,741 Lake Bronson 229 -6.9% $32,083 $1,585 Lake Henry 103 14.4% $22,500 $14,517 Lake Lillian 238 -7.4% $41,094 $5,264 Lake Wilson 251 -7.0% $43,000 $2,355 Lancaster 340 -6.3% $30,208 $1,479 Laporte 111 -23.4% $51,364 $9,833 Lasalle 87 -3.3% $48,000 $10,394 Lastrup 104 5.1% $43,750 $3,779 Lengby 86 8.9% $29,821 $3,573 Leonard 41 41.4% $41,000 $4,660 Leonidas 52 -13.3% $22,321 $5,652 Lewisville 250 -8.8% $28,750 $2,568 Lismore 227 -4.6% $32,292 $4,716 Long Beach 335 23.6% $74,500 $3,654 Longville 156 -13.3% $24,167 $51,129 Louisburg 47 80.8% $51,750 $2,579 Lowry 299 10.3% $48,000 $6,008 Lucan 191 -15.5% $40,795 $2,783 Lynd 448 29.5% $60,682 $1,220 Magnolia 222 0.5% $46,250 $5,818 Manchester 57 -29.6% $23,750 $10,311 Manhattan Beach 57 14.0% $48,438 $37,471 Mapleview 176 -6.9% $26,023 $3,317 Marietta 162 -6.9% $33,105 $1,841 Maynard 366 -5.7% $40,625 $10,818 Mcgrath 80 23.1% $26,250 $548 Mcgregor 391 -3.2% $30,000 $26,958 Mckinley 128 60.0% $27,750 $868 Meadowlands 134 20.7% $19,500 $2,905 Meire Grove 179 20.1% $25,357 $3,556 Mentor 153 2.0% $20,625 $6,661 Middle River 303 -5.0% $32,778 $3,434
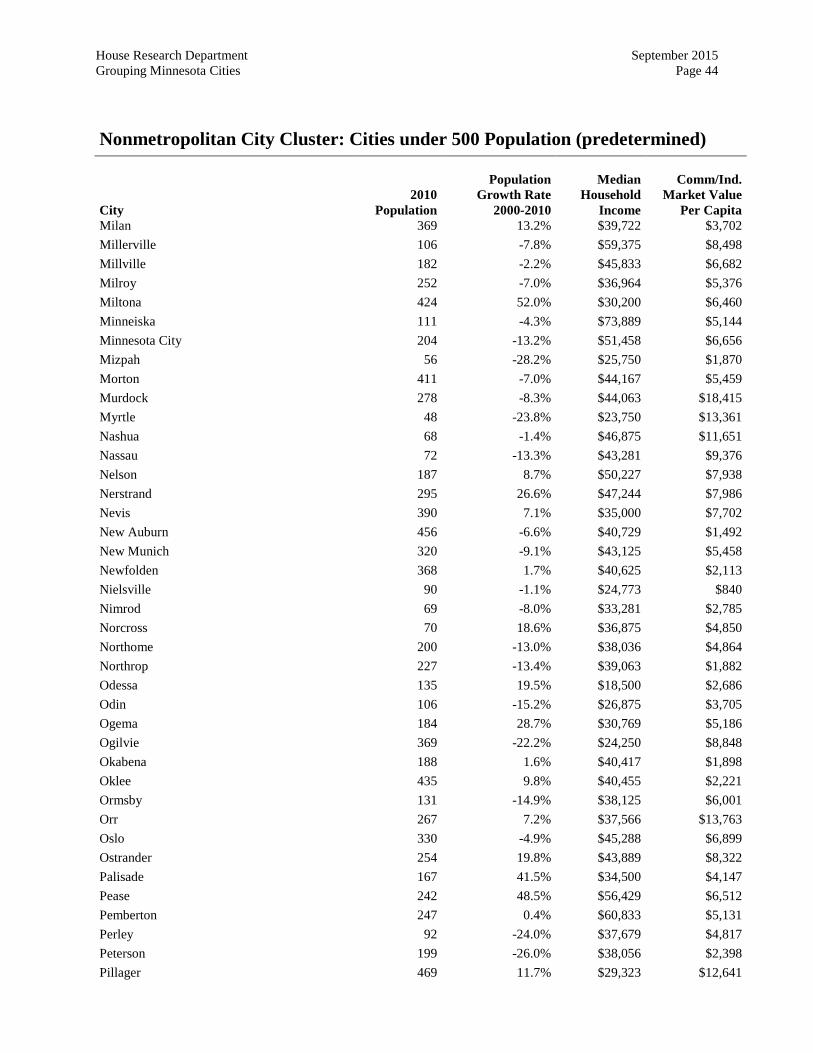
House Research Department September 2015 Grouping Minnesota Cities Page 44
Nonmetropolitan City Cluster: Cities under 500 Population (predetermined) City
2010 Population
Population
Growth Rate 2000-2010
Median
Household Income
Comm/Ind.
Market Value Per Capita
Milan 369 13.2% $39,722 $3,702 Millerville 106 -7.8% $59,375 $8,498 Millville 182 -2.2% $45,833 $6,682 Milroy 252 -7.0% $36,964 $5,376 Miltona 424 52.0% $30,200 $6,460 Minneiska 111 -4.3% $73,889 $5,144 Minnesota City 204 -13.2% $51,458 $6,656 Mizpah 56 -28.2% $25,750 $1,870 Morton 411 -7.0% $44,167 $5,459 Murdock 278 -8.3% $44,063 $18,415 Myrtle 48 -23.8% $23,750 $13,361 Nashua 68 -1.4% $46,875 $11,651 Nassau 72 -13.3% $43,281 $9,376 Nelson 187 8.7% $50,227 $7,938 Nerstrand 295 26.6% $47,244 $7,986 Nevis 390 7.1% $35,000 $7,702 New Auburn 456 -6.6% $40,729 $1,492 New Munich 320 -9.1% $43,125 $5,458 Newfolden 368 1.7% $40,625 $2,113 Nielsville 90 -1.1% $24,773 $840 Nimrod 69 -8.0% $33,281 $2,785 Norcross 70 18.6% $36,875 $4,850 Northome 200 -13.0% $38,036 $4,864 Northrop 227 -13.4% $39,063 $1,882 Odessa 135 19.5% $18,500 $2,686 Odin 106 -15.2% $26,875 $3,705 Ogema 184 28.7% $30,769 $5,186 Ogilvie 369 -22.2% $24,250 $8,848 Okabena 188 1.6% $40,417 $1,898 Oklee 435 9.8% $40,455 $2,221 Ormsby 131 -14.9% $38,125 $6,001 Orr 267 7.2% $37,566 $13,763 Oslo 330 -4.9% $45,288 $6,899 Ostrander 254 19.8% $43,889 $8,322 Palisade 167 41.5% $34,500 $4,147 Pease 242 48.5% $56,429 $6,512 Pemberton 247 0.4% $60,833 $5,131 Perley 92 -24.0% $37,679 $4,817 Peterson 199 -26.0% $38,056 $2,398 Pillager 469 11.7% $29,323 $12,641
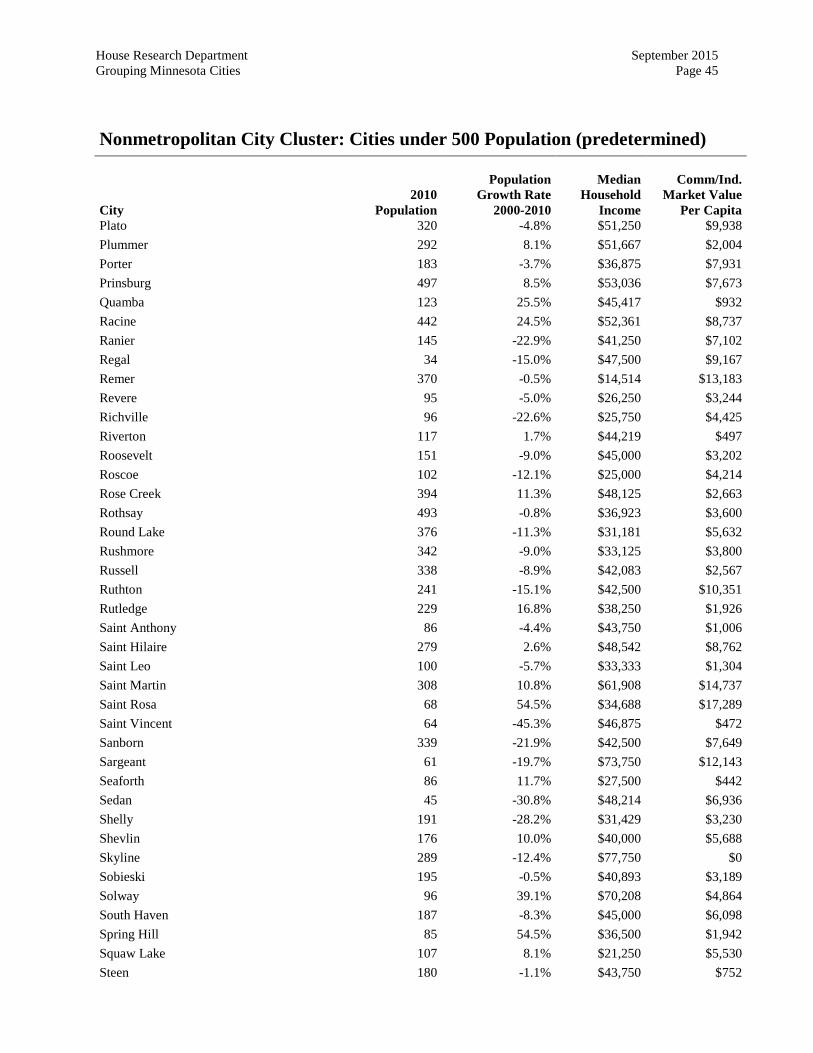
House Research Department September 2015 Grouping Minnesota Cities Page 45
Nonmetropolitan City Cluster: Cities under 500 Population (predetermined) City
2010 Population
Population
Growth Rate 2000-2010
Median
Household Income
Comm/Ind.
Market Value Per Capita
Plato 320 -4.8% $51,250 $9,938 Plummer 292 8.1% $51,667 $2,004 Porter 183 -3.7% $36,875 $7,931 Prinsburg 497 8.5% $53,036 $7,673 Quamba 123 25.5% $45,417 $932 Racine 442 24.5% $52,361 $8,737 Ranier 145 -22.9% $41,250 $7,102 Regal 34 -15.0% $47,500 $9,167 Remer 370 -0.5% $14,514 $13,183 Revere 95 -5.0% $26,250 $3,244 Richville 96 -22.6% $25,750 $4,425 Riverton 117 1.7% $44,219 $497 Roosevelt 151 -9.0% $45,000 $3,202 Roscoe 102 -12.1% $25,000 $4,214 Rose Creek 394 11.3% $48,125 $2,663 Rothsay 493 -0.8% $36,923 $3,600 Round Lake 376 -11.3% $31,181 $5,632 Rushmore 342 -9.0% $33,125 $3,800 Russell 338 -8.9% $42,083 $2,567 Ruthton 241 -15.1% $42,500 $10,351 Rutledge 229 16.8% $38,250 $1,926 Saint Anthony 86 -4.4% $43,750 $1,006 Saint Hilaire 279 2.6% $48,542 $8,762 Saint Leo 100 -5.7% $33,333 $1,304 Saint Martin 308 10.8% $61,908 $14,737 Saint Rosa 68 54.5% $34,688 $17,289 Saint Vincent 64 -45.3% $46,875 $472 Sanborn 339 -21.9% $42,500 $7,649 Sargeant 61 -19.7% $73,750 $12,143 Seaforth 86 11.7% $27,500 $442 Sedan 45 -30.8% $48,214 $6,936 Shelly 191 -28.2% $31,429 $3,230 Shevlin 176 10.0% $40,000 $5,688 Skyline 289 -12.4% $77,750 $0 Sobieski 195 -0.5% $40,893 $3,189 Solway 96 39.1% $70,208 $4,864 South Haven 187 -8.3% $45,000 $6,098 Spring Hill 85 54.5% $36,500 $1,942 Squaw Lake 107 8.1% $21,250 $5,530 Steen 180 -1.1% $43,750 $752

House Research Department September 2015 Grouping Minnesota Cities Page 46
Nonmetropolitan City Cluster: Cities under 500 Population (predetermined) City
2010 Population
Population
Growth Rate 2000-2010
Median
Household Income
Comm/Ind.
Market Value Per Capita
Storden 219 -20.1% $33,750 $4,167 Strandquist 69 -21.6% $33,958 $1,820 Strathcona 44 51.7% $52,500 $2,115 Sturgeon Lake 439 26.5% $36,250 $5,644 Sunburg 100 -9.1% $50,556 $5,649 Swanville 350 -0.3% $45,313 $12,118 Taconite 360 14.3% $34,750 $8,636 Tamarack 94 59.3% $31,250 $9,599 Taopi 58 -37.6% $30,417 $48 Taunton 139 -32.9% $24,643 $5,158 Tenstrike 201 3.1% $45,208 $2,692 Thomson 159 3.9% $55,625 $426 Tintah 63 -20.3% $30,000 $3,546 Trail 46 -25.8% $11,875 $6,676 Trommald 98 -21.6% $56,250 $0 Trosky 86 -25.9% $55,000 $1,651 Turtle River 77 2.7% $43,750 $8,094 Twin Lakes 151 -10.1% $29,167 $1,700 Underwood 341 6.9% $46,648 $5,741 Upsala 427 0.7% $42,596 $5,741 Urbank 54 -8.5% $24,375 $7,421 Utica 291 26.5% $50,875 $5,346 Vergas 331 6.4% $40,938 $6,196 Vernon Center 332 -7.5% $33,333 $12,474 Vesta 319 -5.9% $35,250 $5,395 Viking 104 13.0% $31,500 $766 Villard 254 4.1% $41,250 $6,994 Vining 78 14.7% $26,875 $9,230 Wahkon 206 -34.4% $38,125 $12,298 Waldorf 229 -5.4% $51,250 $4,732 Walters 73 -17.0% $24,167 $772 Waltham 151 -23.0% $48,375 $1,108 Wanda 84 -18.4% $46,250 $4,190 Warba 181 -1.1% $25,625 $2,806 Watson 205 -1.9% $36,250 $1,554 Waubun 400 -0.7% $32,596 $2,588 Wendell 167 -5.6% $35,313 $4,659 West Union 111 27.6% $49,107 $1,804 Westport 57 -20.8% $43,125 $3,000 Whalan 63 -1.6% $63,125 $3,000
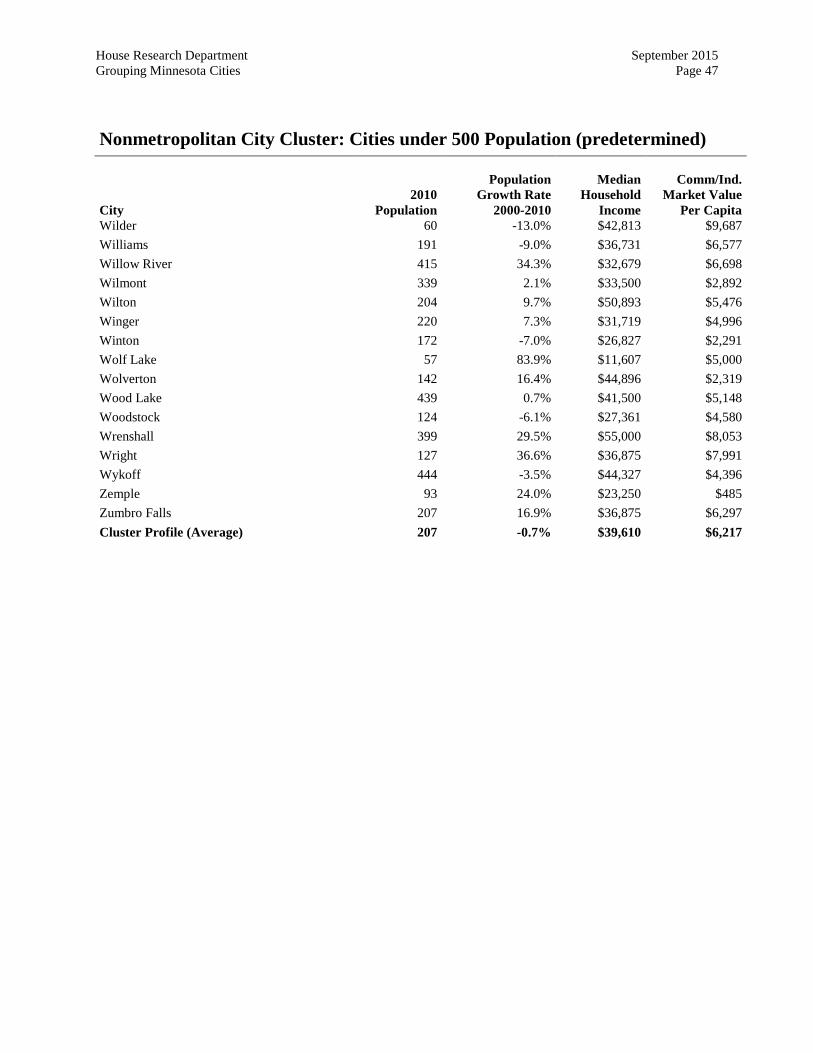
House Research Department September 2015 Grouping Minnesota Cities Page 47
Nonmetropolitan City Cluster: Cities under 500 Population (predetermined) City
2010 Population
Population
Growth Rate 2000-2010
Median
Household Income
Comm/Ind.
Market Value Per Capita
Wilder 60 -13.0% $42,813 $9,687 Williams 191 -9.0% $36,731 $6,577 Willow River 415 34.3% $32,679 $6,698 Wilmont 339 2.1% $33,500 $2,892 Wilton 204 9.7% $50,893 $5,476 Winger 220 7.3% $31,719 $4,996 Winton 172 -7.0% $26,827 $2,291 Wolf Lake 57 83.9% $11,607 $5,000 Wolverton 142 16.4% $44,896 $2,319 Wood Lake 439 0.7% $41,500 $5,148 Woodstock 124 -6.1% $27,361 $4,580 Wrenshall 399 29.5% $55,000 $8,053 Wright 127 36.6% $36,875 $7,991 Wykoff 444 -3.5% $44,327 $4,396 Zemple 93 24.0% $23,250 $485 Zumbro Falls 207 16.9% $36,875 $6,297 Cluster Profile (Average) 207 -0.7% $39,610 $6,217
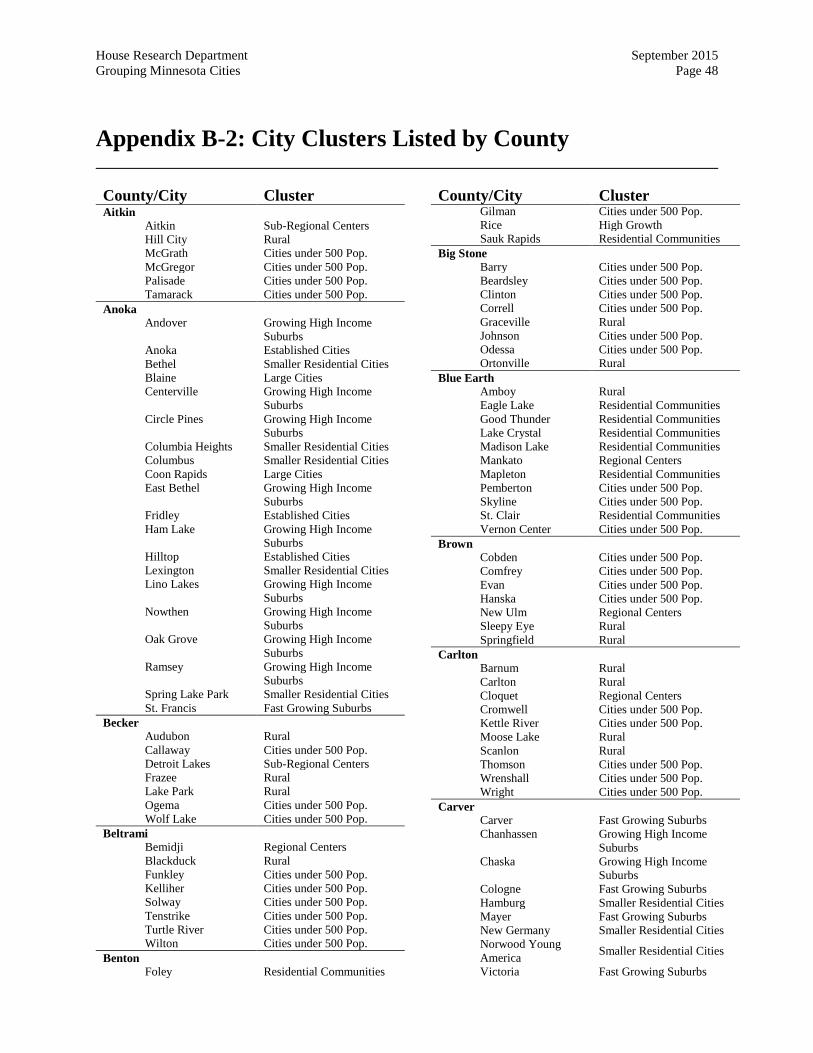
House Research Department September 2015 Grouping Minnesota Cities Page 48
Appendix B-2: City Clusters Listed by County
County/City Cluster Aitkin
Aitkin Sub-Regional Centers Hill City Rural McGrath Cities under 500 Pop. McGregor Cities under 500 Pop. Palisade Cities under 500 Pop. Tamarack Cities under 500 Pop.
Anoka Andover Growing High Income
Suburbs Anoka Established Cities Bethel Smaller Residential Cities Blaine Large Cities Centerville Growing High Income
Suburbs Circle Pines Growing High Income
Suburbs Columbia Heights Smaller Residential Cities Columbus Smaller Residential Cities Coon Rapids Large Cities East Bethel Growing High Income
Suburbs Fridley Established Cities Ham Lake Growing High Income
Suburbs Hilltop Established Cities Lexington Smaller Residential Cities Lino Lakes Growing High Income
Suburbs Nowthen Growing High Income
Suburbs Oak Grove Growing High Income
Suburbs Ramsey Growing High Income
Suburbs Spring Lake Park Smaller Residential Cities St. Francis Fast Growing Suburbs
Becker Audubon Rural Callaway Cities under 500 Pop. Detroit Lakes Sub-Regional Centers Frazee Rural Lake Park Rural Ogema Cities under 500 Pop. Wolf Lake Cities under 500 Pop.
Beltrami Bemidji Regional Centers Blackduck Rural Funkley Cities under 500 Pop. Kelliher Cities under 500 Pop. Solway Cities under 500 Pop. Tenstrike Cities under 500 Pop. Turtle River Cities under 500 Pop. Wilton Cities under 500 Pop.
Benton Foley Residential Communities
County/City Cluster Gilman Cities under 500 Pop. Rice High Growth Sauk Rapids Residential Communities
Big Stone Barry Cities under 500 Pop. Beardsley Cities under 500 Pop. Clinton Cities under 500 Pop. Correll Cities under 500 Pop. Graceville Rural Johnson Cities under 500 Pop. Odessa Cities under 500 Pop. Ortonville Rural
Blue Earth Amboy Rural Eagle Lake Residential Communities Good Thunder Residential Communities Lake Crystal Residential Communities Madison Lake Residential Communities Mankato Regional Centers Mapleton Residential Communities Pemberton Cities under 500 Pop. Skyline Cities under 500 Pop. St. Clair Residential Communities Vernon Center Cities under 500 Pop.
Brown Cobden Cities under 500 Pop. Comfrey Cities under 500 Pop. Evan Cities under 500 Pop. Hanska Cities under 500 Pop. New Ulm Regional Centers Sleepy Eye Rural Springfield Rural
Carlton Barnum Rural Carlton Rural Cloquet Regional Centers Cromwell Cities under 500 Pop. Kettle River Cities under 500 Pop. Moose Lake Rural Scanlon Rural Thomson Cities under 500 Pop. Wrenshall Cities under 500 Pop. Wright Cities under 500 Pop.
Carver Carver Fast Growing Suburbs Chanhassen Growing High Income
Suburbs Chaska Growing High Income
Suburbs Cologne Fast Growing Suburbs Hamburg Smaller Residential Cities Mayer Fast Growing Suburbs New Germany Smaller Residential Cities Norwood Young America Smaller Residential Cities
Victoria Fast Growing Suburbs
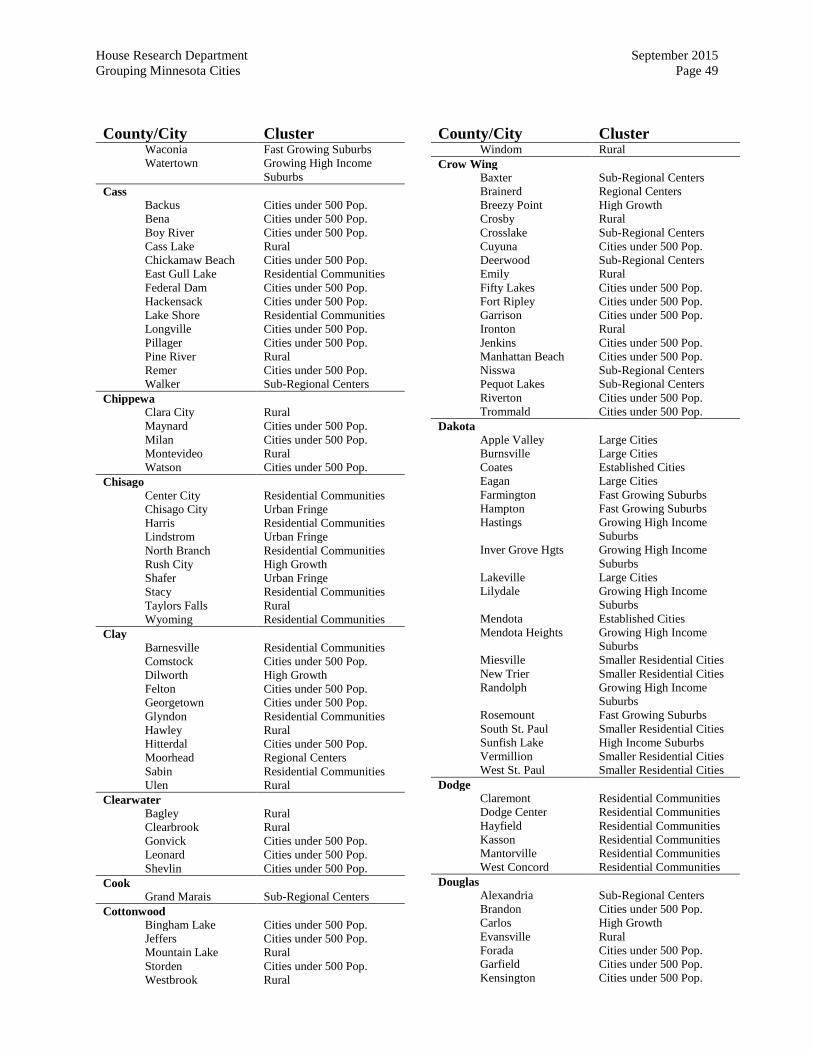
House Research Department September 2015 Grouping Minnesota Cities Page 49
County/City Cluster Waconia Fast Growing Suburbs Watertown Growing High Income
Suburbs Cass
Backus Cities under 500 Pop. Bena Cities under 500 Pop. Boy River Cities under 500 Pop. Cass Lake Rural Chickamaw Beach Cities under 500 Pop. East Gull Lake Residential Communities Federal Dam Cities under 500 Pop. Hackensack Cities under 500 Pop. Lake Shore Residential Communities Longville Cities under 500 Pop. Pillager Cities under 500 Pop. Pine River Rural Remer Cities under 500 Pop. Walker Sub-Regional Centers
Chippewa Clara City Rural Maynard Cities under 500 Pop. Milan Cities under 500 Pop. Montevideo Rural Watson Cities under 500 Pop.
Chisago Center City Residential Communities Chisago City Urban Fringe Harris Residential Communities Lindstrom Urban Fringe North Branch Residential Communities Rush City High Growth Shafer Urban Fringe Stacy Residential Communities Taylors Falls Rural Wyoming Residential Communities
Clay Barnesville Residential Communities Comstock Cities under 500 Pop. Dilworth High Growth Felton Cities under 500 Pop. Georgetown Cities under 500 Pop. Glyndon Residential Communities Hawley Rural Hitterdal Cities under 500 Pop. Moorhead Regional Centers Sabin Residential Communities Ulen Rural
Clearwater Bagley Rural Clearbrook Rural Gonvick Cities under 500 Pop. Leonard Cities under 500 Pop. Shevlin Cities under 500 Pop.
Cook Grand Marais Sub-Regional Centers
Cottonwood Bingham Lake Cities under 500 Pop. Jeffers Cities under 500 Pop. Mountain Lake Rural Storden Cities under 500 Pop. Westbrook Rural
County/City Cluster Windom Rural
Crow Wing Baxter Sub-Regional Centers Brainerd Regional Centers Breezy Point High Growth Crosby Rural Crosslake Sub-Regional Centers Cuyuna Cities under 500 Pop. Deerwood Sub-Regional Centers Emily Rural Fifty Lakes Cities under 500 Pop. Fort Ripley Cities under 500 Pop. Garrison Cities under 500 Pop. Ironton Rural Jenkins Cities under 500 Pop. Manhattan Beach Cities under 500 Pop. Nisswa Sub-Regional Centers Pequot Lakes Sub-Regional Centers Riverton Cities under 500 Pop. Trommald Cities under 500 Pop.
Dakota Apple Valley Large Cities Burnsville Large Cities Coates Established Cities Eagan Large Cities Farmington Fast Growing Suburbs Hampton Fast Growing Suburbs Hastings Growing High Income
Suburbs Inver Grove Hgts Growing High Income
Suburbs Lakeville Large Cities Lilydale Growing High Income
Suburbs Mendota Established Cities Mendota Heights Growing High Income
Suburbs Miesville Smaller Residential Cities New Trier Smaller Residential Cities Randolph Growing High Income
Suburbs Rosemount Fast Growing Suburbs South St. Paul Smaller Residential Cities Sunfish Lake High Income Suburbs Vermillion Smaller Residential Cities West St. Paul Smaller Residential Cities
Dodge Claremont Residential Communities Dodge Center Residential Communities Hayfield Residential Communities Kasson Residential Communities Mantorville Residential Communities West Concord Residential Communities
Douglas Alexandria Sub-Regional Centers Brandon Cities under 500 Pop. Carlos High Growth Evansville Rural Forada Cities under 500 Pop. Garfield Cities under 500 Pop. Kensington Cities under 500 Pop.

House Research Department September 2015 Grouping Minnesota Cities Page 50
County/City Cluster Millerville Cities under 500 Pop. Miltona Cities under 500 Pop. Nelson Cities under 500 Pop. Osakis Rural
Faribault Blue Earth Rural Bricelyn Cities under 500 Pop. Delavan Cities under 500 Pop. Easton Cities under 500 Pop. Elmore Rural Frost Cities under 500 Pop. Kiester Rural Minnesota Lake Rural Walters Cities under 500 Pop. Wells Rural Winnebago Rural
Fillmore Canton Cities under 500 Pop. Chatfield Residential Communities Fountain Cities under 500 Pop. Harmony Rural Lanesboro Rural Mabel Rural Ostrander Cities under 500 Pop. Peterson Cities under 500 Pop. Preston Rural Rushford City Rural Rushford Village Residential Communities Spring Valley Rural Whalan Cities under 500 Pop. Wykoff Cities under 500 Pop.
Freeborn Albert Lea Regional Centers Alden Rural Clarks Grove Residential Communities Conger Cities under 500 Pop. Emmons Cities under 500 Pop. Freeborn Cities under 500 Pop. Geneva Residential Communities Glenville Rural Hartland Cities under 500 Pop. Hayward Cities under 500 Pop. Hollandale Cities under 500 Pop. Manchester Cities under 500 Pop. Myrtle Cities under 500 Pop. Twin Lakes Cities under 500 Pop.
Goodhue Bellechester Cities under 500 Pop. Cannon Falls Sub-Regional Centers Dennison Cities under 500 Pop. Goodhue Urban Fringe Kenyon Rural Pine Island High Growth Red Wing Regional Centers Wanamingo Residential Communities Zumbrota Residential Communities
Grant Ashby Cities under 500 Pop. Barrett Cities under 500 Pop. Elbow Lake Rural Herman Cities under 500 Pop.
County/City Cluster Hoffman Rural Norcross Cities under 500 Pop. Wendell Cities under 500 Pop.
Hennepin Bloomington Large Cities Brooklyn Center Established Cities Brooklyn Park Large Cities Champlin Growing High Income
Suburbs Corcoran High Income Suburbs Crystal Smaller Residential Cities Dayton Smaller Residential Cities Deephaven High Income Suburbs Eden Prairie Large Cities Edina Large Cities Excelsior Smaller Residential Cities Golden Valley Established Cities Greenfield High Income Suburbs Greenwood High Income Suburbs Hopkins Established Cities Independence High Income Suburbs Long Lake Established Cities Loretto Smaller Residential Cities Maple Grove Large Cities Maple Plain Established Cities Medicine Lake High Income Suburbs Medina High Income Suburbs Minneapolis Center Cities Minnetonka Large Cities Minnetonka Beach High Income Suburbs Minnetrista High Income Suburbs Mound Smaller Residential Cities New Hope Established Cities Orono High Income Suburbs Osseo Established Cities Plymouth Large Cities Richfield Established Cities Robbinsdale Smaller Residential Cities Rogers Fast Growing Suburbs Shorewood High Income Suburbs Spring Park Smaller Residential Cities St. Anthony Smaller Residential Cities St. Bonifacius Growing High Income
Suburbs St. Louis Park Large Cities Tonka Bay High Income Suburbs Wayzata Smaller Residential Cities Woodland High Income Suburbs
Houston Brownsville Cities under 500 Pop. Caledonia Rural Eitzen Cities under 500 Pop. Hokah Residential Communities Houston Rural La Crescent Residential Communities Spring Grove Rural
Hubbard Akeley Cities under 500 Pop. Laporte Cities under 500 Pop. Nevis Cities under 500 Pop. Park Rapids Sub-Regional Centers
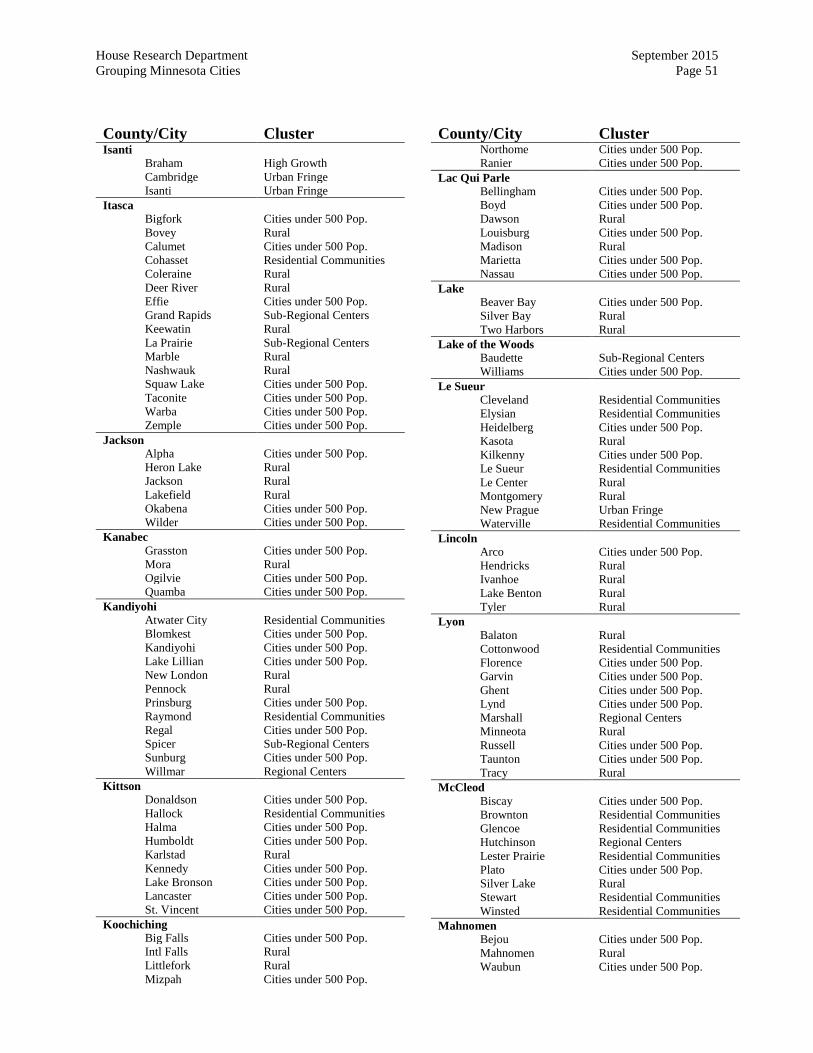
House Research Department September 2015 Grouping Minnesota Cities Page 51
County/City Cluster Isanti
Braham High Growth Cambridge Urban Fringe Isanti Urban Fringe
Itasca Bigfork Cities under 500 Pop. Bovey Rural Calumet Cities under 500 Pop. Cohasset Residential Communities Coleraine Rural Deer River Rural Effie Cities under 500 Pop. Grand Rapids Sub-Regional Centers Keewatin Rural La Prairie Sub-Regional Centers Marble Rural Nashwauk Rural Squaw Lake Cities under 500 Pop. Taconite Cities under 500 Pop. Warba Cities under 500 Pop. Zemple Cities under 500 Pop.
Jackson Alpha Cities under 500 Pop. Heron Lake Rural Jackson Rural Lakefield Rural Okabena Cities under 500 Pop. Wilder Cities under 500 Pop.
Kanabec Grasston Cities under 500 Pop. Mora Rural Ogilvie Cities under 500 Pop. Quamba Cities under 500 Pop.
Kandiyohi Atwater City Residential Communities Blomkest Cities under 500 Pop. Kandiyohi Cities under 500 Pop. Lake Lillian Cities under 500 Pop. New London Rural Pennock Rural Prinsburg Cities under 500 Pop. Raymond Residential Communities Regal Cities under 500 Pop. Spicer Sub-Regional Centers Sunburg Cities under 500 Pop. Willmar Regional Centers
Kittson Donaldson Cities under 500 Pop. Hallock Residential Communities Halma Cities under 500 Pop. Humboldt Cities under 500 Pop. Karlstad Rural Kennedy Cities under 500 Pop. Lake Bronson Cities under 500 Pop. Lancaster Cities under 500 Pop. St. Vincent Cities under 500 Pop.
Koochiching Big Falls Cities under 500 Pop. Intl Falls Rural Littlefork Rural Mizpah Cities under 500 Pop.
County/City Cluster Northome Cities under 500 Pop. Ranier Cities under 500 Pop.
Lac Qui Parle Bellingham Cities under 500 Pop. Boyd Cities under 500 Pop. Dawson Rural Louisburg Cities under 500 Pop. Madison Rural Marietta Cities under 500 Pop. Nassau Cities under 500 Pop.
Lake Beaver Bay Cities under 500 Pop. Silver Bay Rural Two Harbors Rural
Lake of the Woods Baudette Sub-Regional Centers Williams Cities under 500 Pop.
Le Sueur Cleveland Residential Communities Elysian Residential Communities Heidelberg Cities under 500 Pop. Kasota Rural Kilkenny Cities under 500 Pop. Le Sueur Residential Communities Le Center Rural Montgomery Rural New Prague Urban Fringe Waterville Residential Communities
Lincoln Arco Cities under 500 Pop. Hendricks Rural Ivanhoe Rural Lake Benton Rural Tyler Rural
Lyon Balaton Rural Cottonwood Residential Communities Florence Cities under 500 Pop. Garvin Cities under 500 Pop. Ghent Cities under 500 Pop. Lynd Cities under 500 Pop. Marshall Regional Centers Minneota Rural Russell Cities under 500 Pop. Taunton Cities under 500 Pop. Tracy Rural
McCleod Biscay Cities under 500 Pop. Brownton Residential Communities Glencoe Residential Communities Hutchinson Regional Centers Lester Prairie Residential Communities Plato Cities under 500 Pop. Silver Lake Rural Stewart Residential Communities Winsted Residential Communities
Mahnomen Bejou Cities under 500 Pop. Mahnomen Rural Waubun Cities under 500 Pop.
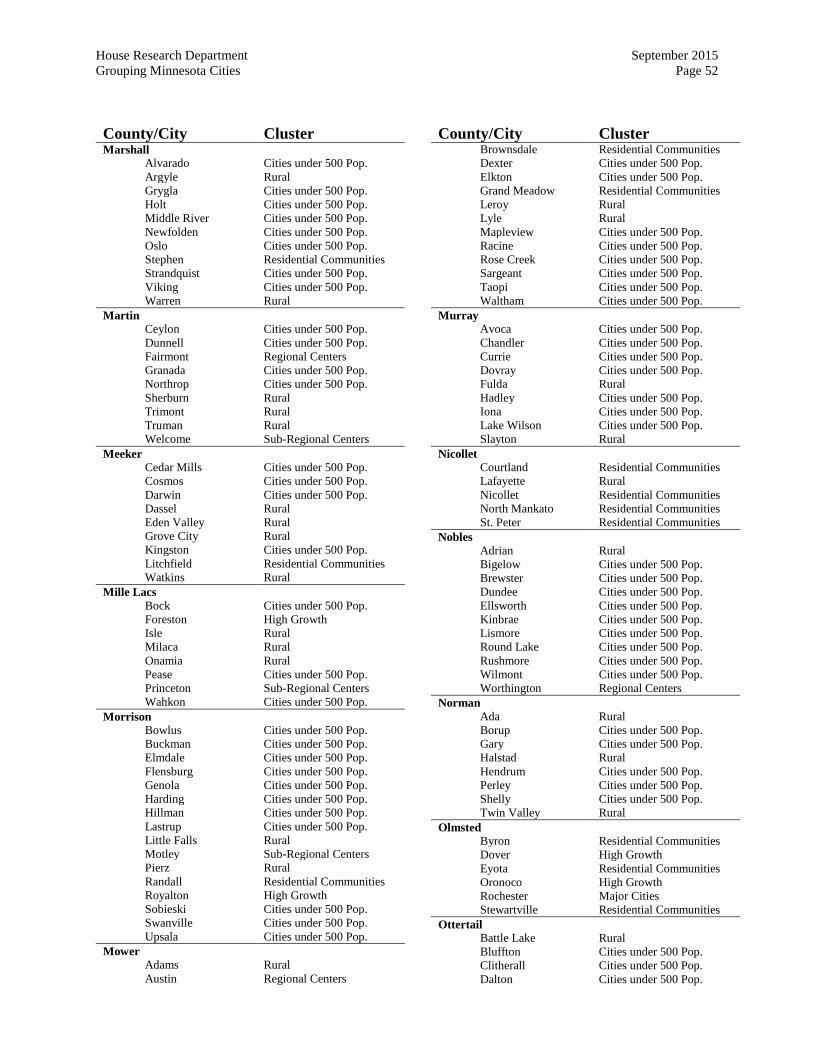
House Research Department September 2015 Grouping Minnesota Cities Page 52
County/City Cluster Marshall
Alvarado Cities under 500 Pop. Argyle Rural Grygla Cities under 500 Pop. Holt Cities under 500 Pop. Middle River Cities under 500 Pop. Newfolden Cities under 500 Pop. Oslo Cities under 500 Pop. Stephen Residential Communities Strandquist Cities under 500 Pop. Viking Cities under 500 Pop. Warren Rural
Martin Ceylon Cities under 500 Pop. Dunnell Cities under 500 Pop. Fairmont Regional Centers Granada Cities under 500 Pop. Northrop Cities under 500 Pop. Sherburn Rural Trimont Rural Truman Rural Welcome Sub-Regional Centers
Meeker Cedar Mills Cities under 500 Pop. Cosmos Cities under 500 Pop. Darwin Cities under 500 Pop. Dassel Rural Eden Valley Rural Grove City Rural Kingston Cities under 500 Pop. Litchfield Residential Communities Watkins Rural
Mille Lacs Bock Cities under 500 Pop. Foreston High Growth Isle Rural Milaca Rural Onamia Rural Pease Cities under 500 Pop. Princeton Sub-Regional Centers Wahkon Cities under 500 Pop.
Morrison Bowlus Cities under 500 Pop. Buckman Cities under 500 Pop. Elmdale Cities under 500 Pop. Flensburg Cities under 500 Pop. Genola Cities under 500 Pop. Harding Cities under 500 Pop. Hillman Cities under 500 Pop. Lastrup Cities under 500 Pop. Little Falls Rural Motley Sub-Regional Centers Pierz Rural Randall Residential Communities Royalton High Growth Sobieski Cities under 500 Pop. Swanville Cities under 500 Pop. Upsala Cities under 500 Pop.
Mower Adams Rural Austin Regional Centers
County/City Cluster Brownsdale Residential Communities Dexter Cities under 500 Pop. Elkton Cities under 500 Pop. Grand Meadow Residential Communities Leroy Rural Lyle Rural Mapleview Cities under 500 Pop. Racine Cities under 500 Pop. Rose Creek Cities under 500 Pop. Sargeant Cities under 500 Pop. Taopi Cities under 500 Pop. Waltham Cities under 500 Pop.
Murray Avoca Cities under 500 Pop. Chandler Cities under 500 Pop. Currie Cities under 500 Pop. Dovray Cities under 500 Pop. Fulda Rural Hadley Cities under 500 Pop. Iona Cities under 500 Pop. Lake Wilson Cities under 500 Pop. Slayton Rural
Nicollet Courtland Residential Communities Lafayette Rural Nicollet Residential Communities North Mankato Residential Communities St. Peter Residential Communities
Nobles Adrian Rural Bigelow Cities under 500 Pop. Brewster Cities under 500 Pop. Dundee Cities under 500 Pop. Ellsworth Cities under 500 Pop. Kinbrae Cities under 500 Pop. Lismore Cities under 500 Pop. Round Lake Cities under 500 Pop. Rushmore Cities under 500 Pop. Wilmont Cities under 500 Pop. Worthington Regional Centers
Norman Ada Rural Borup Cities under 500 Pop. Gary Cities under 500 Pop. Halstad Rural Hendrum Cities under 500 Pop. Perley Cities under 500 Pop. Shelly Cities under 500 Pop. Twin Valley Rural
Olmsted Byron Residential Communities Dover High Growth Eyota Residential Communities Oronoco High Growth Rochester Major Cities Stewartville Residential Communities
Ottertail Battle Lake Rural Bluffton Cities under 500 Pop. Clitherall Cities under 500 Pop. Dalton Cities under 500 Pop.

House Research Department September 2015 Grouping Minnesota Cities Page 53
County/City Cluster Deer Creek Cities under 500 Pop. Dent Cities under 500 Pop. Elizabeth Cities under 500 Pop. Erhard Cities under 500 Pop. Fergus Falls Regional Centers Henning Rural New York Mills Rural Ottertail Sub-Regional Centers Parkers Prairie Rural Pelican Rapids Rural Perham Sub-Regional Centers Richville Cities under 500 Pop. Underwood Cities under 500 Pop. Urbank Cities under 500 Pop. Vergas Cities under 500 Pop. Vining Cities under 500 Pop.
Pennington Goodridge Cities under 500 Pop. St. Hilaire Cities under 500 Pop. Thief River Falls Rural
Pine Askov Cities under 500 Pop. Brook Park Cities under 500 Pop. Bruno Cities under 500 Pop. Denham Cities under 500 Pop. Finlayson Cities under 500 Pop. Henriette Cities under 500 Pop. Hinckley Sub-Regional Centers Kerrick Cities under 500 Pop. Pine City Sub-Regional Centers Rock Creek High Growth Rutledge Cities under 500 Pop. Sandstone Rural Sturgeon Lake Cities under 500 Pop. Willow River Cities under 500 Pop.
Pipestone Edgerton Rural Hatfield Cities under 500 Pop. Holland Cities under 500 Pop. Ihlen Cities under 500 Pop. Jasper Rural Pipestone Rural Ruthton Cities under 500 Pop. Trosky Cities under 500 Pop. Woodstock Cities under 500 Pop.
Polk Beltrami Cities under 500 Pop. Climax Cities under 500 Pop. Crookston Rural East Grand Forks Residential Communities Erskine Rural Fertile Rural Fisher Cities under 500 Pop. Fosston Rural Gully Cities under 500 Pop. Lengby Cities under 500 Pop. Mcintosh Rural Mentor Cities under 500 Pop. Nielsville Cities under 500 Pop. Trail Cities under 500 Pop. Winger Cities under 500 Pop.
County/City Cluster Pope
Cyrus Cities under 500 Pop. Farwell Cities under 500 Pop. Glenwood Rural Long Beach Cities under 500 Pop. Lowry Cities under 500 Pop. Sedan Cities under 500 Pop. Starbuck Rural Villard Cities under 500 Pop. Westport Cities under 500 Pop.
Ramsey Arden Hills Established Cities Falcon Heights Smaller Residential Cities Gem Lake Smaller Residential Cities Lauderdale Smaller Residential Cities Little Canada Established Cities Maplewood Established Cities Mounds View Established Cities New Brighton Smaller Residential Cities North Oaks High Income Suburbs North St. Paul Smaller Residential Cities Roseville Established Cities Shoreview Growing High Income
Suburbs St. Paul Center Cities Vadnais Heights Established Cities White Bear Lake Smaller Residential Cities
Red Lake Brooks Cities under 500 Pop. Oklee Cities under 500 Pop. Plummer Cities under 500 Pop. Red Lake Falls Rural
Redwood Belview Cities under 500 Pop. Clements Cities under 500 Pop. Delhi Cities under 500 Pop. Lamberton Rural Lucan Cities under 500 Pop. Milroy Cities under 500 Pop. Morgan Rural Redwood Falls Rural Revere Cities under 500 Pop. Sanborn Cities under 500 Pop. Seaforth Cities under 500 Pop. Vesta Cities under 500 Pop. Wabasso Rural Walnut Grove High Growth Wanda Cities under 500 Pop.
Renville Bird Island Residential Communities Buffalo Lake Rural Danube Residential Communities Fairfax Rural Franklin Rural Hector Rural Morton Cities under 500 Pop. Olivia Rural Renville Rural Sacred Heart Rural
Rice Dundas Urban Fringe
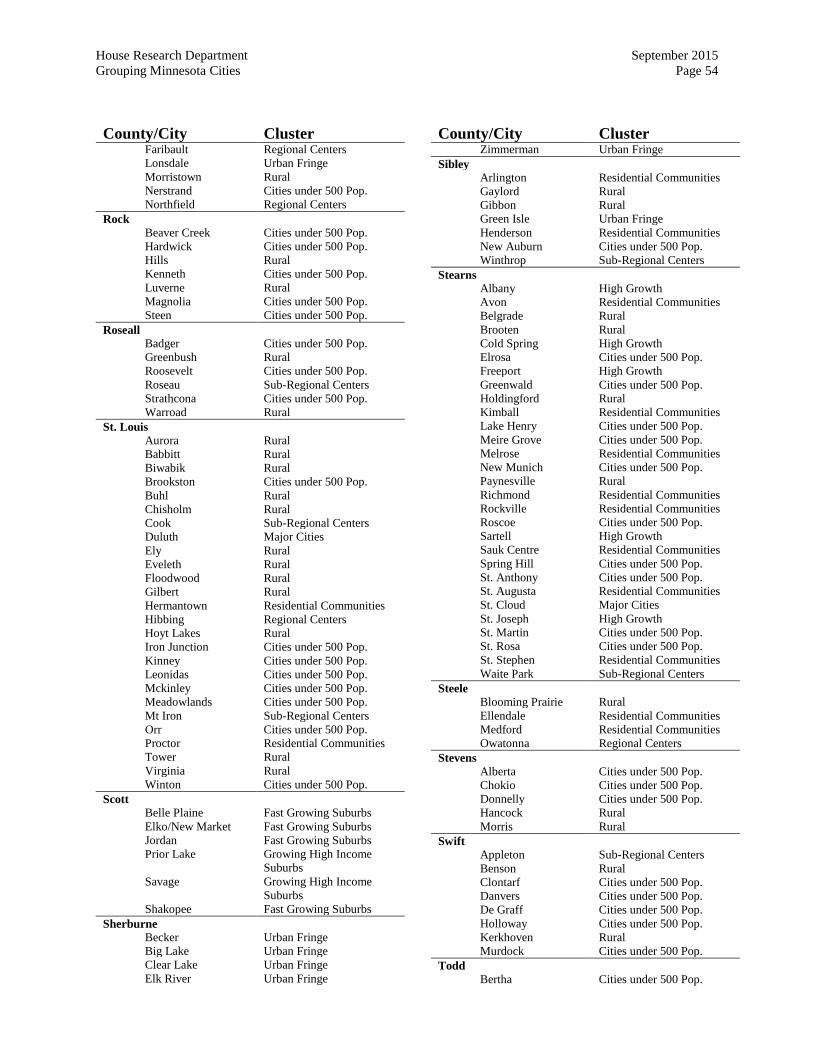
House Research Department September 2015 Grouping Minnesota Cities Page 54
County/City Cluster Faribault Regional Centers Lonsdale Urban Fringe Morristown Rural Nerstrand Cities under 500 Pop. Northfield Regional Centers
Rock Beaver Creek Cities under 500 Pop. Hardwick Cities under 500 Pop. Hills Rural Kenneth Cities under 500 Pop. Luverne Rural Magnolia Cities under 500 Pop. Steen Cities under 500 Pop.
Roseall Badger Cities under 500 Pop. Greenbush Rural Roosevelt Cities under 500 Pop. Roseau Sub-Regional Centers Strathcona Cities under 500 Pop. Warroad Rural
St. Louis Aurora Rural Babbitt Rural Biwabik Rural Brookston Cities under 500 Pop. Buhl Rural Chisholm Rural Cook Sub-Regional Centers Duluth Major Cities Ely Rural Eveleth Rural Floodwood Rural Gilbert Rural Hermantown Residential Communities Hibbing Regional Centers Hoyt Lakes Rural Iron Junction Cities under 500 Pop. Kinney Cities under 500 Pop. Leonidas Cities under 500 Pop. Mckinley Cities under 500 Pop. Meadowlands Cities under 500 Pop. Mt Iron Sub-Regional Centers Orr Cities under 500 Pop. Proctor Residential Communities Tower Rural Virginia Rural Winton Cities under 500 Pop.
Scott Belle Plaine Fast Growing Suburbs Elko/New Market Fast Growing Suburbs Jordan Fast Growing Suburbs Prior Lake Growing High Income
Suburbs Savage Growing High Income
Suburbs Shakopee Fast Growing Suburbs
Sherburne Becker Urban Fringe Big Lake Urban Fringe Clear Lake Urban Fringe Elk River Urban Fringe
County/City Cluster Zimmerman Urban Fringe
Sibley Arlington Residential Communities Gaylord Rural Gibbon Rural Green Isle Urban Fringe Henderson Residential Communities New Auburn Cities under 500 Pop. Winthrop Sub-Regional Centers
Stearns Albany High Growth Avon Residential Communities Belgrade Rural Brooten Rural Cold Spring High Growth Elrosa Cities under 500 Pop. Freeport High Growth Greenwald Cities under 500 Pop. Holdingford Rural Kimball Residential Communities Lake Henry Cities under 500 Pop. Meire Grove Cities under 500 Pop. Melrose Residential Communities New Munich Cities under 500 Pop. Paynesville Rural Richmond Residential Communities Rockville Residential Communities Roscoe Cities under 500 Pop. Sartell High Growth Sauk Centre Residential Communities Spring Hill Cities under 500 Pop. St. Anthony Cities under 500 Pop. St. Augusta Residential Communities St. Cloud Major Cities St. Joseph High Growth St. Martin Cities under 500 Pop. St. Rosa Cities under 500 Pop. St. Stephen Residential Communities Waite Park Sub-Regional Centers
Steele Blooming Prairie Rural Ellendale Residential Communities Medford Residential Communities Owatonna Regional Centers
Stevens Alberta Cities under 500 Pop. Chokio Cities under 500 Pop. Donnelly Cities under 500 Pop. Hancock Rural Morris Rural
Swift Appleton Sub-Regional Centers Benson Rural Clontarf Cities under 500 Pop. Danvers Cities under 500 Pop. De Graff Cities under 500 Pop. Holloway Cities under 500 Pop. Kerkhoven Rural Murdock Cities under 500 Pop.
Todd Bertha Cities under 500 Pop.
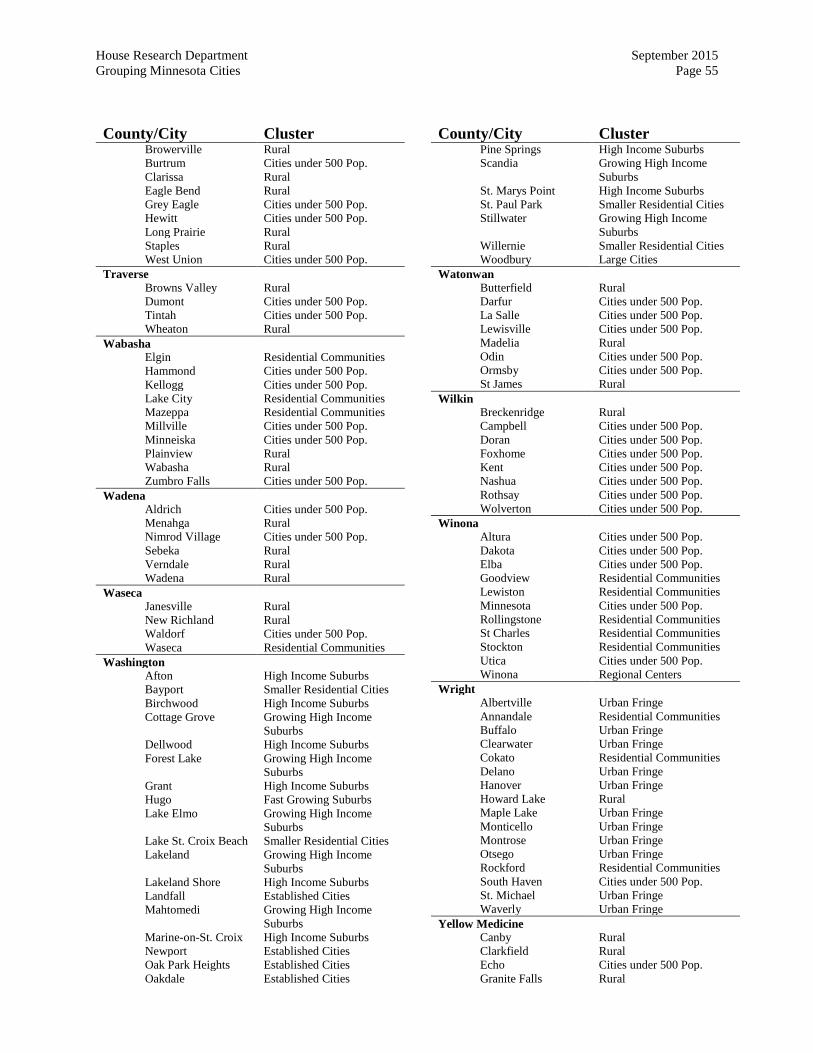
House Research Department September 2015 Grouping Minnesota Cities Page 55
County/City Cluster Browerville Rural Burtrum Cities under 500 Pop. Clarissa Rural Eagle Bend Rural Grey Eagle Cities under 500 Pop. Hewitt Cities under 500 Pop. Long Prairie Rural Staples Rural West Union Cities under 500 Pop.
Traverse Browns Valley Rural Dumont Cities under 500 Pop. Tintah Cities under 500 Pop. Wheaton Rural
Wabasha Elgin Residential Communities Hammond Cities under 500 Pop. Kellogg Cities under 500 Pop. Lake City Residential Communities Mazeppa Residential Communities Millville Cities under 500 Pop. Minneiska Cities under 500 Pop. Plainview Rural Wabasha Rural Zumbro Falls Cities under 500 Pop.
Wadena Aldrich Cities under 500 Pop. Menahga Rural Nimrod Village Cities under 500 Pop. Sebeka Rural Verndale Rural Wadena Rural
Waseca Janesville Rural New Richland Rural Waldorf Cities under 500 Pop. Waseca Residential Communities
Washington Afton High Income Suburbs Bayport Smaller Residential Cities Birchwood High Income Suburbs Cottage Grove Growing High Income
Suburbs Dellwood High Income Suburbs Forest Lake Growing High Income
Suburbs Grant High Income Suburbs Hugo Fast Growing Suburbs Lake Elmo Growing High Income
Suburbs Lake St. Croix Beach Smaller Residential Cities Lakeland Growing High Income
Suburbs Lakeland Shore High Income Suburbs Landfall Established Cities Mahtomedi Growing High Income
Suburbs Marine-on-St. Croix High Income Suburbs Newport Established Cities Oak Park Heights Established Cities Oakdale Established Cities
County/City Cluster Pine Springs High Income Suburbs Scandia Growing High Income
Suburbs St. Marys Point High Income Suburbs St. Paul Park Smaller Residential Cities Stillwater Growing High Income
Suburbs Willernie Smaller Residential Cities Woodbury Large Cities
Watonwan Butterfield Rural Darfur Cities under 500 Pop. La Salle Cities under 500 Pop. Lewisville Cities under 500 Pop. Madelia Rural Odin Cities under 500 Pop. Ormsby Cities under 500 Pop. St James Rural
Wilkin Breckenridge Rural Campbell Cities under 500 Pop. Doran Cities under 500 Pop. Foxhome Cities under 500 Pop. Kent Cities under 500 Pop. Nashua Cities under 500 Pop. Rothsay Cities under 500 Pop. Wolverton Cities under 500 Pop.
Winona Altura Cities under 500 Pop. Dakota Cities under 500 Pop. Elba Cities under 500 Pop. Goodview Residential Communities Lewiston Residential Communities Minnesota Cities under 500 Pop. Rollingstone Residential Communities St Charles Residential Communities Stockton Residential Communities Utica Cities under 500 Pop. Winona Regional Centers
Wright Albertville Urban Fringe Annandale Residential Communities Buffalo Urban Fringe Clearwater Urban Fringe Cokato Residential Communities Delano Urban Fringe Hanover Urban Fringe Howard Lake Rural Maple Lake Urban Fringe Monticello Urban Fringe Montrose Urban Fringe Otsego Urban Fringe Rockford Residential Communities South Haven Cities under 500 Pop. St. Michael Urban Fringe Waverly Urban Fringe
Yellow Medicine Canby Rural Clarkfield Rural Echo Cities under 500 Pop. Granite Falls Rural

House Research Department September 2015 Grouping Minnesota Cities Page 56
County/City Cluster Hanley Falls Cities under 500 Pop. Hazel Run Cities under 500 Pop. Porter Cities under 500 Pop. St. Leo Cities under 500 Pop. Wood Lake Cities under 500 Pop.