GROUP RESULTS: KEY FEATURES - Home | DRDGOLD RESULTS: KEY FEATURES ... DEAR SHAREHOLDER While the...
12
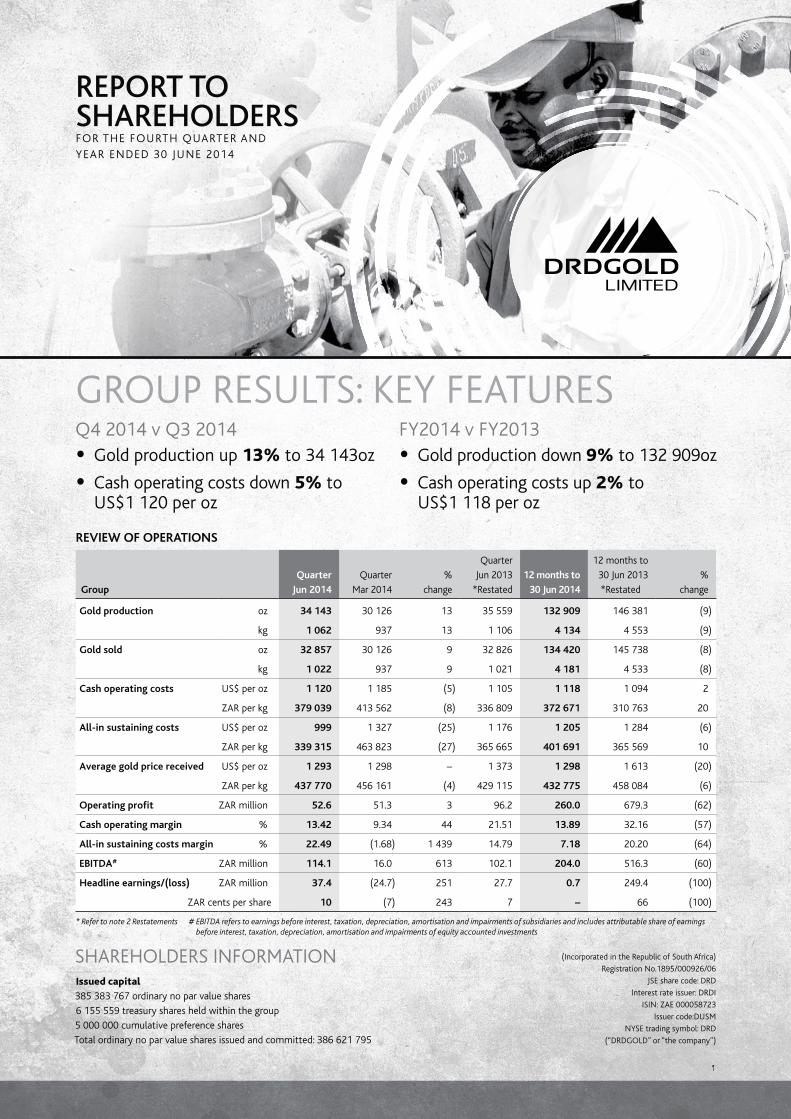
1 1 REVIEW OF OPERATIONS Group Quarter Jun 2014 Quarter Mar 2014 % change Quarter Jun 2013 *Restated 12 months to 30 Jun 2014 12 months to 30 Jun 2013 *Restated % change Gold production oz 34 143 30 126 13 35 559 132 909 146 381 (9) kg 1 062 937 13 1 106 4 134 4 553 (9) Gold sold oz 32 857 30 126 9 32 826 134 420 145 738 (8) kg 1 022 937 9 1 021 4 181 4 533 (8) Cash operating costs US$ per oz 1 120 1 185 (5) 1 105 1 118 1 094 2 ZAR per kg 379 039 413 562 (8) 336 809 372 671 310 763 20 All-in sustaining costs US$ per oz 999 1 327 (25) 1 176 1 205 1 284 (6) ZAR per kg 339 315 463 823 (27) 365 665 401 691 365 569 10 Average gold price received US$ per oz 1 293 1 298 – 1 373 1 298 1 613 (20) ZAR per kg 437 770 456 161 (4) 429 115 432 775 458 084 (6) Operating profit ZAR million 52.6 51.3 3 96.2 260.0 679.3 (62) Cash operating margin % 13.42 9.34 44 21.51 13.89 32.16 (57) All-in sustaining costs margin % 22.49 (1.68) 1 439 14.79 7.18 20.20 (64) EBITDA # ZAR million 114.1 16.0 613 102.1 204.0 516.3 (60) Headline earnings/(loss) ZAR million 37.4 (24.7) 251 27.7 0.7 249.4 (100) ZAR cents per share 10 (7) 243 7 – 66 (100) * Refer to note 2 Restatements # EBITDA refers to earnings before interest, taxation, depreciation, amortisation and impairments of subsidiaries and includes attributable share of earnings before interest, taxation, depreciation, amortisation and impairments of equity accounted investments (Incorporated in the Republic of South Africa) Registration No.1895/000926/06 JSE share code: DRD Interest rate issuer: DRDI ISIN: ZAE 000058723 Issuer code:DUSM NYSE trading symbol: DRD (“DRDGOLD” or “the company”) SHAREHOLDERS INFORMATION Issued capital 385 383 767 ordinary no par value shares 6 155 559 treasury shares held within the group 5 000 000 cumulative preference shares Total ordinary no par value shares issued and committed: 386 621 795 REPORT TO SHAREHOLDERS FOR THE FOURTH QUARTER AND YEAR ENDED 30 JUNE 2014 GROUP RESULTS: KEY FEATURES Q4 2014 v Q3 2014 • Gold production up 13% to 34 143oz • Cash operating costs down 5% to US$1 120 per oz FY2014 v FY2013 • Gold production down 9% to 132 909oz • Cash operating costs up 2% to US$1 118 per oz
-
Upload
nguyendien -
Category
Documents
-
view
214 -
download
1
Transcript of GROUP RESULTS: KEY FEATURES - Home | DRDGOLD RESULTS: KEY FEATURES ... DEAR SHAREHOLDER While the...
11
REVIEW OF OPERATIONS
Group
Quarter
Jun 2014
Quarter
Mar 2014
%
change
Quarter
Jun 2013
*Restated
12 months to
30 Jun 2014
12 months to
30 Jun 2013
*Restated
%
change
Gold production oz 34 143 30 126 13 35 559 132 909 146 381 (9)
kg 1 062 937 13 1 106 4 134 4 553 (9)
Gold sold oz 32 857 30 126 9 32 826 134 420 145 738 (8)
kg 1 022 937 9 1 021 4 181 4 533 (8)
Cash operating costs US$ per oz 1 120 1 185 (5) 1 105 1 118 1 094 2
ZAR per kg 379 039 413 562 (8) 336 809 372 671 310 763 20
All-in sustaining costs US$ per oz 999 1 327 (25) 1 176 1 205 1 284 (6)
ZAR per kg 339 315 463 823 (27) 365 665 401 691 365 569 10
Average gold price received US$ per oz 1 293 1 298 – 1 373 1 298 1 613 (20)
ZAR per kg 437 770 456 161 (4) 429 115 432 775 458 084 (6)
Operating profit ZAR million 52.6 51.3 3 96.2 260.0 679.3 (62)
Cash operating margin % 13.42 9.34 44 21.51 13.89 32.16 (57)
All-in sustaining costs margin % 22.49 (1.68) 1 439 14.79 7.18 20.20 (64)
EBITDA# ZAR million 114.1 16.0 613 102.1 204.0 516.3 (60)
Headline earnings/(loss) ZAR million 37.4 (24.7) 251 27.7 0.7 249.4 (100)
ZAR cents per share 10 (7) 243 7 – 66 (100)
* Refer to note 2 Restatements # EBITDA refers to earnings before interest, taxation, depreciation, amortisation and impairments of subsidiaries and includes attributable share of earnings before interest, taxation, depreciation, amortisation and impairments of equity accounted investments
(Incorporated in the Republic of South Africa)
Registration No.1895/000926/06
JSE share code: DRD
Interest rate issuer: DRDI
ISIN: ZAE 000058723
Issuer code:DUSM
NYSE trading symbol: DRD
(“DRDGOLD” or “the company”)
SHAREHOLDERS INFORMATIONIssued capital
385 383 767 ordinary no par value shares
6 155 559 treasury shares held within the group
5 000 000 cumulative preference shares
Total ordinary no par value shares issued and committed: 386 621 795
REPORT TO SHAREHOLDERSFOR THE FOURTH QUARTER AND YEAR ENDED 30 JUNE 2014
GROUP RESULTS: KEY FEATURESQ4 2014 v Q3 2014
• Gold production up 13% to 34 143oz
• Cash operating costs down 5% to US$1 120 per oz
FY2014 v FY2013
• Gold production down 9% to 132 909oz
• Cash operating costs up 2% to US$1 118 per oz

2 DRDGOLD LIMITED REPORT TO SHAREHOLDERS FOR THE FOURTH QUARTER AND YEAR ENDED 30 JUNE 2014
STOCK TRADED JSE NYSE*Average volume for the quarter per day ('000) 660 1 312
% of issued stock traded (annualised) 45 89
Price • High R 4.04 $0.383
• Low R 2.45 $0.239
• Close R 3.05 $0.297
* This data represents per share data and not ADS data – one ADS reflects 10 ordinary shares
MARKET CAPITALISATIONAs at 30 Jun 2014 (ZARm) 1 175.4
As at 31 Mar 2014 (ZARm) 1 526.1
As at 30 Jun 2014 (US$m) 114.5
As at 31 Mar 2014 (US$m) 143.7
DEAR SHAREHOLDERWhile the company’s results for FY2014 reflect the negative impact of
previously reported problems experienced during the year relating to the
integration of Ergo’s new High Grade Section and existing Low Grade
Section, it is very pleasing to report that, in the final quarter of the year,
a significant increase in production and revenue, quarter on quarter, was
recorded.
These improvements flowed both from improved volume throughput and
a significant improvement in metallurgical efficiencies. The response of
the Low Grade Section was immediate following the suspension of the
High Grade Section; carbon efficiencies and dissolved losses returned to
former steady state levels and, in the month of June, gold production was
the highest achieved for the 12-month period, at 388kg.
We previously reported a small number of planned engineering upgrades
to the High Grade Section, mainly to mitigate the effect of potential
power interruptions and to better manage the water balance in the event
of a higher than normal influx of rainwater. These are all on schedule and
ready for test work to begin. We also reconfigured the plant to allow one
third of total throughput to be separately leached, loaded and eluted. This
will be the base case against which the impact of the Flotation and Fine-
grind (“FFG”) section will be tested.
Initially, we planned to begin test work in September so as not to incur
the cost of power utility Eskom’s winter tariff; however, the June quarter’s
improved production and cashflow meant we were able to start in the
middle of August.
Q4 FY2014 V Q3 FY2014
OPERATING REVIEWGold produced was 13% higher quarter on quarter at 34 143oz, reflecting
improvements both in throughput and average yield. A 5% increase in
throughput to 6 131 000t resulted from fewer power- and weather-related
stoppages than were experienced in the previous quarter. These factors,
together with improvements in loaded carbon efficiencies, also contributed
to improved plant operating conditions, leading to a 7% rise in the average
yield to 0.173g/t. Gold sold was 9% higher at 32 857oz, a consequence of
higher gold production. Cash operating costs were 8% lower at R379 039/
kg, due also to the increase in gold production. All-in sustaining cash costs
were 27% lower at R339 315/kg. Capital expenditure was 30% lower at
R20.2 million, reflecting completion of the FFG capital project.
FINANCIAL REVIEWHigher production and sales offset the impact of a 4% decline in the
average Rand gold price received to R437 770/kg and, as a result, revenue
increased by 5% quarter on quarter to R447.4 million. After accounting
for a 5% rise in net operating costs to R394.8 million, due mainly to the
processing of sand material through the City Deep plant and the effect
of power utility Eskom’s tariff increase and winter tariff effective for the
month of June, operating profit was 3% higher at R52.6 million. The cash
operating margin increased by 44% to 13% and the all-in sustaining costs
margin improved to 22% from -2% in the previous quarter. Earnings
before interest, taxes, depreciation and amortisation (“EBITDA”) improved
substantially to R114.1 million from R16.0 million, and headline earnings
per share of 10 South African (“SA”) cents were recorded compared with a
headline loss of 7 SA cents per share.
FY2014 V FY2013
OPERATING REVIEWWhile throughput year on year increased by 3% to 23 908 000t, this did
not offset the impact of a 12% decline in the average yield to 0.173g/t.
Consequently, gold production was 9% lower at 132 909oz. Gold sold
was 8% lower at 134 420oz due to lower gold produced. Cash operating
costs were 20% higher at R372 671/kg due also to lower gold production
and all-in sustaining costs were 10% higher at R401 691/kg. Capital
expenditure was 56% lower, reflecting the completion of the FFG circuit.
FINANCIAL REVIEWLower gold production and sales, together with a 6% decline in the
average Rand gold price received to R432 775/kg, resulted in a 13%
drop in revenue to R1 809.4 million for the year. After accounting for net
operating costs – 11% higher at R1 549.4 million – operating profit was
62% lower at R260.0 million. The cash operating margin was 57% lower
at 14% and the all-in sustaining costs margin 64% lower at 7%. EBITDA
was down 60% at R204.0 million with a headline earnings of R0.7 million.
RESERVES AND RESOURCESDRDGOLD’s total attributable mineral reserves were 12% lower in 2014
at 1.5Moz while total attributable mineral resources were down less than
1% at 37.04Moz.
The FY2014 reserve and resource information was prepared in compliance
with the South African Code for Reporting Exploration Results, Mineral
resource and Mineral reserves (“SAMREC”) by DRDGOLD’s designated
competent person, Mr V Labuschagne, who is an employee of DRDGOLD.
CORPORATE ACTIVITYAfter year-end, DRDGOLD shareholders were informed that the
company had entered into a R220 million agreement to dispose of the
underground mining and prospecting rights held by East Rand Proprietary
Mines Limited (“ERPM”), and certain other assets and liabilities in the
related mining areas with a carrying value of (R11.6 million), to ERPM
South Africa Holdings Proprietary Limited, a company nominated by
Walcot Capital.
With a view to right-sizing the corporate footprint, and also with a view
to reducing costs, we have been engaged in recent months in an exercise
to restructure the executive and senior management. The corporate
complement has now been reduced by 26%, and we expect to realise

a saving of some R12.0 million a year. The corporate office will also be
relocated to the former Crown general offices following the expiry of our
current lease.
The management and staff of DRDGOLD did not earn any performance
bonuses at financial year-end.
BOARD CHANGESAlso after year-end, the company announced the termination of
employment by mutual agreement of Chief Financial Officer (“CFO”)
Francois van der Westhuizen and his resignation as an executive director.
Former Mintails Limited CFO Anthon Meyer has been appointed in an
acting capacity as CFO and executive director.
SUSTAINABLE DEVELOPMENTIn FY2014, 531 number of Grade 12 scholars from three schools enrolled
at the Ergo Business Development Academy (“EBDA”) for additional maths
and science classes. In 2013 the average pass rate for these subjects at their
schools increased to between 58% and 85% and we hope to see these
trends continue. Due to the success of the programme, EBDA is this year
also offering additional accountancy classes.
During FY2014, 191 new community learners were enrolled at EBDA for
these three-year National Certificate courses: electrical, plating, welding,
fitting, rigging, millwright, boilermaker and diesel mechanic. This brings
the total number of community learners enrolled at EBDA to 292. During
this year 63 community learners completed their courses successfully.
All employees have participated in a Best Life workshop to understand
the benefits of ICAS, an employee wellness and counselling service.
During FY2014 we piloted a financial literacy training initiative focusing
on long term planning for financial stability. Attended by 79 Ergo and
EBDA employees, the course was well-received and successful. We will roll
out this training to all employees during the next three years.
Our target is to reduce dust fall out incidents exceeding residential limits
(<600mg/d) from our existing sites by 10% a year. Our exceedances for
the year ended 30 June 2014 reduced by 57% from 4.1% to 1.8%.
As part of our strategy to reduce reliance on potable water and to ensure
a sustainable supply of water for the future, Ergo has entered into an
agreement with the local municipality to invest R22 million into the
construction of infrastructure to supply treated sewage water to its main
reclamation sites. We also have an agreement with the TCTA to supply up
to 8Ml of treated AMD for our operations.
In the past year, we released 215.ha of cleared land for development.
DIVIDENDThe DRDGOLD board has declared a final dividend of 2 South African (SA)
cents per ordinary share for the year ended 30 June 2014 as follows:
– the dividend has been declared out of income reserves;
– the local Dividends Tax rate is 15% (fifteen per centum);
– there are no Secondary Tax on Companies credits to be utilised;
– the gross local dividend amount is 2 SA cents per ordinary share for
shareholders exempt from the Dividends Tax;
– The net local dividend amount is 1.7 SA cents per ordinary share for
shareholders liable to pay the Dividends Tax;
– DRDGOLD currently has 385 383 767 ordinary shares in issue (which
includes 6 155 559 treasury shares); and
– DRDGOLD’s income tax reference number is 9160/013/60/4.
In compliance with the requirements of Strate, given the company’s
primary listing on the JSE Limited, the salient dates for payment of the
dividend are as follows:
Last date to trade ordinary shares cum
dividend Friday, 7 November 2014
Ordinary shares trade ex dividend Monday, 10 November 2014
Record date Friday, 14 November 2014
Payment date Monday, 17 November 2014
On payment date, dividends due to holders of certificated securities
on the SA share register will either be electronically transferred to the
shareholders’ bank accounts or, in the absence of suitable mandates,
dividend cheques will be posted to such shareholders.
Dividends in respect of dematerialised shareholdings will be credited to
shareholders’ accounts with the relevant CSDP or broker.
To comply with the further requirements of Strate, between Monday,
10 November 2014 and Friday 14 November 2014, both days inclusive, no
transfers between SA and any other share register will be permitted and no
ordinary shares pertaining to the SA share register may be dematerialised
or rematerialised.
The currency conversion date for the Australian and United Kingdom
registers will be Monday, 17 November 2014.
To holders of American Depositary Shares
Each American Depositary Share (“ADS”) represents 10 ordinary shares:
ADSs trade ex dividend on NYSE Wednesday, 12 November 2014
Record date Friday, 14 November 2014
Approximate date of currency
conversion Friday, 21 November 2014
Approximate payment date of
dividend Monday, 24 November 2014
Assuming an exchange rate of R10.61/$1, the dividend payable on an ADS
is equivalent to 1.6 US cents for shareholders liable to pay the dividend
tax. However, the actual rate of payment will depend on the exchange rate
on the date for currency conversion.
LOOKING AHEADTestwork on the FFG circuits will continue until at least the end of
Q2 FY2015. The results will inform the rate of build-up of material passing
through both the High and Low Grade Sections to full capacity.
In order to take full advantage of our considerable infrastructure we are
actively setting our sights on extending the reach of Ergo either through
co-operation or acquisition. This year we started to process higher grade
materials sourced over the fence by an independent operator. We will
continue to entertain this model to optimise our reach and supplement
our resource.
We are also keen to establish, by a continued focus on research and
testwork, the new opportunities offered by a successful FFG layout.
Niël Pretorius
Chief executive officer
2 September 2014
3

4 DRDGOLD LIMITED REPORT TO SHAREHOLDERS FOR THE FOURTH QUARTER AND YEAR ENDED 30 JUNE 2014
CONDENSED CONSOLIDATED STATEMENT OF PROFIT OR LOSS AND OTHER COMPREHENSIVE INCOME
Notes
QuarterJun 2014
Rm
Unaudited
QuarterMar 2014
Rm
Unaudited
QuarterJun 2013
RmRestated
Unaudited
12 months to30 Jun 2014
Rm
Reviewed
12 months to30 Jun 2013
RmRestated
Unaudited
Gold and silver revenue 447.4 427.4 438.1 1 809.4 2 076.5
Net operating costs (394.8) (376.1) (341.9) (1 549.4) (1 397.2)
Cash operating costs (402.5) (387.5) (372.5) (1 540.6) (1 414.9)
Movement in gold in process 7.7 11.4 30.6 (8.8) 17.7
Operating profit 52.6 51.3 96.2 260.0 679.3
Depreciation (38.9) (47.9) (41.0) (160.0) (143.8)
Movement in provision for environmental rehabilitation 7 94.7 (2.6) 30.0 86.6 (15.3)
Environmental rehabilitation costs (0.7) (7.8) (4.2) (30.0) (45.4)
Retrenchment costs (1.0) (3.3) – (6.7) (0.6)
Care-and-maintenance costs (3.0) (3.7) 0.9 (15.4) (20.3)
Other operating expenses (9.0) (2.6) (9.2) (12.3) (16.8)
Gross profit/(loss) from operating activities 94.7 (16.6) 72.7 122.2 437.1
Impairments 2, 3 (51.3) – (187.9) (56.6) (187.9)
Share of losses of equity accounted investments 2 (0.3) – (50.1) (0.3) (50.1)
Corporate and administration expenses 2 (19.1) (14.2) (18.5) (75.9) (79.4)
Share-based payments (1.4) (1.1) (1.2) (3.3) (4.5)
Profit on disposal of assets 1.0 – 8.1 1.0 19.3
Net finance (expense)/income (4.3) (8.6) (23.9) (24.3) 24.0
Profit/(loss) before taxation 2 19.3 (40.5) (200.8) (37.2) 158.5
Taxation 2 (11.4) 4.5 0.2 (17.5) (60.9)
Profit/ (loss) after taxation 2 7.9 (36.0) (200.6) (54.7) 97.6
Attributable to:
Equity owners of the parent 2 (3.8) (24.7) (180.8) (45.8) 49.4
Non-controlling interest 2 11.7 (11.3) (19.8) (8.9) 48.2
7.9 (36.0) (200.6) (54.7) 97.6
Other comprehensive income, net of deferred tax
Items that are or may be reclassified to profit or loss:
Foreign exchange translation and other – – 2.1 – 9.1
Reclassification of fair value adjustment on available-for-sale investments to profit or loss – – 101.3 – 101.3
Fair value adjustment of available-for-sale investments (55.4) 3.8 (23.4) (51.6) (66.7)
Total comprehensive income for the period (47.5) (32.2) (120.6) (106.3) 141.3
Attributable to:
Equity owners of the parent 2 (57.4) (20.9) (101.8) (95.6) 92.1
Non-controlling interest 2 9.9 (11.3) (18.8) (10.7) 49.2
(47.5) (32.2) (120.6) (106.3) 141.3
Reconciliation of headline earnings
Net (loss)/profit (3.8) (24.7) (180.8) (45.8) 49.4
Adjusted for:
– Impairments 51.3 – 187.9 56.6 187.9
– Share of losses on equity accounted investments (impairments) 0.3 – 50.1 0.3 50.1
– Profit on disposal of assets (1.0) – (8.1) (1.0) (19.3)
– Profit on disposal of associate (2.5) – – (2.5) –
– Non-controlling interest in headline earnings adjustment (3.6) – (13.8) (3.6) (12.2)
– Taxation thereon (3.3) – (7.6) (3.3) (6.5)
Headline earnings/(loss) 37.4 (24.7) 27.7 0.7 249.4
Headline earnings/(loss) per share – cents 2 10 (7) 7 – 66
Basic (loss)/earnings per share – cents 2 (1) (7) (48) (12) 13
Diluted headline earnings/(loss) per share – cents 2 10 (7) 7 – 66
Diluted basic (loss)/earnings per share – cents 2 (1) (7) (48) (12) 13
Calculated on the weighted average ordinary shares issued of : 379 228 208 379 228 208 379 178 208 379 209 441 379 178 208
The accompanying notes are an integral part of these condensed consolidated financial statements.
5
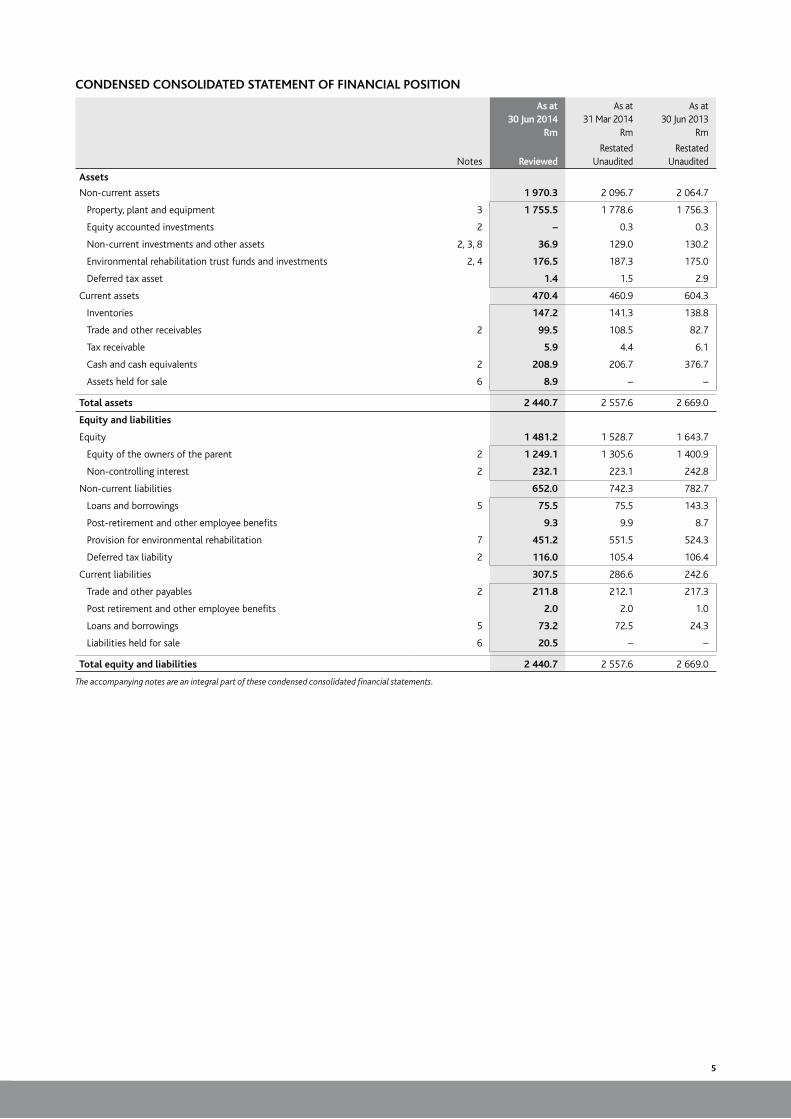
CONDENSED CONSOLIDATED STATEMENT OF FINANCIAL POSITION
As at30 Jun 2014
Rm
As at31 Mar 2014
Rm
As at30 Jun 2013
Rm
Notes ReviewedRestated
UnauditedRestated
Unaudited
Assets
Non-current assets 1 970.3 2 096.7 2 064.7
Property, plant and equipment 3 1 755.5 1 778.6 1 756.3
Equity accounted investments 2 – 0.3 0.3
Non-current investments and other assets 2, 3, 8 36.9 129.0 130.2
Environmental rehabilitation trust funds and investments 2, 4 176.5 187.3 175.0
Deferred tax asset 1.4 1.5 2.9
Current assets 470.4 460.9 604.3
Inventories 147.2 141.3 138.8
Trade and other receivables 2 99.5 108.5 82.7
Tax receivable 5.9 4.4 6.1
Cash and cash equivalents 2 208.9 206.7 376.7
Assets held for sale 6 8.9 – –
Total assets 2 440.7 2 557.6 2 669.0
Equity and liabilities
Equity 1 481.2 1 528.7 1 643.7
Equity of the owners of the parent 2 1 249.1 1 305.6 1 400.9
Non-controlling interest 2 232.1 223.1 242.8
Non-current liabilities 652.0 742.3 782.7
Loans and borrowings 5 75.5 75.5 143.3
Post-retirement and other employee benefits 9.3 9.9 8.7
Provision for environmental rehabilitation 7 451.2 551.5 524.3
Deferred tax liability 2 116.0 105.4 106.4
Current liabilities 307.5 286.6 242.6
Trade and other payables 2 211.8 212.1 217.3
Post retirement and other employee benefits 2.0 2.0 1.0
Loans and borrowings 5 73.2 72.5 24.3
Liabilities held for sale 6 20.5 – –
Total equity and liabilities 2 440.7 2 557.6 2 669.0
The accompanying notes are an integral part of these condensed consolidated financial statements.
6 DRDGOLD LIMITED REPORT TO SHAREHOLDERS FOR THE FOURTH QUARTER AND YEAR ENDED 30 JUNE 2014
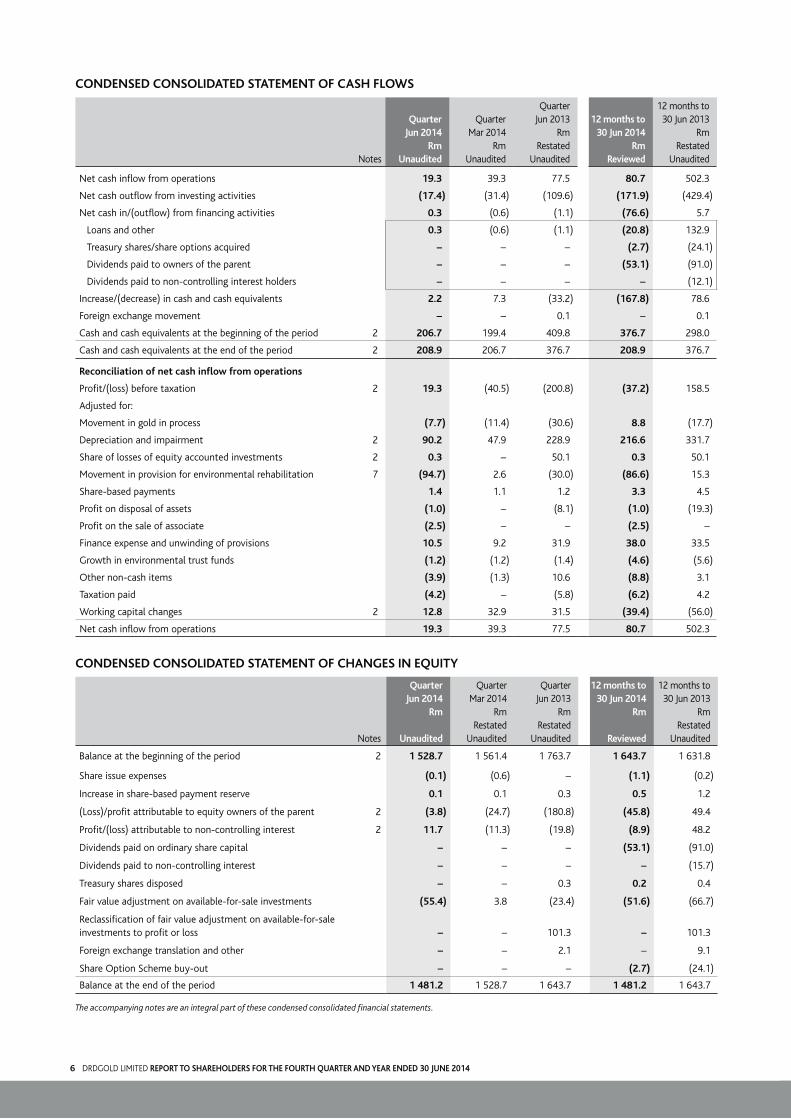
CONDENSED CONSOLIDATED STATEMENT OF CASH FLOWS
Notes
QuarterJun 2014
RmUnaudited
QuarterMar 2014
RmUnaudited
QuarterJun 2013
RmRestated
Unaudited
12 months to 30 Jun 2014
RmReviewed
12 months to 30 Jun 2013
RmRestated
Unaudited
Net cash inflow from operations 19.3 39.3 77.5 80.7 502.3
Net cash outflow from investing activities (17.4) (31.4) (109.6) (171.9) (429.4)
Net cash in/(outflow) from financing activities 0.3 (0.6) (1.1) (76.6) 5.7
Loans and other 0.3 (0.6) (1.1) (20.8) 132.9
Treasury shares/share options acquired – – – (2.7) (24.1)
Dividends paid to owners of the parent – – – (53.1) (91.0)
Dividends paid to non-controlling interest holders – – – – (12.1)
Increase/(decrease) in cash and cash equivalents 2.2 7.3 (33.2) (167.8) 78.6
Foreign exchange movement – – 0.1 – 0.1
Cash and cash equivalents at the beginning of the period 2 206.7 199.4 409.8 376.7 298.0
Cash and cash equivalents at the end of the period 2 208.9 206.7 376.7 208.9 376.7
Reconciliation of net cash inflow from operations
Profit/(loss) before taxation 2 19.3 (40.5) (200.8) (37.2) 158.5
Adjusted for:
Movement in gold in process (7.7) (11.4) (30.6) 8.8 (17.7)
Depreciation and impairment 2 90.2 47.9 228.9 216.6 331.7
Share of losses of equity accounted investments 2 0.3 – 50.1 0.3 50.1
Movement in provision for environmental rehabilitation 7 (94.7) 2.6 (30.0) (86.6) 15.3
Share-based payments 1.4 1.1 1.2 3.3 4.5
Profit on disposal of assets (1.0) – (8.1) (1.0) (19.3)
Profit on the sale of associate (2.5) – – (2.5) –
Finance expense and unwinding of provisions 10.5 9.2 31.9 38.0 33.5
Growth in environmental trust funds (1.2) (1.2) (1.4) (4.6) (5.6)
Other non-cash items (3.9) (1.3) 10.6 (8.8) 3.1
Taxation paid (4.2) – (5.8) (6.2) 4.2
Working capital changes 2 12.8 32.9 31.5 (39.4) (56.0)
Net cash inflow from operations 19.3 39.3 77.5 80.7 502.3
CONDENSED CONSOLIDATED STATEMENT OF CHANGES IN EQUITY
Notes
QuarterJun 2014
Rm
Unaudited
QuarterMar 2014
RmRestated
Unaudited
QuarterJun 2013
RmRestated
Unaudited
12 months to 30 Jun 2014
Rm
Reviewed
12 months to 30 Jun 2013
RmRestated
Unaudited
Balance at the beginning of the period 2 1 528.7 1 561.4 1 763.7 1 643.7 1 631.8
Share issue expenses (0.1) (0.6) – (1.1) (0.2)
Increase in share-based payment reserve 0.1 0.1 0.3 0.5 1.2
(Loss)/profit attributable to equity owners of the parent 2 (3.8) (24.7) (180.8) (45.8) 49.4
Profit/(loss) attributable to non-controlling interest 2 11.7 (11.3) (19.8) (8.9) 48.2
Dividends paid on ordinary share capital – – – (53.1) (91.0)
Dividends paid to non-controlling interest – – – – (15.7)
Treasury shares disposed – – 0.3 0.2 0.4
Fair value adjustment on available-for-sale investments (55.4) 3.8 (23.4) (51.6) (66.7)
Reclassification of fair value adjustment on available-for-sale investments to profit or loss – – 101.3 – 101.3
Foreign exchange translation and other – – 2.1 – 9.1
Share Option Scheme buy-out – – – (2.7) (24.1)
Balance at the end of the period 1 481.2 1 528.7 1 643.7 1 481.2 1 643.7
The accompanying notes are an integral part of these condensed consolidated financial statements.

7
NOTES TO THE CONDENSED CONSOLIDATED FINANCIAL STATEMENTS1. BASIS OF PREPARATION The condensed consolidated financial statements are prepared in accordance with the requirements of the JSE Limited Listings Requirements
for preliminary reports and the requirements of the Companies Act of South Africa. The Listings Requirements require preliminary reports to be prepared in accordance with the framework concepts and the measurement and recognition requirements of International Financial Reporting Standards (IFRS) and the SAICA Financial Reporting Guides as issued by the Accounting Practices Committee and Financial Pronouncements as issued by Financial Reporting Standards Council and to also, as a minimum, contain the information required by IAS 34 Interim Financial Reporting. The accounting policies applied in the preparation of the condensed consolidated financial statements are in terms of IFRS and are consistent with those applied in the previous consolidated annual financial statements, except for the adoption of applicable revised and/or new standards issued by the International Accounting Board (refer note 2).
The condensed consolidated financial statements of DRDGOLD Limited for the year ended 30 June 2014 have been reviewed by Mr J Le Roux of KPMG Inc, the group’s auditor. In their review report dated 2 September 2014, which is available for inspection at the Company’s Registered Office, KPMG Inc state that their review was conducted in accordance with the International Standard of Review Engagements 2410, Review of Interim Information Performed by the Independent Auditor of the Entity, which applies to a review of consolidated preliminary financial information, and have expressed an unmodified conclusion on the condensed consolidated financial statements.
2. RESTATEMENTS2.1 Changes in accounting policiesi) The Group has adopted the new standard IFRS11 – Joint Arrangements. The Group previously applied proportionate consolidation for investment
in joint arrangements and applied equity accounting from 1 July 2013.
ii) The Group has adopted IFRS 10 Consolidated Financial Statements. The Group previously consolidated the Guardrisk Cell Captive as a special purpose entity (“SPE”) on a line by line basis. Effective from 1 July 2013, the Guardrisk Cell Captive is not considered to be controlled by the Group and is therefore not consolidated. The Group is considered to have a right to the funds held in the Guardrisk Cell Captive and therefore recognised a reimbursive right to these funds in the hands of Ergo under IFRIC 5 Interest arising from Decommissioning, Restoration and Environmental Rehabilitation Funds.
2.2 Impact of applying IFRS 10 on the quarterly resultsThe impact of the adoption of IFRS 10 (refer to 2.1 ii – above) on the current and comparative periods was not quantified or reported on in the quarterly financial statements for the three quarters preceding the quarter ended 30 June 2014.
The results for the comparative periods of the quarter and year ended 30 June 2013 and the quarter ended 31 March 2014 as well as the statement of financial position at these dates have been restated with the effects of IFRS 10, IFRIC 5 and IFRS 11 where relevant.
IMPACT OF RESTATEMENTS ON THE YEAR ENDED 30 JUNE 2013:
Adjustments to the condensed consolidated statement of profit
or loss and other comprehensive income
Year ended
30 June 2013 as
stated previously
IFRS 10 and
IFRIC 5 IFRS 11
Year ended
30 June 2013
RestatedAudited Unaudited Unaudited Unaudited
Rm Rm Rm RmImpairments (238.0) – 50.1 (187.9)Corporate and administrative expenses (92.9) 13.5 – (79.4)Share of losses of equity accounted investments – – (50.1) (50.1)Profit before taxation 145.0 13.5 – 158.5Taxation (44.9) (16.0) – (60.9)Profit after taxation 100.1 (2.5) – 97.6Profit/(loss) after taxation attributable to:
Equity owners of the parent 59.2 (9.8) – 49.4Non-controlling interest 40.9 7.3 – 48.2
Total comprehensive income for the period attributable to: Equity owners of the parent 101.9 (9.8) – 92.1Non controlling interest 41.9 7.3 – 49.2
Adjustments to the condensed consolidated statement
of financial positionEnvironmental rehabilitation trust funds and investments 177.0 (2.0) – 175.0Non-current investments and other assets 130.1 0.1 – 130.2Equity accounted investments – – 0.3 0.3Cash and cash equivalents 377.2 – (0.5) 376.7Deferred tax liability 100.7 5.7 – 106.4Trade and other payables* 220.5 (3.0) (0.2) 217.3Equity of the owners of the parent 1 427.0 (26.1) – 1 400.9Non-controlling interest 221.3 21.5 – 242.8Adjustments to the condensed consolidated statement
of cash flowsIncrease in cash and cash equivalents 78.6 – – 78.6Cash and cash equivalents at the beginning of the period 298.5 – (0.5) 298.0Foreign exchange movements 0.1 – – 0.1
Cash and cash equivalents at the end of the period 377.2 – (0.5) 376.7Profit before taxation 145.0 13.5 – 158.5Adjusted for Depreciation and impairment 381.8 – (50.1) 331.7Share of losses of equity accounted investments – – 50.1 50.1Working capital changes (42.5) (13.5) – (56.0)
Adjustment to basic earnings per shareBasic earnings 59.2 (9.8) – 49.4Basic earnings per share – cents 16 (3) – 13Diluted basic earnings per share – cents 16 (3) – 13
Adjustment to headline earnings per shareHeadline earnings 259.2 (9.8) – 249.4Headline earnings per share – cents 68 (2) – 66Diluted headline earnings per share – cents 68 (2) – 66
8 DRDGOLD LIMITED REPORT TO SHAREHOLDERS FOR THE FOURTH QUARTER AND YEAR ENDED 30 JUNE 2014
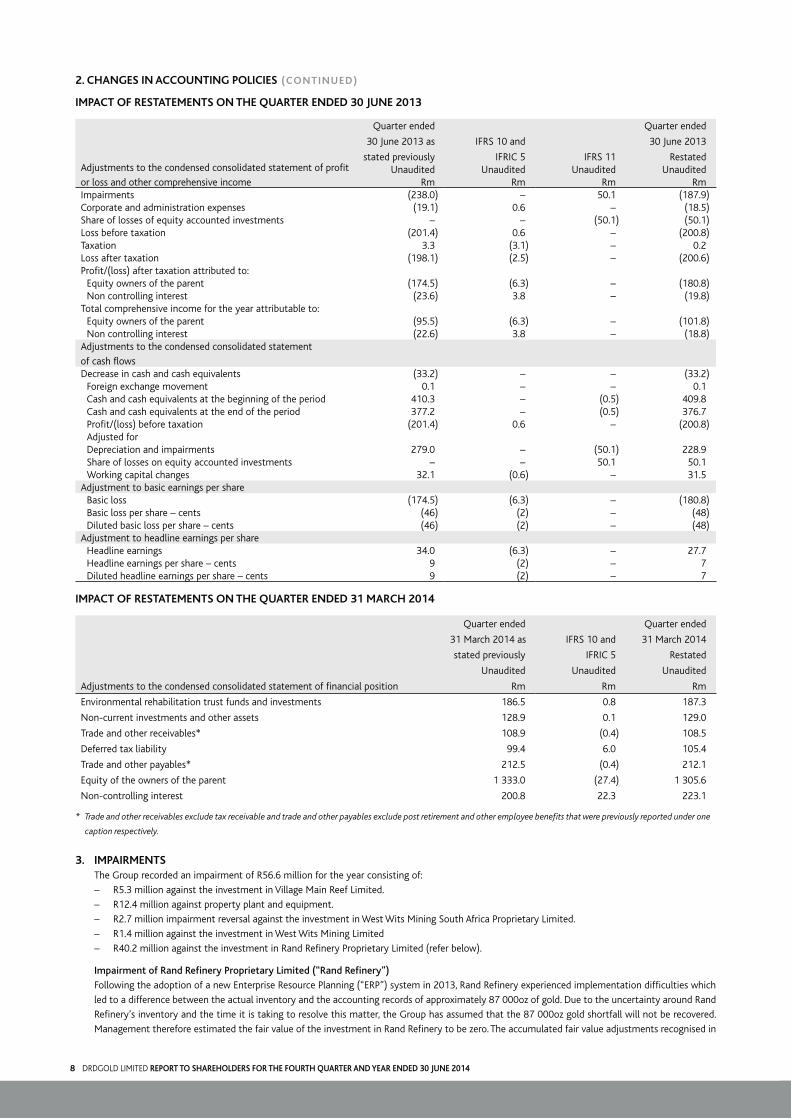
2. CHANGES IN ACCOUNTING POLICIES (CONTINUED)
IMPACT OF RESTATEMENTS ON THE QUARTER ENDED 30 JUNE 2013
Adjustments to the condensed consolidated statement of profit
or loss and other comprehensive income
Quarter ended
30 June 2013 as
stated previously
IFRS 10 and
IFRIC 5 IFRS 11
Quarter ended
30 June 2013
RestatedUnaudited Unaudited Unaudited Unaudited
Rm Rm Rm RmImpairments (238.0) – 50.1 (187.9)Corporate and administration expenses (19.1) 0.6 – (18.5)Share of losses of equity accounted investments – – (50.1) (50.1)Loss before taxation (201.4) 0.6 – (200.8)Taxation 3.3 (3.1) – 0.2Loss after taxation (198.1) (2.5) – (200.6)Profit/(loss) after taxation attributed to:
Equity owners of the parent (174.5) (6.3) – (180.8)Non controlling interest (23.6) 3.8 – (19.8)
Total comprehensive income for the year attributable to: Equity owners of the parent (95.5) (6.3) – (101.8)Non controlling interest (22.6) 3.8 – (18.8)
Adjustments to the condensed consolidated statement
of cash flowsDecrease in cash and cash equivalents (33.2) – – (33.2)
Foreign exchange movement 0.1 – – 0.1Cash and cash equivalents at the beginning of the period 410.3 – (0.5) 409.8Cash and cash equivalents at the end of the period 377.2 – (0.5) 376.7Profit/(loss) before taxation (201.4) 0.6 – (200.8)Adjusted for Depreciation and impairments 279.0 – (50.1) 228.9Share of losses on equity accounted investments – – 50.1 50.1Working capital changes 32.1 (0.6) – 31.5
Adjustment to basic earnings per shareBasic loss (174.5) (6.3) – (180.8)Basic loss per share – cents (46) (2) – (48)Diluted basic loss per share – cents (46) (2) – (48)
Adjustment to headline earnings per shareHeadline earnings 34.0 (6.3) – 27.7Headline earnings per share – cents 9 (2) – 7Diluted headline earnings per share – cents 9 (2) – 7
IMPACT OF RESTATEMENTS ON THE QUARTER ENDED 31 MARCH 2014
Adjustments to the condensed consolidated statement of financial position
Quarter ended
31 March 2014 as
stated previously
IFRS 10 and
IFRIC 5
Quarter ended
31 March 2014
Restated
Unaudited Unaudited Unaudited
Rm Rm Rm
Environmental rehabilitation trust funds and investments 186.5 0.8 187.3
Non-current investments and other assets 128.9 0.1 129.0
Trade and other receivables* 108.9 (0.4) 108.5
Deferred tax liability 99.4 6.0 105.4
Trade and other payables* 212.5 (0.4) 212.1
Equity of the owners of the parent 1 333.0 (27.4) 1 305.6
Non-controlling interest 200.8 22.3 223.1
* Trade and other receivables exclude tax receivable and trade and other payables exclude post retirement and other employee benefits that were previously reported under one
caption respectively.
3. IMPAIRMENTSThe Group recorded an impairment of R56.6 million for the year consisting of:
– R5.3 million against the investment in Village Main Reef Limited.
– R12.4 million against property plant and equipment.
– R2.7 million impairment reversal against the investment in West Wits Mining South Africa Proprietary Limited.
– R1.4 million against the investment in West Wits Mining Limited
– R40.2 million against the investment in Rand Refinery Proprietary Limited (refer below).
Impairment of Rand Refinery Proprietary Limited (“Rand Refinery”)
Following the adoption of a new Enterprise Resource Planning (“ERP”) system in 2013, Rand Refinery experienced implementation difficulties which
led to a difference between the actual inventory and the accounting records of approximately 87 000oz of gold. Due to the uncertainty around Rand
Refinery’s inventory and the time it is taking to resolve this matter, the Group has assumed that the 87 000oz gold shortfall will not be recovered.
Management therefore estimated the fair value of the investment in Rand Refinery to be zero. The accumulated fair value adjustments recognised in

9
Other Comprehensive Income has been reversed and the initial cost of the investment has been recognised as an impairment in profit and loss for
the period.
4. ENVIRONMENTAL REHABILITATION TRUST FUNDS AND INVESTMENTSIncluded in environmental rehabilitation trust funds and investments is restricted cash of R13.5 million.
5. LOANS AND BORROWINGSIncluded in loans and borrowings is a Domestic Medium Term Note Programme (“DMTN Programme”) under which DRDGOLD can issue notes from
time to time. DRDGOLD raised a total of R165 million under the DMTN Programme in July and September 2012. The different unsecured notes issued
mature 12 (R20.0 million), 24 (R69.5 million) and 36 (R75.5 million) months from the date of issue and bear interest at the three month Johannesburg
Inter–bank Acceptance Rate (JIBAR) rate (5.725% as at 30 June 2014) plus a margin ranging from 4% to 5% per annum.
On 3 July 2014, DRDGOLD repaid the amount of R69.5 million.
6. ASSETS AND LIABILITIES HELD FOR SALEIn June 2014 management was committed to a plan to sell the underground mining and prospecting rights held by ERPM including the related
liabilities. Accordingly these assets and liabilities is presented as a disposal group held for sale. The fulfilment of the conditions precedent associated
with regulatory approvals is expected within 12 to 18 months (refer to note 9).
7. MOVEMENT IN PROVISION FOR ENVIRONMENTAL REHABILITATIONAn amount of R86.6 million was credited to the statement of profit or loss resulting from a decrease in the estimated cost to rehabilitate. This is
based on the implementation of a different technique to vegetate the Crown complex as well as the increased use of “grey water” in rehabilitation.
An updated survey also resulted in the decrease of the area to be vegetated.
8 ASSETS AND LIABILITIES MEASURED AT FAIR VALUEThe different classes of assets measured at fair value (all available-for-sale financial assets), the movements in each class, as well as the respective
level of the fair value hierarchy under which it falls is outlined in the table below:
LEVEL 1 LEVEL 2 LEVEL 3
Investment in Village Main Reef
Limited
Investment in West Wits Mining
Limited
Total
Investment in Village Main Reef Limited
Total
Rand Refinery Proprietary
Limited
Other Total Total
65 714 286 Unemcumbered
shares
38 250 000 Unemcumbered
shares
20 000 000 Shares held in
escrow
44 348 Unemcumbered
shares
R’000 R’000 R’000 R’000 R’000 R’000 R’000 R’000 R’000
Balance at beginning of the year 29 571 – 29 571 4 500 4 500 93 320 164 93 484 127 555
Acquired during the year – 5 246 5 246 – – – 7 7 5 253
Gain/(loss) on fair value adjustment 1 315 – 1 315 200 200 (53 140) – (53 140) (51 625)
Impairment (4 600) (1 435) (6 035) (700) (700) (40 180) – (40 180) (46 915)
Transfers between levels in the fair value hierarchy – – – – – – – – –
Balance at end of year 26 286 3 811 30 097 4 000 4 000 – 171 171 34 268
The group applied the following valuation methodologies in the measurement of the fair value of each of the above classes:
Level 1: The fair value of listed investments is determined by reference to published price quotations from recognised securities exchanges and is
translated at the spot exchange rate obtained from a recognised financial institution as at measurement date.
Level 2: The fair value of listed investments is determined by reference to the valuation methodology outlined in Level 1 above and is adjusted with
a discount factor associated with the characteristics of the instrument.
Level 3: The fair value of unlisted investments is based on directors’ valuations which are made using the net asset value of the investee. Other
market data is also considered.
The group applied the following inputs in the measurement of the fair value of each of the above classes
Quoted price per share
ZAR (c) 40 – 40
AUD (c) – 1 –
Exchange rate
ZAR:AUD – 9.96411 –
Discount rate – – 50%
Other inputs Refer to Note 3
9. SUBSEQUENT EVENTS
On 25 July 2014, DRDGOLD announced that its subsidiaries EMO and ERPM collectively had entered into an agreement to dispose of the underground
mining and prospecting rights held by ERPM, and certain other assets on the related mining areas, for an agreed consideration of R220 million and
subject to various suspensive conditions.

ERGO KEY OPERATING AND FINANCIAL RESULTS (Unaudited)#
Ore milled (’000t) (metric) (imperial) Jun 2014 Qtr 6 131 6 758
Mar 2014 Qtr 5 823 6 418
Jun 2014 Ytd 23 908 26 351
Yield (g/t) (oz/t) (metric) (imperial) Jun 2014 Qtr 0.173 0.005
Mar 2014 Qtr 0.161 0.005
Jun 2014 Ytd 0.173 0.005
Gold produced (kg) (oz) (metric) (imperial) Jun 2014 Qtr 1 062 34 143
Mar 2014 Qtr 937 30 126
Jun 2014 Ytd 4 134 132 909
Cash operating costs (ZAR/kg) (US$/oz) Jun 2014 Qtr 379 039 1 120
Mar 2014 Qtr 413 562 1 185
Jun 2014 Ytd 372 671 1 118
Cash operating costs (ZAR/t) (US$/t) Jun 2014 Qtr 66 6
Mar 2014 Qtr 67 6
Jun 2014 Ytd 64 6
Gold and silver revenue (ZAR million) (US$ million) Jun 2014 Qtr 447.4 42.5
Mar 2014 Qtr 427.4 39.1
Jun 2014 Ytd 1 809.4 174.5
Operating profit (ZAR million) (US$ million) Jun 2014 Qtr 52.6 5.0
Mar 2014 Qtr 51.3 4.6
Jun 2014 Ytd 260.0 25.1
Profit/(loss) before taxation (ZAR million)(US$ million)* Jun 2014 Qtr 43.3 4.2
Mar 2014 Qtr (50.2) (4.8)
Jun 2014 Ytd (27.3) (2.6)
Capital expenditure (ZAR million) (US$ million) Jun 2014 Qtr 20.2 1.9
Mar 2014 Qtr 28.8 2.5
Jun 2014 Ytd 156.7 15.1 * Note – The difference between the loss before tax on the statement of profit or loss and other comprehensive income relates to corporate head office and other
reconciling items
# Note – The group only has one operating segment – Ergo
10 DRDGOLD LIMITED REPORT TO SHAREHOLDERS FOR THE FOURTH QUARTER AND YEAR ENDED 30 JUNE 2014

11
ALL-IN SUSTAINING COSTS RECONCILIATION (Unaudited)
R million unless otherwise stated
Net operating costs Jun 2014 Qtr 394.8
Mar 2014 Qtr 376.1
Jun 2014 Ytd 1 549.4
Corporate, administration and other expenses Jun 2014 Qtr 28.7
Mar 2014 Qtr 17.9
Jun 2014 Ytd 90.6
Rehabilitation and remediation (accretion and amortisation) Jun 2014 Qtr (84.2)
Mar 2014 Qtr 11.8
Jun 2014 Ytd (48.5)
Capital expenditure (sustaining) Jun 2014 Qtr 20.4
Mar 2014 Qtr 28.6
Jun 2014 Ytd 68.3
All-in sustaining costs* Jun 2014 Qtr 359.7
Mar 2014 Qtr 434.4
Jun 2014 Ytd 1 659.8
Retrenchment costs Jun 2014 Qtr 1.0
Mar 2014 Qtr 3.3
Jun 2014 Ytd 6.7
Rehabilitation and remediation Jun 2014 Qtr 0.7
Mar 2014 Qtr 7.8
Jun 2014 Ytd 30.0
Care-and-maintenance costs Jun 2014 Qtr 3.0
Mar 2014 Qtr 3.7
Jun 2014 Ytd 15.4
Capital expenditure (non-sustaining) Jun 2014 Qtr (0.2)
Mar 2014 Qtr 0.1
Jun 2014 Ytd 91.8
All-in costs* Jun 2014 Qtr 364.2
Mar 2014 Qtr 449.3
Jun 2014 Ytd 1 803.7
All-in sustaining costs (R/kg) Jun 2014 Qtr 339 315
Mar 2014 Qtr 463 823
Jun 2014 Ytd 401 691
All-in sustaining costs (US$/oz) Jun 2014 Qtr 999
Mar 2014 Qtr 1 327
Jun 2014 Ytd 1 205
All-in costs (R/kg) Jun 2014 Qtr 343 618
Mar 2014 Qtr 479 637
Jun 2014 Ytd 436 503
All-in costs (US$/oz) Jun 2014 Qtr 1 010
Mar 2014 Qtr 1 365
Jun 2014 Ytd 1 309
* All-in cost definitions based on the guidance note on non-GAAP Metrics issued by the World Gold Council on 27 June 2013

FOR FURTHER INFORMATION. CONTACT NIËL PRETORIUS AT:
Tel:(+27) (0) 11 470 2600 • Fax: (+27) (0) 11 470 2618
Website: http://www.drdgold.com • Quadrum Office Park • Building 1
50 Constantia Boulevard • Constantia Kloof Ext 28 • South Africa
PO Box 390 • Maraisburg • 1700 • South Africa
FORWARD LOOKING STATEMENTS
Many factors could cause the actual results, performance or achievements to be materially different from any future results, performance or achievements that may be expressed or implied by such forward-looking statements, including, among others, adverse changes or uncertainties in general economic conditions in the markets we serve, a drop in the gold price, a sustained strengthening of the Rand against the Dollar, regulatory developments adverse to DRDGOLD or difficulties in maintaining necessary licenses or other governmental approvals, changes in DRDGOLD’s competitive position, changes in business strategy, any major disruption in production at key facilities or adverse changes in foreign exchange rates and various other factors.
These risks include, without limitation, those described in the section entitled “Risk Factors” included in our annual report for the fiscal year ended 30 June 2013, which we filed with the United States Securities and Exchange Commission on 25 October 2013 on Form 20-F. You should not place undue reliance on these forward-looking statements, which speak only as of the date thereof. We do not undertake any obligation to publicly update or revise these forward-looking statements to reflect events or circumstances after the date of this report or to the occurrence of unanticipated events. Any forward-looking statement included in this report have not been reviewed and reported on by DRDGOLD’s auditors.
RESULTSThe condensed consolidated financial statements of DRDGOLD Limited for the year ended 30 June 2014 are available on the DRDGOLD Limited website as well as at the Company’s registered office.
12 DRDGOLD LIMITED REPORT TO SHAREHOLDERS FOR THE FOURTH QUARTER AND YEAR ENDED 30 JUNE 2014
DIRECTORS (*British)(**American)
Executives: DJ Pretorius (Chief executive officer)
AT Meyer (Acting chief financial officer)
Independent non-executives: GC Campbell* (Non-executive chairman)
J Holtzhausen, RP Hume, EA Jeneker, J Turk**
Company secretary: TJ Gwebu