
Group Research Project #1 - Adult Lactase Persistence … · the other cheek cell samples you have...
18
1 Group Research Project #1 - Adult Lactase Persistence and Associated Polymorphisms in the Human Lactase-Phlorizin Hydrolase (LCT) Gene (Dr. Julie Emerson, Department of Biology, Amherst College, Amherst, MA) Overview of Project: In this project, teachers will investigate the association between single nucleotide polymorphisms (SNPs) in the human lactase phlorizin-hydrolase (LCT) gene and the ability of certain individuals to digest milk and milk products into adulthood. Lactase is the enzyme that digests the disaccharide lactose into its two constituent monosaccharides, galactose and glucose, which are then able to cross intestinal epithelial cells for absorption into the bloodstream. A decrease in lactase activity following weaning occurs in most people in the world, who then experience the uncomfortable symptoms of lactose intolerance when they ingest milk or milk- based products as adults. In contrast, lactase persistence into adulthood is prevalent in people descended from societies known to have domesticated cattle approximately 7,500-9,000 years ago (Tishkoff et al., 2007). This includes people of European descent as well as people descended from two small pastoralist populations in North Africa (Tutsi and Fulani). Evolutionary biologists believe that there was strong selective pressure for lactase persistence in milk-producing societies. Initially, milk was a sterile source of water, thus decreasing death due to infection and disease. However, the additional caloric value of milk would have also created a large selective nutritional advantage in people who could continue to metabolize the sugars and proteins in milk into adulthood. Recent studies have attempted to determine the molecular basis of lactase persistence in humans, by identifying putative cis-regulatory regions that may affect the transcriptional activity of the lactase gene. A 2002 study by Enattah and co-workers identified two single SNPs in the 5'-flanking region of the lactase gene that segregate at a very high frequency with lactase- persistent individuals from European populations. These SNPs (C/T and G/A, with the second nucleotide in each pair associated with lactase persistence) are located 13,910 bp and 22,018 bp, respectively, upstream from the start of the lactase gene. Interestingly, these two SNPs are in two different introns (13 th and 9 th ) of an adjoining gene (mini-chromosome maintenance 6, MCM6) on the second chromosome (see Figure 1 on next page). In addition, the C/T-13910 SNP has been shown by in vitro experimentation to regulate the transcriptional activity of the lactase gene from Europeans (see references 10-12 in Tishkoff et al., 2007). Interestingly, the T-13910 allele does not show a high association with lactase persistence in pastoralist African populations (see references 15, 19-20 in Tishkoff et al., 2007). Hence, Tishkoff and her colleagues performed a detailed genotype-phenotype association study of introns 9 and 13 of the MCM6 gene in 470 Africans. They discovered three new variant SNPs in intron 13 in lactase-persistent Africans: G/C-14010, T/G-13915 and C/G-13907 bp (see Figure 1 on next page). They determined that the variant alleles are not present in great apes and therefore arose independently from the European T-13910 allele. They also showed that each variant African allele drove enhanced expression from the lactase promoter in in vitro transcription assays. These authors concluded that lactase persistence in European and African populations is a case of convergent evolution, in which the same phenotype (e.g., lactase persistence) brought about by the strong selective pressure of animal domestication is apparently due to non- homologous DNA sequences. It should be noted, however, that the European (T-13910) and
Transcript of Group Research Project #1 - Adult Lactase Persistence … · the other cheek cell samples you have...

1
Group Research Project #1 - Adult Lactase Persistence and Associated
Polymorphisms in the Human Lactase-Phlorizin Hydrolase (LCT) Gene
(Dr. Julie Emerson, Department of Biology, Amherst College, Amherst, MA)
Overview of Project: In this project, teachers will investigate the association between single nucleotide
polymorphisms (SNPs) in the human lactase phlorizin-hydrolase (LCT) gene and the ability of
certain individuals to digest milk and milk products into adulthood. Lactase is the enzyme that
digests the disaccharide lactose into its two constituent monosaccharides, galactose and glucose,
which are then able to cross intestinal epithelial cells for absorption into the bloodstream. A
decrease in lactase activity following weaning occurs in most people in the world, who then
experience the uncomfortable symptoms of lactose intolerance when they ingest milk or milk-
based products as adults. In contrast, lactase persistence into adulthood is prevalent in people
descended from societies known to have domesticated cattle approximately 7,500-9,000 years
ago (Tishkoff et al., 2007). This includes people of European descent as well as people
descended from two small pastoralist populations in North Africa (Tutsi and Fulani).
Evolutionary biologists believe that there was strong selective pressure for lactase persistence in
milk-producing societies. Initially, milk was a sterile source of water, thus decreasing death due
to infection and disease. However, the additional caloric value of milk would have also created a
large selective nutritional advantage in people who could continue to metabolize the sugars and
proteins in milk into adulthood.
Recent studies have attempted to determine the molecular basis of lactase persistence in
humans, by identifying putative cis-regulatory regions that may affect the transcriptional activity
of the lactase gene. A 2002 study by Enattah and co-workers identified two single SNPs in the
5'-flanking region of the lactase gene that segregate at a very high frequency with lactase-
persistent individuals from European populations. These SNPs (C/T and G/A, with the second
nucleotide in each pair associated with lactase persistence) are located 13,910 bp and 22,018 bp,
respectively, upstream from the start of the lactase gene. Interestingly, these two SNPs are in two
different introns (13th
and 9th
) of an adjoining gene (mini-chromosome maintenance 6, MCM6)
on the second chromosome (see Figure 1 on next page). In addition, the C/T-13910 SNP has
been shown by in vitro experimentation to regulate the transcriptional activity of the lactase gene
from Europeans (see references 10-12 in Tishkoff et al., 2007).
Interestingly, the T-13910 allele does not show a high association with lactase persistence in
pastoralist African populations (see references 15, 19-20 in Tishkoff et al., 2007). Hence,
Tishkoff and her colleagues performed a detailed genotype-phenotype association study of
introns 9 and 13 of the MCM6 gene in 470 Africans. They discovered three new variant SNPs in
intron 13 in lactase-persistent Africans: G/C-14010, T/G-13915 and C/G-13907 bp (see Figure 1
on next page). They determined that the variant alleles are not present in great apes and therefore
arose independently from the European T-13910 allele. They also showed that each variant
African allele drove enhanced expression from the lactase promoter in in vitro transcription
assays. These authors concluded that lactase persistence in European and African populations is
a case of convergent evolution, in which the same phenotype (e.g., lactase persistence) brought
about by the strong selective pressure of animal domestication is apparently due to non-
homologous DNA sequences. It should be noted, however, that the European (T-13910) and

2
African set of SNPs (C-14010, G-13915 and G-13907 bp) are within 100 bp of each other, and
may therefore affect the function of a single, putative cis-regulatory element of the lactase gene.
Figure 1. Map of the LCT and MCM6 gene region and location of genotyped SNPs. (a) Distribution of 123 SNPs included in genotype analysis. (b) Map of the LCT and MCM6 gene region.
(c) Map of the MCM6 gene. Note: the 5' to 3' orientation of the MCM6 gene in part (c) is flipped relative
to the orientation of the gene in part (b). Thus, the positions of the triangle and star do not line up
correctly below introns 9 and 13, respectively. The correct location of intron 9 is one to the right of the
current star and intron 13 is the long intron four to the right of the correct intron 9. (d) Sequence of the
lactase persistence-associated SNPs within Introns 9 and 13 of the MCM6 gene in African and European
populations. The Intron 9 SNP and the T-13910 variant in Intron 13 (blue box) are associated with lactase
persistence in Europeans, whereas the other three variants in Intron 13 (red, purple and green boxes) are
the African variants. From SA Tishkoff et al., 2007.
References: Identification of a variant associated with adult-type hypolactasia. Enattah, N.S., Sahi,
T., et al. Nature Gen. 30: 233-237, 2002.
Convergent adaptation of human lactase persistence in Africa and Europe. Tishkoff, S.A.,
Reed, F.A., et al. Nature Gen. 39: 31-40, 2007.

3
Summary of Project Protocol: On Day 1 of this project, each teacher will amplify approximately 700 bp of the MCM6 gene,
which includes the SNPs in Intron 13 associated with lactase-persistence (~14 kb upstream from
the start of the lactase gene). Each teacher should prepare three cheek cell DNA samples for
PCR: his/her own DNA and that of two other individuals (e.g., other teachers in the workshop
and/or faculty/staff or students in the Biology Department at Amherst). Each human volunteer
should fill out a consent form and questionnaire. The success of the PCR reactions will be
determined by gel electrophoresis on Day 2 of the project, and DNA from successful PCR
reactions will be purified and prepared for shipping to the Biotechnology Resource Center at
Cornell University for sequencing on Day 3. Teachers will then use NCBI’s BLAST search
engine to compare each of their sequences with those in NCBI’s gene database to make sure they
have in fact amplified the correct region of the human genome. More detailed sequence analyses
to identify the Intron 13 SNPs will then be done using the Lasergene software suite. Finally, all
members of the group will compile their individual results in a table, to assess the correlation
between lactase persistence and the presence of the European or African SNPs in Intron 13. A
flow chart for the experimental steps to complete the project is below.
Independent Project 2 - Molecular Identification of Human Single
Nucleotide Polymorphisms in the Lactase Gene
Day 1: Volunteers fill out Human Subjects Questionnaire
↓
DNA isolation from human cheek cells
↓
PCR using lactase forward and reverse primers*
↓
Day 2: Analytical agarose gel of PCR products
↓
Day 3: Spin purification of PCR products
↓
Analytical agarose gel of purified PCR products and
quantification of DNA amounts
↓
Sequencing reactions# set up and shipped to
sequencing center via overnight delivery
↓
Day 4: DNA sequencing by BRC at Cornell University
↓
Days 5 & 6: DNA sequence analysis and
presentation preparation
↓
Day 7: Project Presentation
*The lactase forward and reverse primers are approx. 14 kb upstream of
the start of the lactase gene (and also in the human MCM6 gene).
#Both strands of the lactase PCR product are sequenced using forward and
reverse primers internal to the two PCR primers.

4
Materials Needed: See Excel spreadsheet and recipes in Appendix
Protocol:
NOTE: PCR is extremely sensitive to contamination. A few foreign cells in your preparation can
ruin your results. For this reason, it is extremely important to maintain sterility at all times while
conducting the following procedures.
Day 1:
A. Questionnaire
1. Have each subject fill out a Human Subject Consent Form and Questionnaire.
B. Cell Extraction and DNA Isolation (adapted from Princeton University)
http://www.hhmi.princeton.edu/Manual/04%20HHMI%20Lab_04%20D1S80.pdf
1. You will obtain cheek cell DNA from two (or more) people. Obtain one 1.5 ml
microcentrifuge tube containing 10% Chelex for each volunteer and use a permanent
marker to label the top of each with an assigned human DNA sample number. (Note that
Chelex is not actually a solution, but a slurry of resin coated beads in water. You will see
the beads settled at the bottom of the tube.) Also, obtain one 15-ml centrifuge tube
containing 10 ml of sterile saline (0.9% NaCl) for each volunteer and label the side of
the centrifuge tube with the assigned DNA sample number.
2. Have the volunteer put on gloves and pour the contents (saline) of the conical centrifuge
into his/her mouth and agitate vigorously for 2 min, using his/her teeth to gently rub the
inner surface of his/her mouth to dislodge as many cells as possible. The more cells in the
sample, the higher the yield of DNA will be. [Note: this works best if people have not
eaten/chewed gum for an hour. If they just ate something sticky like Doritos, they should
try to rinse their mouth a bit first with water, because otherwise you end up with lots of
food particles in the cell suspension.]
3. The volunteer should then expel (i.e., spit) the solution carefully into a clean 50 ml
centrifuge tube, then carefully pour the saline/cheek cell suspension back into the original
15 ml centrifuge tube. Thank the subject and invite them to have some cookies in the
lobby to get the salt taste out of their mouths.
4. Place the 15-ml tubes in the clinical centrifuge, putting each tube across the rotor from
another for balance. Spin the tubes in the centrifuge for 5 min at 3,000 rpm.
5. When the spin ends, gently pour off the supernatant into the sink, leaving behind the
pellet of cheek cells (and whatever else). You should see a white pellet of cells in each
tube. Note the relative size of the pellets for the different samples.
6. Use a sterile, graduated transfer pipette to draw the water away from the settled Chelex
beads from one microcentrifuge tube. Use this water and pipette to gently resuspend the
cells in one 15-ml tube. Then, transfer the cell suspension back to the microcentrifuge
tube with the Chelex. Mix the cell/Chelex suspension well. Repeat this step for each of
the other cheek cell samples you have (using a new transfer pipette for each sample).
7. Firmly shut the microcentrifuge tubes and place them in a floating rack in the boiling
water bath for 10 min. DO NOT DELAY BETWEEN STEP 6 AND 7.
8. When the 10 min boiling step has ended, use forceps to remove the tubes from the water
bath, and place your boiled samples on ice for 1-2 minutes.
9. Spin your tubes with others (making sure the rotor is balanced) for 5 min in the high-
speed microcentrifuge. This will pellet the Chelex beads and cell debris, leaving the DNA

5
suspended in the supernatant above the beads. IF YOU HAVE TO WAIT FOR OTHERS
TO SPIN, KEEP YOUR TUBE ON ICE WHILE WAITING.
10. Wearing gloves, use a P200 micropipettor to transfer ONLY 150 µl of the clear
supernatant from the top of the solution to a new, sterile microcentrifuge tube. Be
careful not to transfer any of the material in the pellet because this will inhibit the PCR
reaction.
11. Label each new tube with its respective DNA sample number. You have now isolated a
small quantity of human genomic DNA. Keep the tubes on ice until you are ready to set
up your PCR reactions. The samples can also be frozen for later use.
C. PCR Amplification
1. Put on latex gloves. Use a permanent marker to label the top of a sterile 0.2 ml PCR
tube. You will run one PCR reaction for each DNA sample that you have (each person
should do a minimum of two different DNA samples). Label the PCR tubes with the
respective human DNA sample number and make a key.
2. One person in the project group should also prepare one PCR reaction tube for the
negative control (water) and the positive control (DNA known to work in assay).
3. I will provide you with LCT-Amp Mix*. Use a P-200 micropipettor to pipet 49 µl of this
amplification mixture into each of your PCR reaction tubes. This mixture contains LCT
forward (13.1 PCR F) and reverse primers (13.1 PCR R) to sequences in the far upstream
region of the human LCT gene (which are also in intron 13 of the MCM6 gene, hence the
primer names!), the four deoxynucleotides (A, T, C, G), GoTaq® DNA polymerase,
buffer, MgCl2 and other chemicals.
4. Using a P-20 micropipettor, pipet 1 µl of each extracted DNA sample into its respective
reaction tube.
5. The person who set up the controls in Step 2 should pipet 1 l of positive control DNA
(from JAE) into its tube and 1 l of negative control Chelex water into that tube.
6. Mix and briefly spin the samples in a microfuge.
7. The DNA is now ready for amplification in the thermocycler. The lab instructor will
collect your reaction tubes, place them in the thermocycler, and start the program. The
reaction will proceed as follows:
1 cycle 95˚C for 5 minutes (initial denature)
40 cycles 95˚C for 45 sec (denature)
59˚C for 45 sec (anneal)
70˚C for 90 sec (extend)
1 cycle 70˚C for 10 minutes (final extension)
Hold 4˚C overnight
*LCT-Amp Mix consists of:
1X PCR buffer w/ 1.5 mM MgCl2
0.25 M PCR Nucleotide Mix
0.5 M 13.1 PCR F primer
0.5 M 13.1 PCR R primer
2 units Taq polymerase/sample
dH20 (to 49 l/sample)

6
Day 2:
A. Analytical Mini-Gel of Primary PCR Products
1. Put on gloves. Remove your sample tubes from the thermocycler (or
refrigerator). Your reaction tubes now contain your primary PCR
products.
2. Centrifuge the tubes for 2-3 seconds before opening the lid.
3. Remove 2 l of each sample and put it into a clean 1.5 ml
microcentrifuge tube. Put your PCR tubes back on ice or in the
refrigerator.
4. Add 2 l of 5X Orange G sample buffer to the DNA and 6 l of
dH20 to the DNA in the new 1.5 ml microcentrifuge tubes. Mix and
briefly spin in microfuge.
5. For each sample, load the entire 10 µl into one well of a 1.3%
agarose gel that contains ethidium bromide.
6. Record your DNA sample numbers on the gel diagram sheet next to
the appropriate well numbers for your PCR products. This is so you
will know which lanes of the gel contain your PCR products, since
we will be running large gels with multiple samples.
7. Load 10 l of the 100-bp DNA ladder (in Orange G, see figure to
right) into one outer well per row.
8. Run the gel for ~1 hour at 100 V. Bring gel to the darkroom to
examine and photograph it with the UV transilluminator.
9. If you have a discrete band of DNA that is 690 bp in length for your
experimental DNA samples, proceed to Day 3. If you do not have
bands in the experimental AND the positive control sample, repeat
only the PCR reaction TODAY. If you have a band in the positive
control lane but no bands in your experimental lanes, repeat BOTH
Day 1 procedures TODAY.
100 bp DNA ladder

7
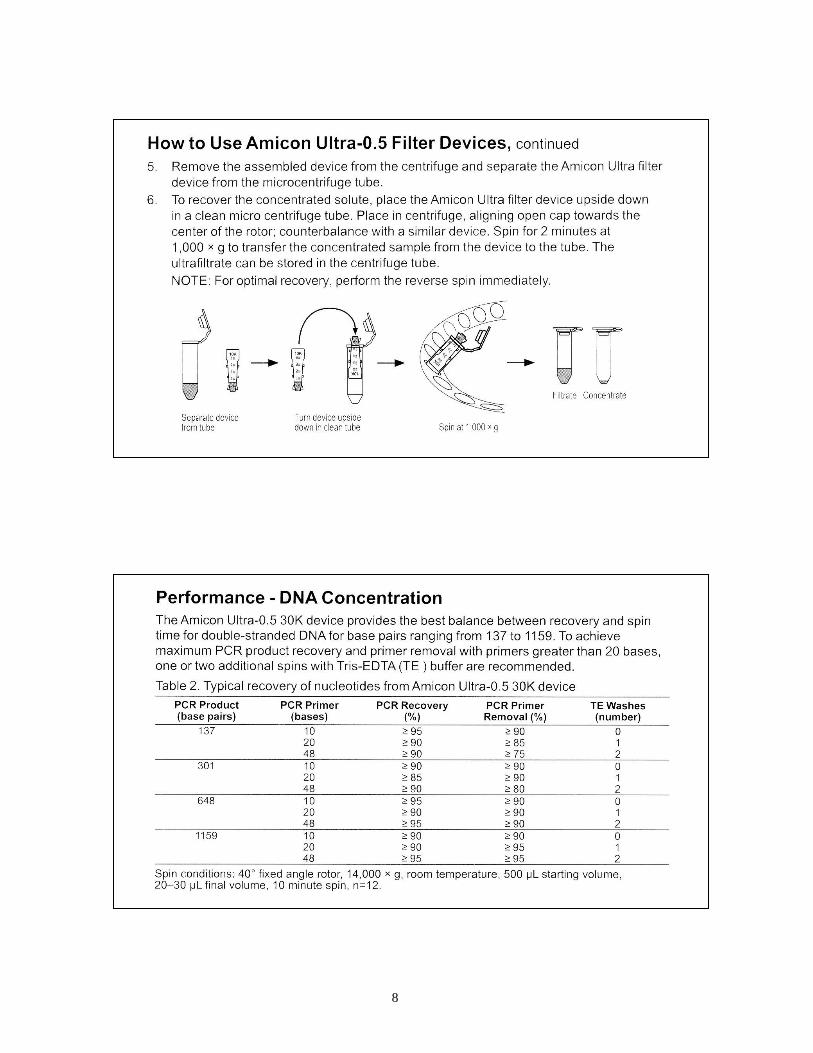
PCR Product Clean-Up with Amicon Ultra-0.5 Spin Filter Units
Step 4 above: spin for 11 minutes to obtain a final, concentrated volume of ~22 l
8

9
Day 3:
A. Spin purification of the PCR Products
1. Use an Amicon Ultra-0.5 Spin Filter Unit and follow the previous two pages of directions
to purify the PCR products away from unincorporated nucleotides, etc. Wear gloves.
2. For step #2, add 400 l of sterile dH2O to the filter unit. Carefully remove the rest of the
PCR sample (~48 µl) and add it to the water in the filter unit.
3. Follow the rest of the Amicon directions (steps 3-6).
4. Make sure that the microcentrifuge is set to rcf (NOT rpm).
B. Analytical Mini-Gel of Spin-Purified PCR Products
1. Put on gloves. Add 7 µl of dH2O and 2 µl of 5X Orange G
sample buffer to a clean, labeled 1.5 ml microcentrifuge
tube, which corresponds to each of your DNA samples.
2. Remove 1 µl of each DNA sample and put it into the
corresponding tube with the Orange G. Mix and briefly
spin in microfuge. Put your DNA samples back on ice.
3. For each sample, load the entire 10 µl into one well of a
1.3% agarose gel that contains ethidium bromide.
4. Record your name on the gel diagram sheet next to the
appropriate well numbers for your PCR products. This is so
you will know which lanes of the gel contain your PCR
products, since we will be running large gels with multiple
samples.
5. Quick spin, then load 10 µl of the Bio-Rad Precision
Molecular Mass marker ladder (see figure to right) into one
outside well per row of samples.
6. Run the gel for ~1 hour at 100 V. Bring gel to the darkroom
to examine/photograph it with the UV transilluminator.
7. Estimate how much DNA is in the lactase band by
comparing it to the staining intensities of bands in the
marker lane.
8. Calculate the volume of DNA solution that you need to use
to have 140 ng of PCR product. If this volume is less than 1
l, dilute the DNA in sterile dH2O.
C. Set Up Sequencing Reactions 1. Put on gloves.
2. You will have two sets of two tubes each: Human DNA 1 and Human DNA 2, each to be
sequenced with a forward and a reverse primer. Obtain four 0.5 ml, screw-cap skirted
microcentrifuge tubes.
3. Check with your lab instructor for the correct numbering sequence to use for labeling the
tubes (on the cap and the side with a Sharpie), and use the table on the following page
to fill in and keep track of how much of each item to add to each tube.

10
Sequencing
#
DNA
Sample #:
Vol. for
140 ng DNA
Primer
(8 pmol)
dH20
(to 18 l final vol.)
#______-F 2 l 13.1 Seq F
#______-R 2 l 13.1 Seq R
#______-F 2 l 13.1 Seq F
#______-R 2 l 13.1 Seq R
4. Use a P20 pipettor and sterile yellow tips to pipet each of the above solutions into the
respective tubes. Cap and Parafilm the tubes and give to the lab instructor for shipment
to the DNA Sequencing Facility at Cornell University.
Day 4-5:
A. DNA sequencing at the Biotechnology Resource Center at Cornell University
Days 5-6:
A. Analyzing the sequence data - see instructions starting on the next page
B. Preparation of project group Power Point presentation
Day 7:
A. Project presentation

11
Days 5-6: DNA Sequence Analysis
Note: Lasergene can be used for free for a limited time each year by educators.
Visit https://www.dnastar.com/forms.aspx?forms=edu for more information.
A. Examining the DNA Sequence Files:
Proceed as follows to examine the DNA sequence and chromatogram for each sequencing
reaction:
1. Download Chromas Lite onto your computer.
a. Google Chromas Lite.
b. Follow directions from the Technelysium website– free and easy.
c. Chose to save the compressed file to your disk; Desktop is convenient.
d. Right Click on the new Chromas.exe icon on your desktop. OPEN it and Extract it using
the default Program directory. Also elect to save shortcuts on the desktop and elsewhere
if you like.
e. Click on the newly created Chromas Lite icon to check that you’ve got it. It should be
able to open .abi files from Cornell or elsewhere to display the raw sequence data.
f. You may now discard the original Chromas icon (looks like a computer), which is needed
only to install the software.
2. Download and unzip the BRC sequence files and save the folder of unzipped files onto the
desktop. Copy your individual DNA sequence files into a new subfolder. Open the .abi files with
Chromas Lite and examine the raw chromatograms to see where and why ABI is unable to call
bases unambiguously (ambiguous bases are represented by an “N”) in regions of your sequence.
After you have aligned two (or more) sequence reads using Lasergene’s SeqMan (see below),
you will want to return, more than once, to the chromatograms to see if you believe one “read” or
the other. The choice depends upon your confidence or lack thereof in nearby bases, and other
aspects: Is the region too close (often in the first 10-20 bases) to your primer? Or too far? Some
sequences turn unreadable after 300 bases; 500 bases or even 700 is nice; and few are readable
after 800 bases.
B. Did You Amplify and Sequence the Correct Gene?
Before going any further, it is important to verify that you have in fact amplified and
sequenced the gene region that you thought you did. So, you will now compare your sequence
with those in the National Center for Biotechnology Information (NCBI) database using BLAST.
1. There are two ways to do this:
a. Go to the NCBI Web site (http://www.ncbi.nlm.nih.gov/), click on BLAST under
‘Popular Resources’ on the right and select the “nucleotide blast” option under the Basic
BLAST header. Paste the DNA sequence copied from the Chromas Lite window into the
box that appears in the next window below Enter Query Sequence, select ‘Others (nr
etc.):’ next to ‘Database’ under ‘Choose Search Set’, click on ‘Show results in a new
window’ next to the BLAST button, then click on the BLAST button in the lower left of
the window and see what you get. Experiment! From NCBI, you can link directly to
publications via the PubMed search engine, which is very convenient.

12
b. Or, even simpler, click on “Net Search” in the top menu bar of SeqMan (see below),
select “Blast selection” and proceed as directed; the default selections of the blastn
program and the nr (non-redundant nucleotide sequences) database should work fine.
Note that you cannot link to the returned “hits” if you choose “b.”
2. Do this for both sequence (.seq) files for each PCR sample. Examine the hits returned, and
think! Have you sequenced the correct gene?
C. Creation of a Sequence Contig
If all goes well, you will have sequence data for two sequencing reactions per PCR product.
For this project, the two primers should generate a good amount of overlapping sequence from
the two complementary strands of DNA. You will have only two-fold coverage at most, although
for many sequencing projects one opts for even greater repetition, and especially data obtained
from both strands (as is the case for this project). You will identify a region of consensus
between your pair of sequence reads by aligning the two sequence files to come up with a
“contig” (“contig” refers to a stretch of contiguous sequence). Proceed as follows to do this:
1. Open Lasergene’s SeqMan program: go to Start → All Programs → Course Related →
Biology → DNASTAR Lasergene 10 Core Suite → SeqMan.
2. In the (upper) menu bar of the SeqMan window, click on the Sequence tab then select
“Add…”. A new window will appear entitled “Enter Sequences.” Use the scroll buttons next to
the “Look in:” box to find and select (highlight) the folder of your sequences on the desktop.
Then click the “Open” tab under the blank window on the left. All the project sequences should
then appear in the above window. In this window, for each sample that you sequenced, highlight
the first sequence (J##.seq) file for your PCR product and click “Add ->” in the lower-right side
of the window, which adds the sequence file to the box in the upper-right side of the window.
Repeat for the second sequence file for the PCR product. Don’t (at this point) intermix your
sequences with those of other clones/amplifications. We usually work from Cornell’s .seq files
but the .abi files work, too. Now click the “Done” button.
3. Your two sequences should now appear in the “Unassembled Sequences” window. Next,
click on the “Assemble” button in the upper-left part of the menu bar. To see the result, double
click on the new “Contig1" which hopefully has just been created in the “Untitled Window.” Yet
another new window entitled “Alignment of Contig 1” should then appear. If SeqMan insists
that your two (or more) reads fail to join into a single contig, something has gone awry.
4. Remember that your two sequencing reactions are from each strand of the PCR product and
will therefore have different sequences. Never fear, as SeqMan recognizes antiparallel but
complementary, overlapping sequences if entered; it will reverse one of the two if needed, so
differences in the alignments of the two sequence reads can be easily identified. For our projects,
the odd-numbered files are the forward (sense) strands and the even-numbered files are the
complementary strand’s sequence. Determine the orientation of the two sequences by looking at
the small red and green arrows next to the sequence file names. You may want to choose the
“Complement Contig” selection in the dropdown “Contig” menu list, if the sense (odd-
numbered) sequence is not displayed in the 5' to 3' (left to right) direction (which for some
reason it usually is not!).

13
5. Examine the contig and note all points of discrepancy within the region of overlap (look for
red letters or dashes). You should now decide which sequence reaction you believe and whether
or not you agree with the computer’s “read.”
a. To do so, you will have to go back to the raw chromatograms in Chromas Lite. Use the
scale bar in the upper menu bar of Chromas to spread the chromatogram peaks apart for
easier reading. You can print the chromatogram if that helps (especially if you can get to
a colored printer). You can also RevComp a sequence directly in Chromas Lite, which
often makes that read easier to align with data as presented in SeqMan.
b. Are there places where you must accept an ambiguity? (R=purine; Y=pyrimidine; other
uncertainties also possible)
c. Can you rule one read “in” and the other “out” at a given position? If so, manually edit
the sequence by highlighting the nucleotide letter and typing in your letter of choice.
Write down on a piece of paper what you have done to create the consensus. Save the
new consensus file you have just created, named in some inimitable fashion.
D. Additional Analysis
Hopefully, you will be able to determine whether or not you have one or more SNPs
within the sequenced region of the lactase gene for each DNA sample. Experimental evidence
suggests that one or more of these SNPs may be responsible for lactase persistence into
adulthood in humans.
1. One relatively easy way to find the SNP’s is to use Chromas Lite to scan the .abi files of the
forward and reverse sequencing reactions (remembering to reverse complement the reverse
sequence first). Use the ‘Find’ window to jump to the two regions of interest (-14,010 bp and -
13915 to -13907 bp) by typing several nucleotides of sequence directly adjacent to each SNP
(see Appendix I below). Then, you can easily read from there to the SNP’s. Note: if you edited
the contig sequence in Part A above, make sure that you double check the .abi sequence against
the edited contig sequence.
2. Lactase persistence is inherited as an autosomal dominant trait. Did you discover any
instances of heterozygosity at any of the above four SNP locations? (This is often discernible as
two peaks on the sequencing chromatogram of the .abi file.)
3. Create a chart of the -14010 bp, -13915 bp, -13910 bp and -13907 bp SNPs and tally each of
your group’s DNA samples. Did any individuals have any of these SNPs? When you align all of
the sequences, do any new SNPs crop up?
4. Did any individual have more than one of these SNPs? A combination of two or more SNPs is
called a haplotype. How many different haplotypes did you identify?
5. Is there any correlation between the SNPs (haplotypes) that your group found and lactase
persistence? To the population subgroup to which each subject belongs?
6. A question to address in your final presentation is how SNPs that are ~14,000 bp upstream
from the start site of transcription of the lactase gene can lead to differing levels of expression of
that gene.

14
E. Preparation of Project Presentation
1. Your group should prepare a Power Point-based presentation, in which each member of the
group spends ~2-3 minutes talking about the information on particular slides. The overall
presentation should not exceed 25 minutes, which will allow up to 5 minutes of
questions/discussion afterwards.
2. The presentation should be organized in the format of a scientific paper, with Introduction,
Methods, Results and Conclusions sections. Please also include a Bibliography slide, with a list
of any cited references.
3. The most effective Power Point slides are those that are visually pleasing to the eye and not
too dense with text. Please talk with the Workshop staff if you have any questions about using
Power Point.

15
Appendix I: Human MCM6 Gene Sequence and 5'-Flanking Sequence of the Human
Lactase Gene
MCM6 - 5’ end of Intron 13 (+ 3’ end of exon 13) 960 bp
24781 ccctaaatgt ttccacctgg aaggctctta aacttaggtt taccgtagct ctcatcaaat
24841 agaaatgttt ctctaacttg agtgatgatc tgaaacagat ttccaaagag tcagaggact
24901 tcattgtgga gcaatataaa catctccgcc agagagatgg ttctggagtg accaagtctt
24961 catggaggat tacagtgcga cagcttgaga gcatgattcg tctctctgaa gctatggctc
25021 ggatgcactg ctgtgatgag gtatcagagt cactttgata tgatgagagc agagataaac
25081 agatttgttg catgttttta atctttggta tgggacatac tagaattcac tgcaaataca
25141 tttttatgta actgttgaat gctcatacga ccatggaatt cttcccttta aagagcttgg
25201 taagcatttg agtgtagttg ttagacggag acgatcacgt catagtttat agagtgcata
25261 aagacGtaag ttaccattta atacctttca ttcaggaaaa atgtacttag accctacaat
25321 gtactagtag gcctctgcgc tggcaataca gataagataa TgtagCccCt ggcctcaaag
25381 gaactctcct ccttaggttg catttgtata atgtttgatt tttagattgt tctttgagcc
25441 ctgcattcca cgaggatagg tcagtgggta ttaacgaggt aaaaggggag tagtacgaaa
25501 gggcattcaa gcgtcccatc ttcgcttcaa ccaaagcagc cctgcgtttt cctagtttta
25561 ttaataggtt tgatgtaagg tcgtctttga aaagggggtt tggctttttt ttacagtgtg
25621 actgaggtat aatttataaa aagggaaatg tatggcatgg tgagtttttt cacatacatc
25681 cttgtgaata cccagctcaa gatccaaaac atttccataa tttcagaaag ttccaaaccc
25741
PCR amplification of the coding region was done using the 13.1 F (forward) and 13.1 R (reverse,
complement) PCR primers. Their locations are indicated above in green and orange,
respectively. Approximately 500 bp of this PCR product was sequenced using the 13.1 F (pink)
and 13.1 R (maroon) sequencing primers. Also indicated in red and blue, respectively, are the
locations of the four SNPs in intron 13 of the MCM6 gene. The bp positions below of the SNPs
are relative to the start of the lactase gene.
The colored sequences above are as follows:
13.1 Forward PCR Primer
13.1 Forward Sequencing Primer
Sequence flanking -14,010 G/C polymorphism (capital letter)
Sequence flanking -13,915 T/G, -13,910 C/T* and -13907 C/G polymorphisms (capitalized)
13.1 Reverse Sequencing Primer (sequence is reverse complement)
13.1 Reverse PCR Primer (sequence is reverse complement)
Note: PCR product = 690 bp in length
* = European SNP = C in line 25321 of above sequence

16
Appendix II: Reagent Recipes
10% Chelex Suspension
Initial preparation:
o Sterilize two 25 mL graduated cylinders with foil covering.
o Sterilize six 50 mL foil-covered beakers with small stir bars.
o Sterilize six weighing spatulas, foil wrapped separately.
o Sterilize 4 x 50 mL of dH2O (in 125-ml glass bottles). Label ‘dH2O – PCR ONLY’.
o Obtain 1 packet clipped P1000 pipet tips, sterile (for pipetting Chelex
suspension).
Chelex Suspension preparation (makes ~50 tubes, store at 4ºC):
o Using a sterile spatula, add 2.5 g Chelex beads (Sigma cat. no. C-7901) to a 50
mL sterile beaker with sterile stir bar.
o Use sterile graduated cylinder to add 25 mL sterile dH2O to the beaker. Place the
beaker on a stir plate (set at 5-7).
o While the solution is stirring, keeping the beads in suspension, pipet 0.5 mL
aliquots of the slurry into 1.5 mL micro centrifuge tubes. Pipet the suspension
using clipped and sterilized blue tips.
Oligonucleotide Primers for PCR Reactions
13.1 PCR F primer = 5'- TGC GAC AGC TTG AGA GCA TGA TTC -3'
13.1 PCR R primer = 5-' ACT CAC CAT GCC ATA CAT TTC CC -3'
Order from Integrated DNA Technologies, Inc. Web Site:
http://www.idtdna.com/Catalog/CustomSynthesisandPurification/Page1.aspx
o Purification = standard desalting.
o Unit size = 25 nmol.
o Bases = 25.
Use IDT nm amounts as guide and add ~appropriate amount of PCR-grade dH2O to each
tube to make a 100 µM stock solution.
Make a 1:4 dilution of the 100 µM solutions (20 l of primer and 60 l of PCR dH2O) to
have working stocks of 25 µM. Store at -20 ºC until needed.
Thaw on ice when using to make LCT-Amp Mix.
Amplification Mix
1 tube = enough for 9 reactions (make as many tubes as needed)
dH2O 318.2 µl
5X Colorless GoTaq® PCR Buffer w/MgCl2 (1.5 mM final) 90 µl
PCR Nucleotide Mix (Promega, 10 mM) 11.25 µl
13.1 F primer working stock (25 µM) 9 µl
13.1 R primer working stock (25 µM) 9 µl
GoTaq® DNA polymerase (5 units/µl) (2 u/reaction final) 3.6 µl
Store all components at -20 ºC until needed.
Mix in a sterile 1.5 ml microcentrifuge tube. Keep mix on ice during lab.
Students should add 1 µl of a DNA sample to 49 µl of the mix.

17
10X Tris/Borate/EDTA (TBE) Electrophoresis Buffer (from p. 538 in DNA Science)
Makes 1 liter. Store at room temperature (indefinitely).
1. Add the following dry ingredients to 700 ml of distilled or deionized water.
1 g of NaOH (m.w. = 40.0)
108 g of Tris (m.w. = 121.10)
55 g of boric acid (m.w. = 61.83)
7.4 g of EDTA (disodium salt, m.w. = 372.24)
2. Stir to dissolve, preferably using a magnetic stir bar.
3. Add distilled or deionized water to bring solution total to 1 liter.
4. Mix well and filter through #1 Whatman paper into a glass 1-L bottle.
Working concentration is 1X. Add 100 ml of 10X TBE to 900 ml of distilled or deionized water
and mix well.
5X Orange G Sample Buffer
2% Orange G solution in water 1 ml
Glycerol 5 ml
dH2O 4 ml
100 bp DNA Ladder
Purchase from Promega (50% discount for teachers; # G2101).
Add 100 µl of stock DNA Ladder to 60 µl dH2O and 40 l of 5X Orange G Sample Buffer
Make twenty 10 l aliquots. Store at -20 ºC until needed.
Use 10 µl when loading marker lane in gel.
Precision Molecular Mass Standards
Purchase from Bio-Rad (#170-8207)
Add 50 l of stock standards to 110 l of sterile TE and 40 l of 5X Orange G Sample
Buffer. Make twenty 10 l aliquots. Store at -20 ºC until needed.
Load 10 l in the marker lane of gel.
Tris/EDTA (TE) Buffer
Store at room temperature (indefinitely)
Mix:
1 ml of 1 M Tris (pH 7.9) (10 mM)
200 l of 0.5 M EDTA (1 mM)
99 ml of distilled water

18
Sequencing Primers:
13.1 Seq F primer = 5'- CAG AGT CAC TTT GAT ATG ATG -3'
13.1 Seq R primer = 5-' GAC GAC CTT ACA TCA AAC C -3'
Order from Integrated DNA Technologies, Inc. Web Site:
http://www.idtdna.com/Catalog/CustomSynthesisandPurification/Page1.aspx
o Purification = standard desalting.
o Unit size = 25 nmol.
o Bases = 25.
Use IDT nm amounts as guide and add ~appropriate amount of PCR-grade dH2O to each
tube to make a 100 µM solution.
Make a 1:25 dilution of the 100 µM solutions (4 l of primer and 96 l of PCR dH2O) to
have a working stock of 4 pmol/l. Store at -20 ºC until needed.
Thaw on ice when setting up sequencing reactions.
0.9% NaCl (sterile)
Dissolve 9 gm of NaCl in 1 L of water.
Add 100 ml to each of ten 125-ml bottles. Loosely cap bottles.
Autoclave for 15 minutes on liquid cycle.
Using sterile technique, pipette 10 ml each into 20 sterile 15-ml conical centrifuge tubes


![Enzyme Concentration- [Lactase] and Lactose](https://static.fdocuments.in/doc/165x107/5515cbbc497959f81d8b4f2d/enzyme-concentration-lactase-and-lactose.jpg)