Group Presentation - Manutencoop Facility · PDF fileGROUP PRESENTATION Manutencoop is a Group...
14
Group Presentation September, 2013
Transcript of Group Presentation - Manutencoop Facility · PDF fileGROUP PRESENTATION Manutencoop is a Group...
Group Presentation September, 2013
GROUP PRESENTATION
Introducing Manutencoop Group History
Activities
Shareholders
Financial Highlights
2
Index

GROUP PRESENTATION
Manutencoop is a Group of service companies operating in the Italian Facility Management Market Manutencoop provides a wide and coordinated range of services, supporting the strategic activity and the core business of medium and large private groups, public entities and healthcare providers Manutencoop has pioneered the Italian Facility Management industry and now stands out for high efficiency, competitiveness and a steady management able to match growth and work opportunities, in line with its strong cooperative tradition Main figures:
Group revenues : over 1 billion €
Group employees: over 18.000
Geography: Italy
3
Introducing Manutencoop Overview
GROUP PRESENTATION
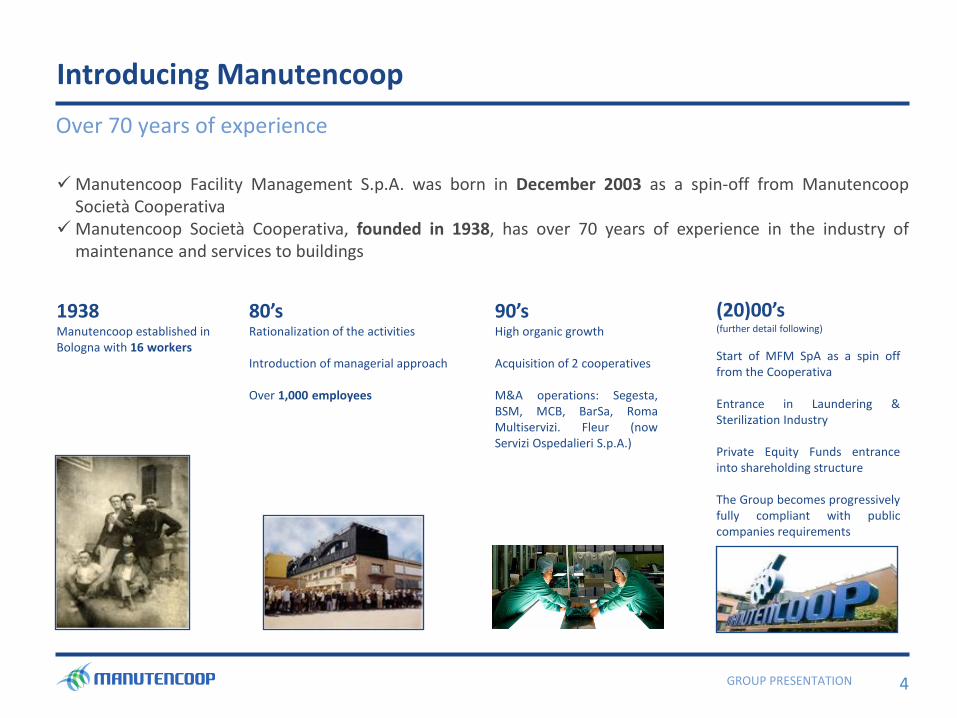
1938 Manutencoop established in Bologna with 16 workers
80’s Rationalization of the activities Introduction of managerial approach Over 1,000 employees
90’s High organic growth Acquisition of 2 cooperatives M&A operations: Segesta, BSM, MCB, BarSa, Roma Multiservizi. Fleur (now Servizi Ospedalieri S.p.A.)
(20)00’s (further detail following)
Start of MFM SpA as a spin off from the Cooperativa Entrance in Laundering & Sterilization Industry Private Equity Funds entrance into shareholding structure The Group becomes progressively fully compliant with public companies requirements
4
Introducing Manutencoop
Over 70 years of experience
Manutencoop Facility Management S.p.A. was born in December 2003 as a spin-off from Manutencoop Società Cooperativa
Manutencoop Società Cooperativa, founded in 1938, has over 70 years of experience in the industry of maintenance and services to buildings
GROUP PRESENTATION 5
Introducing Manutencoop
Recent milestones
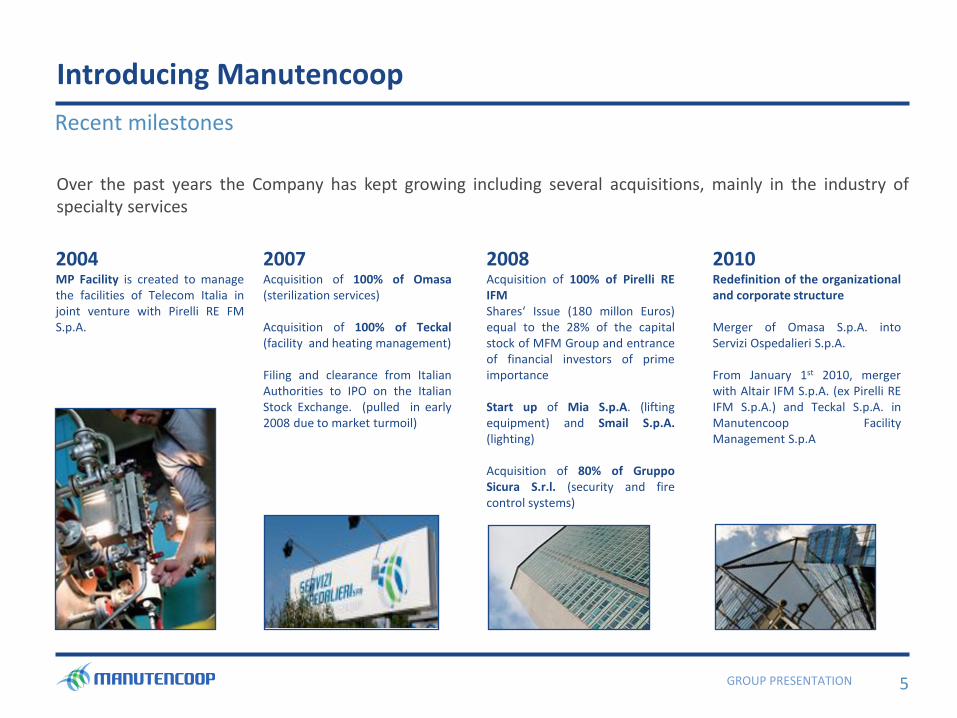
2007 Acquisition of 100% of Omasa (sterilization services) Acquisition of 100% of Teckal (facility and heating management) Filing and clearance from Italian Authorities to IPO on the Italian Stock Exchange. (pulled in early 2008 due to market turmoil)
2004
MP Facility is created to manage the facilities of Telecom Italia in joint venture with Pirelli RE FM S.p.A.
2008 Acquisition of 100% of Pirelli RE IFM Shares‘ Issue (180 millon Euros) equal to the 28% of the capital stock of MFM Group and entrance of financial investors of prime importance Start up of Mia S.p.A. (lifting equipment) and Smail S.p.A. (lighting) Acquisition of 80% of Gruppo Sicura S.r.l. (security and fire control systems)
2010 Redefinition of the organizational and corporate structure Merger of Omasa S.p.A. into Servizi Ospedalieri S.p.A. From January 1st 2010, merger with Altair IFM S.p.A. (ex Pirelli RE IFM S.p.A.) and Teckal S.p.A. in Manutencoop Facility Management S.p.A
Over the past years the Company has kept growing including several acquisitions, mainly in the industry of specialty services

GROUP PRESENTATION 6
Introducing Manutencoop
Two main Service Focuses
Facility Management Services
Specialty Services
Technical and Maintenance Services
Hygiene
Landscaping
Energy Services
Ancillary Services
Logistics
Property Management
Laundering & Sterilization
Security and Fire Prevention Systems
Lighting (outdoor-indoor)
Management and Maintenance of Elevating
Systems
Document Management
Building and Construction
GROUP PRESENTATION 7
Introducing Manutencoop
Widespread Italian Presence
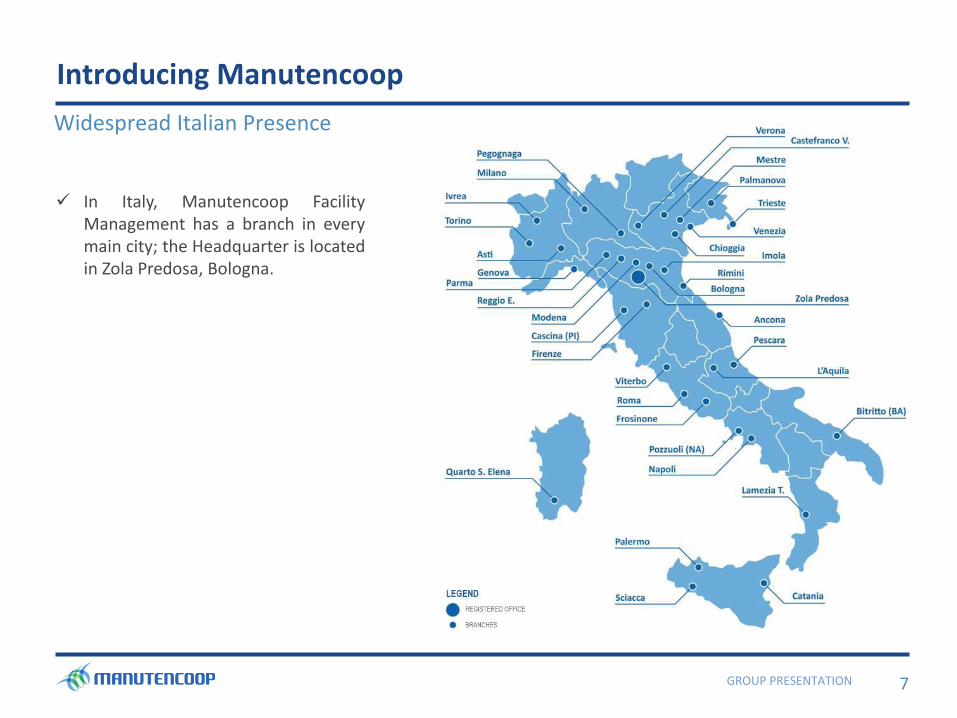
In Italy, Manutencoop Facility Management has a branch in every main city; the Headquarter is located in Zola Predosa, Bologna.
GROUP PRESENTATION
8
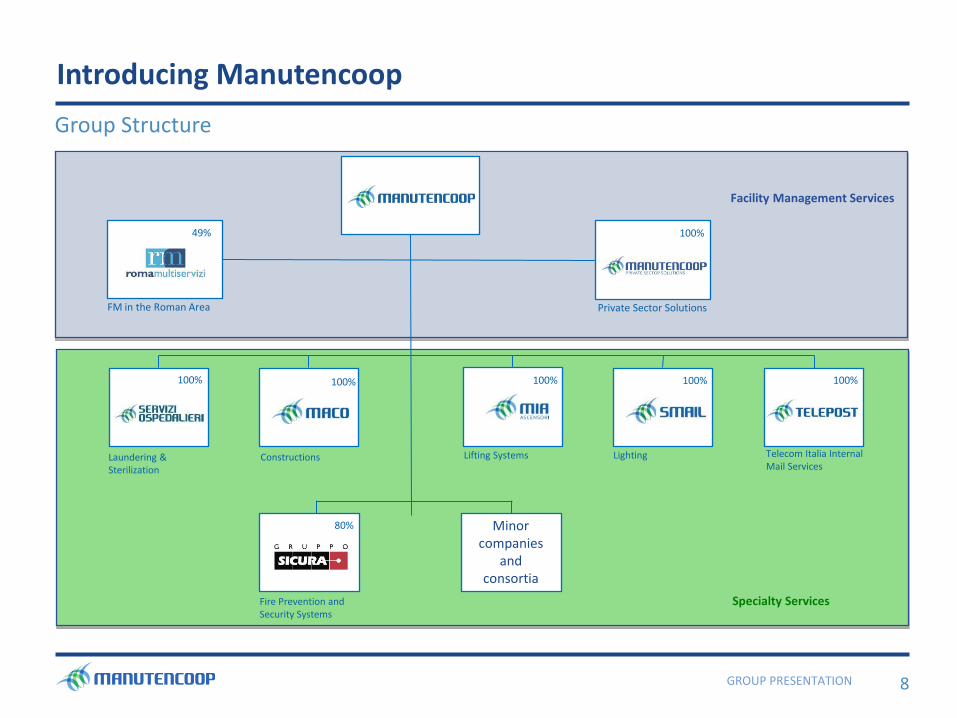
Facility Management Services
Specialty Services
Minor companies
and consortia
Laundering & Sterilization
Constructions Lifting Systems Lighting
Fire Prevention and Security Systems
FM in the Roman Area Private Sector Solutions
100% 49%
100% 100% 100% 100%
80%
Telecom Italia Internal Mail Services
100%
Group Structure
Introducing Manutencoop
GROUP PRESENTATION
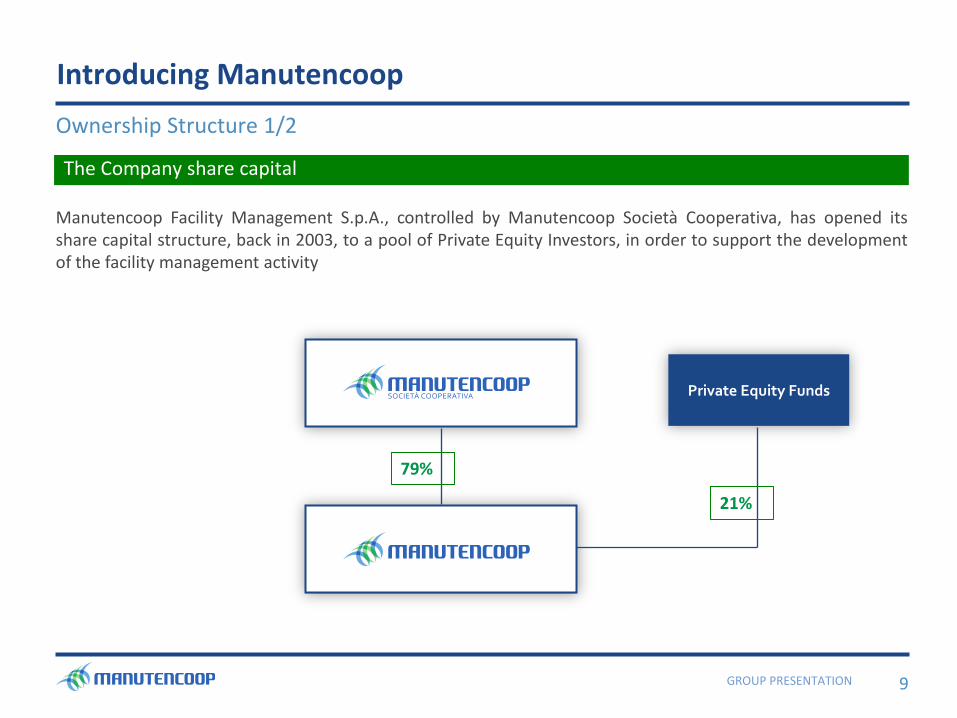
The Company share capital
Manutencoop Facility Management S.p.A., controlled by Manutencoop Società Cooperativa, has opened its share capital structure, back in 2003, to a pool of Private Equity Investors, in order to support the development of the facility management activity
Private Equity Funds
79%
21%
9
Introducing Manutencoop Ownership Structure 1/2
GROUP PRESENTATION
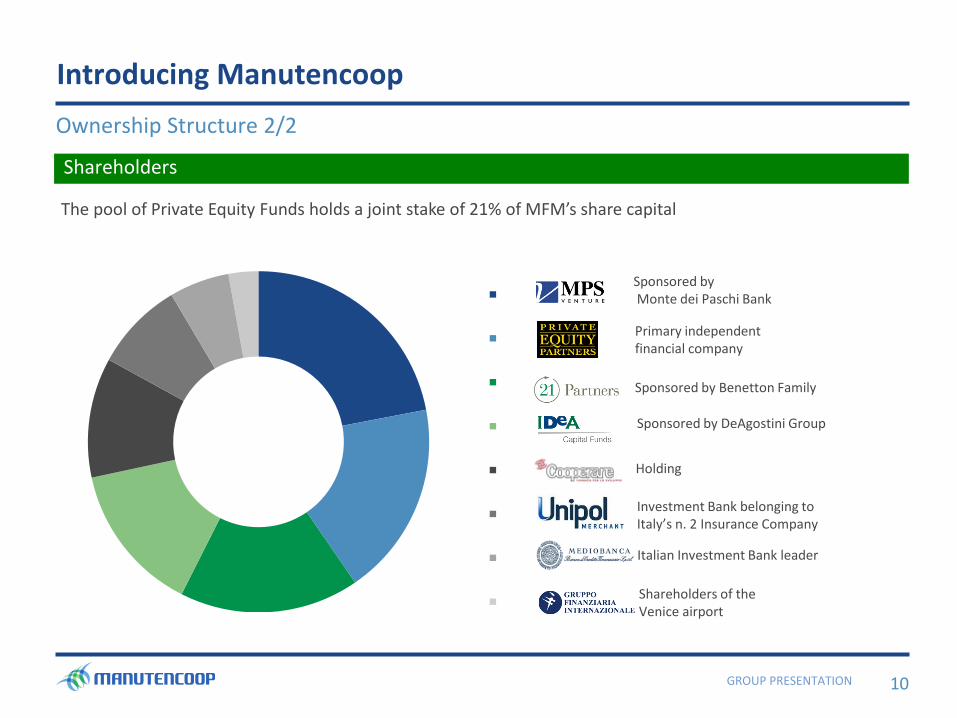
The pool of Private Equity Funds holds a joint stake of 21% of MFM’s share capital
10
Introducing Manutencoop
Shareholders
Ownership Structure 2/2
Sponsored by Monte dei Paschi Bank
Primary independent financial company
Sponsored by Benetton Family
Sponsored by DeAgostini Group
Italian Investment Bank leader
Shareholders of the Venice airport
Holding
Investment Bank belonging to Italy’s n. 2 Insurance Company
GROUP PRESENTATION
471
599 643
1.225 1.151 1.149
1.069 1.073
10,4% 12,7% 12,5%
9,6% 9,8% 9,9% 11,6% 10,7%
-30%
-26%
-22%
-18%
-14%
-10%
-6%
-2%
2%
6%
10%
14%
300
500
700
900
1.100
1.300
1.500
2005 2006 2007 2008 2009 2010 2011 2012
Ricavi Ebitda %
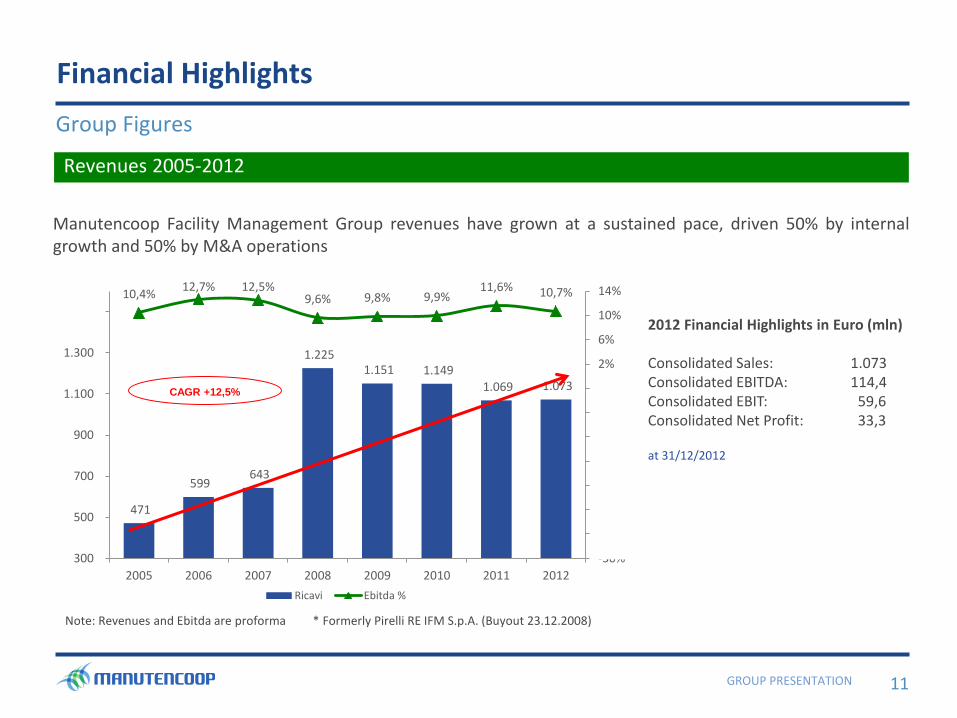
Manutencoop Facility Management Group revenues have grown at a sustained pace, driven 50% by internal growth and 50% by M&A operations
Note: Revenues and Ebitda are proforma * Formerly Pirelli RE IFM S.p.A. (Buyout 23.12.2008)
2012 Financial Highlights in Euro (mln) Consolidated Sales: 1.073 Consolidated EBITDA: 114,4 Consolidated EBIT: 59,6 Consolidated Net Profit: 33,3 at 31/12/2012
*
11
Financial Highlights
Group Figures
Revenues 2005-2012
CAGR +12,5%
GROUP PRESENTATION 12
Financial Highlights
Revenues 2012
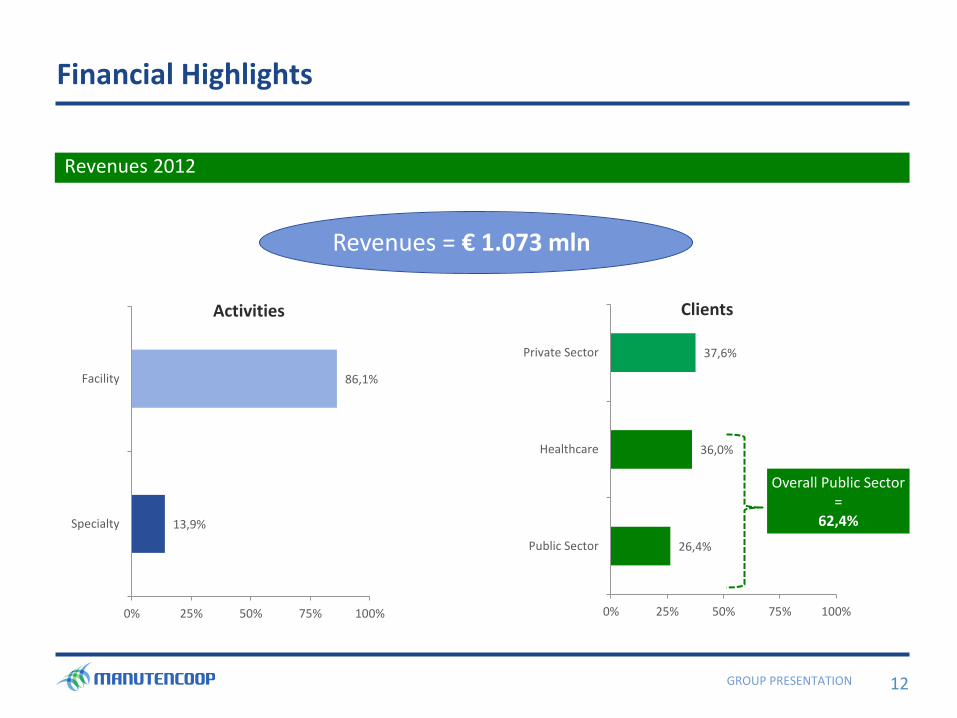
Revenues = € 1.073 mln
Overall Public Sector =
62,4%
Activities Clients
13,9%
86,1%
0% 25% 50% 75% 100%
Specialty
Facility
26,4%
36,0%
37,6%
0% 25% 50% 75% 100%
Public Sector
Healthcare
Private Sector
GROUP PRESENTATION
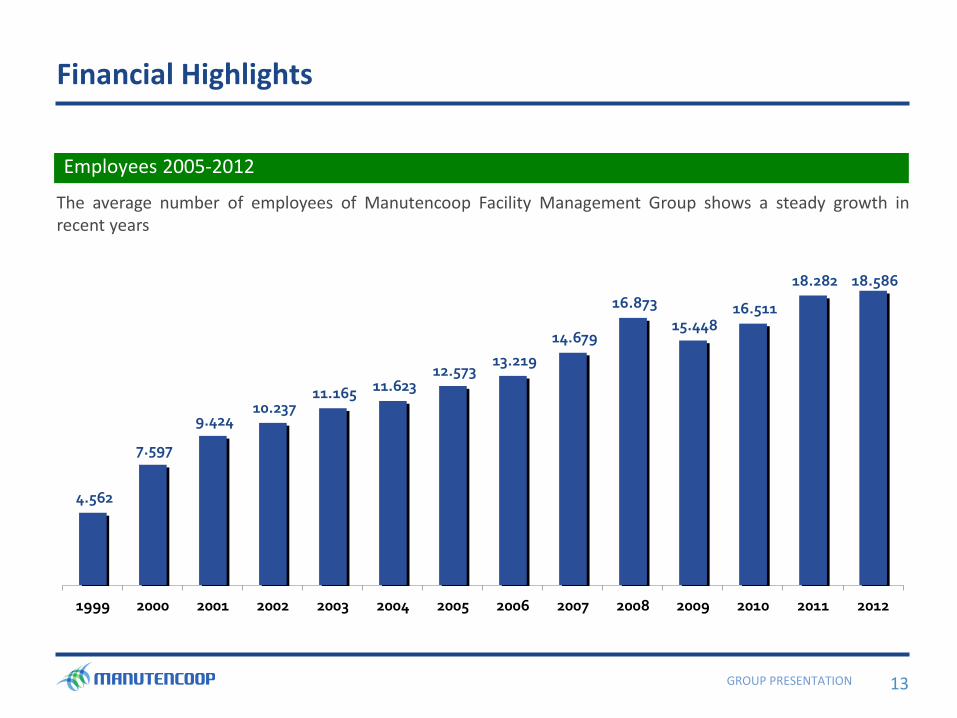
The average number of employees of Manutencoop Facility Management Group shows a steady growth in recent years
13
Financial Highlights
Employees 2005-2012
4.562
7.597
9.424 10.237
11.165 11.623 12.573
13.219
14.679
16.873
15.448 16.511
18.282 18.586
1999 2000 2001 2002 2003 2004 2005 2006 2007 2008 2009 2010 2011 2012
GROUP PRESENTATION 14
Financial Highlights
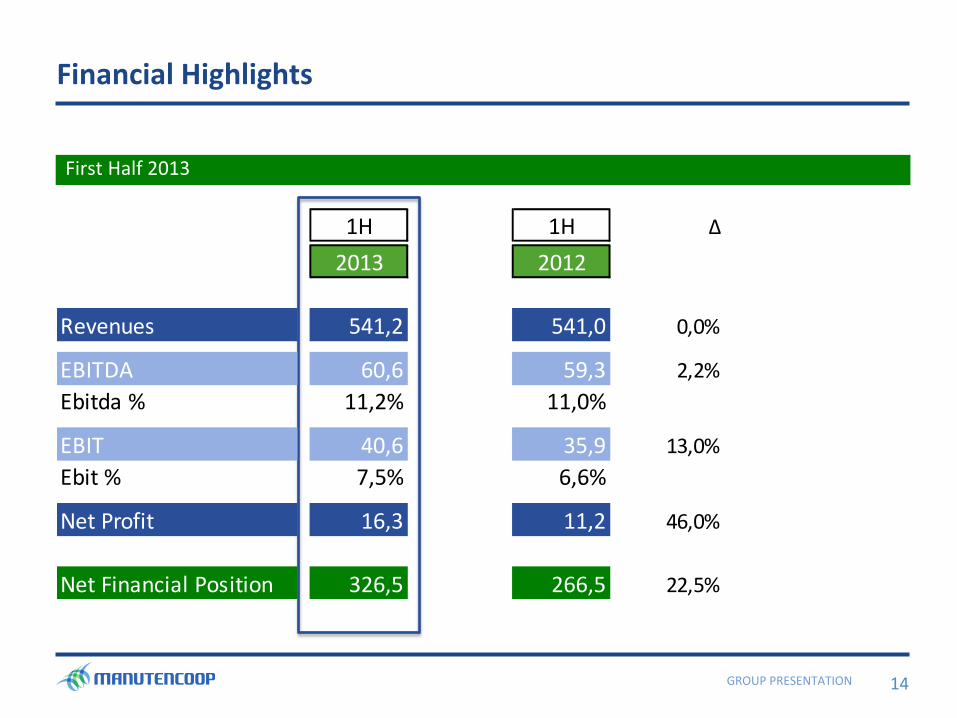
First Half 2013
1H 1H ∆
2013 2012
Revenues 541,2 541,0 0,0%
EBITDA 60,6 59,3 2,2%
Ebitda % 11,2% 11,0%
EBIT 40,6 35,9 13,0%
Ebit % 7,5% 6,6%
Net Profit 16,3 11,2 46,0%
Net Financial Position 326,5 266,5 22,5%