Group Management Report For The Three Months Ended...In the new “Forrester Wave” report for B2B...
17
Group Management Report For The Three Months Ended March 31, 2017
Transcript of Group Management Report For The Three Months Ended...In the new “Forrester Wave” report for B2B...

Group Management Report For The Three Months Ended
March 31, 2017

Group Management Report For The Three Months Ended
2
Content
CONTENT ....................................................................................................................................................... 2
LETTER TO OUR STOCKHOLDERS .......................................................................................................... 3
KEY FIGURES FOR THE GROUP ............................................................................................................... 4
GROUP MANAGEMENT REPORT ............................................................................................................ 5
Business performance during the first three months of 2017 ....................................... 5
Revenue Development ................................................................................................................ 6
Earnings Development ................................................................................................................. 6
Net Assets and Financial Position ............................................................................................. 7
Research and Development ....................................................................................................... 7
Employees ......................................................................................................................................... 7
Outlook .............................................................................................................................................. 8
CONSOLIDATED BALANCE SHEET......................................................................................................... 9
CONSOLIDATED STATEMENT OF COMPREHENSIVE INCOME .................................................. 10
CONSOLIDATED STATEMENT OF CASH FLOWS ............................................................................ 11
CONSOLIDATED STATEMENT OF SHAREHOLDERS´EQUITY ..................................................... 12
NOTES ON THE CONSOLIDATED FINANCIAL STATEMENTS AS OF MARCH 31, 2017 ...... 13
General disclosures ..................................................................................................................... 13
Accounting principles (Compliance statement) .............................................................. 13
Basis of consolidation ................................................................................................................ 13
Accounting policies .................................................................................................................... 13
Equity ............................................................................................................................................... 13
Segment Reporting .................................................................................................................... 14
Executive body member shares ............................................................................................. 15
INTERSHOP-SHARES ................................................................................................................................ 16
CONTACT .................................................................................................................................................... 17
March 31, 2017
3
Letter to Our Stockholders
Letter to Our Stockholders
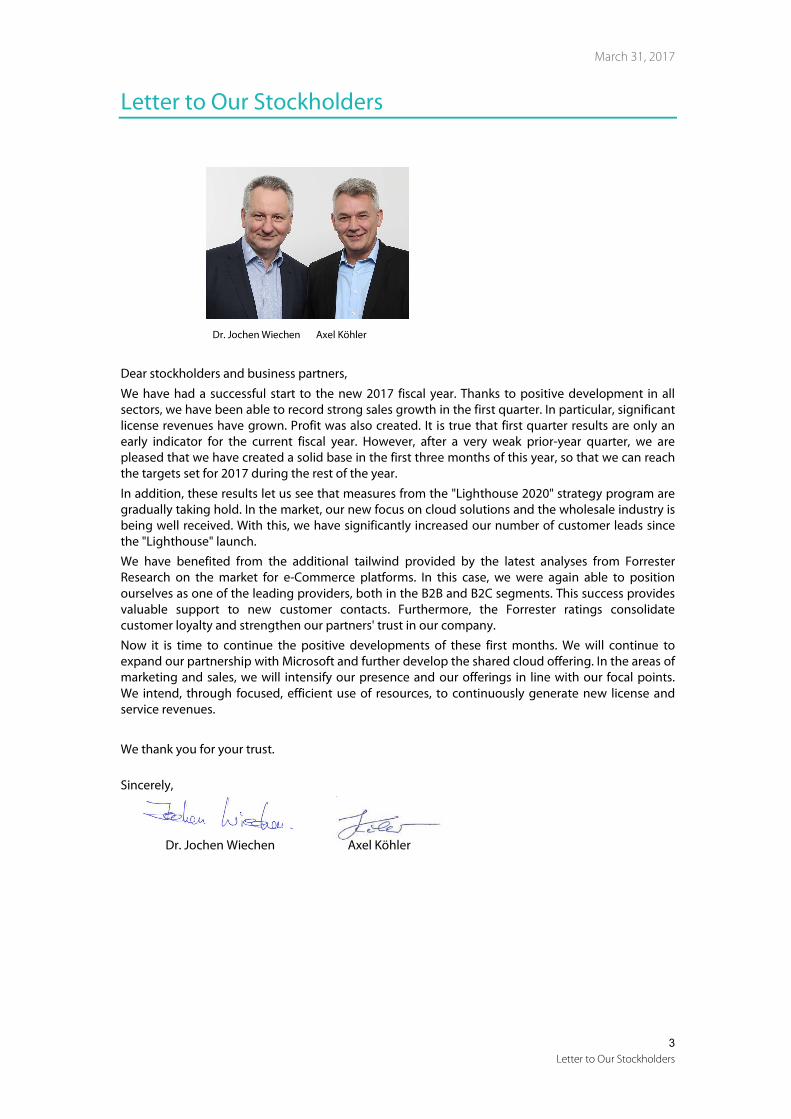
Dr. Jochen Wiechen Axel Köhler
Dear stockholders and business partners,
We have had a successful start to the new 2017 fiscal year. Thanks to positive development in all
sectors, we have been able to record strong sales growth in the first quarter. In particular, significant
license revenues have grown. Profit was also created. It is true that first quarter results are only an
early indicator for the current fiscal year. However, after a very weak prior-year quarter, we are
pleased that we have created a solid base in the first three months of this year, so that we can reach
the targets set for 2017 during the rest of the year.
In addition, these results let us see that measures from the "Lighthouse 2020" strategy program are
gradually taking hold. In the market, our new focus on cloud solutions and the wholesale industry is
being well received. With this, we have significantly increased our number of customer leads since
the "Lighthouse" launch.
We have benefited from the additional tailwind provided by the latest analyses from Forrester
Research on the market for e-Commerce platforms. In this case, we were again able to position
ourselves as one of the leading providers, both in the B2B and B2C segments. This success provides
valuable support to new customer contacts. Furthermore, the Forrester ratings consolidate
customer loyalty and strengthen our partners' trust in our company.
Now it is time to continue the positive developments of these first months. We will continue to
expand our partnership with Microsoft and further develop the shared cloud offering. In the areas of
marketing and sales, we will intensify our presence and our offerings in line with our focal points.
We intend, through focused, efficient use of resources, to continuously generate new license and
service revenues.
We thank you for your trust.
Sincerely,
Dr. Jochen Wiechen Axel Köhler

Group Management Report For The Three Months Ended
4
Key Figures for the Group
in EUR thousand Q1 2017 Q1 2016 Change
Revenue
Revenue 9,142 7,266 26%
Product Revenue 4,070 2,727 49%
Services Revenue 5,072 4,539 12%
Revenue Europe 6,993 5,265 33%
Revenue U.S.A. 904 692 31%
Revenue Asia/Pacific 1,245 1,309 -5 %
Earnings
Cost of revenues 4,689 4,087 15%
Gross profit 4,453 3,179 40%
Gross margin 49% 44%
Operating expenses, operating income 4,263 4,569 -7%
Research and development 1,308 1,670 -22%
Sales and marketing 2,102 1,811 16%
General and administrative 885 966 -8%
Other operating income (47) (40) 18%
Other operating expenses 15 162 -91%
EBIT 190 (1,390) 114%
EBIT Margin 2% -19%
EBITDA 793 (780) 202%
EBITDA Margin 9% -11%
Net result 95 (1,487) 106%
Earnings per share (EUR) 0.00 (0.05) 100%
Net Assets
Shareholders' equity 16,187 17,590 -8%
Equity ratio 58% 57%
Balance sheet total 28,101 30,918 -9%
Noncurrent assets 10,494 11,498 -9%
Current assets 17,607 19,420 -9%
Noncurrent liabilities 3,075 5,271 -42%
Current liabilities 8,839 8,057 10%
Financial Position
Cash and cash equivalents 13,114 14,158 -7%
Net cash operating activities 2,755 (856) 422%
Depreciation and amortization 603 610 -1%
Net cash used in investing activities (584) (196) -198%
Employees 331 381 -13%

March 31, 2017
5
Group Management Report
Group Management Report
Business performance during the first three months of 2017
The Intershop Group generated revenues of EUR 9.1 million (previous year: EUR 7.3 million) in
the first three months of 2017, and a positive operating result (EBIT) of EUR 0.2 million
(previous year: EUR -1.4 million). Compared to the same quarter of 2016, a significant increase
both in product and in service revenues was recorded. Overall, EUR 4.1 million (45%) of total
revenues were attributable to the product sector, and EUR 5.1 million (55%) to services.
Intershop once again confirms its standing as a leading provider of B2B and B2C
commerce solutions
Two studies published in March 2017 by the renowned IT analyst firm Forrester Research
have once again ranked Intershop as a leading provider of omni-channel commerce
solutions. In the new “Forrester Wave” report for B2B Commerce Suites, for example,
Intershop achieved second place for current overall offerings, and first place for solution
architecture. Overall, Intershop has been classed as one of three global “leaders” in the B2B
segment. Particular emphasis was placed on the “strong technical roadmap” and the “select
partner network.” In addition, “central commerce functionalities” were provided “at a
consistently high level.” This strong rating once again confirms the leading role of Intershop
in the market for B2B Commerce Suites and highlights the great opportunities associated
with the “Lighthouse” strategy and the concentration on customers from the wholesale
industry. The report also provides strong reasoning in terms of customer approach and is
therefore a promising catalyst for success in the new industry focus.
Intershop has also performed very well in the latest Forrester analysis for B2C Commerce
Suites. The company is ranked among the three best B2C providers with its current offerings
and has received first place for B2C solution architecture. The study argues that Intershop is a
“strong performer” based on its scalability and the high quality of its solutions portfolio,
which is “ideal for brand manufacturers that have complex requirements in the area of
channel support, need especially well-developed commerce functionalities, and are looking
for flexibility in overall pricing and licensing.” Intershop also provides a best-in-class solution
for the B2C market that offers companies all the capabilities (cloud, managed, enterprise) to
successfully operate in omni-channel commerce.
Continued focus on wholesale and expansion of the cloud offering
Intershop continued implementation of the “Lighthouse 2020” roadmap in the first quarter of
2017. This included the development and implementation of industry-specific marketing for
customers from the wholesale segment, which involved participation in target group-related
events, the creation of corresponding sales and marketing material, and enhanced reference
marketing with customers from the target market.
The expansion of the partnership with Microsoft has also continued. This includes technical
development of the joint cloud offering, so that all the solutions involved, including ERP,
marketing, CRM and OMS tools, are seamlessly combined and the interaction of the Intershop
Commerce Suite with Microsoft NAV on the Microsoft Azure cloud platform is perfected.
The addition of corresponding specialists to the business and technology partner landscape
is also linked to the new industry and cloud focus. For example, in the first quarter of 2017,
the partnership with MAC IT-Solutions GmbH was expanded. MAC is an IT solutions provider
for e-Commerce and multi-channel software. Intershop and MAC now offer an integrated
Microsoft Dynamics NAV and Commerce solution on Microsoft’s Azure cloud solution.
New customers in the first quarter included primarily medium-sized companies. In addition,
the long-standing Intershop customer Lechler GmbH decided to migrate to Intershop’s
current platform version. The continuation of long-term cooperation proves that Intershop
understands the challenges of the medium-sized business market and offers solutions
Group Management Report For The Three Months Ended
6
suitable for successful commerce strategies. One of Intershop’s customers is the global risk
management company SAI Global, which has digitized its product catalog as part of a
comprehensive digitization strategy. Based on Intershop's software-as-a-service (SaaS)
platform with managed service support, customers can now locate products through a web
content management system connected to the Intershop platform in order to call up product
data and make corresponding purchases.
Revenue Development
In the first quarter of 2017, the Intershop Group generated a significant increase in revenues
of 26% to EUR 9.1 million. In the weak first quarter of 2016, revenues of EUR 7.3 million were
generated. The good sales performance at the start of 2017 can be attributed to a positive
business trend in all of the Group’s sales sectors.
In the reporting period, strategically important product revenues in particular increased from
EUR 2.7 million to EUR 4.1 million, which was a growth of 49%. In the service sector, revenue
growth was 12%, from EUR 4.5 million to EUR 5.1 million. The share of product revenues in
total revenues increased from 38% to 45%.
In the product segment, Intershop increased revenues with licenses by 171%, from EUR 0.7
million in the previous year to EUR 2.0 million. An increase of 5% to EUR 2.1 million was
recorded for maintenance revenue, which is likewise included under product revenues.
Consulting and training revenues, as the most important sales group with a 38% share in
total revenue, rose slightly by 1% to EUR 3.5 million. Full service revenues increased by 46%
from EUR 1.1 million to EUR 1.6 million.
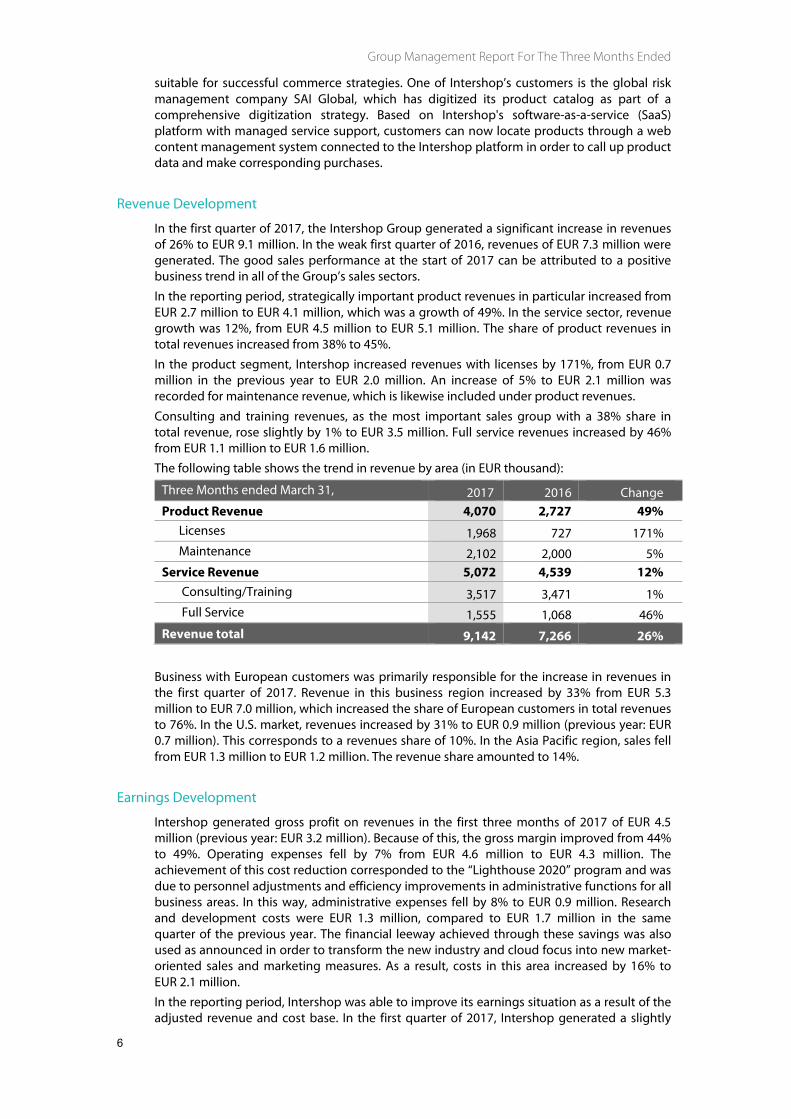
The following table shows the trend in revenue by area (in EUR thousand):
Three Months ended March 31, 2017 2016 Change
Product Revenue 4,070 2,727 49%
Licenses 1,968 727 171%
Maintenance 2,102 2,000 5%
Service Revenue 5,072 4,539 12%
Consulting/Training 3,517 3,471 1%
Full Service 1,555 1,068 46%
Revenue total 9,142 7,266 26%
Business with European customers was primarily responsible for the increase in revenues in
the first quarter of 2017. Revenue in this business region increased by 33% from EUR 5.3
million to EUR 7.0 million, which increased the share of European customers in total revenues
to 76%. In the U.S. market, revenues increased by 31% to EUR 0.9 million (previous year: EUR
0.7 million). This corresponds to a revenues share of 10%. In the Asia Pacific region, sales fell
from EUR 1.3 million to EUR 1.2 million. The revenue share amounted to 14%.
Earnings Development
Intershop generated gross profit on revenues in the first three months of 2017 of EUR 4.5
million (previous year: EUR 3.2 million). Because of this, the gross margin improved from 44%
to 49%. Operating expenses fell by 7% from EUR 4.6 million to EUR 4.3 million. The
achievement of this cost reduction corresponded to the “Lighthouse 2020” program and was
due to personnel adjustments and efficiency improvements in administrative functions for all
business areas. In this way, administrative expenses fell by 8% to EUR 0.9 million. Research
and development costs were EUR 1.3 million, compared to EUR 1.7 million in the same
quarter of the previous year. The financial leeway achieved through these savings was also
used as announced in order to transform the new industry and cloud focus into new market-
oriented sales and marketing measures. As a result, costs in this area increased by 16% to
EUR 2.1 million.
In the reporting period, Intershop was able to improve its earnings situation as a result of the
adjusted revenue and cost base. In the first quarter of 2017, Intershop generated a slightly
March 31, 2017
7
Group Management Report
positive operating result (EBIT) of EUR 0.2 million (previous year: EUR -1.4 million). This
corresponds to an EBIT margin of 2% (previous year: -19%). Earnings before deduction of
depreciation and amortization (EBITDA) that came to EUR -0.8 million in the first quarter of
2016 are now EUR 0.8 million. Depreciation and amortization came to EUR 0.6 million, as in
the previous period. The result for the period amounted to EUR 0.1 million (previous year:
EUR -1.5 million), resulting in quarterly earnings per share of EUR 0.00 (previous year:
EUR -0.05).
Net Assets and Financial Position
As of the interim reporting date, the total assets of the Intershop Group were EUR 28.1
million, which was 4% higher than on December 31, 2016. As for assets, trade receivables fell
from EUR 5.1 million to EUR 3.8 million as of the reporting date. Cash and cash equivalents
rose significantly from EUR 10.9 million to EUR 13.1 million. Therefore, the company has a
good financial foundation to push forward with flexibility in the current business while at the
same time implementing the “Lighthouse 2020” roadmap. For liabilities, current liabilities
increased by 11% to EUR 8.8 million. This is attributable to a rise in deferred revenue from
EUR 1.9 million to EUR 3.3 million. The equity ratio of the Intershop Group remained at a
comfortable level of 58% (December 31, 2016: 59%).
At EUR 2.8 million, the operating cash flow was clearly positive in the reporting period
(previous year: EUR -0.9 million). This is primarily due to the improved quarterly earnings and
the reduction in receivables. The cash outflow from investment activities was EUR 0.6 million
(previous year: EUR 0.2 million). Overall, cash and cash equivalents increased by EUR 2.2
million compared to the end of 2016.
Research and Development
Research and Development (R&D) activities focus on the ongoing development of the
Intershop Commerce Suite omni-commerce platform. In December 2016, Intershop released
its new version 7.8, which includes a further development of the content management
system and extended SEO functions for the orchestration of marketing campaigns. The new
version 7.8 has also created an extended cloud offering, which now provides the full
infrastructure of the Intershop commerce system on the Microsoft Azure cloud platform. This
enables Intershop to offer its customers a universal, industry-oriented cloud offering as a
scalable solution.
In addition to ongoing updates, the focus for fiscal year 2017 will be on the tight linking of
the cloud offering and its related systems. The goal is to perfect the interaction of all the
components of the new offering – the Intershop Commerce Suite, Intershop Order
Management, ERP and CRM solutions from Microsoft (Dynamics CRM and Dynamics NAV),
the Adobe Marketing Cloud and the business intelligence tool Power BI.
Employees
At the end of March 2017, Intershop had 331 full-time employees worldwide. Compared to
the previous year's reporting date, this represents a decrease of 50 employees. The number of
employees decreased by 24 full-time employees compared to year-end 2016. The reduction
is due in part to the implementation of the “Lighthouse 2020” strategy program adopted in
October 2016, which also involved personnel adjustments.
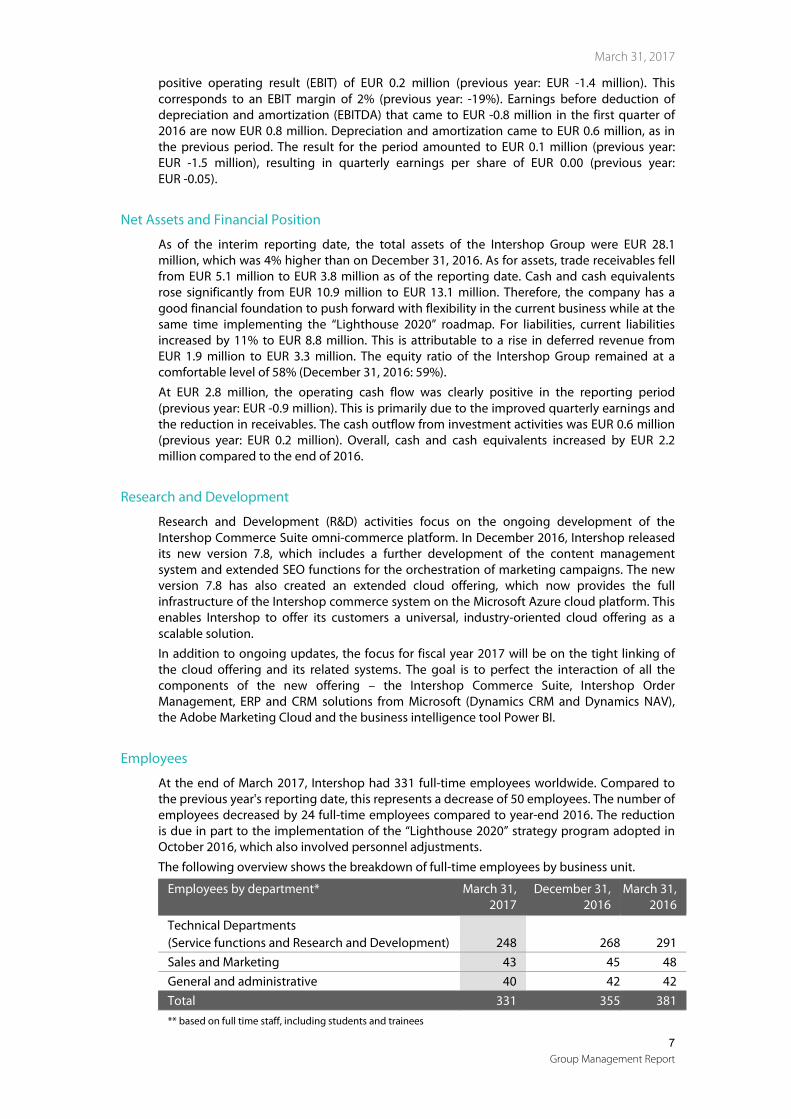
The following overview shows the breakdown of full-time employees by business unit.
Employees by department*
March 31,
2017
December 31,
2016
March 31,
2016
Technical Departments
(Service functions and Research and Development) 248 268 291
Sales and Marketing 43 45 48
General and administrative 40 42 42
Total 331 355 381
** based on full time staff, including students and trainees
Group Management Report For The Three Months Ended
8
As of the interim balance sheet date, 285 employees or 86% of the workforce worked in the
European branch offices. The proportion of employees working in the Asia-Pacific region was
9% (31 employees), while the figure in the US was 5% (15 employees).
Outlook
The digitization of the global economy offers considerable opportunities to the providers of
e-Commerce solutions in the coming years. The biggest potential is in the B2B segment, as
the transformation in this sector is often still at the beginning stages and also involves much
more complex processes than in the retail sector. Intershop offers the right solutions for
these challenges thanks to the Synaptic Commerce® approach, and therefore decided in
October 2016 to focus on this market, in particular for wholesale. Intershop is also expanding
its cloud solutions business. The new integrated cloud offering in partnership with Microsoft
now offers B2B and B2C companies an ideal option to quickly and cost-effectively drive
digitization within the organization and to migrate to a high-performance commerce
platform that seamlessly integrates into the systems of customers and participating partners.
Intershop’s excellent performance in both the B2B and B2C analyses by Forrester Research is
confirmation and a driving force behind the success of the new strategy program. Forrester’s
ratings consolidate customer loyalty and strengthen partner trust. In addition, Intershop will
use these results actively with new customer contacts during the current year.
The results of the first quarter are a solid basis for achieving the targets set for 2017
throughout the rest of the year. The positive revenue developments in all business segments,
achieving profit and the clearly positive cash flow show that the “Lighthouse” strategy
measures are gradually taking hold. Now it is time to convert the large number of new
customer leads into new license and service contracts through a focused, efficient use of
resources and intelligent marketing. Intershop's Management Board is confident that the
forecast for the whole of 2017 set out in the 2016 annual report will be met. Accordingly,
Intershop expects the Group to see slightly higher revenues. In addition, a slight increase in
the gross result and the gross margin is expected to result in a balanced operating result
(EBIT).

March 31, 2017
9
Consolidated Balance Sheet
Consolidated Balance Sheet
in EUR thousand March 31, 2017 December 31,
2016
ASSETS
Noncurrent assets
Intangible assets 8,807 8,806
Property, plant and equipment 547 567
Other noncurrent assets 68 52
Deferred tax assets 1,072 1,068
10,494 10,493
Current assets
Trade receivables 3,760 5,129
Other receivables and other assets 733 591
Cash and cash equivalents 13,114 10,898
17,607 16,618
TOTAL ASSETS 28,101 27,111
SHAREHOLDERS' EQUITY AND LIABILITIES
Shareholders' equity
Subscribed capital 31,683 31,683
Capital reserve 7,806 7,806
Other reserves (23,302) (23,434)
16,187 16,055
Noncurrent liabilities
Liabilities to banks 2,755 2,772
Deferred revenue 320 348
3,075 3,120
Current liabilities
Other current provisions 668 690
Liabilities to banks 1,000 1,000
Trade accounts payable 1,038 1,350
Income tax liabilities 53 71
Other current liabilities 2,802 2,911
Deferred revenue 3,278 1,914
8,839 7,936
TOTAL SHAREHOLDERS' EQUITY AND LIABILITIES 28,101 27,111
Group Management Report For The Three Months Ended
10
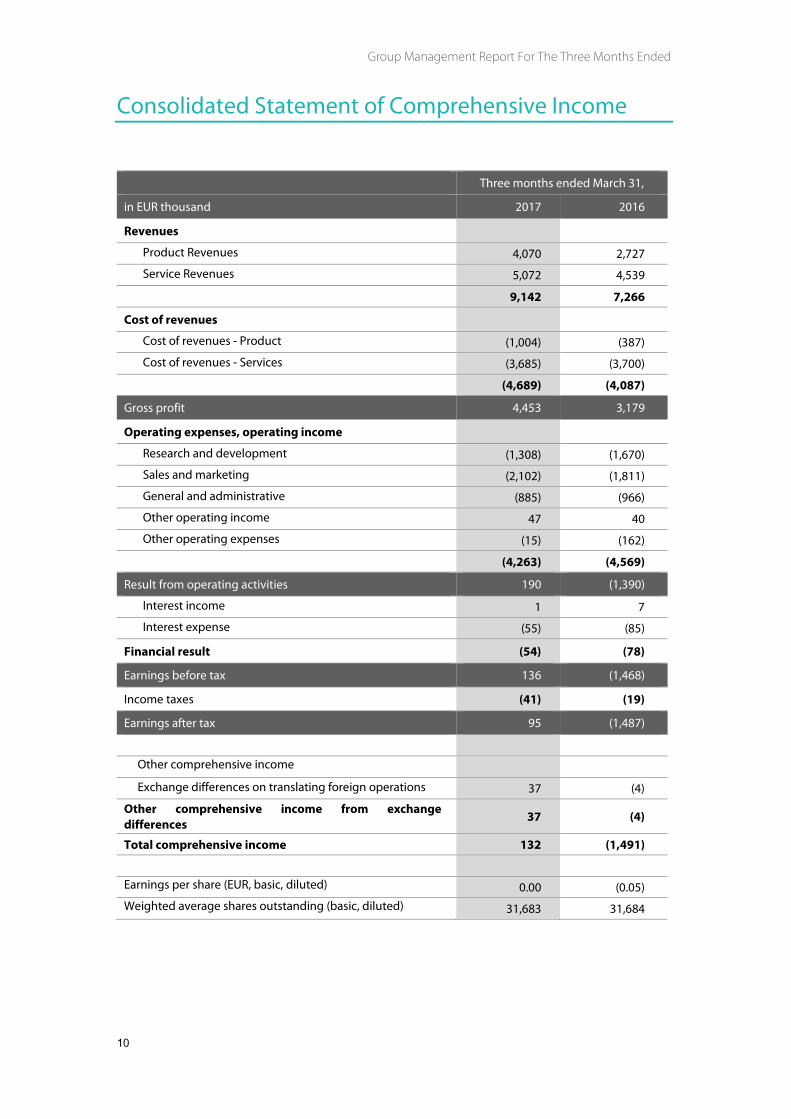
Consolidated Statement of Comprehensive Income
Three months ended March 31,
in EUR thousand 2017 2016
Revenues
Product Revenues 4,070 2,727
Service Revenues 5,072 4,539
9,142 7,266
Cost of revenues
Cost of revenues - Product (1,004) (387)
Cost of revenues - Services (3,685) (3,700)
(4,689) (4,087)
Gross profit 4,453 3,179
Operating expenses, operating income
Research and development (1,308) (1,670)
Sales and marketing (2,102) (1,811)
General and administrative (885) (966)
Other operating income 47 40
Other operating expenses (15) (162)
(4,263) (4,569)
Result from operating activities 190 (1,390)
Interest income 1 7
Interest expense (55) (85)
Financial result (54) (78)
Earnings before tax 136 (1,468)
Income taxes (41) (19)
Earnings after tax 95 (1,487)
Other comprehensive income
Exchange differences on translating foreign operations 37 (4)
Other comprehensive income from exchange
differences 37 (4)
Total comprehensive income 132 (1,491)
Earnings per share (EUR, basic, diluted) 0.00 (0.05)
Weighted average shares outstanding (basic, diluted) 31,683 31,684

March 31, 2017
11
Consolidated Statement of Cash Flows
Consolidated Statement of Cash Flows
Three months ended March 31,
in EUR thousand 2017 2016
CASH FLOWS FROM OPERATING ACTIVITIES
Earnings before tax 136 (1,468)
Adjustments to reconcile net profit/loss to cash used in operating
activities
Financial result 54 78
Depreciation and amortization 603 610
Other noncash expenses and income 0 12
Changes in operating assets and liabilities
Accounts receivable 1,389 744
Other assets (162) (217)
Liabilities and provisions (463) (986)
Deferred revenue 1,326 608
Net cash provided by operating activities
before income tax and interest
2,883 (619)
Interest received 1 7
Interest paid (73) (115)
Income taxes received 4 0
Income taxes paid (60) (129)
Net cash (used in) operating activities 2,755 (856)
CASH FLOWS FROM INVESTING ACTIVITIES
Restricted cash 0 375
Payments for investments in intangible assets (543) (514)
Proceeds on disposal of equipment 0 1
Purchases of property and equipment (41) (58)
Net cash used in investing activities (584) (196)
CASH FLOWS FROM FINANCING ACTIVITIES
Net cash provided by/used in financing activities 0 0
Effect of change in exchange rates 45 (22)
Net change in cash and cash equivalents 2,216 (1,074)
Cash and cash equivalents, beginning of period 10,898 15,232
Cash and cash equivalents, end of period 13,114 14,158

Group Management Report For The Three Months Ended
12
Consolidated Statement of Shareholders´Equity
in EUR thousand Other reserves
Common shares
(Number shares)
Subscribed
capital
Capital
reserve
Conversion
reserve
Cumulative
profit/ loss
Cumulative currency
differences
Subscribed capital
Balance, January 1, 2017 31,683,484 31,683 7,806 (93) (25,421) 2,080 16,055
Total comprehensive income 95 37 132
Balance, March 31, 2017 31,683,484 31,683 7,806 (93) (25,326) 2,117 16,187
Balance, January 1, 2016 31,683,484 31,683 7,806 (93) (22,433) 2,118 19,081
Total comprehensive income (1,487) (4) (1,491)
Balance, March 31, 2016 31,683,484 31,683 7,806 (93) (23,920) 2,114 17,590
March 31, 2017
13
Notes on the Consolidated Financial Statements as of March 31, 2017
Notes on the Consolidated Financial Statements as of
March 31, 2017
General disclosures
This interim report as of March 31, 2017 is unaudited and must be read in conjunction with
the consolidated financial statements and the associated notes to the consolidated financial
statements for fiscal year 2016. The consolidated financial statements and the notes to the
consolidated financial statements are contained in the Company's Annual Report for the fiscal
year ended December 31, 2016. The 2016 Annual Report is available on the Company’s web
site at http://www.intershop.com/investors-financial-reports.
Accounting principles (Compliance statement)
The interim consolidated financial statements of INTERSHOP Communications AG were
prepared in accordance with the International Financial Reporting Standards (IFRSs) valid at
the balance sheet date, which include standard (IFRS, IAS) adopted by IASB, and the
Interpretations (IFRIC, SIC) issued by the International Financial Reporting Interpretations
Committee (IFRS IC), as adopted by the EU. The interim consolidated financial statements
have been prepared in euros. Unless stated otherwise, all amounts are given as thousands of
euros (EUR thousand). Figures are rounded to the nearest thousand and totals may not sum
due to rounding.
Basis of consolidation
The scope of consolidation of the entities of INTERSHOP Communications AG includes, as of
March 31, 2017, in addition to the parent company, the subsidiaries Intershop
Communications, Inc., Intershop Communications Australia Pty Ltd, Intershop
Communications Asia Limited, The Bakery GmbH, Intershop Communications Ventures
GmbH, Intershop Communications SARL as well as Intershop Communications LTD.
Accounting policies
The same accounting policies were used to prepare this interim report as for the consolidated
financial statements for fiscal year 2016. The policies used are described in detail on pages 48
to 53 of the 2016 Annual Report.
Equity
The change in equity of INTERSHOP Communications AG is shown in the consolidated
statement of changes in equity. As of March 31, 2017, subscribed capital was unchanged at
EUR 31,683,484 and is divided into 31,683,484 non-par value bearer shares.
Group Management Report For The Three Months Ended
14
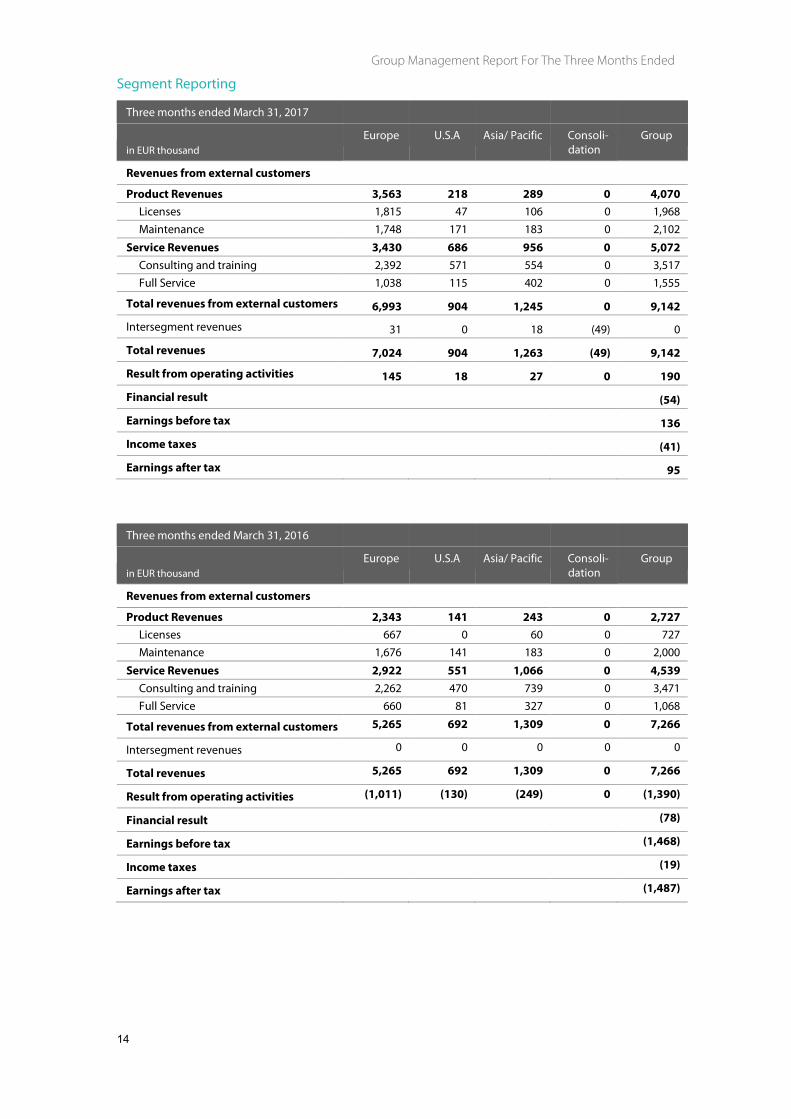
Segment Reporting
Three months ended March 31, 2017
in EUR thousand
Europe U.S.A Asia/ Pacific Consoli-
dation
Group
Revenues from external customers
Product Revenues 3,563 218 289 0 4,070
Licenses 1,815 47 106 0 1,968
Maintenance 1,748 171 183 0 2,102
Service Revenues 3,430 686 956 0 5,072
Consulting and training 2,392 571 554 0 3,517
Full Service 1,038 115 402 0 1,555
Total revenues from external customers 6,993 904 1,245 0 9,142
Intersegment revenues 31 0 18 (49) 0
Total revenues 7,024 904 1,263 (49) 9,142
Result from operating activities 145 18 27 0 190
Financial result (54)
Earnings before tax 136
Income taxes (41)
Earnings after tax 95
Three months ended March 31, 2016
in EUR thousand
Europe U.S.A Asia/ Pacific Consoli-
dation
Group
Revenues from external customers
Product Revenues 2,343 141 243 0 2,727
Licenses 667 0 60 0 727
Maintenance 1,676 141 183 0 2,000
Service Revenues 2,922 551 1,066 0 4,539
Consulting and training 2,262 470 739 0 3,471
Full Service 660 81 327 0 1,068
Total revenues from external customers 5,265 692 1,309 0 7,266
Intersegment revenues 0 0 0 0 0
Total revenues 5,265 692 1,309 0 7,266
Result from operating activities (1,011) (130) (249) 0 (1,390)
Financial result (78)
Earnings before tax (1,468)
Income taxes (19)
Earnings after tax (1,487)

March 31, 2017
15
Notes on the Consolidated Financial Statements as of March 31, 2017
Executive body member shares
As of March 31, 2017, the company’s executive body members held the following number of
Intershop ordinary bearer shares:
Name Function Shares
Christian Oecking Chairman of the Supervisory Board 20,000
Ulrich Prädel Vice Chairman of the Supervisory Board 8,000
Prof. Dr. Louis Velthuis Member of the Supervisory Board 5,000
Dr. Jochen Wiechen CEO of the Board of Management 60,000
Axel Köhler Member of the Board of Management 6,500
In the first three months of fiscal year 2017, the members of the company's executive bodies
made the following purchases of Intershop ordinary bearer shares:
Name Date Type of
transaction Amount Total value (EUR)
Christian Oecking 02/06/2017 Purchase 10,000 11,700
Ulrich Prädel 02/01/2017 Purchase 8,000 9,288

Group Management Report For The Three Months Ended
16
Intershop-Shares
Stock Market Data on Intershop Shares
ISIN DE000A0EPUH1
WKN A0EPUH
Stock market symbol ISH2
Admission segment Prime standard/Regulated market
Sector Software
Membership of Deutsche Börse indices CDAX, Prime All Share, Technology All Share
Key figures for Intershop shares Q1 2017 2016 Q1 2016
Closing price1 in EUR 1.13 1.10 1.35
Number of shares
outstanding (end of period)
in million
shares 31.68 31.68 31.68
Market capitalization in EUR million 35.80 34.85 42.77
Earnings per share in EUR 0.00 (0.09) (0.05)
Cashflow per share in EUR 0.09 (0.03) (0.03)
Carrying amount per share in EUR 0.51 0.51 0.56
Average trading volume per
day2 Number 29,390 39,139 41,282
Free float in % 66 66 66
1 Basis: Xetra
2 Basis: all stock exchanges

March 31, 2017
17
Contact
Contact
Investor Relations Contact
INTERSHOP Communications AG
Intershop Tower
07740 Jena, Germany
Phone +49 3641 50 1000
Fax +49 3641 50 1309
E-mail [email protected]
www.intershop.com
This interim report contains forward-looking statements regarding
future events or the future financial and operational performance of
Intershop, actual events or results may differ materially from the results
presented in these forward-looking statements or from the results
expected according to these statements, risks and uncertainties that
could lead to such differences include Intershop's limited operating
history, the limited predictability of revenues and expenses, and
potential fluctuations in revenues and operating results, significant
dependence on large individual customer orders, customer trends, the
level of competition, seasonal fluctuations, risks relating to electronic
security, possible state regulation, and the general economic situation.