Group (G16) – PGSEM 2012: Harikumar Narayanan (12120xx) Sheia Anandaraj (1212052) Snehal Uphale...
23
Group (G16) – PGSEM 2012: Harikumar Narayanan (12120xx) Sheia Anandaraj (1212052) Snehal Uphale (1212054) Sooraj Raveendran (1212055) Sowmya Menon (1212056) Vishwas hai Is mein kuch khaas hai!
-
Upload
ashley-mcgee -
Category
Documents
-
view
220 -
download
0
Transcript of Group (G16) – PGSEM 2012: Harikumar Narayanan (12120xx) Sheia Anandaraj (1212052) Snehal Uphale...

Group (G16) – PGSEM 2012:
Harikumar Narayanan (12120xx)
Sheia Anandaraj (1212052)
Snehal Uphale (1212054)
Sooraj Raveendran (1212055)
Sowmya Menon (1212056)Vishwas hai Is mein kuch khaas hai!
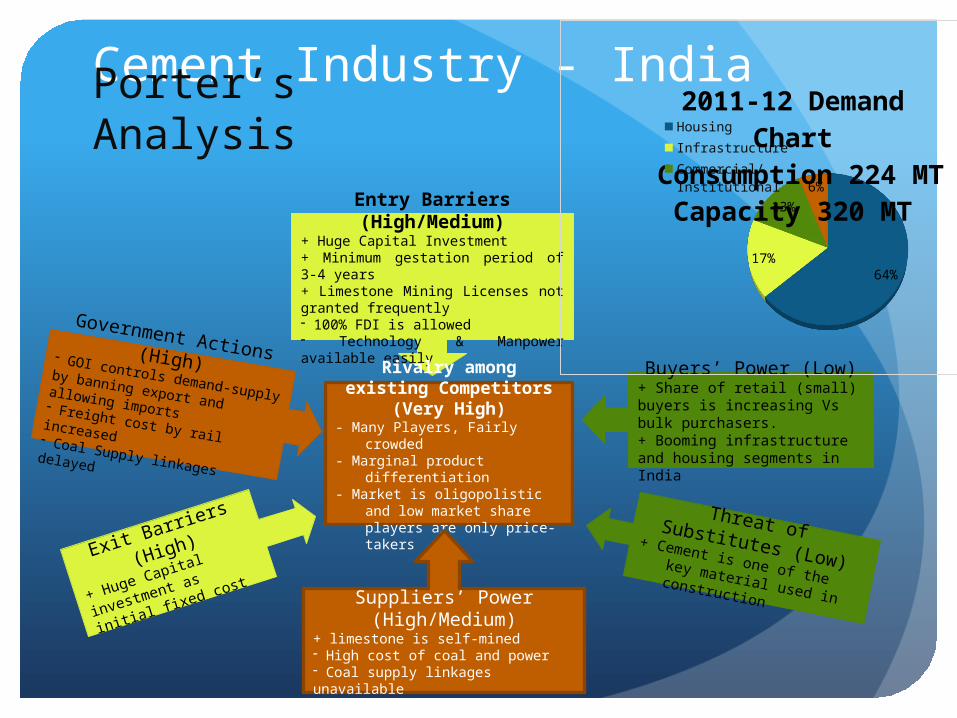
Cement Industry - India
Entry Barriers (High/Medium)
+ Huge Capital Investment+ Minimum gestation period of 3-4 years+ Limestone Mining Licenses not granted frequently- 100% FDI is allowed- Technology & Manpower available easily
Rivalry among existing Competitors (Very
High)- Many Players, Fairly crowded- Marginal product
differentiation- Market is oligopolistic and low
market share players are only price-takers
Suppliers’ Power (High/Medium)
+ limestone is self-mined- High cost of coal and power- Coal supply linkages unavailable
Government Actions (High)- GOI controls demand-supply by
banning export and allowing imports- Freight cost by rail increased
- Coal Supply linkages delayed
Buyers’ Power (Low)+ Share of retail (small) buyers is increasing Vs bulk purchasers.+ Booming infrastructure and housing segments in India
Exit Barriers (High)
+ Huge Capital
investment as initial
fixed cost
Threat of Substitutes (Low)+ Cement is one of the key material used in construction
64%17%
13%
6%
2011-12 Demand Chart
Consumption 224 MT
Capacity 320 MT
Housing
Infrastructure
Commercial/Institutional
Industrial
Porter’s Analysis
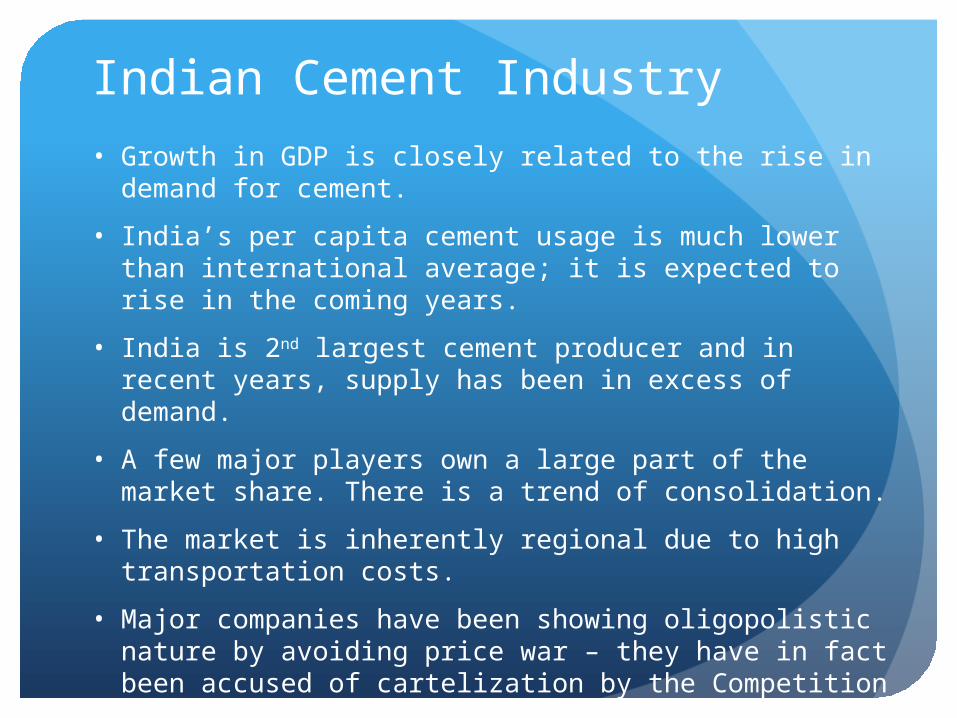
Indian Cement Industry
• Growth in GDP is closely related to the rise in demand for cement.
• India’s per capita cement usage is much lower than international average; it is expected to rise in the coming years.
• India is 2nd largest cement producer and in recent years, supply has been in excess of demand.
• A few major players own a large part of the market share. There is a trend of consolidation.
• The market is inherently regional due to high transportation costs.
• Major companies have been showing oligopolistic nature by avoiding price war – they have in fact been accused of cartelization by the Competition Commission of India.
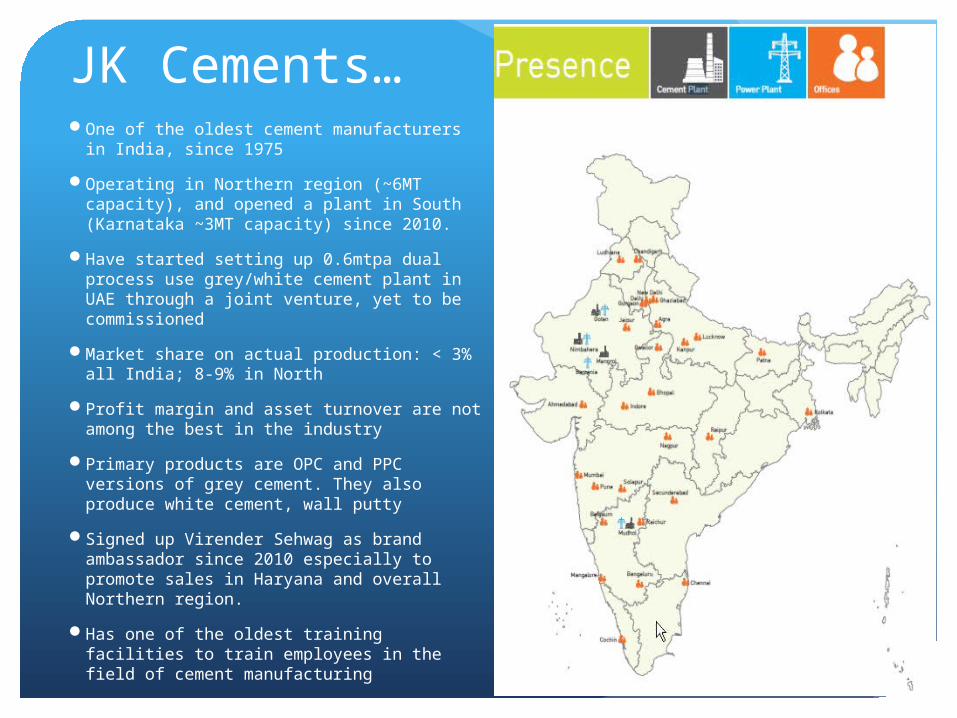
JK Cements… One of the oldest cement manufacturers in
India, since 1975
Operating in Northern region (~6MT capacity), and opened a plant in South (Karnataka ~3MT capacity) since 2010.
Have started setting up 0.6mtpa dual process use grey/white cement plant in UAE through a joint venture, yet to be commissioned
Market share on actual production: < 3% all India; 8-9% in North
Profit margin and asset turnover are not among the best in the industry
Primary products are OPC and PPC versions of grey cement. They also produce white cement, wall putty
Signed up Virender Sehwag as brand ambassador since 2010 especially to promote sales in Haryana and overall Northern region.
Has one of the oldest training facilities to train employees in the field of cement manufacturing
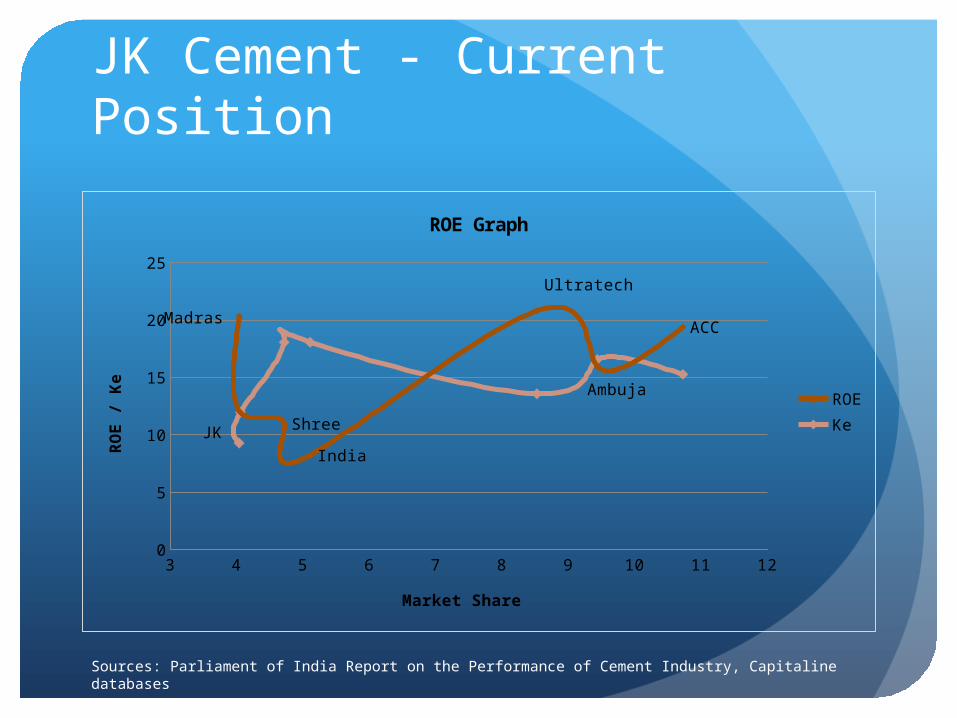
JK Cement - Current Position
Sources: Parliament of India Report on the Performance of Cement Industry, Capitaline databases
3 4 5 6 7 8 9 10 11 120
5
10
15
20
25
ACC
Ambuja
Ultratech
India
ShreeJK
Madras
ROE Graph
ROEKe
Market Share
RO
E /
Ke
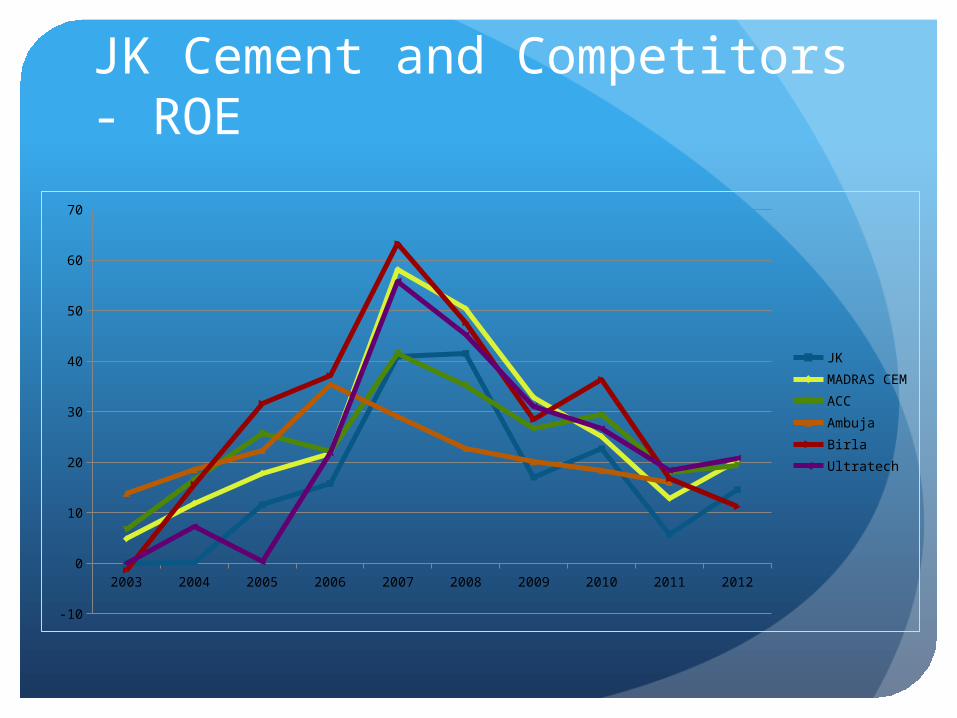
JK Cement and Competitors - ROE
2003 2004 2005 2006 2007 2008 2009 2010 2011 2012
-10
0
10
20
30
40
50
60
70
JKMADRAS CEMACCAmbujaBirlaUltratech
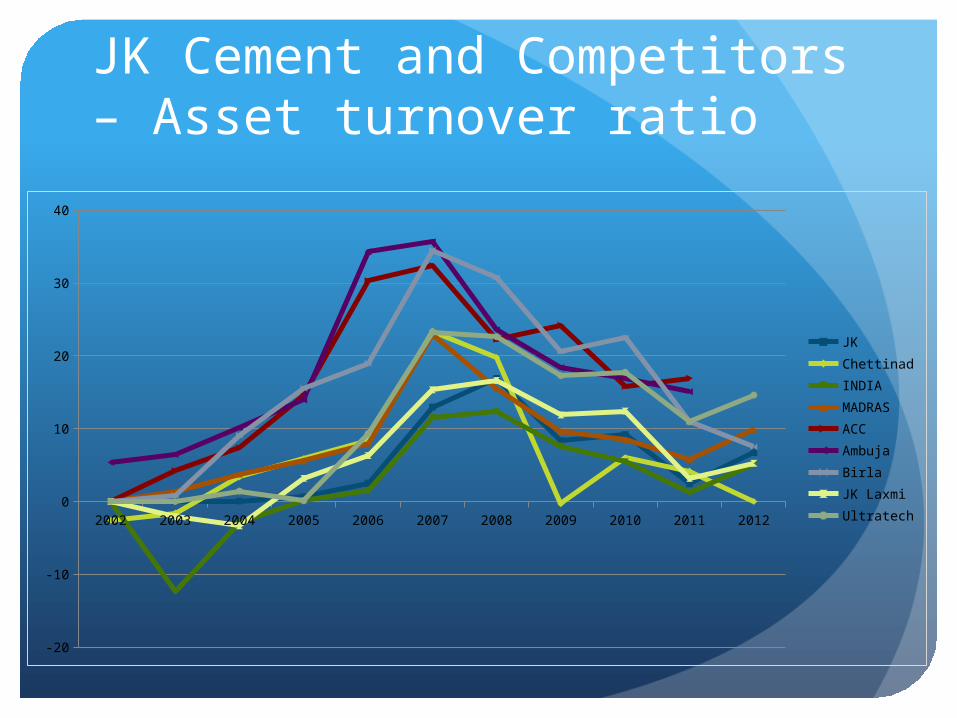
JK Cement and Competitors – Asset turnover ratio
2002 2003 2004 2005 2006 2007 2008 2009 2010 2011 2012
-20
-10
0
10
20
30
40
JKChettinadINDIAMADRASACCAmbujaBirlaJK LaxmiUltratech
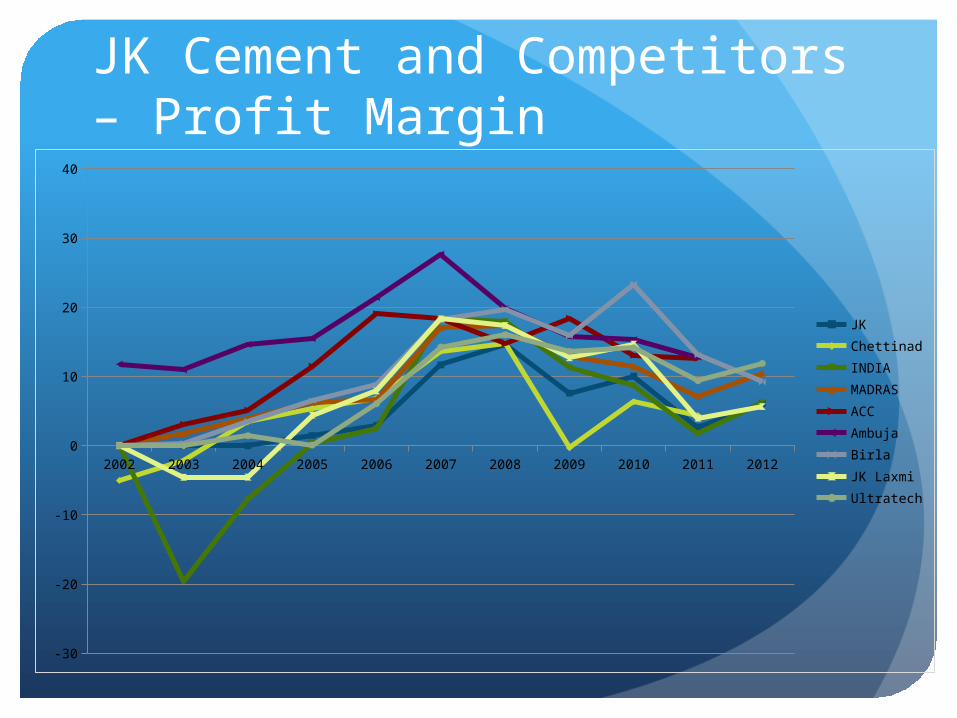
JK Cement and Competitors – Profit Margin
2002 2003 2004 2005 2006 2007 2008 2009 2010 2011 2012
-30
-20
-10
0
10
20
30
40
JKChettinadINDIAMADRASACCAmbujaBirlaJK LaxmiUltratech

Problem Statement Though JK Cements has continued to be profitable, its profitability
has been going down vis-à-vis its competitors and the industry.
With its competitors increasing capacity through organic and inorganic methods in multiple regions, its profile has changed from medium to low market share. Rapid consolidation and entry of global players is only worsening the market share of JK Cements
The Indian cement industry is also in a low growth phase mainly owing to slowdown in construction activities, delay in infrastructure projects and overall downturn of the economy.
Risks and Concerns for Future Strategies:o Increase in Production Costs
o Rise in costs of raw materials, power and freight costso Unavailability of Coal Linkageso Adverse demand-supply mismatch
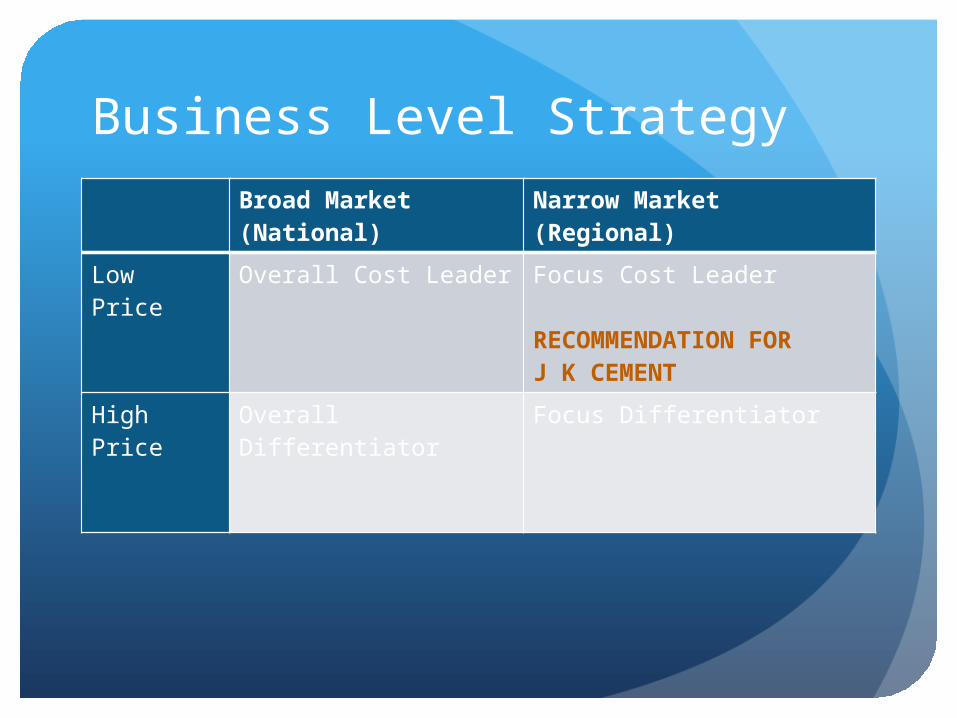
Business Level StrategyBroad Market (National)
Narrow Market (Regional)
Low Price Overall Cost Leader Focus Cost Leader
RECOMMENDATION FOR J K CEMENT
High Price Overall Differentiator Focus Differentiator

Key RecommendationsFOCUS COST LEADERImprove profit margins to be on par with competition
by reducing costs
Increase market share in existing products (OPC, PPC, White Cement and wall putty) and existing markets/regions [plan for marketing expenditure TBD]
Improve product portfolio [Specifics and plan TBD]
Augment Employee Compensation via newer initiatives
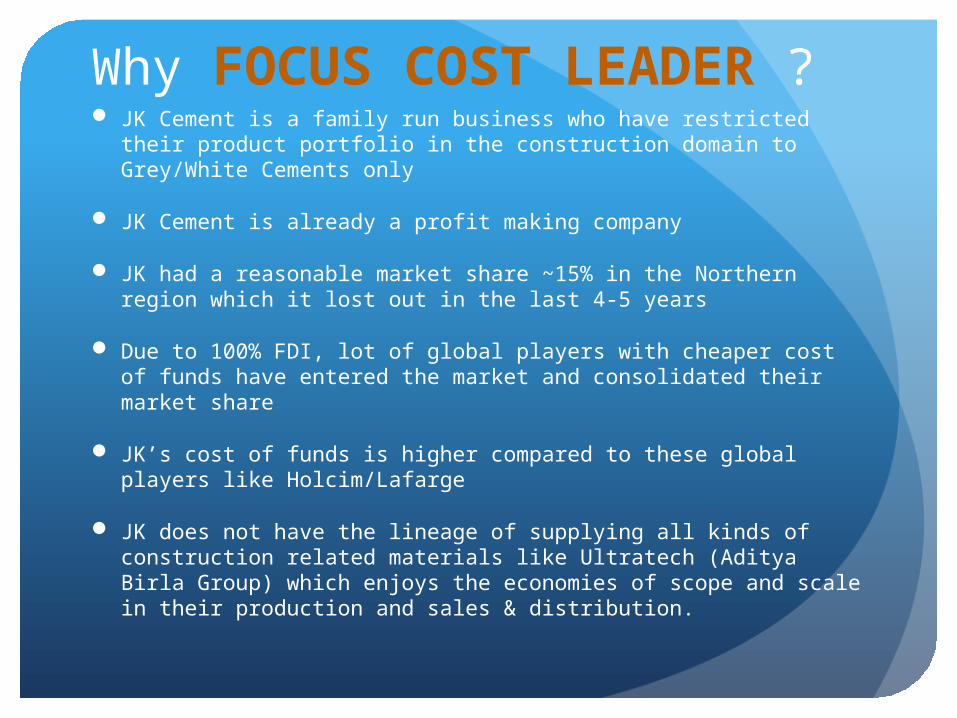
Why FOCUS COST LEADER ? JK Cement is a family run business who have restricted their product
portfolio in the construction domain to Grey/White Cements only
JK Cement is already a profit making company
JK had a reasonable market share ~15% in the Northern region which it lost out in the last 4-5 years
Due to 100% FDI, lot of global players with cheaper cost of funds have entered the market and consolidated their market share
JK’s cost of funds is higher compared to these global players like Holcim/Lafarge
JK does not have the lineage of supplying all kinds of construction related materials like Ultratech (Aditya Birla Group) which enjoys the economies of scope and scale in their production and sales & distribution.

Alternatives consideredOverall Cost Leader
Present capacity is 9 MT. If production capacity is targeted to 20 MT in the next 3 years: They would need to raise huge debt which affects their profitability. Cost of setting up a
greenfield plant is roughly 400 crores/MT today. Competitors with bigger balance sheets can easily raise their capacities during the same
gestation period resulting in no real advantage. Market is demand is already not high enough for 100% utilization of existing capacity Access to raw materials and coal is not guaranteed. Mining Licenses are issued by GOI in a
very slow and delayed manner. Presently there is a total freeze in issue of licenses.
Huge amount of Marketing, Distribution and Advertizing expenses will have to be incurred along with possible price wars with existing high market share competitors.
Differentiation
Since the cement is a commodity, there is not much scope of differentiation.
It is difficult to charge premium prices as prices are standardized, and low market share players are only price-takers
Differentiation comes at its own high cost in terms of advertising and distribution, for which J K cement has limitations.
Economies of Scope: JK can enter the growing Gypsum-based construction products market as the raw materials and production process is very similar to Cement, but it would involve the risk of failure as they do not enjoy nation-wide presence in all urban / metro markets where there is demand.
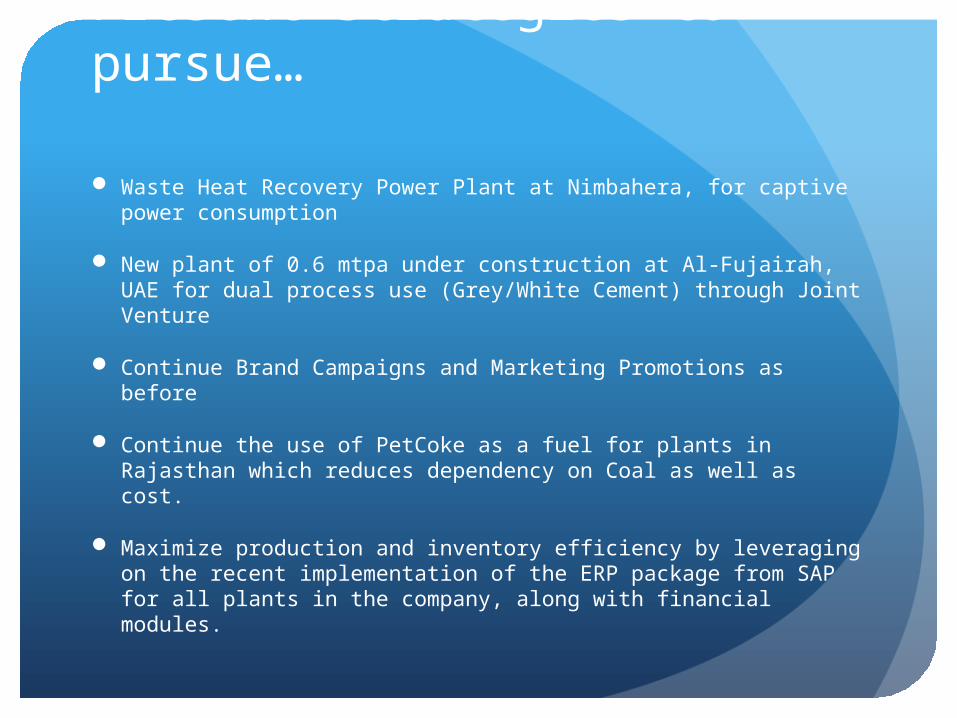
Present Strategies to pursue…
Waste Heat Recovery Power Plant at Nimbahera, for captive power consumption
New plant of 0.6 mtpa under construction at Al-Fujairah, UAE for dual process use (Grey/White Cement) through Joint Venture
Continue Brand Campaigns and Marketing Promotions as before
Continue the use of PetCoke as a fuel for plants in Rajasthan which reduces dependency on Coal as well as cost.
Maximize production and inventory efficiency by leveraging on the recent implementation of the ERP package from SAP for all plants in the company, along with financial modules.
Present Strategies to reconsider or drop…Expanding capacity in Mangrol Plant (Rajasthan)
by another 2.5 – 3.5 mtpa

Implementation Plan Improve profit margins to be on par with competition by reducing costs
Look at alternative fuels which is cheaper and more easily available than coal and power. For example, use of waste fuel, ignite, pet coke, rice husk, groundnut shells, etc.
Install more captive power onsite to reduce dependency on the power from state electricity boards.
Reduce transportation costs by using water transport and railways as much as possible
Coal Washeries to be implemented at the mine to reduce the impurity in the form of ash content
Employ better technology Implement better environment-friendly technology and practices to earn carbon
credits Production of blended cement – reduces plant capacity directly without any need for
creating additional clinker making capacity, reduces limestone usage and fuel usage Use e-commerce for better order processing Recruit expert staff for identifying the best raw material and handling it using the
best processes. Look at alternative fuels which is cheaper and more easily available than coal and
power. For example, use of waste fuel, ignite, pet coke, rice husk, groundnut shells, etc

Implementation Plan Improve profit margins to be on par with competition by reducing costs (contd)
Improve Logistics of Production and Distribution in Grey Cement, for future expansions.
Locate Clinker manufacturing plants closer to (suppliers) mines and, where availability of Coal/fuel oils is easier and guaranteed by long term contracts
Locate Cement Mills using the following criteria Closer to the (buyers) demand regions in a
distributed manner across key zones Where transportation by Rail is feasible in less
than 7-10 days as clinker manufactured using the present technology has to be grinded within 24 days of manufacture
Build and Own / Lease railway loading/unloading docks. Use the ‘Own Your Wagon’ scheme of Railways which will allow for customization of containers with lower freight charges for transporting the Clinker in a clean and safe manner without impact from weather
Use Imported technology (German: AUMUND) for efficient handling of transportation of clinkers from Clinker plant and to Cement Mill
The Same Rail lines can be used instead of Road for transporting Cement from the mill to warehouses/distributors which are more than 100 kms away to save on freight costs by trucks
Implementation Plan Increase market share in existing products (OPC, PPC, White Cement and wall putty) and markets/regions [plan for marketing expenditure TBD]Focus on increasing capacity and production in existing
products like white cement, wall putty where JK is already a Cost Leader.
Focus on certain regions: Since the cement plants can serve only a limited area due to limited shelf life, take advantage of economies of scale in operations, and grow market share within the geography
Increase production of blended cement (PPC) – reduces plant capacity directly without any need for creating additional clinker making capacity, reduces limestone usage and fuel usage
Open marketing offices in global markets like Middle East and Africa where demand for White cement is higher than India.
Improve Product Portfolio – Ready Mix ConcreteGovt. of India intends to setup policies for the
next planning period (2012-17) as below Introduce policies preventing non-usage of RMC for
large infrastructure projects. Remove tax (sales tax and excise duty) imbalances on
RMC and enable reduction in the cost of RMC used for construction
Incentivize the RMC industry by suitably lowering the import duties on RMC equipment / components to reduce the overall capital cost of the RMC plants in India
Other points - TBD
Implementation Plan Improve product portfolio [Specifics and plan TBD]
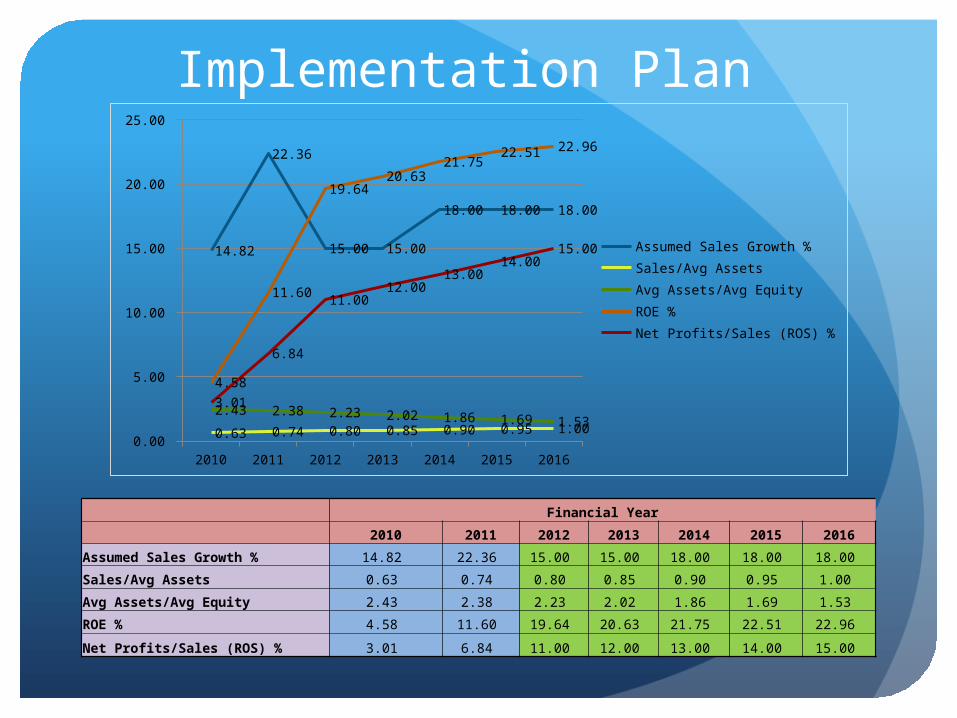
Implementation Plan
2010 2011 2012 2013 2014 2015 20160.00
5.00
10.00
15.00
20.00
25.00
14.82
22.36
15.00 15.00
18.00 18.00 18.00
0.63 0.74 0.80 0.85 0.90 0.95 1.00 2.43 2.38 2.23 2.02 1.86 1.69 1.53
4.58
11.60
19.64 20.63
21.75 22.51 22.96
3.01
6.84
11.00 12.00
13.00 14.00
15.00 Assumed Sales Growth %Sales/Avg AssetsAvg Assets/Avg EquityROE % Net Profits/Sales (ROS) %
Financial Year
2010 2011 2012 2013 2014 2015 2016
Assumed Sales Growth % 14.82 22.36 15.00 15.00 18.00 18.00 18.00
Sales/Avg Assets 0.63 0.74 0.80 0.85 0.90 0.95 1.00
Avg Assets/Avg Equity 2.43 2.38 2.23 2.02 1.86 1.69 1.53
ROE % 4.58 11.60 19.64 20.63 21.75 22.51 22.96
Net Profits/Sales (ROS) % 3.01 6.84 11.00 12.00 13.00 14.00 15.00

Financial Projections
Financial Year
Financials in Crore Rs 2006 2007 2008 2009 2010 2011 2012 2013 2014 2015 2016
JK Cement Sales 1244 1466 1505 1846 2120 2594 2983 3430 3876 4302 4776
JK Total Assets 1634 2016 2148 2968 3389 3576 3881 4190 4423 4634 4917
JK Shareholder's funds 820 1053 1186 1354 1395 1529 1872 2272 2808 3408 4175
JK PAT 179 265 142 226 64 177 388 446 581 645 812
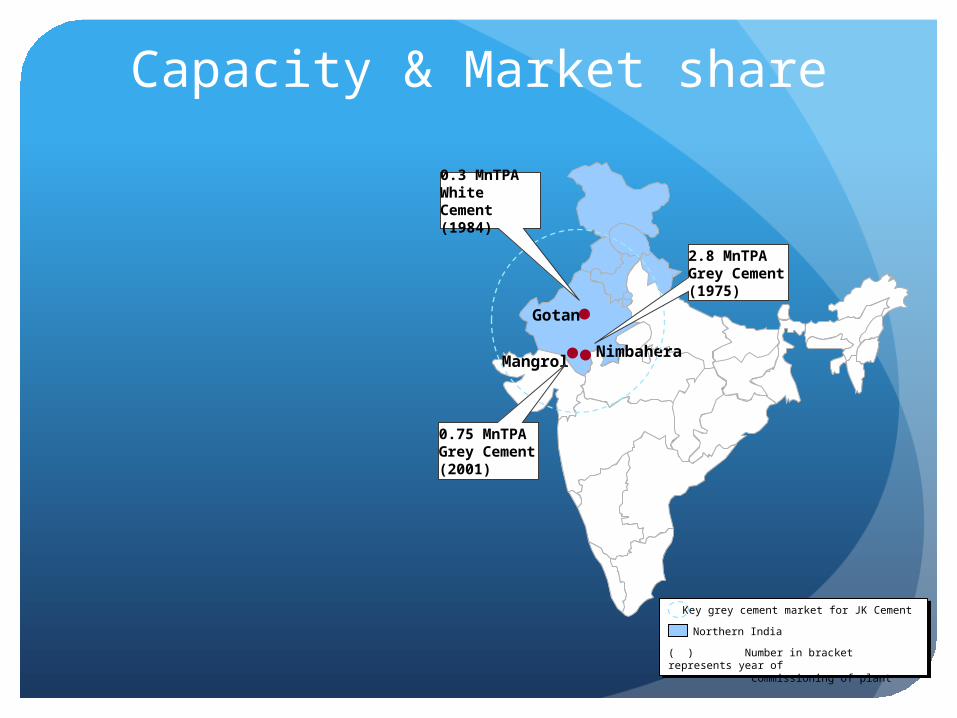
Capacity & Market share
Gotan
MangrolNimbahera
0.75 MnTPA Grey Cement (2001)
2.8 MnTPA Grey Cement (1975)
0.3 MnTPA White Cement (1984)
Key grey cement market for JK Cement
Northern India
( ) Number in bracket represents year of commissioning of plant


![Pathological Brain Detection in Magnetic Resonance Imaging ......94. Harikumar and Kumar [25] analyzed the performance of ANN, in classification of medical images using wavelets as](https://static.fdocuments.in/doc/165x107/604e5d5034452f536b069fb7/pathological-brain-detection-in-magnetic-resonance-imaging-94-harikumar.jpg)

![ScalableBackdoorDetectioninNeuralNetworksarXiv:2006.05646v1 [cs.CV] 10 Jun 2020 ScalableBackdoorDetectioninNeuralNetworks Haripriya Harikumar 1, Vuong Le , Santu Rana1, Sourangshu](https://static.fdocuments.in/doc/165x107/604e5d5034452f536b069fb5/scalablebackdoordetectioninneuralnetworks-arxiv200605646v1-cscv-10-jun-2020.jpg)