Group financial statement for 2012 EBIT up 17%, exceeding ...
22
Company announcement No. 3, 2013 Page 1 of 22 Novozymes A/S Investor Relations CVR number: 10 00 71 27 2013-00181-01 Krogshoejvej 36 2880 Bagsvaerd Denmark Telephone: +45 4446 0000 Email: [email protected] Internet: www.novozymes.com Group financial statement for 2012 January 21, 2013 EBIT up 17%, exceeding outlook; long-term financial targets adjusted Organic sales growth was 4% (7% DKK, 3% LCY) compared with 2011. EBIT increased by 17%, raising the EBIT margin to 24.4%. Net profit grew by 10%. Strong free cash flow before acquisitions of DKK 1,581 million exceeded the outlook. For 2013, the EBIT margin is expected to remain at its current high level, while organic sales growth is expected to increase to 5-8%. Long-term financial targets adjusted to reflect high profitability and timing of sales growth. In 2012: Sales grew by 7% in DKK, 3% in LCY and 4% organically vs. 2011 The gross margin was 57.2%, 1 %-point up on 2011 EBIT was DKK 2,745 million, an increase of 17% compared with 2011 The EBIT margin was 24.4%, 2.1 %-points up on 2011 Net profit was DKK 2,016 million, an increase of 10% compared with 2011 Free cash flow before acquisitions was DKK 1,581 million, vs. DKK 1,393 million for 2011 ROIC (including goodwill) was 19.9%, against 21.3% for 2011 “We delivered strong earnings growth and record profitability in a year when organic sales growth was challenged and came in at 4% – below our ambition,” says Steen Riisgaard, President & CEO. “With 2012 behind us, we have reviewed our long-term growth scenarios and decided to adjust our long-term financial targets. We are still confident that we can reach the long-term average sales growth target of more than 10%, although not until 2015. Meanwhile, profitability will remain at current levels, and we are raising our target for EBIT margin to more than 24%. The ROIC target is confirmed as more than 22%. The company’s strategy is unchanged and, under the leadership of the new President & CEO Peder Holk Nielsen, Novozymes will continue to focus on innovation, partnerships and sustainability.” 2013 outlook January 21* 2012 outlook October 25** Realized 2012 2011 Sales, DKKm 11,234 10,510 Sales growth, DKK 7% 8% 4-7% 7% Sales growth, LCY 3% 10% 5-8% 3% Sales growth, organic 4% 7% 5-8% 4% EBIT, DKKm 2,745 2,340 EBIT growth 17% 11% 4-7% 11-14% EBIT margin 24.4% 22.3% ~24% 23-24% Net profit, DKKm 2,016 1,828 Net profit growth 10% 13% 6-9% 5-7% Net investments excl. acquisitions, DKKm 1,177 1,316 ~1,100 ~1,200 Free cash flow before acquisitions, DKKm 1,581 1,393 ~1,650 ~1,500 ROIC (including goodwill) 19.9% 21.3% ~20% ~20% Avg. USD/DKK 579 536 560 580 EPS (diluted), DKK 6.33 5.71 * Assumes exchange rates for the company’s key currencies remain at the closing rates on January 18 for the rest of 2013. ** ROIC was adjusted to ~19% in connection with the announcement of the strategic partnership with and acquisition of an equity position in Beta Renewables on October 29, 2012 (Company announcement No. 68, 2012).
Transcript of Group financial statement for 2012 EBIT up 17%, exceeding ...
Company announcement No. 3, 2013 Page 1 of 22 Novozymes A/S Investor Relations CVR number: 10 00 71 27 2013-00181-01
Krogshoejvej 36 2880 Bagsvaerd Denmark
Telephone: +45 4446 0000 Email: [email protected] Internet: www.novozymes.com
Group financial statement for 2012
January 21, 2013
EBIT up 17%, exceeding outlook; long-term financial targets adjusted Organic sales growth was 4% (7% DKK, 3% LCY) compared with 2011. EBIT increased by 17%, raising the EBIT margin to 24.4%. Net profit grew by 10%. Strong free cash flow before acquisitions of DKK 1,581 million exceeded the outlook. For 2013, the EBIT margin is expected to remain at its current high level, while organic sales growth is expected to increase to 5-8%. Long-term financial targets adjusted to reflect high profitability and timing of sales growth.
In 2012: Sales grew by 7% in DKK, 3% in LCY and 4% organically vs. 2011 The gross margin was 57.2%, 1 %-point up on 2011 EBIT was DKK 2,745 million, an increase of 17% compared with 2011 The EBIT margin was 24.4%, 2.1 %-points up on 2011 Net profit was DKK 2,016 million, an increase of 10% compared with 2011 Free cash flow before acquisitions was DKK 1,581 million, vs. DKK 1,393 million for 2011 ROIC (including goodwill) was 19.9%, against 21.3% for 2011
“We delivered strong earnings growth and record profitability in a year when organic sales growth was challenged and came in at 4% – below our ambition,” says Steen Riisgaard, President & CEO. “With 2012 behind us, we have reviewed our long-term growth scenarios and decided to adjust our long-term financial targets. We are still confident that we can reach the long-term average sales growth target of more than 10%, although not until 2015. Meanwhile, profitability will remain at current levels, and we are raising our target for EBIT margin to more than 24%. The ROIC target is confirmed as more than 22%. The company’s strategy is unchanged and, under the leadership of the new President & CEO Peder Holk Nielsen, Novozymes will continue to focus on innovation, partnerships and sustainability.”
2013 outlook January 21*
2012 outlook October 25**
Realized 2012 2011
Sales, DKKm 11,234 10,510
Sales growth, DKK 7% 8% 4-7% 7%
Sales growth, LCY 3% 10% 5-8% 3% Sales growth, organic 4% 7% 5-8% 4%
EBIT, DKKm 2,745 2,340
EBIT growth 17% 11% 4-7% 11-14% EBIT margin 24.4% 22.3% ~24% 23-24%
Net profit, DKKm 2,016 1,828 Net profit growth 10% 13% 6-9% 5-7%
Net investments excl. acquisitions, DKKm 1,177 1,316 ~1,100 ~1,200
Free cash flow before acquisitions, DKKm 1,581 1,393 ~1,650 ~1,500
ROIC (including goodwill) 19.9% 21.3% ~20% ~20%
Avg. USD/DKK 579 536 560 580
EPS (diluted), DKK 6.33 5.71 * Assumes exchange rates for the company’s key currencies remain at the closing rates on January 18 for the rest of 2013. ** ROIC was adjusted to ~19% in connection with the announcement of the strategic partnership with and acquisition of an equity position in Beta Renewables on October 29, 2012 (Company announcement No. 68, 2012).
Group financial statement for 2012
Novozymes A/S – Company announcement No. 3, 2013
Page 2 of 22
Total sales up 7% in DKK, 3% in LCY and 4% organically
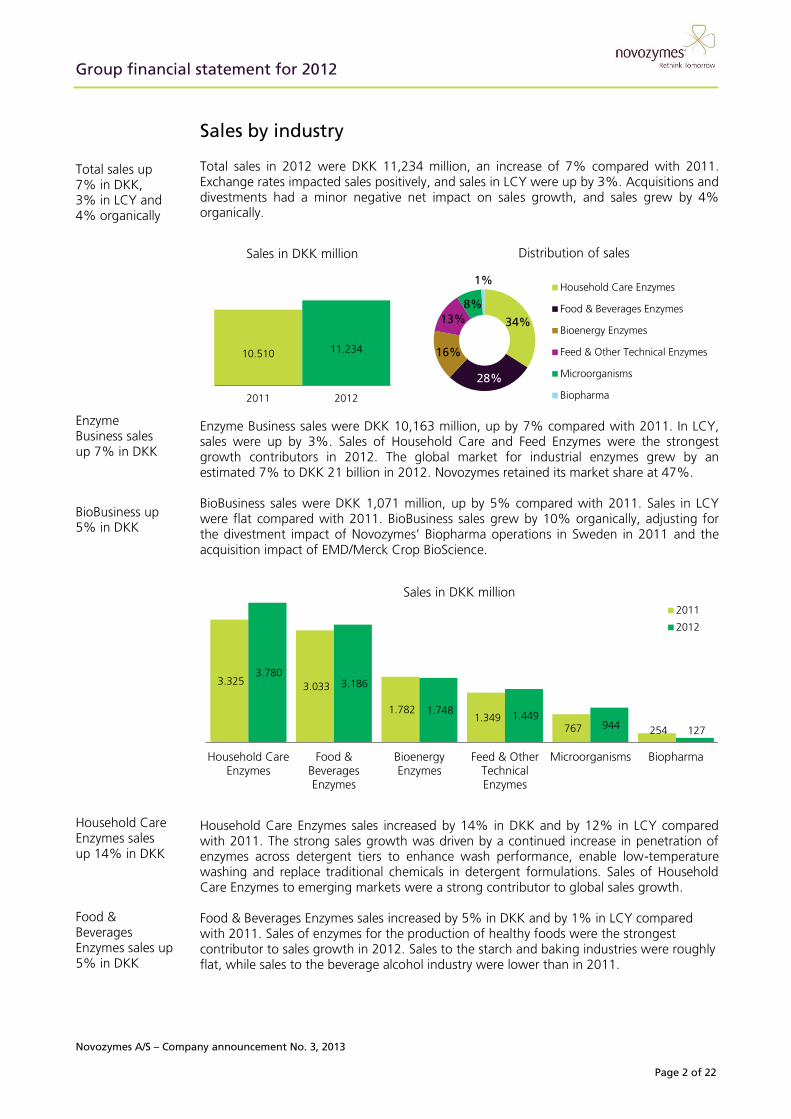
Sales by industry Total sales in 2012 were DKK 11,234 million, an increase of 7% compared with 2011. Exchange rates impacted sales positively, and sales in LCY were up by 3%. Acquisitions and divestments had a minor negative net impact on sales growth, and sales grew by 4% organically.
Enzyme Business sales were DKK 10,163 million, up by 7% compared with 2011. In LCY, sales were up by 3%. Sales of Household Care and Feed Enzymes were the strongest growth contributors in 2012. The global market for industrial enzymes grew by an estimated 7% to DKK 21 billion in 2012. Novozymes retained its market share at 47%. BioBusiness sales were DKK 1,071 million, up by 5% compared with 2011. Sales in LCY were flat compared with 2011. BioBusiness sales grew by 10% organically, adjusting for the divestment impact of Novozymes’ Biopharma operations in Sweden in 2011 and the acquisition impact of EMD/Merck Crop BioScience.
Household Care Enzymes sales increased by 14% in DKK and by 12% in LCY compared with 2011. The strong sales growth was driven by a continued increase in penetration of enzymes across detergent tiers to enhance wash performance, enable low-temperature washing and replace traditional chemicals in detergent formulations. Sales of Household Care Enzymes to emerging markets were a strong contributor to global sales growth. Food & Beverages Enzymes sales increased by 5% in DKK and by 1% in LCY compared with 2011. Sales of enzymes for the production of healthy foods were the strongest contributor to sales growth in 2012. Sales to the starch and baking industries were roughly flat, while sales to the beverage alcohol industry were lower than in 2011.
Enzyme Business sales up 7% in DKK
BioBusiness up 5% in DKK
Household Care Enzymes sales up 14% in DKK Food & Beverages Enzymes sales up 5% in DKK
10.510
11.234
2011 2012
Sales in DKK million
34%
28%
16%
13% 8%
1%
Distribution of sales
Household Care Enzymes
Food & Beverages Enzymes
Bioenergy Enzymes
Feed & Other Technical Enzymes
Microorganisms
Biopharma
3.325 3.033
1.782 1.349
767 254
3.780 3.186
1.748 1.449 944 127
Household CareEnzymes
Food &BeveragesEnzymes
BioenergyEnzymes
Feed & OtherTechnicalEnzymes
Microorganisms Biopharma
Sales in DKK million 2011
2012
Group financial statement for 2012
Novozymes A/S – Company announcement No. 3, 2013
Page 3 of 22
Bioenergy Enzymes sales down 2% in DKK Feed & Other Technical Enzymes sales up 7% in DKK
Bioenergy Enzymes sales were down by 2% in DKK and by 9% in LCY compared with 2011. The U.S. Energy Information Administration estimates U.S. ethanol production to have declined by ~5% during 2012 compared with 2011. Bioenergy Enzymes sales were lower for the period as a result of lower U.S. ethanol production, a decrease in enzyme content per gallon of ethanol produced, and previously mentioned price and product mix changes. In October 2012, Novozymes launched a new product for the bioenergy industry, Novozymes Avantec®, which enables producers of corn-based ethanol to increase the ethanol yield by up to 2.5% with the same amount of corn. Adoption of the new product is progressing well and had a minor positive impact on sales growth in Q4. Feed & Other Technical Enzymes sales were up by 7% in DKK and by 3% in LCY compared with 2011. Enzyme sales to the animal feed industry were the main growth driver as a result of a continued increase in sales of RONOZYME® ProAct on the Latin American, Asian and European markets as well as improved phytase enzyme sales. Enzyme sales to the other technical industries, including the textile industries, were lower than in 2011. Microorganisms sales were up by 23% in DKK and by 18% in LCY compared with 2011. Organically, sales grew by 17%, adjusting for the acquisition of EMD/Merck Crop BioScience in 2011. Microorganisms sales to the BioAg industry were the strongest growth driver in 2012 as a result of positive sales developments in Latin America, Europe and Asia. The majority of the sales growth in Microorganisms came from an exclusive sales and marketing agreement entered into during Q4. Microorganisms sales to the wastewater industry and for cleaning solutions were roughly flat in LCY compared with 2011. Biopharma sales were down by 50% in DKK and by 53% in LCY compared with 2011. The divestment of Novozymes’ Biopharma operations in Sweden late 2011 had a considerable negative impact on sales in 2012. Organically, sales were down by 23% compared with 2011, as one large order from a customer in 2011 was not placed again in 2012.
Microorganisms sales up 23% in DKK
Biopharma sales down 50% in DKK
Group financial statement for 2012
Novozymes A/S – Company announcement No. 3, 2013
Page 4 of 22
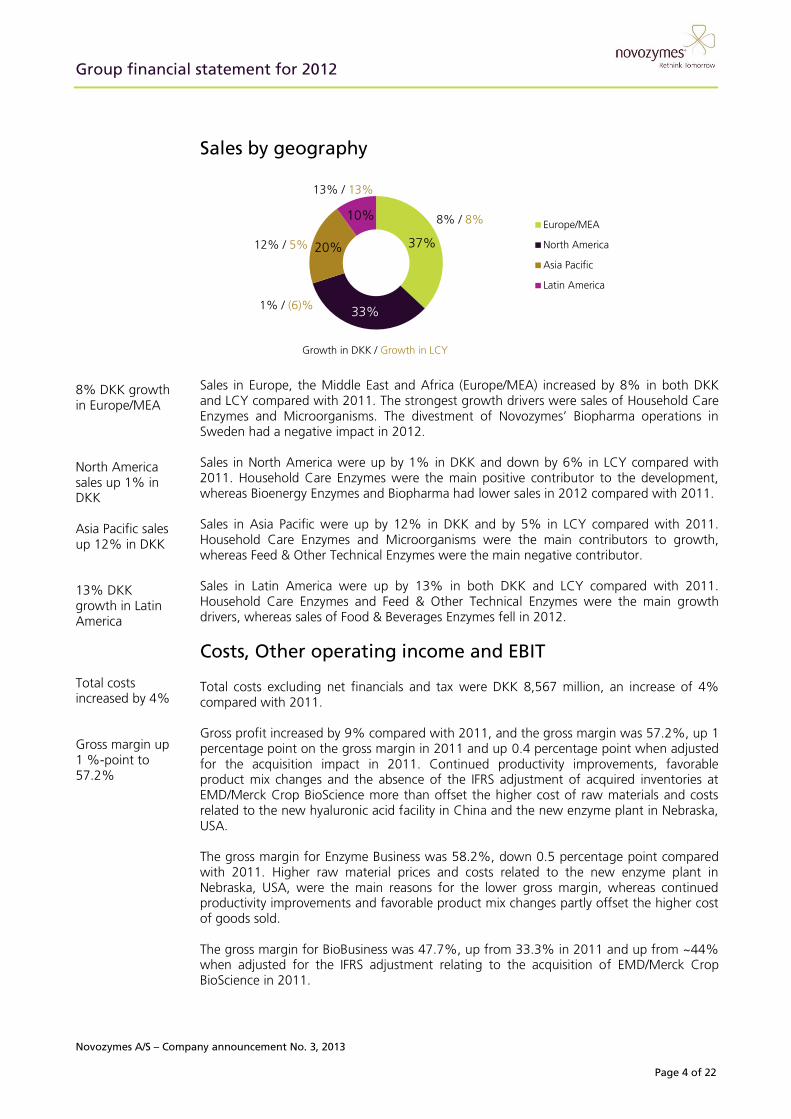
Sales by geography
Sales in Europe, the Middle East and Africa (Europe/MEA) increased by 8% in both DKK and LCY compared with 2011. The strongest growth drivers were sales of Household Care Enzymes and Microorganisms. The divestment of Novozymes’ Biopharma operations in Sweden had a negative impact in 2012. Sales in North America were up by 1% in DKK and down by 6% in LCY compared with 2011. Household Care Enzymes were the main positive contributor to the development, whereas Bioenergy Enzymes and Biopharma had lower sales in 2012 compared with 2011. Sales in Asia Pacific were up by 12% in DKK and by 5% in LCY compared with 2011. Household Care Enzymes and Microorganisms were the main contributors to growth, whereas Feed & Other Technical Enzymes were the main negative contributor. Sales in Latin America were up by 13% in both DKK and LCY compared with 2011. Household Care Enzymes and Feed & Other Technical Enzymes were the main growth drivers, whereas sales of Food & Beverages Enzymes fell in 2012.
Costs, Other operating income and EBIT Total costs excluding net financials and tax were DKK 8,567 million, an increase of 4% compared with 2011. Gross profit increased by 9% compared with 2011, and the gross margin was 57.2%, up 1 percentage point on the gross margin in 2011 and up 0.4 percentage point when adjusted for the acquisition impact in 2011. Continued productivity improvements, favorable product mix changes and the absence of the IFRS adjustment of acquired inventories at EMD/Merck Crop BioScience more than offset the higher cost of raw materials and costs related to the new hyaluronic acid facility in China and the new enzyme plant in Nebraska, USA. The gross margin for Enzyme Business was 58.2%, down 0.5 percentage point compared with 2011. Higher raw material prices and costs related to the new enzyme plant in Nebraska, USA, were the main reasons for the lower gross margin, whereas continued productivity improvements and favorable product mix changes partly offset the higher cost of goods sold. The gross margin for BioBusiness was 47.7%, up from 33.3% in 2011 and up from ~44% when adjusted for the IFRS adjustment relating to the acquisition of EMD/Merck Crop BioScience in 2011.
8% DKK growth in Europe/MEA North America sales up 1% in DKK Asia Pacific sales up 12% in DKK 13% DKK growth in Latin America Total costs increased by 4%
Gross margin up 1 %-point to 57.2%
37%
33%
20%
10% Europe/MEA
North America
Asia Pacific
Latin America
13% / 13%
8% / 8%
1% / (6)%
12% / 5%
Growth in DKK / Growth in LCY
Group financial statement for 2012
Novozymes A/S – Company announcement No. 3, 2013
Page 5 of 22
R&D represents 14% of sales
Other operating costs increased by 4% compared with 2011 to DKK 3,756 million. The ratio of other operating costs to sales was 33%, a decrease of 1 percentage point compared with 2011. A cost-conscious approach continued to benefit operations. Sales and distribution costs, including business development, increased by 3%,
representing 13% of sales R&D costs increased by 4%, representing 14% of sales Administrative costs increased by 4%, representing 7% of sales Other operating income increased to DKK 78 million in 2012, compared with DKK 50 million in 2011. Milestone payments in BioBusiness were the main reason for the increase. Depreciation and amortization totaled DKK 703 million in 2012, compared with DKK 786 million in 2011. The decrease in depreciation and amortization is mainly due to lower depreciation in Biopharma, caused by the absence of depreciation and write-downs related to the divestment in 2011. Excluding these factors, depreciation and amortization increased slightly. EBIT grew by 17% to DKK 2,745 million, up from DKK 2,340 million in 2011. The EBIT margin was 24.4% in 2012, an increase of 2.1 percentage points compared with 2011 and an increase of ~1.8 percentage points adjusted for the acquisition impact in 2011. The EBIT margin was positively affected by higher sales and a favorable development in operating costs and currency exchange rates. Net financials and Net profit Net financial costs totaled DKK 161 million in 2012, an increase of DKK 236 million compared with net financial income of DKK 75 million in 2011. The increase was primarily caused by net currency hedging/revaluation losses of DKK 83 million in 2012, compared with a gain of DKK 190 million in 2011. Compared with 2011, net interest expenses were DKK 15 million lower at DKK 61 million. Profit before tax increased by 7% to DKK 2,584 million, up from DKK 2,415 million in 2011. The effective tax rate in 2012 was 22.0%, against 24.3% in 2011. The effective tax rate for 2012 benefited from utilization of the previously announced U.S. Advanced Energy Manufacturing tax credit, obtained in 2010, relating to the new plant in Nebraska. Net profit was DKK 2,016 million, an increase of 10% compared with 2011. The higher EBIT and lower tax rate had a positive impact on net profit, whereas the increased net financial costs impacted net profit negatively.
Cash flow and Balance sheet Cash flow from operating activities came in at DKK 2,758 million for 2012, compared with DKK 2,709 million in 2011. The higher operating cash flow was primarily the result of higher net profit. Net investments excluding acquisitions totaled DKK 1,177 million, against DKK 1,316 million in 2011. Free cash flow before acquisitions for the period was DKK 1,581 million, up from DKK 1,393 million in 2011. The increase was the result of the higher operating cash flow.
17% EBIT growth 24.4% EBIT margin Net financial costs DKK 161 million Effective tax rate 22.0% Net profit up 10%
Operating cash flow DKK 2,758 million Net investments excl. acq. DKK 1,177 million Free cash flow before acq. DKK 1,581 million
Group financial statement for 2012
Novozymes A/S – Company announcement No. 3, 2013
Page 6 of 22
Equity ratio 63%
ROIC 19.9%
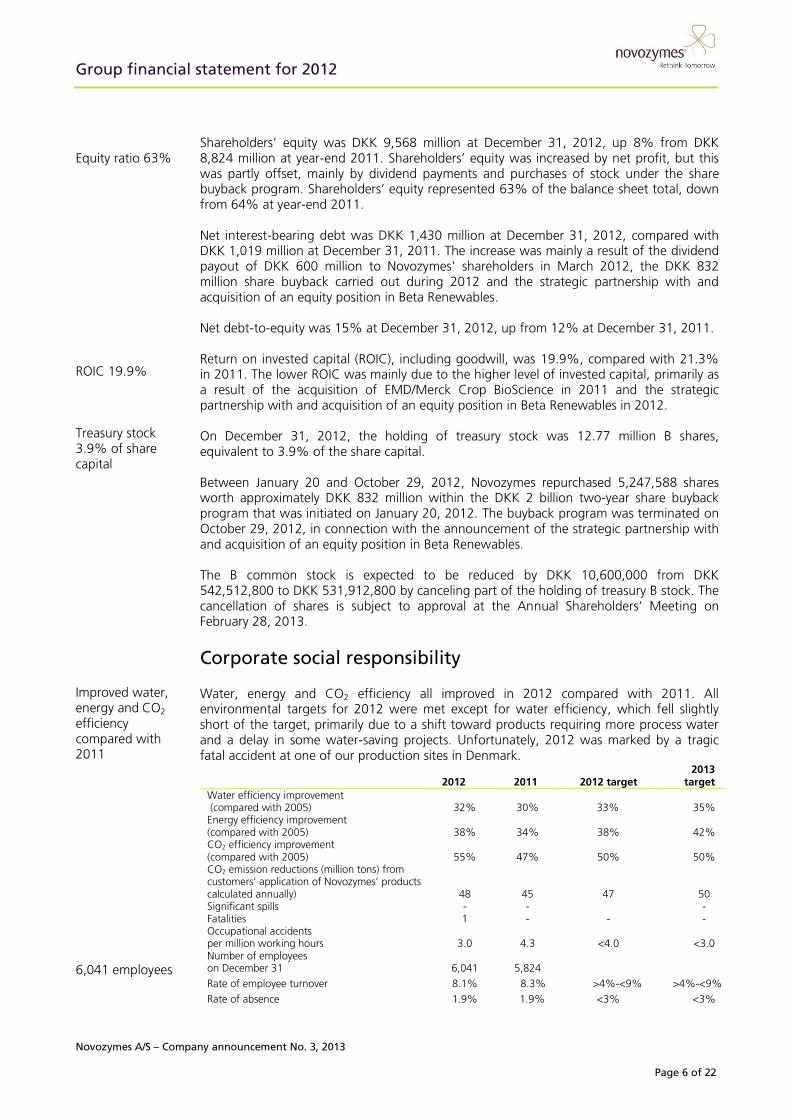
Shareholders’ equity was DKK 9,568 million at December 31, 2012, up 8% from DKK 8,824 million at year-end 2011. Shareholders’ equity was increased by net profit, but this was partly offset, mainly by dividend payments and purchases of stock under the share buyback program. Shareholders’ equity represented 63% of the balance sheet total, down from 64% at year-end 2011. Net interest-bearing debt was DKK 1,430 million at December 31, 2012, compared with DKK 1,019 million at December 31, 2011. The increase was mainly a result of the dividend payout of DKK 600 million to Novozymes' shareholders in March 2012, the DKK 832 million share buyback carried out during 2012 and the strategic partnership with and acquisition of an equity position in Beta Renewables. Net debt-to-equity was 15% at December 31, 2012, up from 12% at December 31, 2011. Return on invested capital (ROIC), including goodwill, was 19.9%, compared with 21.3% in 2011. The lower ROIC was mainly due to the higher level of invested capital, primarily as a result of the acquisition of EMD/Merck Crop BioScience in 2011 and the strategic partnership with and acquisition of an equity position in Beta Renewables in 2012. On December 31, 2012, the holding of treasury stock was 12.77 million B shares, equivalent to 3.9% of the share capital. Between January 20 and October 29, 2012, Novozymes repurchased 5,247,588 shares worth approximately DKK 832 million within the DKK 2 billion two-year share buyback program that was initiated on January 20, 2012. The buyback program was terminated on October 29, 2012, in connection with the announcement of the strategic partnership with and acquisition of an equity position in Beta Renewables. The B common stock is expected to be reduced by DKK 10,600,000 from DKK 542,512,800 to DKK 531,912,800 by canceling part of the holding of treasury B stock. The cancellation of shares is subject to approval at the Annual Shareholders’ Meeting on February 28, 2013. Corporate social responsibility Water, energy and CO2 efficiency all improved in 2012 compared with 2011. All environmental targets for 2012 were met except for water efficiency, which fell slightly short of the target, primarily due to a shift toward products requiring more process water and a delay in some water-saving projects. Unfortunately, 2012 was marked by a tragic fatal accident at one of our production sites in Denmark.
2012 2011 2012 target 2013
target Water efficiency improvement (compared with 2005) 32% 30% 33%
35%
Energy efficiency improvement (compared with 2005) 38% 34% 38%
42%
CO2 efficiency improvement (compared with 2005) 55% 47% 50%
50%
CO2 emission reductions (million tons) from customers’ application of Novozymes’ products calculated annually) 48 45 47
50 Significant spills - - - Fatalities 1 - - - Occupational accidents per million working hours 3.0 4.3 <4.0
<3.0
Number of employees on December 31 6,041 5,824
Rate of employee turnover 8.1% 8.3% >4%-<9% >4%-<9% Rate of absence 1.9% 1.9% <3% <3%
Treasury stock 3.9% of share capital
Improved water, energy and CO2 efficiency compared with 2011
6,041 employees
Group financial statement for 2012
Novozymes A/S – Company announcement No. 3, 2013
Page 7 of 22
IAS 34
Accounting policies The Group financial statement for 2012 has been prepared in accordance with IAS 34 and the additional Danish regulations for the presentation of Group financial statements by listed companies. The Group financial statement for 2012 follows the same accounting policies as the Group financial statement for 2011. Outlook for 2013 2012 was an eventful year for Novozymes. In terms of profitability and earnings growth, it was a very satisfactory year, whereas sales growth was disappointing despite being within the guided range. Looking at 2013, we expect to be able to retain the current level of profitability, as we feel confident of our continued ability to improve productivity throughout the business. On the sales side, we expect Novozymes' sales growth to pick up from 2012, although it will still be below the long-term target. The full-year LCY and organic sales growth guidance is 5-8%. Based on exchange rates at January 18, 2013, sales growth in DKK is expected at 4-7%. Sales growth is expected to pick up during the year. Within Enzyme Business, Novozymes expects all four sales areas to contribute to growth in 2013. The growth drivers in 2013 will again be Household Care Enzymes and Feed Enzymes, included in the Feed & other Technical Enzymes area. Household Care Enzymes are expected to be the strongest contributor to full-year sales growth, as the fundamental growth drivers of the business are expected to remain in place in 2013. Furthermore, enzyme sales to the household care industry will be supported by higher sales to a detergent manufacturer that ceased its remaining captive enzyme production in the second half of 2012. Sales of Feed Enzymes, included in the Feed & Other Technical Enzymes area, are expected to benefit from the continued global rollout and adoption of RONOZYME ProAct and a positive development of phytase enzyme sales. Growth in the Food & Beverages Enzymes segment is expected to increase as some of the major industries such as starch and baking return to growth, and with the increase in demand for enzymes for healthy food concepts expected to continue. Enzyme sales to the bioenergy industry are expected to grow in 2013 compared with 2012. Sales in the U.S. will be positively affected by increased penetration of the recently launched product Avantec, which enables producers of corn-based ethanol to increase the ethanol yield by up to 2.5% with the same amount of corn. The full-year sales outlook is based on the expectation that U.S. bioethanol production in 2013 will be roughly at the level of 2012. BioBusiness sales are expected to grow double-digit organically, with positive contributions from both the Microorganisms and Biopharma business areas. Microorganisms sales to the BioAg industry are expected to be the strongest growth contributor due to the recently announced partnerships, and growth in North America and on new markets in Europe and Asia. The acquisition of Natural Industries, Inc. in November 2012 will contribute slightly to LCY and DKK sales growth in 2013. The other Microorganisms industries are expected to grow moderately. Biopharma sales are expected to benefit from increased sales of recombinant albumin to a growing customer base established in 2012. Hyaluronic acid sales are also expected to
Organic and LCY sales growth 5-8%, DKK sales growth 4-7%
Group financial statement for 2012
Novozymes A/S – Company announcement No. 3, 2013
Page 8 of 22
EBIT growth 4-7%
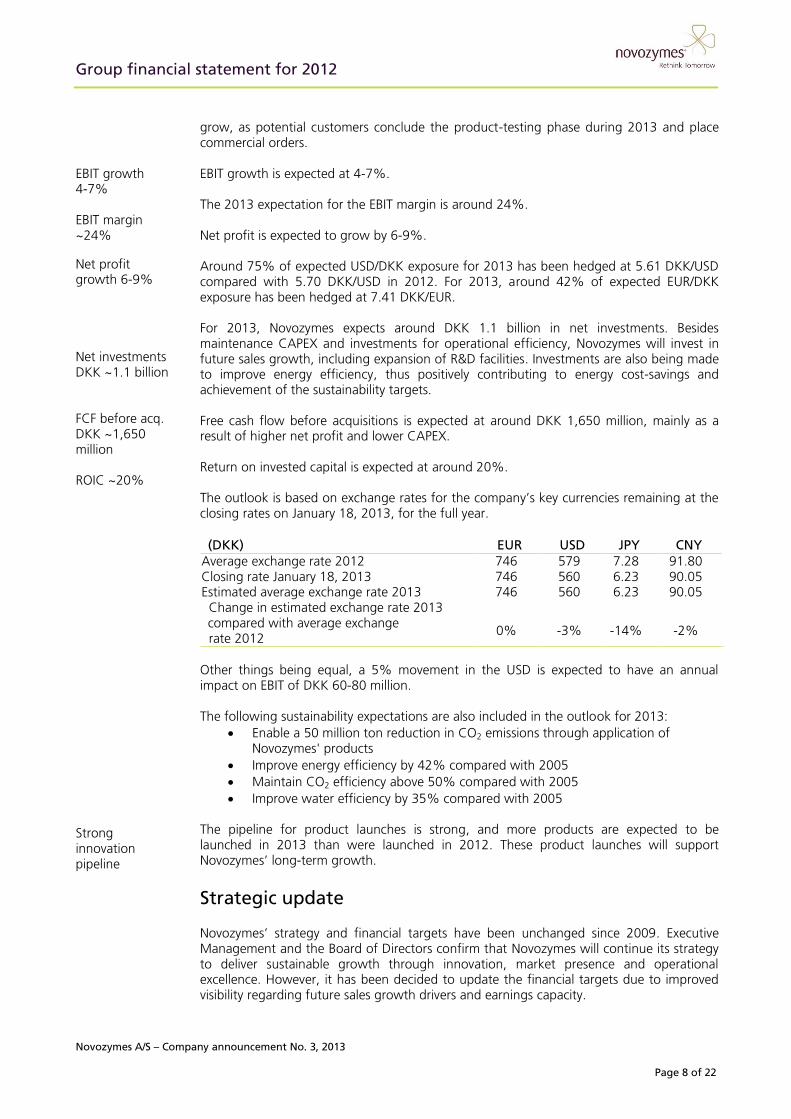
grow, as potential customers conclude the product-testing phase during 2013 and place commercial orders. EBIT growth is expected at 4-7%. The 2013 expectation for the EBIT margin is around 24%. Net profit is expected to grow by 6-9%. Around 75% of expected USD/DKK exposure for 2013 has been hedged at 5.61 DKK/USD compared with 5.70 DKK/USD in 2012. For 2013, around 42% of expected EUR/DKK exposure has been hedged at 7.41 DKK/EUR. For 2013, Novozymes expects around DKK 1.1 billion in net investments. Besides maintenance CAPEX and investments for operational efficiency, Novozymes will invest in future sales growth, including expansion of R&D facilities. Investments are also being made to improve energy efficiency, thus positively contributing to energy cost-savings and achievement of the sustainability targets. Free cash flow before acquisitions is expected at around DKK 1,650 million, mainly as a result of higher net profit and lower CAPEX. Return on invested capital is expected at around 20%. The outlook is based on exchange rates for the company’s key currencies remaining at the closing rates on January 18, 2013, for the full year.
(DKK) EUR USD JPY CNY Average exchange rate 2012 746 579 7.28 91.80 Closing rate January 18, 2013 746 560 6.23 90.05 Estimated average exchange rate 2013 746 560 6.23 90.05 Change in estimated exchange rate 2013 compared with average exchange
rate 2012
0%
-3%
-14%
-2%
Other things being equal, a 5% movement in the USD is expected to have an annual impact on EBIT of DKK 60-80 million. The following sustainability expectations are also included in the outlook for 2013:
Enable a 50 million ton reduction in CO2 emissions through application of Novozymes' products
Improve energy efficiency by 42% compared with 2005 Maintain CO2 efficiency above 50% compared with 2005 Improve water efficiency by 35% compared with 2005
The pipeline for product launches is strong, and more products are expected to be launched in 2013 than were launched in 2012. These product launches will support Novozymes’ long-term growth. Strategic update Novozymes’ strategy and financial targets have been unchanged since 2009. Executive Management and the Board of Directors confirm that Novozymes will continue its strategy to deliver sustainable growth through innovation, market presence and operational excellence. However, it has been decided to update the financial targets due to improved visibility regarding future sales growth drivers and earnings capacity.
EBIT margin ~24% Net profit growth 6-9% Net investments DKK ~1.1 billion FCF before acq. DKK ~1,650 million ROIC ~20%
Strong innovation pipeline
Group financial statement for 2012
Novozymes A/S – Company announcement No. 3, 2013
Page 9 of 22
Financial targets for 5 years Sales growth target of more than 10% from 2015 Sales to more than 15 biomass conversion plants by 2017 EBIT margin more than 24%
Novozymes previously excluded future sales of enzymes for biomass conversion from its long-term sales targets. However, there is now better visibility regarding growth opportunities in this emerging field. Furthermore, visibility has improved for several projects in the pipeline for sales of microorganisms to the BioAg industry and solutions to the biopharma industry. In terms of earnings, the previous long-term target for the EBIT margin has been outperformed in the last couple of years and the outlook remains supportive of current levels. Updated long-term financial targets for the next 5 years:
Average organic sales growth of more than 10% EBIT margin of more than 24% Return on invested capital of more than 22%
The average organic sales growth target is expected to be reached from 2015 and onward, following a ramp-up from current levels Targets are based on the assumptions that:
The global economy stabilizes The biofuel market in the U.S. moves toward E15 Novozymes will sell enzymes to at least 15 biomass conversion plants by 2017,
with a ramp-up in 2015-2016 The targets are contingent upon no major acquisitions being made Sales growth Growth is expected in all sales areas during the five-year period, with sales of Household Care Enzymes among the strongest contributors. Sales of enzymes for biomass conversion and sales to the biopharma industry are expected to materialize slowly in 2013 and 2014, and to contribute significantly to sales growth by 2015, enabling Novozymes to achieve more than 10% organic growth from that year onward. The sales growth target is based on the assumption that the global economy stabilizes without any major fluctuations. Biomass conversion Novozymes’ long-term target assumes that the company will have sales to at least 15 biomass conversion plants by the end of 2017. The first cellulosic ethanol plants will come onstream in 2013-2014 and, as they start production, more players are expected to commence construction of plants. Novozymes is collaborating with Beta Renewables, which is expected to contract the design and planning of 15-25 cellulosic ethanol plants in the next 3-5 years. As Novozymes is Beta Renewables’ preferred enzyme partner, these contracts are expected to generate enzyme sales for Novozymes once the contracted plants become operational around two years later. In 5-7 years, these contracts are expected to contribute up to DKK 1 billion to Novozymes’ annual enzyme sales. In addition, Novozymes is collaborating with other partners on the development of cellulosic ethanol technology and other means of converting biomass to fermentable sugars for the production of biochemicals and other materials. These partnerships are also expected to result in sales of enzymes toward the end of the five year period. EBIT margin Novozymes’ new long-term target for the EBIT margin is more than 24%. This level is expected to be achievable, while at the same time keeping the desired flexibility in the business to pursue opportunities for long-term growth.
Group financial statement for 2012
Novozymes A/S – Company announcement No. 3, 2013
Page 10 of 22
ROIC more than 22% R&D spending to continue at 13-14% CAPEX below 8% Updated long-term sustainability targets
ROIC The long-term target of more than 22% for ROIC incl. goodwill is unchanged, as it remains ambitious yet achievable. ROIC incl. goodwill has decreased over the last couple of years due to acquisitions. As investments normalize and sales grow, Novozymes is expected to reach the target and remain above 22%. Novozymes expects to continue to make productivity improvements in both Enzyme Business and BioBusiness. This ability is important for offsetting increasing raw material prices and for reaching the EBIT margin and ROIC targets. Innovation Novozymes’ future success relies on innovation, so the company will continue to spend 13-14% of sales on R&D. Novozymes will always focus on investing in projects that will secure growth for Novozymes and benefit customers. Currently, Novozymes is changing internal structures to improve the flow of products in the R&D pipeline toward better-qualified solutions and to speed up the idea-to-market process. The success of these efforts will be measured by the increased commercial impact of new products. Investments Novozymes has invested relatively heavily in recent years in order to be ready for future growth in both Enzyme Business and BioBusiness. It is expected that an investment level of not more than 8% relative to sales will be sufficient going forward to cater for 10% sales growth. Should future growth opportunities that require up-front investment be identified, Novozymes will allow investments to exceed the targeted level. R&D facility expansions are not included in the 8% target. Acquisitions and partnerships Novozymes continues to be interested in companies and technologies that fit strategically with its overall objectives and can balance the portfolio in terms of risk, future value creation, market access and resource utilization. Novozymes is always searching for new opportunities and will continue to acquire and divest activities as required to ensure a balanced portfolio. Strategic partnerships are an important element in reaching and servicing new customers. Novozymes will continue to look for partners that complement its strengths in bringing its technology to the market. Sustainability Sustainability is an integral part of Novozymes’ business. The nature of Novozymes’ technology enables customers to optimize their use of raw materials and energy. This has become a competitive advantage as more customers look to use sustainability as a differentiator. To support the ambition to drive sustainability around the world, Novozymes works closely with all players across the business value chain: suppliers, customers and society. Novozymes mitigates risks and taps into supplier strengths by requiring suppliers to balance reliability, quality and efficiency with a focus on sustainability and innovation. Work is being carried out, and investments are being made, to increase CO2 efficiency by improving production processes and helping customers achieve further CO2 reductions through the application of our products. Novozymes is a member of the Dow Jones Sustainability World Index and the Dow Jones Sustainability STOXX Index. Several external stakeholders have recognized Novozymes as one of the world leaders in sustainability. The sustainability targets have been updated to reflect Novozymes’ sustainability ambitions and activities across the value chain, and to ensure the long-term development of Novozymes as an international, inclusive and successful company.

Group financial statement for 2012
Novozymes A/S – Company announcement No. 3, 2013
Page 11 of 22
Dividend proposal DKK 2.20 per share
The long-term sustainability targets are: Ensure 100% supplier adherence to Novozymes’ supplier program for commercial,
quality and sustainability performance in 2015 Enable a 75 million ton reduction in CO2 emissions in 2015 through the application of
Novozymes' products Improve water efficiency by 40% in 2015 compared with 2005 Improve energy efficiency by 50% in 2015 compared with 2005 Improve CO2 efficiency by 50% in 2015 compared with 2005 Increase energy supply from renewable and CO2-neutral sources to 50% of total
energy supply in 2020 Be recognized as a global leader within sustainability Be a globally preferred employer, attracting global talent as a diverse and inclusive
workplace Champion the inclusion of biofuels as a high-impact opportunity area in the U.N.’s
Sustainable Energy for All initiative in 2015 Dividend At the Annual Shareholders’ Meeting on February 28, 2013, the Board of Directors will propose a dividend payment of DKK 2.20 per share for the 2012 financial year, an increase of 16% compared with 2011. The payout ratio for 2012 is 34.1%, compared with 32.8% for 2011. Novozymes is targeting a dividend payout ratio of 35% in 1-2 years. Appointment of new Chief Executive Officer According to plan, the current President & CEO of Novozymes A/S, Steen Riisgaard, will step down from his position on March 31, 2013. Today, the Board of Directors has appointed Peder Holk Nielsen as his successor. Mr. Nielsen will formally take up the position on April 1, 2013 (see Company Announcement No. 2, 2013).
Forward-looking statements This company announcement contains forward-looking statements, including the financial outlook for 2013. Forward-looking statements are, by their very nature, associated with risks and uncertainties that may cause actual results to differ materially from expectations. The uncertainties may include unexpected developments in the international currency exchange and securities markets, market-driven price decreases for Novozymes’ products and the launch of competing products in Novozymes’ core areas. Contact persons:
Press and media:
Investor Relations: René Tronborg (DK) Tel.: +45 3077 2274 Paige Donnelly (USA) Tel.: +1 919 2184501
Maarit Pokkinen (DK) Tel.: +45 3077 8682 Martin Riise (DK) Tel.: +45 3077 0738 Thomas Bomhoff (USA) Tel.: +1 919 6492565 Tel. (DK): +45 3077 1226
Group financial statement for 2012
Novozymes A/S – Company announcement No. 3, 2013
Page 12 of 22
Statement of the Board of Directors and Executive Management The Board of Directors and Executive Management have approved the Annual Report of Novozymes A/S for 2012. The Board of Directors and Executive Management have also considered and approved this unaudited Group financial statement for Novozymes A/S for 2012. The Group financial statement has been prepared in accordance with International Financial Reporting Standards (as adopted by the EU) and additional Danish regulations for the presentation of Group financial statements by listed companies. In our opinion, the accounting policies used are appropriate, the Group’s internal controls relevant to preparation and presentation of a Group financial statement are adequate, and the Group financial statement gives a true and fair view of the Group’s assets, liabilities, net profit and financial position at December 31, 2012, and of the results of the Group’s operations and cash flow for 2012. We further consider that the Management review in the preceding pages gives a true and fair view of the development in the Group’s activities and business, the profit for the period and the Group’s financial position as a whole, and a description of the most significant risks and uncertainties to which the Group is subject. Bagsvaerd, January 21, 2013 Executive Management
Steen Riisgaard President & CEO
Benny D. Loft
Per Falholt
Peder Holk Nielsen Thomas Nagy Thomas Videbæk
Board of Directors
Henrik Gürtler Chairman
Kurt Anker Nielsen Vice Chairman
Mathias Uhlén
Søren Jepsen Lars Bo Køppler Ulla Morin
Lena Olving Agnete Raaschou-Nielsen Jørgen Buhl Rasmussen
Group financial statement for 2012
Novozymes A/S – Company announcement No. 3, 2013
Page 13 of 22
Appendices
Appendix 1 Main items and key figures
1.1 Key figures
1.2 Five-year overview 2008-2012
1.3 Income statement
1.4 Statement of comprehensive income
1.5 Segment information
Appendix 2 Distribution of revenue
2.1 By industry
2.2 By geography
2.3 Quarterly sales by industry
2.4 Quarterly sales by geography
Appendix 3 Statement of cash flows
Appendix 4 Balance sheet and Statement of shareholders’ equity
4.1 Balance sheet
4.2 Statement of shareholders’ equity
Appendix 5
Appendix 6
Product launches in 2012
Company announcements for 2012 and 2013 (excluding management’s trading in Novozymes shares, major shareholder announcements and share buyback status)
Appendix 7 Financial calendar
Group financial statement for 2012
Novozymes A/S – Company announcement No. 3, 2013
Page 14 of 22
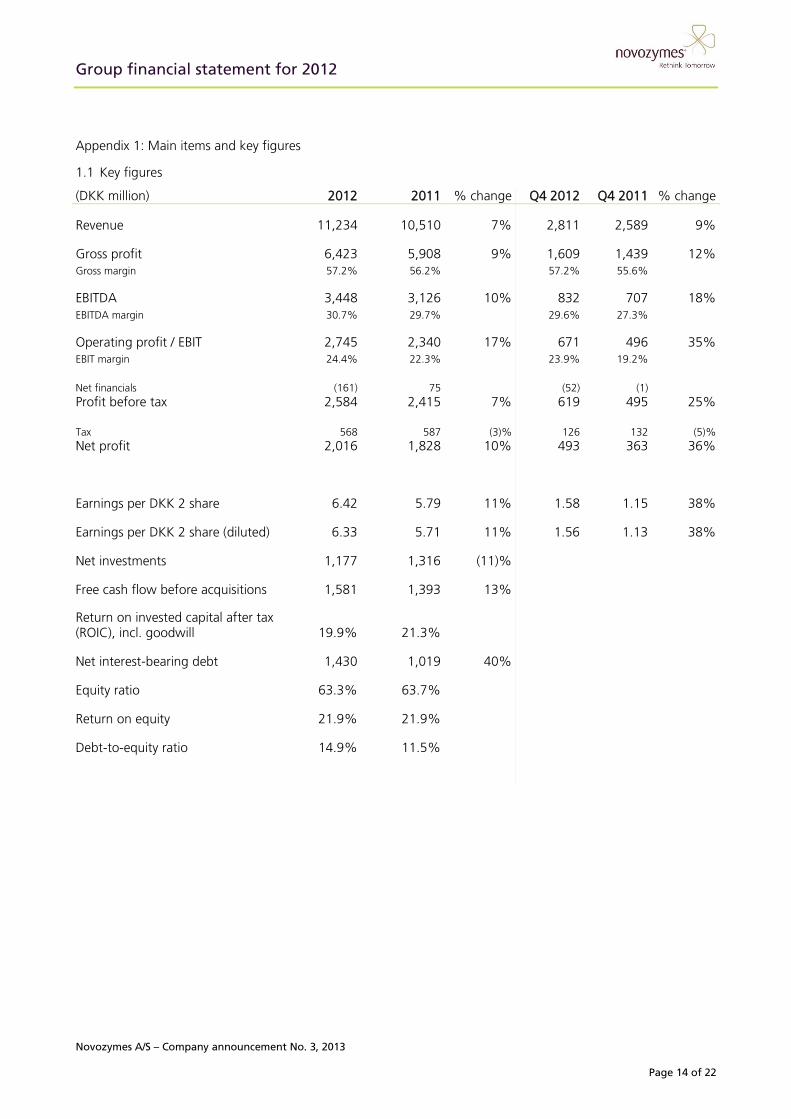
Appendix 1: Main items and key figures
1.1 Key figures
(DKK million) 2012 2011 % change Q4 2012 Q4 2011 % change
Revenue 11,234 10,510 7% 2,811 2,589 9%
Gross profit 6,423 5,908 9% 1,609 1,439 12% Gross margin 57.2% 56.2% 57.2% 55.6%
EBITDA 3,448 3,126 10% 832 707 18% EBITDA margin 30.7% 29.7% 29.6% 27.3%
Operating profit / EBIT 2,745 2,340 17% 671 496 35% EBIT margin 24.4% 22.3% 23.9% 19.2%
Net financials (161) 75 (52) (1) Profit before tax 2,584 2,415 7% 619 495 25%
Tax 568 587 (3)% 126 132 (5)% Net profit 2,016 1,828 10% 493 363 36%
Earnings per DKK 2 share 6.42 5.79 11% 1.58 1.15 38%
Earnings per DKK 2 share (diluted) 6.33 5.71 11% 1.56 1.13 38%
Net investments 1,177 1,316 (11)%
Free cash flow before acquisitions 1,581 1,393 13%
Return on invested capital after tax (ROIC), incl. goodwill 19.9% 21.3%
Net interest-bearing debt 1,430 1,019 40%
Equity ratio 63.3% 63.7%
Return on equity 21.9% 21.9%
Debt-to-equity ratio 14.9% 11.5%
Group financial statement for 2012
Novozymes A/S – Company announcement No. 3, 2013
Page 15 of 22
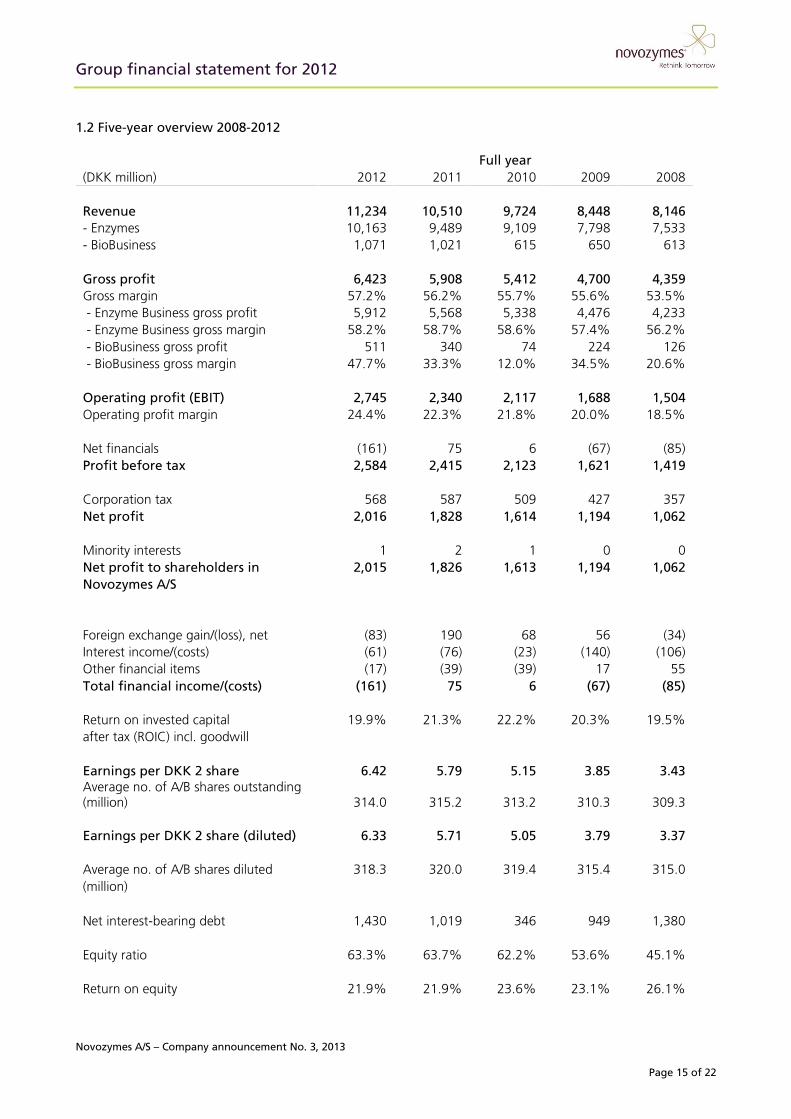
1.2 Five-year overview 2008-2012 Full year (DKK million) 2012 2011 2010 2009 2008 Revenue 11,234 10,510 9,724 8,448 8,146 - Enzymes 10,163 9,489 9,109 7,798 7,533 - BioBusiness 1,071 1,021 615 650 613 Gross profit 6,423 5,908 5,412 4,700 4,359 Gross margin 57.2% 56.2% 55.7% 55.6% 53.5% - Enzyme Business gross profit 5,912 5,568 5,338 4,476 4,233 - Enzyme Business gross margin 58.2% 58.7% 58.6% 57.4% 56.2% - BioBusiness gross profit 511 340 74 224 126 - BioBusiness gross margin 47.7% 33.3% 12.0% 34.5% 20.6% Operating profit (EBIT) 2,745 2,340 2,117 1,688 1,504 Operating profit margin 24.4% 22.3% 21.8% 20.0% 18.5% Net financials (161) 75 6 (67) (85) Profit before tax 2,584 2,415 2,123 1,621 1,419 Corporation tax 568 587 509 427 357 Net profit 2,016 1,828 1,614 1,194 1,062 Minority interests 1 2 1 0 0 Net profit to shareholders in 2,015 1,826 1,613 1,194 1,062 Novozymes A/S Foreign exchange gain/(loss), net (83) 190 68 56 (34) Interest income/(costs) (61) (76) (23) (140) (106) Other financial items (17) (39) (39) 17 55 Total financial income/(costs) (161) 75 6 (67) (85) Return on invested capital 19.9% 21.3% 22.2% 20.3% 19.5% after tax (ROIC) incl. goodwill Earnings per DKK 2 share 6.42 5.79 5.15 3.85 3.43 Average no. of A/B shares outstanding (million) 314.0 315.2 313.2 310.3 309.3 Earnings per DKK 2 share (diluted) 6.33 5.71 5.05 3.79 3.37
Average no. of A/B shares diluted 318.3 320.0 319.4 315.4 315.0 (million) Net interest-bearing debt 1,430 1,019 346 949 1,380 Equity ratio 63.3% 63.7% 62.2% 53.6% 45.1% Return on equity 21.9% 21.9% 23.6% 23.1% 26.1%

Group financial statement for 2012
Novozymes A/S – Company announcement No. 3, 2013
Page 16 of 22
1.3 Income statement
(DKK million) 2012 2011 Q4 2012 Q4 2011
Revenue 11,234 10,510 2,811 2,589 Cost of goods sold 4,811 4,602 1,202 1,150 Gross profit 6,423 5,908 1,609 1,439
Sales and distribution costs 1,421 1,376 357 350 Research and development costs 1,527 1,464 388 392 Administrative costs 808 778 202 197 Other operating income, net 78 50 9 (4) Operating profit / EBIT 2,745 2,340 671 496
Net financials (161) 75 (52) (1) Profit before tax 2,584 2,415 619 495
Tax 568 587 126 (132) Net profit 2,016 1,828 493 363
Attributable to Shareholders in Novozymes A/S 2,015 1,826 493 362 Minority interests 1 2 - 1
Details of net financials Foreign exchange gain/(loss), net (83) 190 (14) 50 Interest income/(costs) (61) (76) (29) (36) Other financial items (17) (39) (9) (15) Net financials (161) 75 (52) (1)
Earnings per DKK 2 share 6.42 5.79 1.58 1.15 Average no. of A/B shares outstanding (million) 314.0 315.2 312.2 314.9
Earnings per DKK 2 share (diluted) 6.33 5.71 1.56 1.13 Average no. of A/B shares, diluted (million) 318.3 320.0 316.2 319.8
1.4 Statement of comprehensive income
(DKK million) 2012 2011 Q4 2012 Q4 2011
Net profit 2,016 1,828 493 363
Other comprehensive income
Currency translation of subsidiaries and minority interests (68)
116 (87) 202 Tax related to hedges of net investments in foreign subsidiaries (2) (6) (2) (6) Cash flow hedges (6) (58) 33 (117) - transferred to Financial income/costs 51 (130) 10 (19) Tax related to cash flow hedges (8) 6 (11) 6 Other comprehensive income (33) (72) (57) 66
Comprehensive income 1,983 1,756 436 429
Attributable to Shareholders in Novozymes A/S 1,982 1,753 436 427 Minority interests 1 3 - 2
Group financial statement for 2012
Novozymes A/S – Company announcement No. 3, 2013
Page 17 of 22
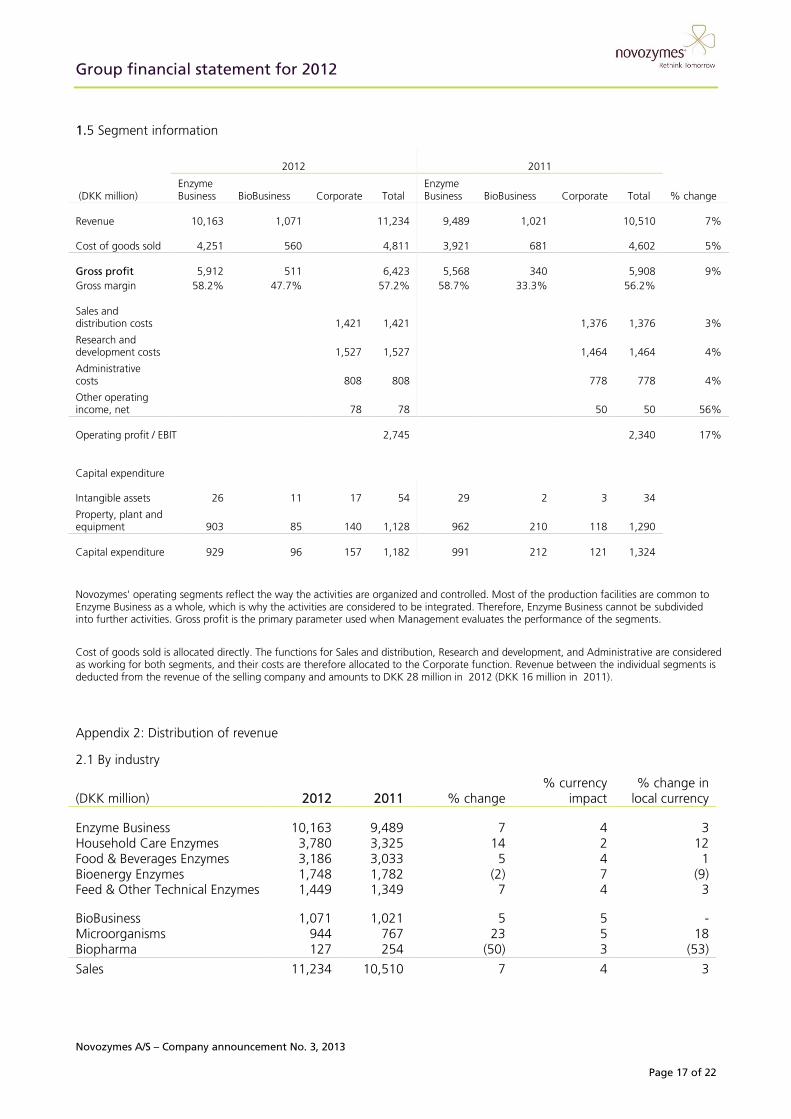
1.5 Segment information
2012 2011
(DKK million) Enzyme Business BioBusiness Corporate Total
Enzyme Business BioBusiness Corporate Total % change
Revenue
10,163 1,071
11,234
9,489 1,021
10,510 7%
Cost of goods sold
4,251 560
4,811
3,921 681
4,602 5%
Gross profit
5,912
511
6,423
5,568
340
5,908
9% Gross margin 58.2% 47.7% 57.2% 58.7% 33.3% 56.2%
Sales and distribution costs
1,421
1,421
1,376
1,376 3%
Research and development costs
1,527
1,527
1,464
1,464 4%
Administrative costs
808
808
778
778 4%
Other operating income, net
78
78
50
50 56%
Operating profit / EBIT
2,745
2,340
17%
Capital expenditure
Intangible assets
26 11
17
54
29 2
3
34
Property, plant and equipment
903 85
140
1,128
962 210
118
1,290
Capital expenditure
929 96
157
1,182
991 212
121
1,324
Novozymes' operating segments reflect the way the activities are organized and controlled. Most of the production facilities are common to Enzyme Business as a whole, which is why the activities are considered to be integrated. Therefore, Enzyme Business cannot be subdivided into further activities. Gross profit is the primary parameter used when Management evaluates the performance of the segments.
Cost of goods sold is allocated directly. The functions for Sales and distribution, Research and development, and Administrative are considered as working for both segments, and their costs are therefore allocated to the Corporate function. Revenue between the individual segments is deducted from the revenue of the selling company and amounts to DKK 28 million in 2012 (DKK 16 million in 2011).
Appendix 2: Distribution of revenue
2.1 By industry
(DKK million) 2012 2011 % change % currency
impact % change in
local currency
Enzyme Business 10,163 9,489 7 4 3 Household Care Enzymes 3,780 3,325 14 2 12 Food & Beverages Enzymes 3,186 3,033 5 4 1 Bioenergy Enzymes 1,748 1,782 (2) 7 (9) Feed & Other Technical Enzymes 1,449 1,349 7 4 3
BioBusiness 1,071 1,021 5 5 - Microorganisms 944 767 23 5 18 Biopharma 127 254 (50) 3 (53)
Sales 11,234 10,510 7 4 3
Group financial statement for 2012
Novozymes A/S – Company announcement No. 3, 2013
Page 18 of 22
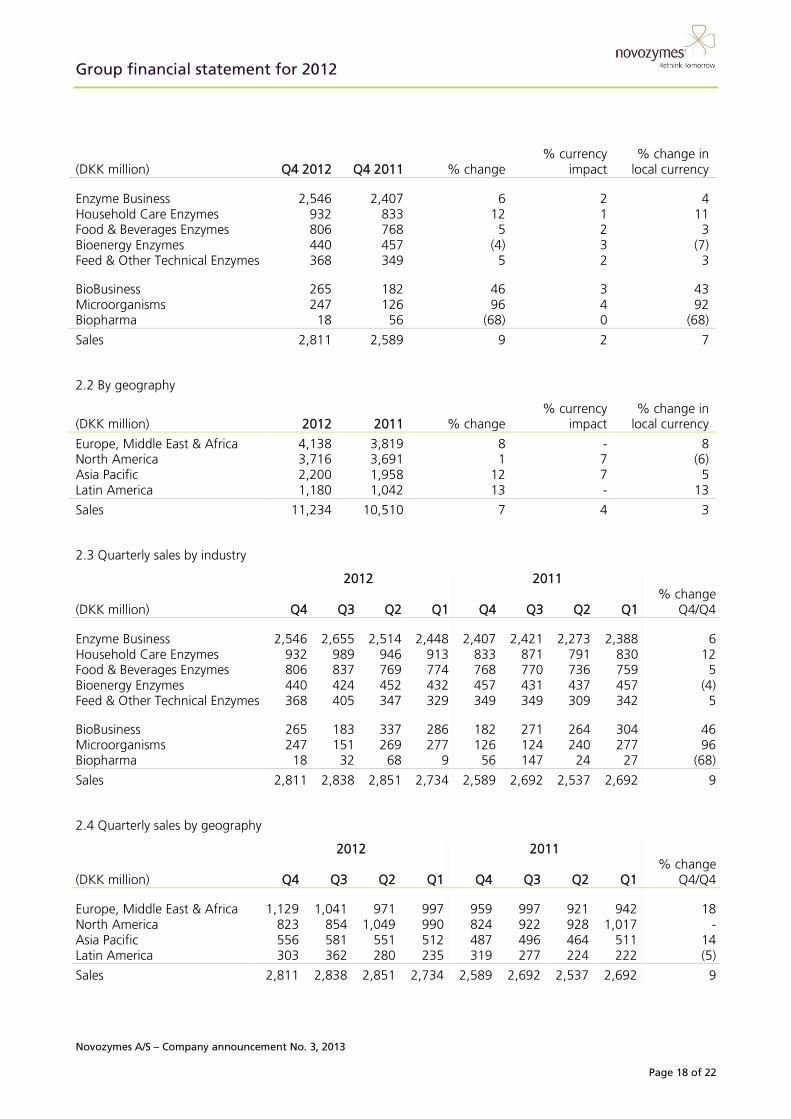
(DKK million) Q4 2012 Q4 2011 % change % currency
impact % change in
local currency
Enzyme Business 2,546 2,407 6 2 4 Household Care Enzymes 932 833 12 1 11 Food & Beverages Enzymes 806 768 5 2 3 Bioenergy Enzymes 440 457 (4) 3 (7) Feed & Other Technical Enzymes 368 349 5 2 3
BioBusiness 265 182 46 3 43 Microorganisms 247 126 96 4 92 Biopharma 18 56 (68) 0 (68)
Sales 2,811 2,589 9 2 7
2.2 By geography
(DKK million) 2012 2011 % change % currency
impact % change in
local currency
Europe, Middle East & Africa 4,138 3,819 8 - 8 North America 3,716 3,691 1 7 (6) Asia Pacific 2,200 1,958 12 7 5 Latin America 1,180 1,042 13 - 13
Sales 11,234 10,510 7 4 3
2.3 Quarterly sales by industry
2012 2011
(DKK million) Q4 Q3 Q2 Q1 Q4 Q3 Q2 Q1 % change
Q4/Q4
Enzyme Business 2,546 2,655 2,514 2,448 2,407 2,421 2,273 2,388 6 Household Care Enzymes 932 989 946 913 833 871 791 830 12 Food & Beverages Enzymes 806 837 769 774 768 770 736 759 5 Bioenergy Enzymes 440 424 452 432 457 431 437 457 (4) Feed & Other Technical Enzymes 368 405 347 329 349 349 309 342 5
BioBusiness 265 183 337 286 182 271 264 304 46 Microorganisms 247 151 269 277 126 124 240 277 96 Biopharma 18 32 68 9 56 147 24 27 (68)
Sales 2,811 2,838 2,851 2,734 2,589 2,692 2,537 2,692 9
2.4 Quarterly sales by geography
2012 2011
(DKK million) Q4 Q3 Q2 Q1 Q4 Q3 Q2 Q1 % change
Q4/Q4
Europe, Middle East & Africa 1,129 1,041 971 997 959 997 921 942 18 North America 823 854 1,049 990 824 922 928 1,017 - Asia Pacific 556 581 551 512 487 496 464 511 14 Latin America 303 362 280 235 319 277 224 222 (5)
Sales 2,811 2,838 2,851 2,734 2,589 2,692 2,537 2,692 9
Group financial statement for 2012
Novozymes A/S – Company announcement No. 3, 2013
Page 19 of 22
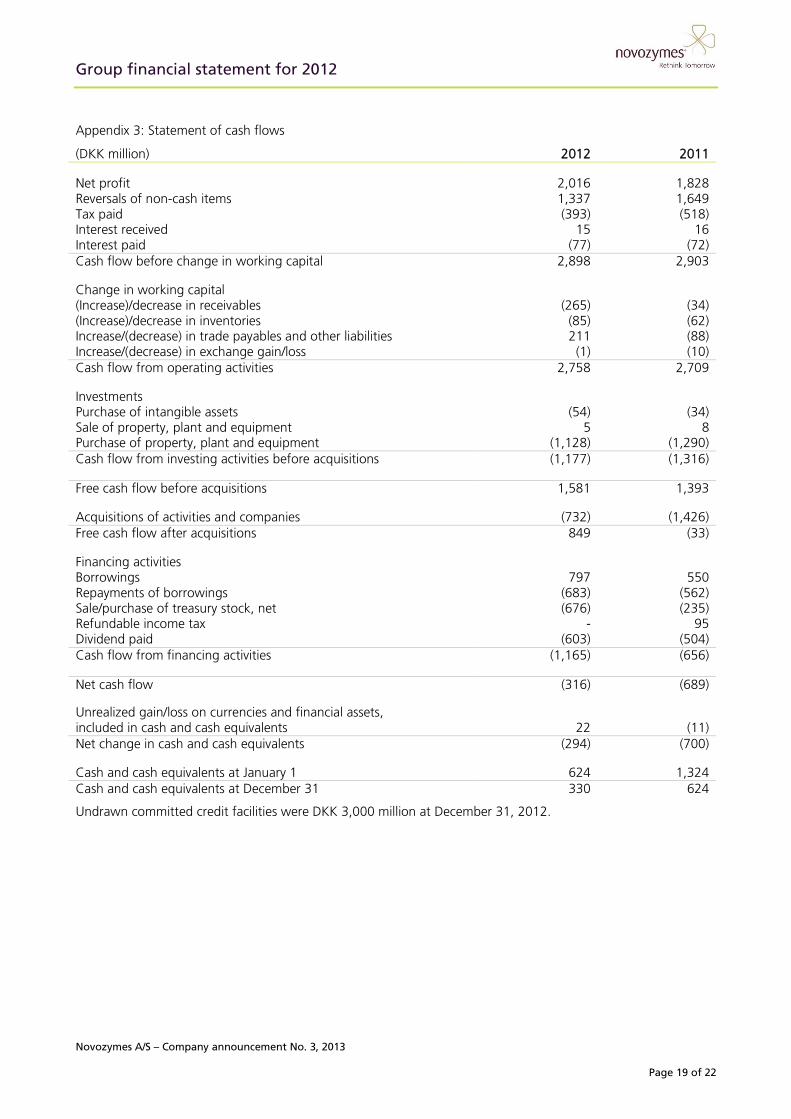
Appendix 3: Statement of cash flows
(DKK million) 2012 2011
Net profit 2,016 1,828 Reversals of non-cash items 1,337 1,649 Tax paid (393) (518) Interest received 15 16 Interest paid (77) (72) Cash flow before change in working capital 2,898 2,903
Change in working capital (Increase)/decrease in receivables (265) (34) (Increase)/decrease in inventories (85) (62) Increase/(decrease) in trade payables and other liabilities 211 (88) Increase/(decrease) in exchange gain/loss (1) (10) Cash flow from operating activities 2,758 2,709
Investments Purchase of intangible assets (54) (34) Sale of property, plant and equipment 5 8 Purchase of property, plant and equipment (1,128) (1,290) Cash flow from investing activities before acquisitions (1,177) (1,316)
Free cash flow before acquisitions 1,581 1,393
Acquisitions of activities and companies (732) (1,426) Free cash flow after acquisitions 849 (33)
Financing activities Borrowings 797 550 Repayments of borrowings (683) (562) Sale/purchase of treasury stock, net (676) (235) Refundable income tax - 95 Dividend paid (603) (504) Cash flow from financing activities (1,165) (656)
Net cash flow (316) (689)
Unrealized gain/loss on currencies and financial assets, included in cash and cash equivalents 22 (11) Net change in cash and cash equivalents (294) (700)
Cash and cash equivalents at January 1 624 1,324 Cash and cash equivalents at December 31 330 624
Undrawn committed credit facilities were DKK 3,000 million at December 31, 2012.
Group financial statement for 2012
Novozymes A/S – Company announcement No. 3, 2013
Page 20 of 22
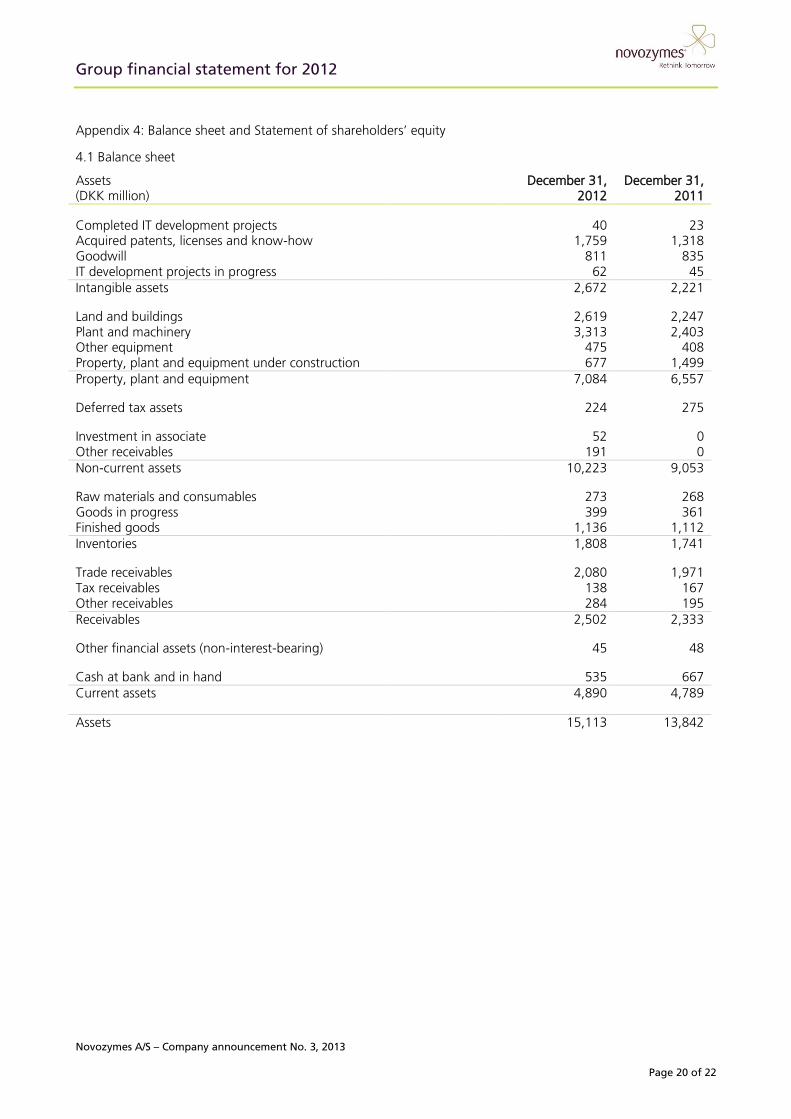
Appendix 4: Balance sheet and Statement of shareholders’ equity
4.1 Balance sheet
Assets (DKK million)
December 31, 2012
December 31, 2011
Completed IT development projects 40 23 Acquired patents, licenses and know-how 1,759 1,318 Goodwill 811 835 IT development projects in progress 62 45 Intangible assets 2,672 2,221
Land and buildings 2,619 2,247 Plant and machinery 3,313 2,403 Other equipment 475 408 Property, plant and equipment under construction 677 1,499 Property, plant and equipment 7,084 6,557
Deferred tax assets 224 275
Investment in associate 52 0 Other receivables 191 0 Non-current assets 10,223 9,053
Raw materials and consumables 273 268 Goods in progress 399 361 Finished goods 1,136 1,112 Inventories 1,808 1,741
Trade receivables 2,080 1,971 Tax receivables 138 167 Other receivables 284 195 Receivables 2,502 2,333
Other financial assets (non-interest-bearing) 45 48
Cash at bank and in hand 535 667 Current assets 4,890 4,789
Assets 15,113 13,842
Group financial statement for 2012
Novozymes A/S – Company announcement No. 3, 2013
Page 21 of 22
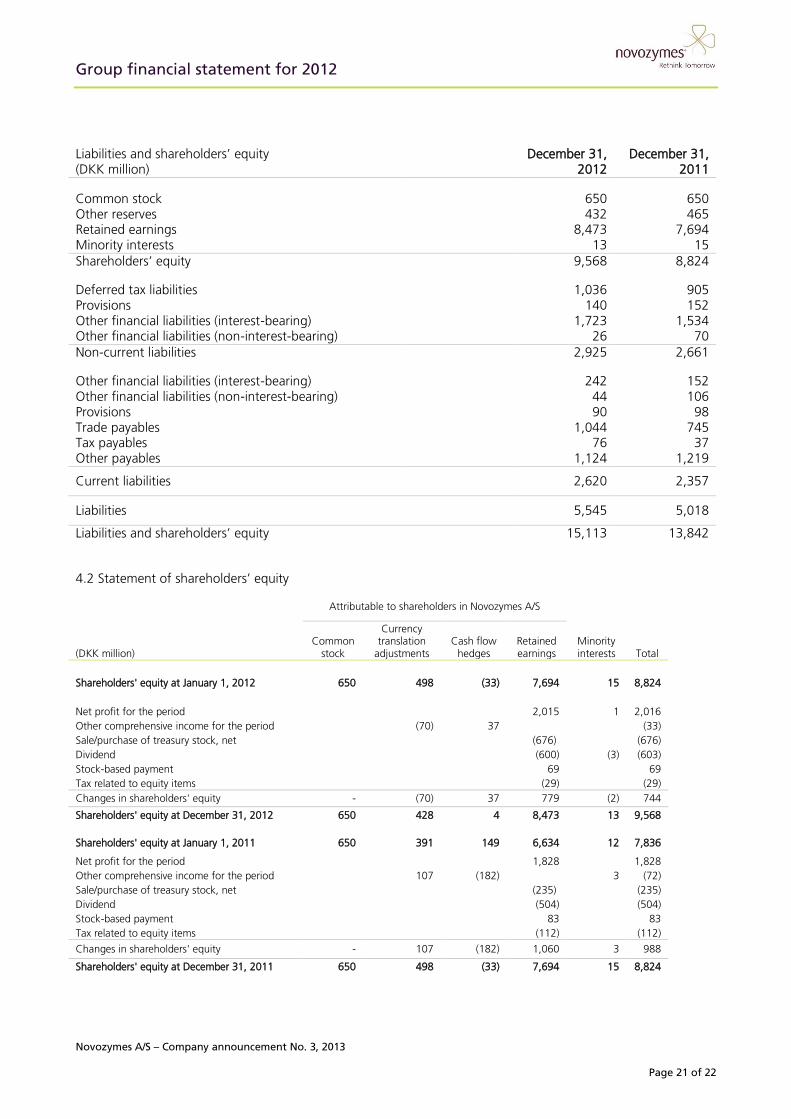
Liabilities and shareholders’ equity (DKK million)
December 31, 2012
December 31, 2011
Common stock 650 650 Other reserves 432 465 Retained earnings 8,473 7,694 Minority interests 13 15 Shareholders’ equity 9,568 8,824
Deferred tax liabilities 1,036 905 Provisions 140 152 Other financial liabilities (interest-bearing) 1,723 1,534 Other financial liabilities (non-interest-bearing) 26 70 Non-current liabilities 2,925 2,661
Other financial liabilities (interest-bearing) 242 152 Other financial liabilities (non-interest-bearing) 44 106 Provisions 90 98 Trade payables 1,044 745 Tax payables 76 37 Other payables 1,124 1,219
Current liabilities 2,620 2,357
Liabilities 5,545 5,018
Liabilities and shareholders’ equity 15,113 13,842
4.2 Statement of shareholders’ equity
Attributable to shareholders in Novozymes A/S
(DKK million) Common
stock
Currency translation
adjustments Cash flow
hedges Retained earnings
Minority interests Total
Shareholders' equity at January 1, 2012
650
498 (33)
7,694
15
8,824
Net profit for the period 2,015 1 2,016 Other comprehensive income for the period (70) 37 (33) Sale/purchase of treasury stock, net (676) (676) Dividend (600) (3) (603) Stock-based payment 69 69 Tax related to equity items (29) (29) Changes in shareholders' equity - (70) 37 779 (2) 744
Shareholders' equity at December 31, 2012 650 428 4 8,473 13 9,568
Shareholders' equity at January 1, 2011 650 391 149 6,634 12 7,836
Net profit for the period 1,828 1,828 Other comprehensive income for the period 107 (182) 3 (72) Sale/purchase of treasury stock, net (235) (235) Dividend (504) (504) Stock-based payment 83 83 Tax related to equity items (112) (112)
Changes in shareholders' equity - 107 (182) 1,060 3 988
Shareholders' equity at December 31, 2011 650 498 (33) 7,694 15 8,824
Group financial statement for 2012
Novozymes A/S – Company announcement No. 3, 2013
Page 22 of 22
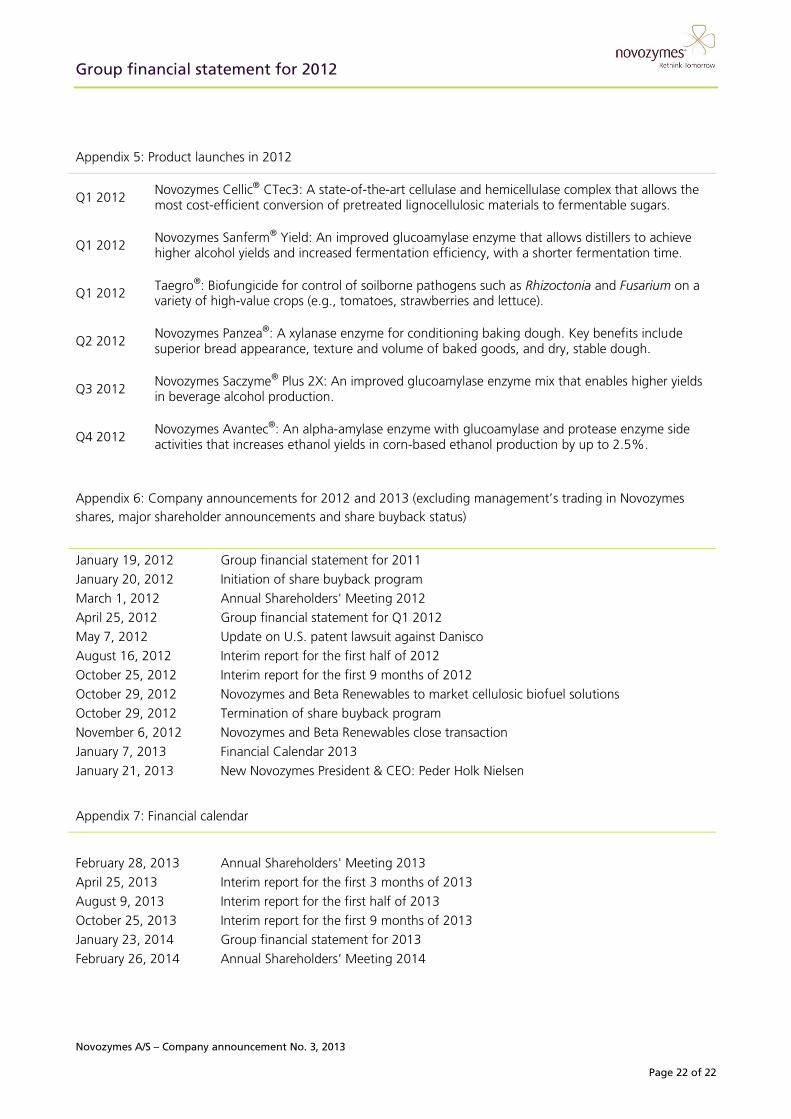
Appendix 5: Product launches in 2012
Q1 2012 Novozymes Cellic® CTec3: A state-of-the-art cellulase and hemicellulase complex that allows the most cost-efficient conversion of pretreated lignocellulosic materials to fermentable sugars.
Q1 2012 Novozymes Sanferm® Yield: An improved glucoamylase enzyme that allows distillers to achieve higher alcohol yields and increased fermentation efficiency, with a shorter fermentation time.
Q1 2012 Taegro®: Biofungicide for control of soilborne pathogens such as Rhizoctonia and Fusarium on a variety of high-value crops (e.g., tomatoes, strawberries and lettuce).
Q2 2012 Novozymes Panzea®: A xylanase enzyme for conditioning baking dough. Key benefits include superior bread appearance, texture and volume of baked goods, and dry, stable dough.
Q3 2012 Novozymes Saczyme® Plus 2X: An improved glucoamylase enzyme mix that enables higher yields in beverage alcohol production.
Q4 2012 Novozymes Avantec®: An alpha-amylase enzyme with glucoamylase and protease enzyme side activities that increases ethanol yields in corn-based ethanol production by up to 2.5%.
Appendix 6: Company announcements for 2012 and 2013 (excluding management’s trading in Novozymes shares, major shareholder announcements and share buyback status)
January 19, 2012 Group financial statement for 2011 January 20, 2012 Initiation of share buyback program March 1, 2012 Annual Shareholders' Meeting 2012 April 25, 2012 Group financial statement for Q1 2012 May 7, 2012 Update on U.S. patent lawsuit against Danisco August 16, 2012 Interim report for the first half of 2012 October 25, 2012 Interim report for the first 9 months of 2012 October 29, 2012 Novozymes and Beta Renewables to market cellulosic biofuel solutions October 29, 2012 Termination of share buyback program November 6, 2012 Novozymes and Beta Renewables close transaction January 7, 2013 Financial Calendar 2013 January 21, 2013 New Novozymes President & CEO: Peder Holk Nielsen
Appendix 7: Financial calendar
February 28, 2013 Annual Shareholders' Meeting 2013 April 25, 2013 Interim report for the first 3 months of 2013 August 9, 2013 Interim report for the first half of 2013 October 25, 2013 Interim report for the first 9 months of 2013 January 23, 2014 Group financial statement for 2013 February 26, 2014 Annual Shareholders’ Meeting 2014